

Unmet Health Care Needs of the Older Population in European Countries Based on Indicators Available in the Eurostat Database


Abstract
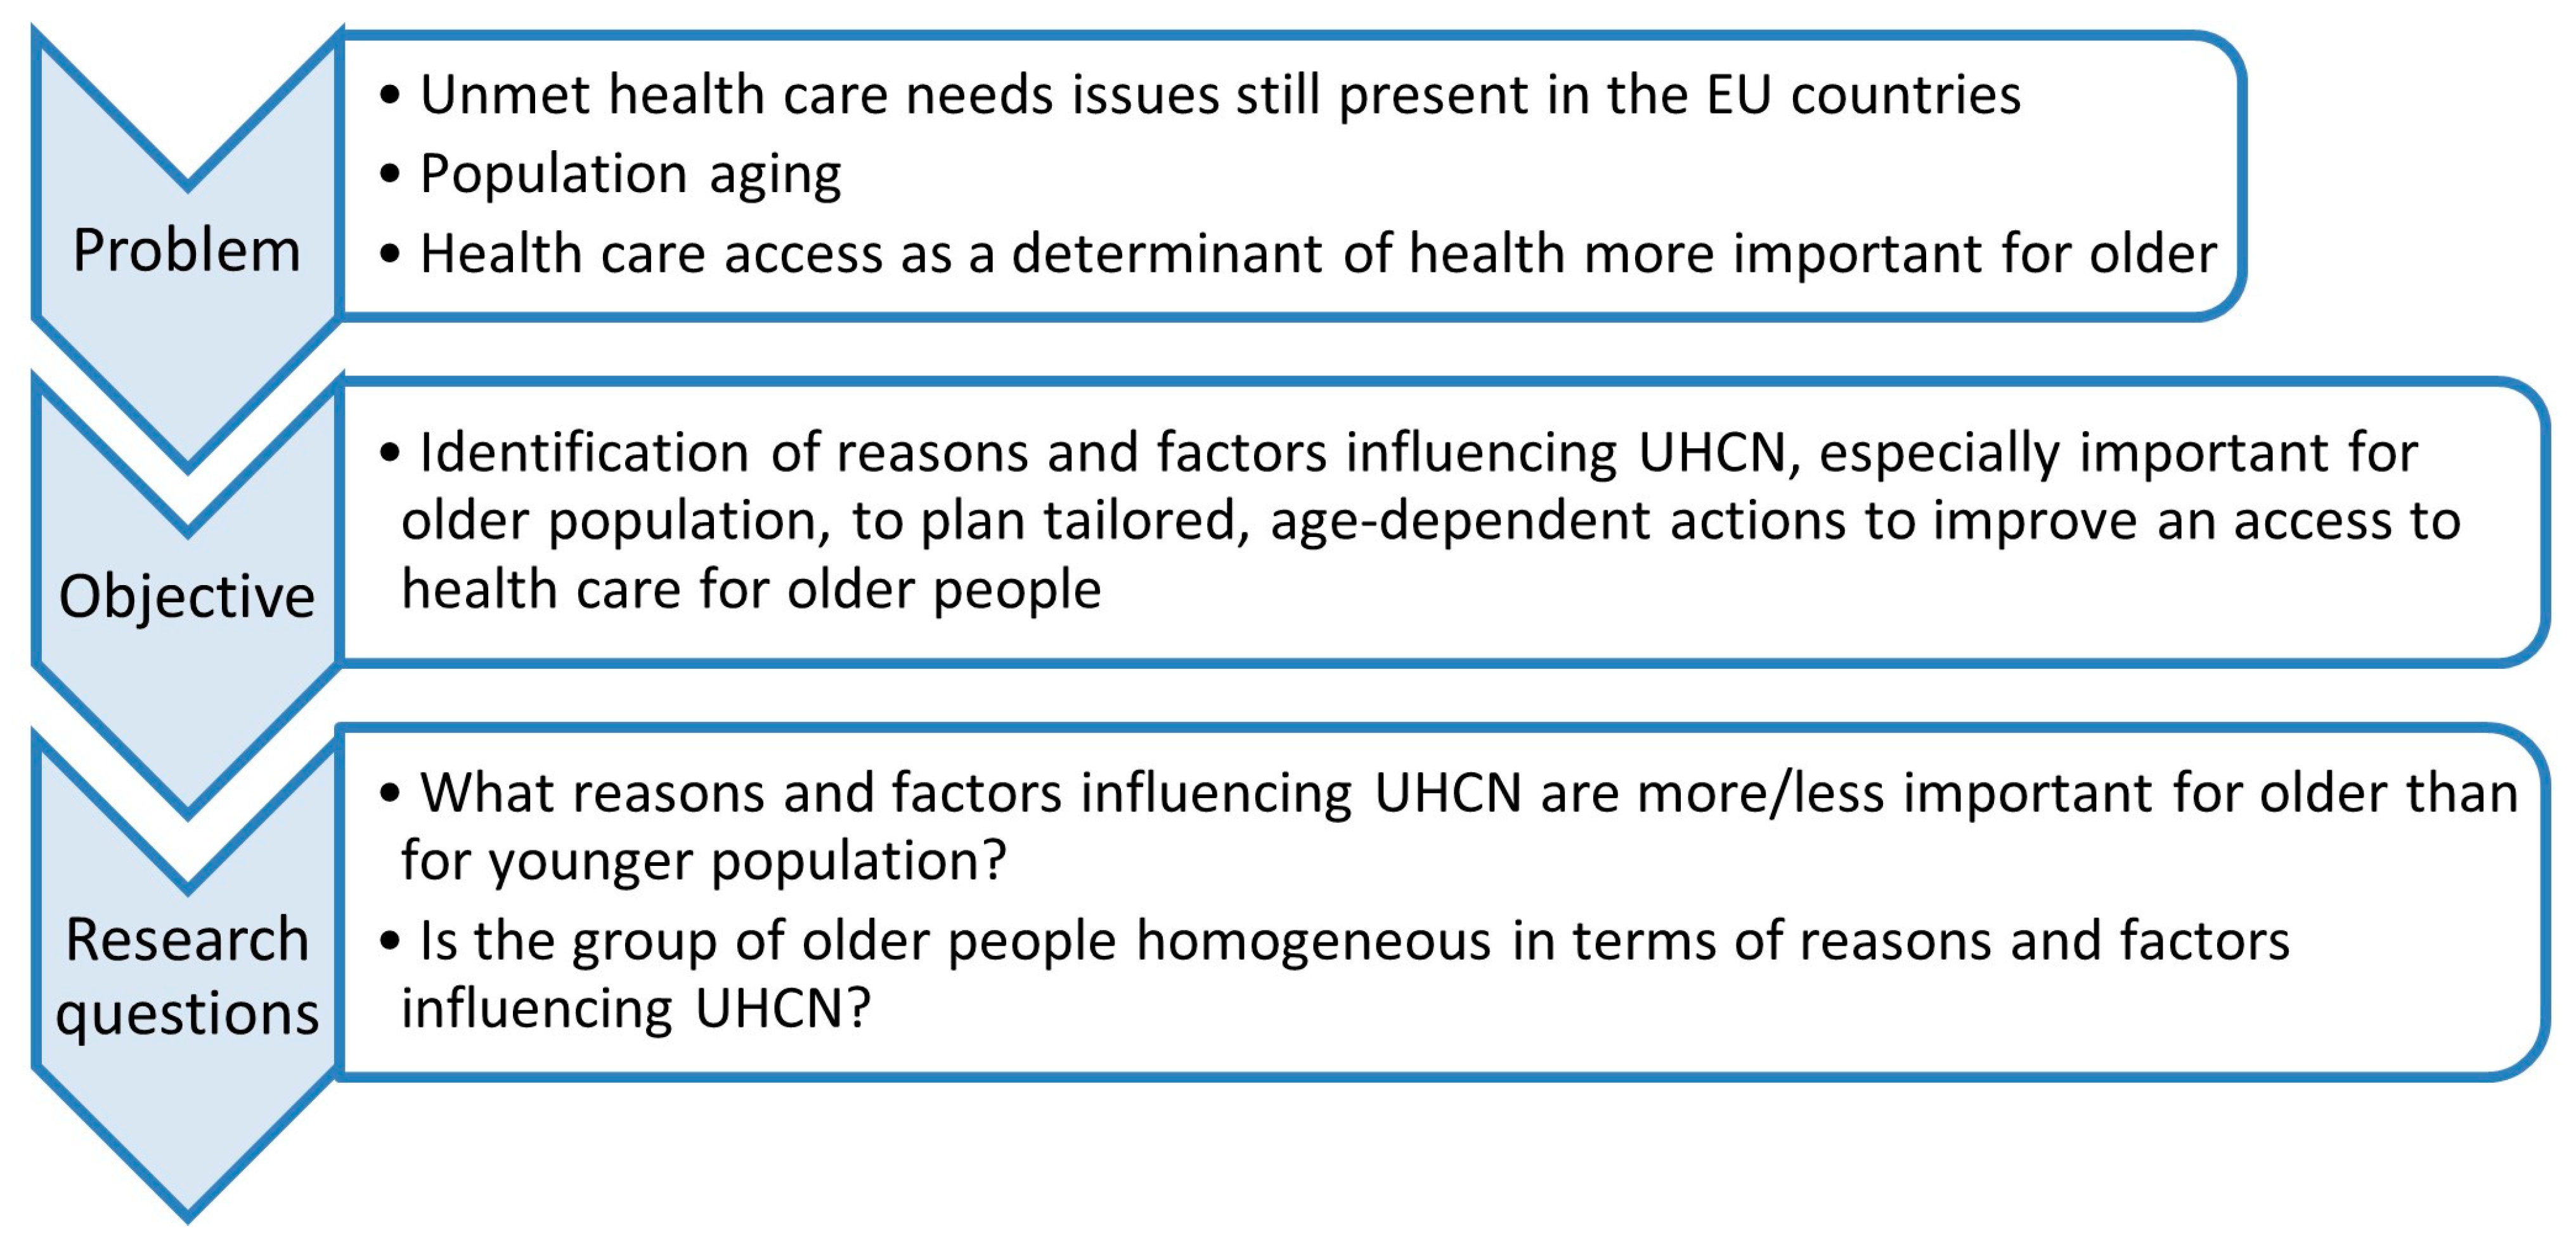
:1. Introduction
2. Materials and Methods
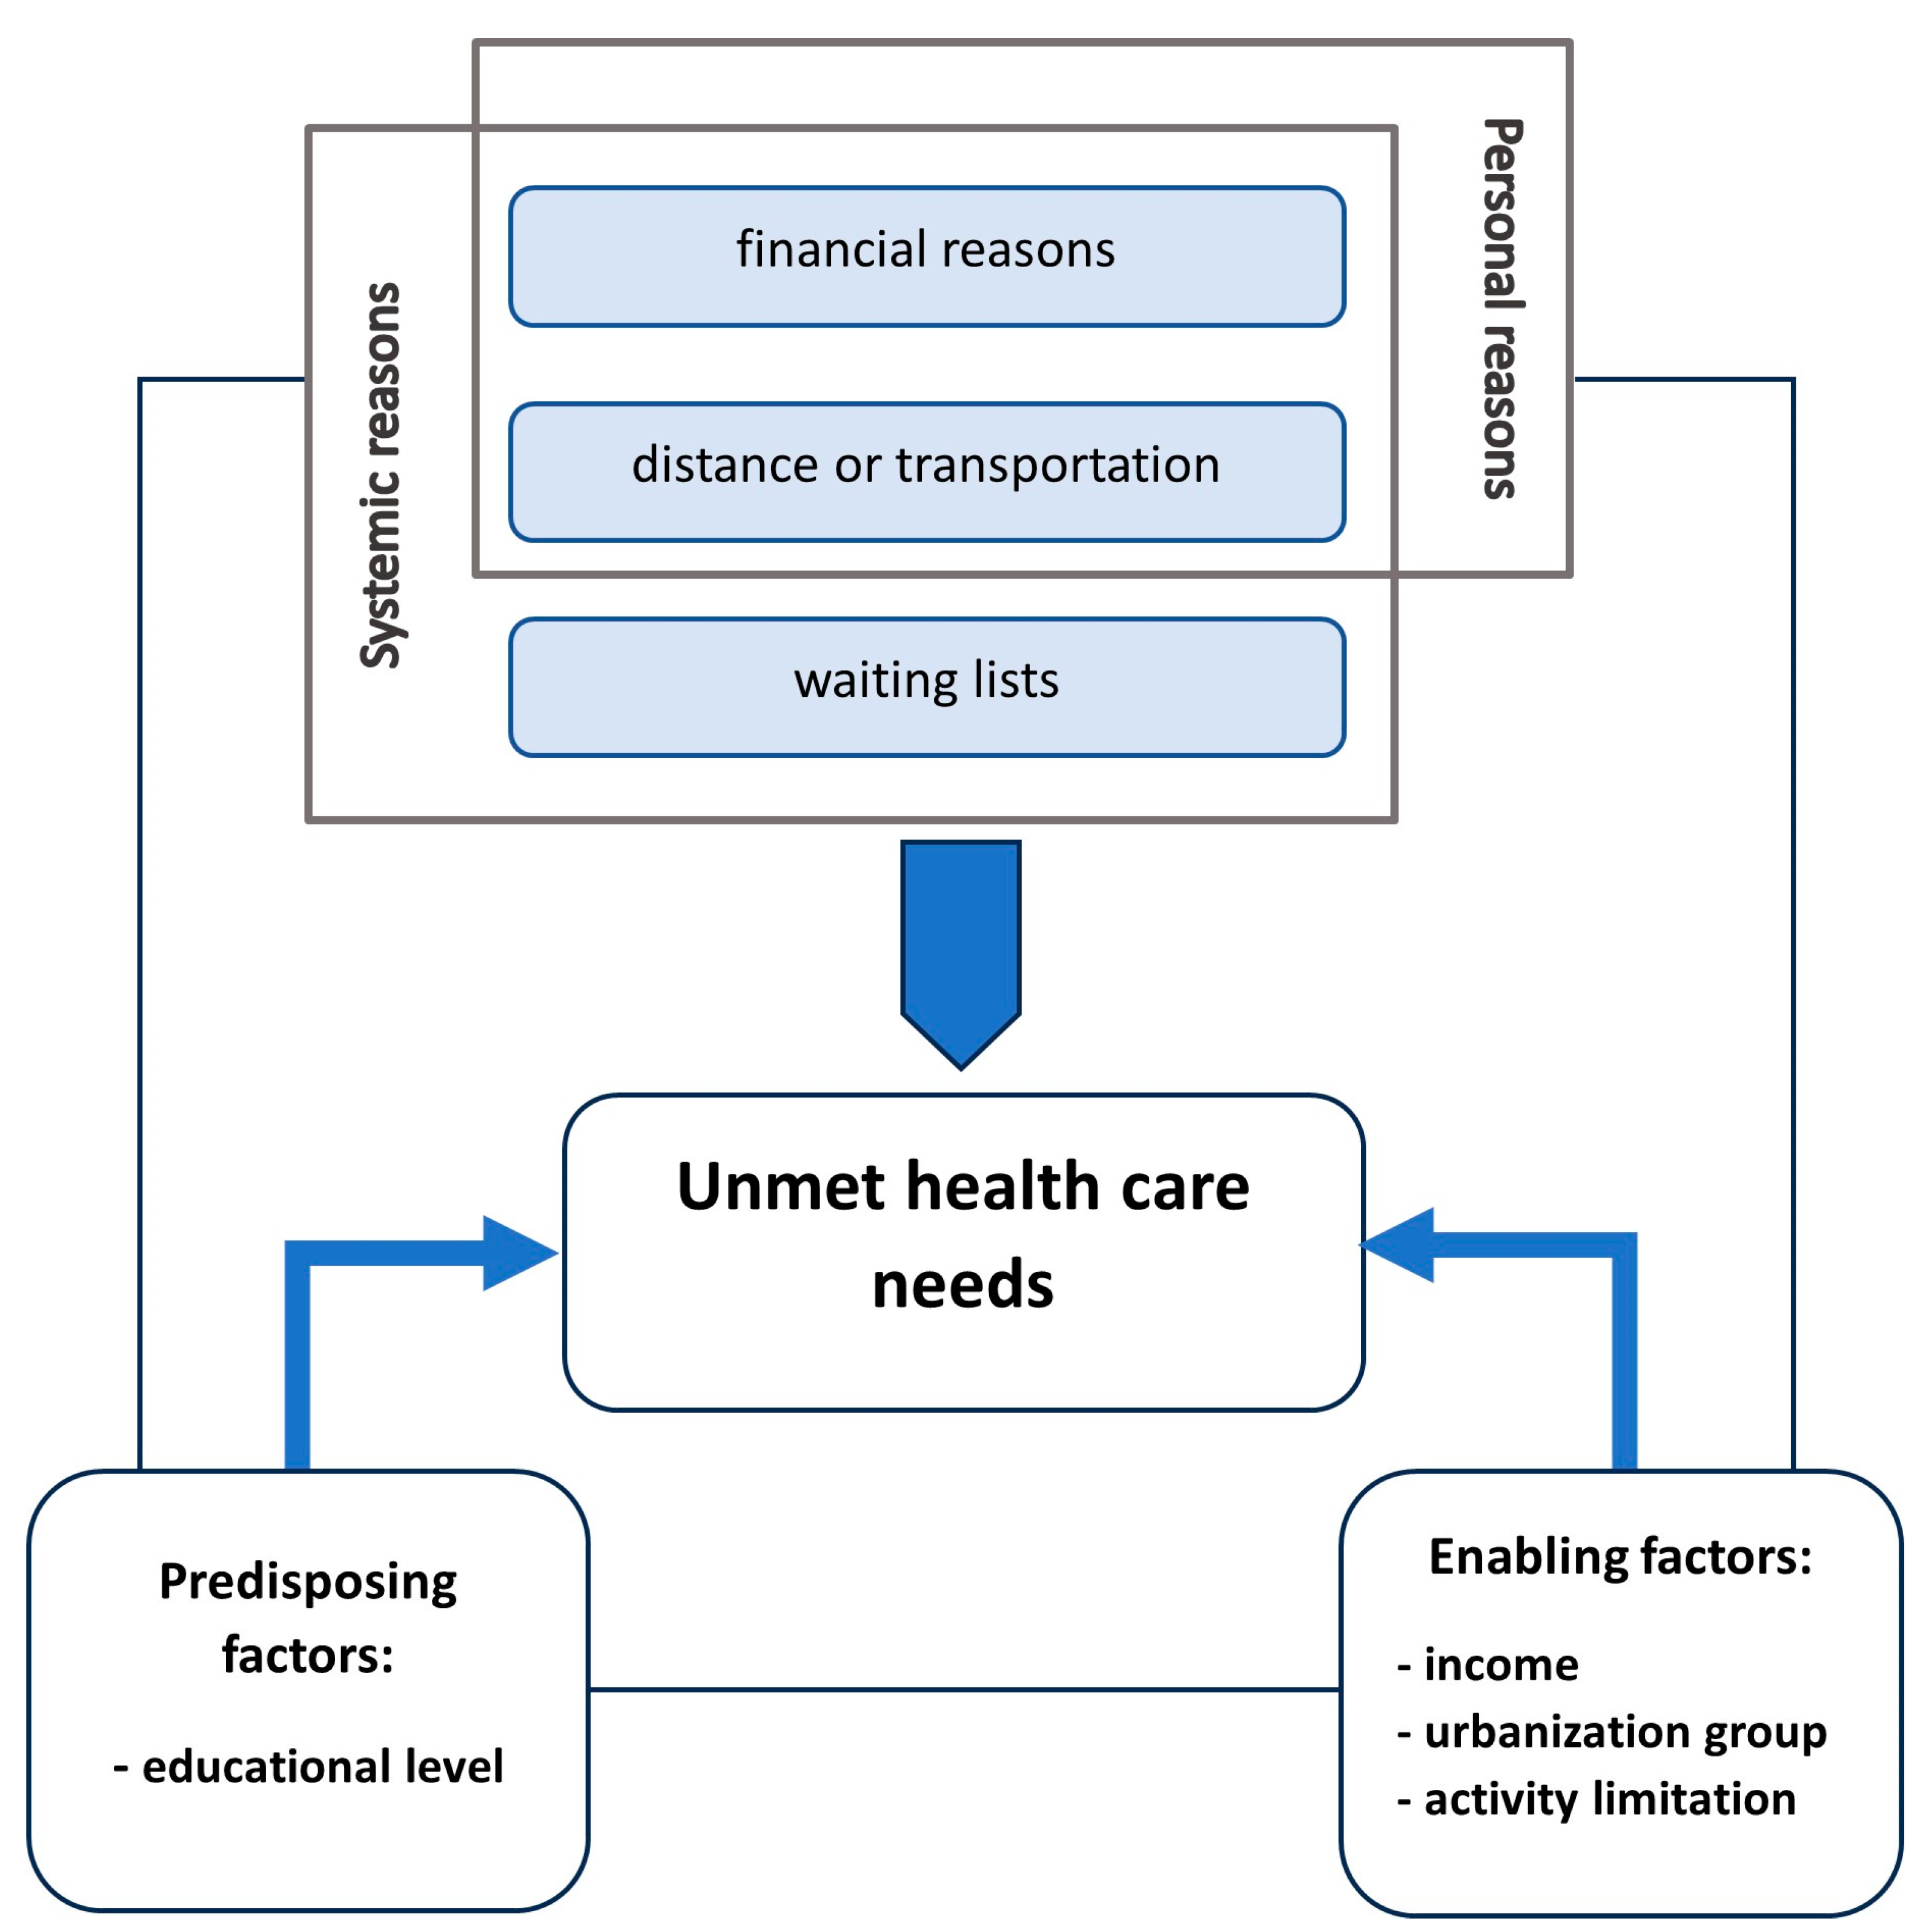
2.1. Framework of the Study
2.2. Materials
2.3. Methods
- (1)
- The share of people reporting a given reason of UHCN, calculated for each age group and country as follows:where r—UHCN reason; c—country; a—age group.
- (2)
- The range of UHCN indicator values for income groups/educational levels/urbanization groups/activity limitation levels, for each age group and country, calculated as follows (exemplary for income groups):where Ic,a is a set of five quintile income groups for a country c and age group a.
3. Results
3.1. UHCN by Countries and Age Groups
3.2. UHCN by Age and Reason
3.3. UHCN by Predisposing Factor
3.4. UHCN by Enabling Factors
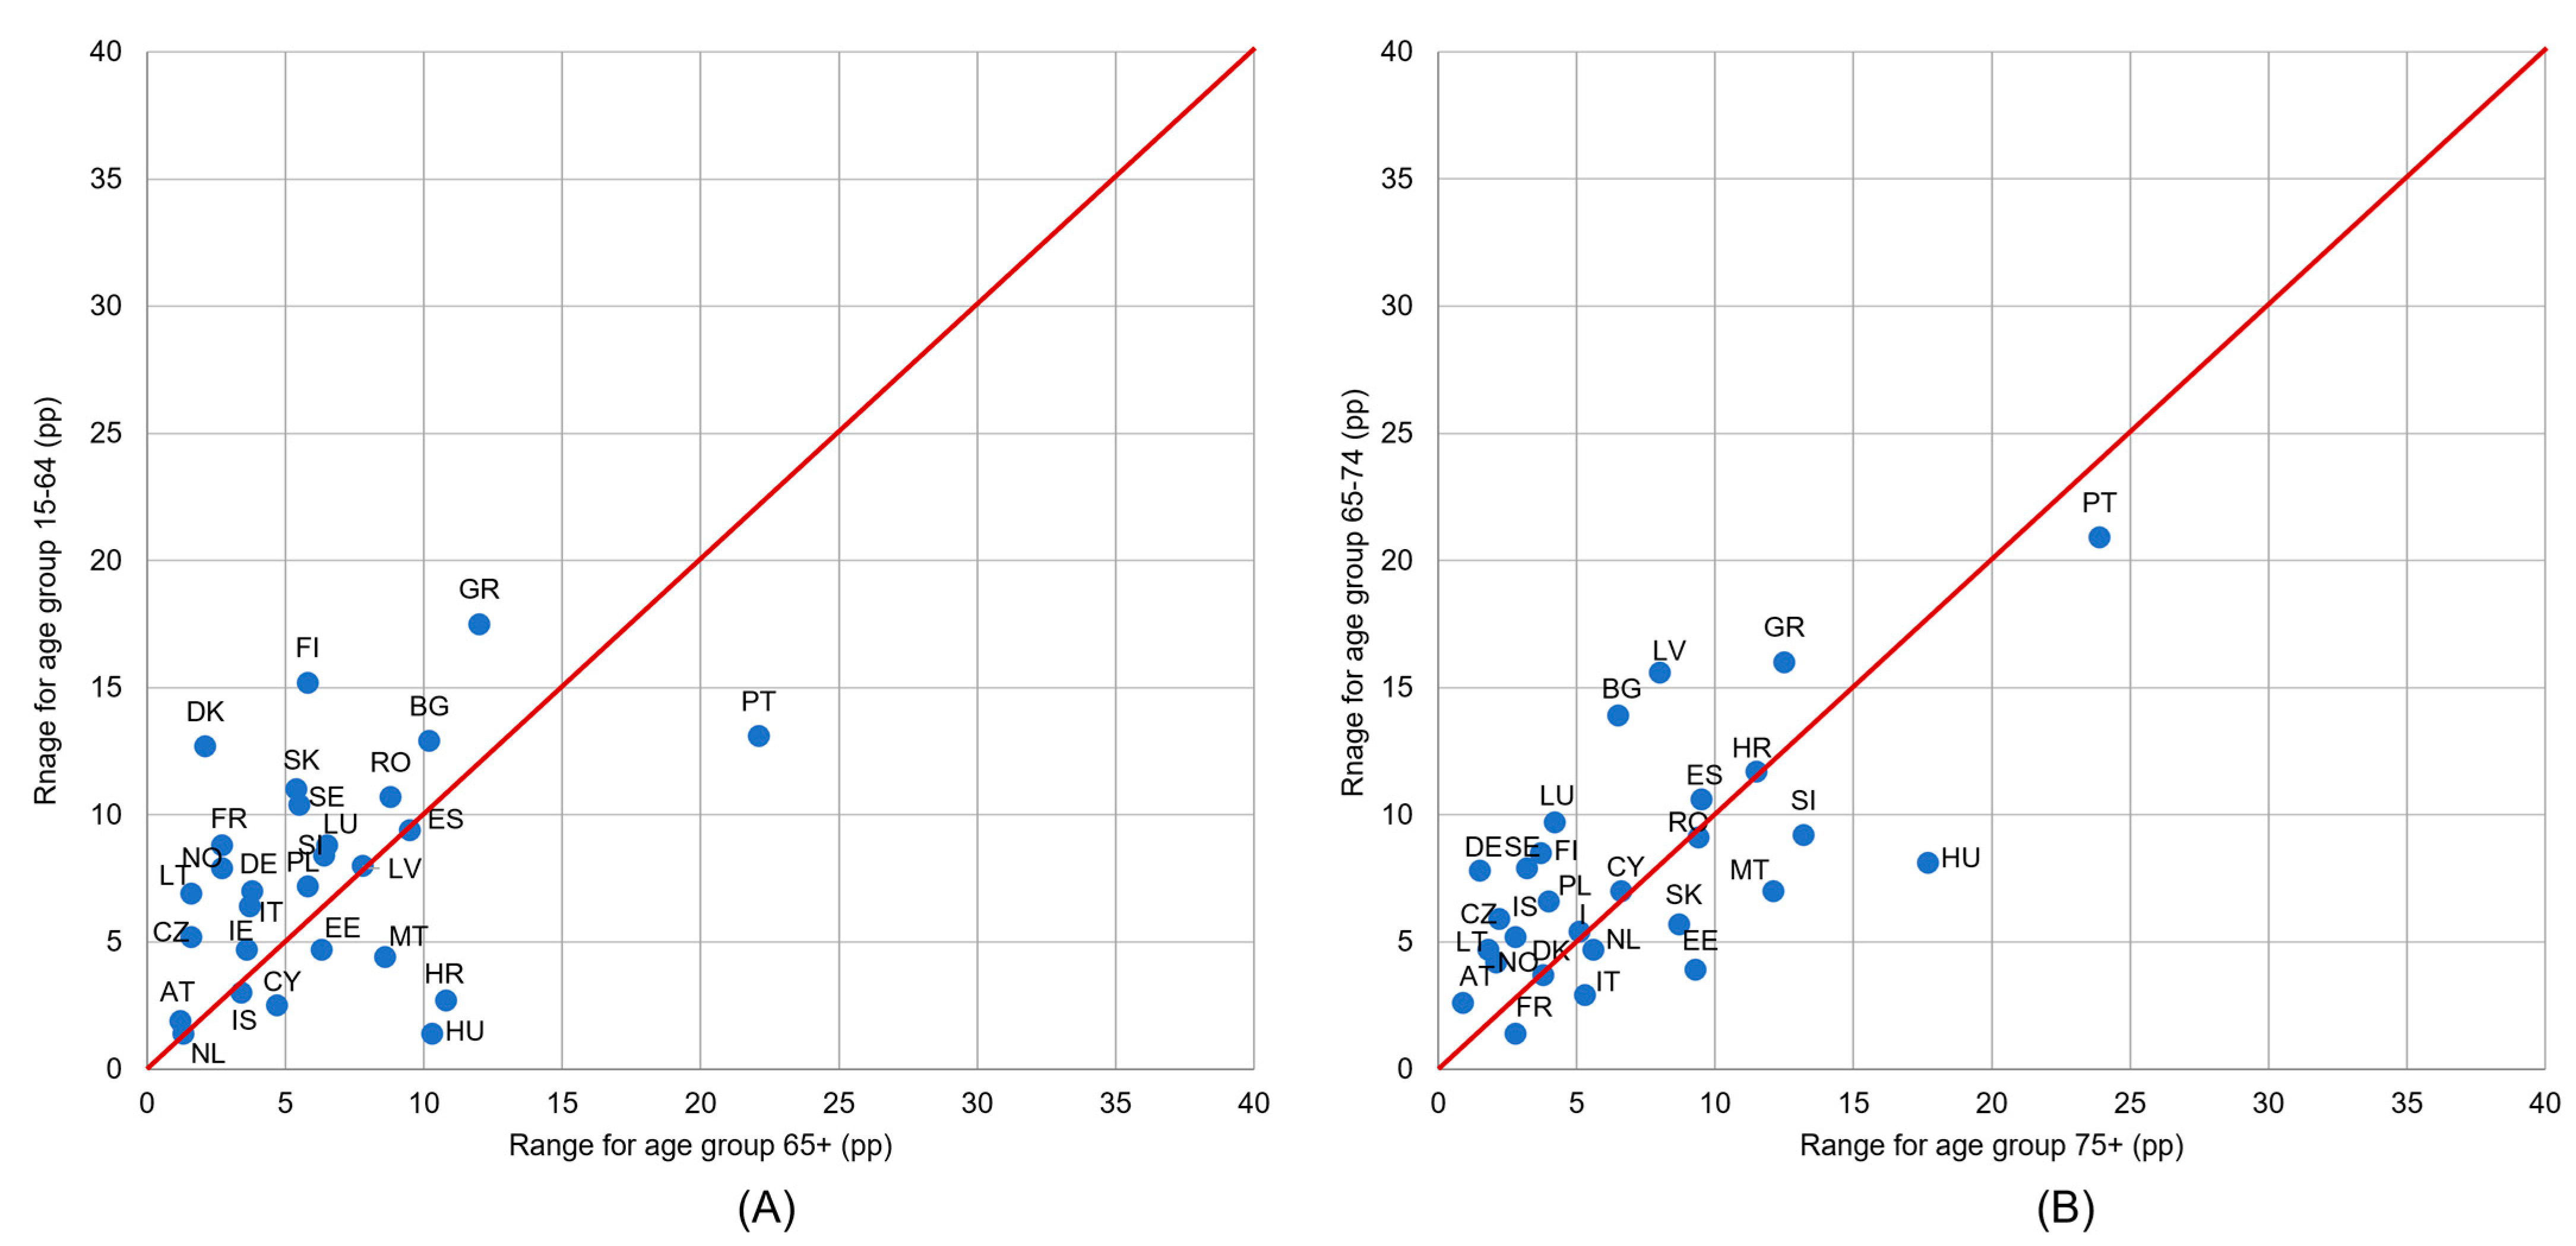
3.4.1. Income Groups
3.4.2. Urbanization Groups
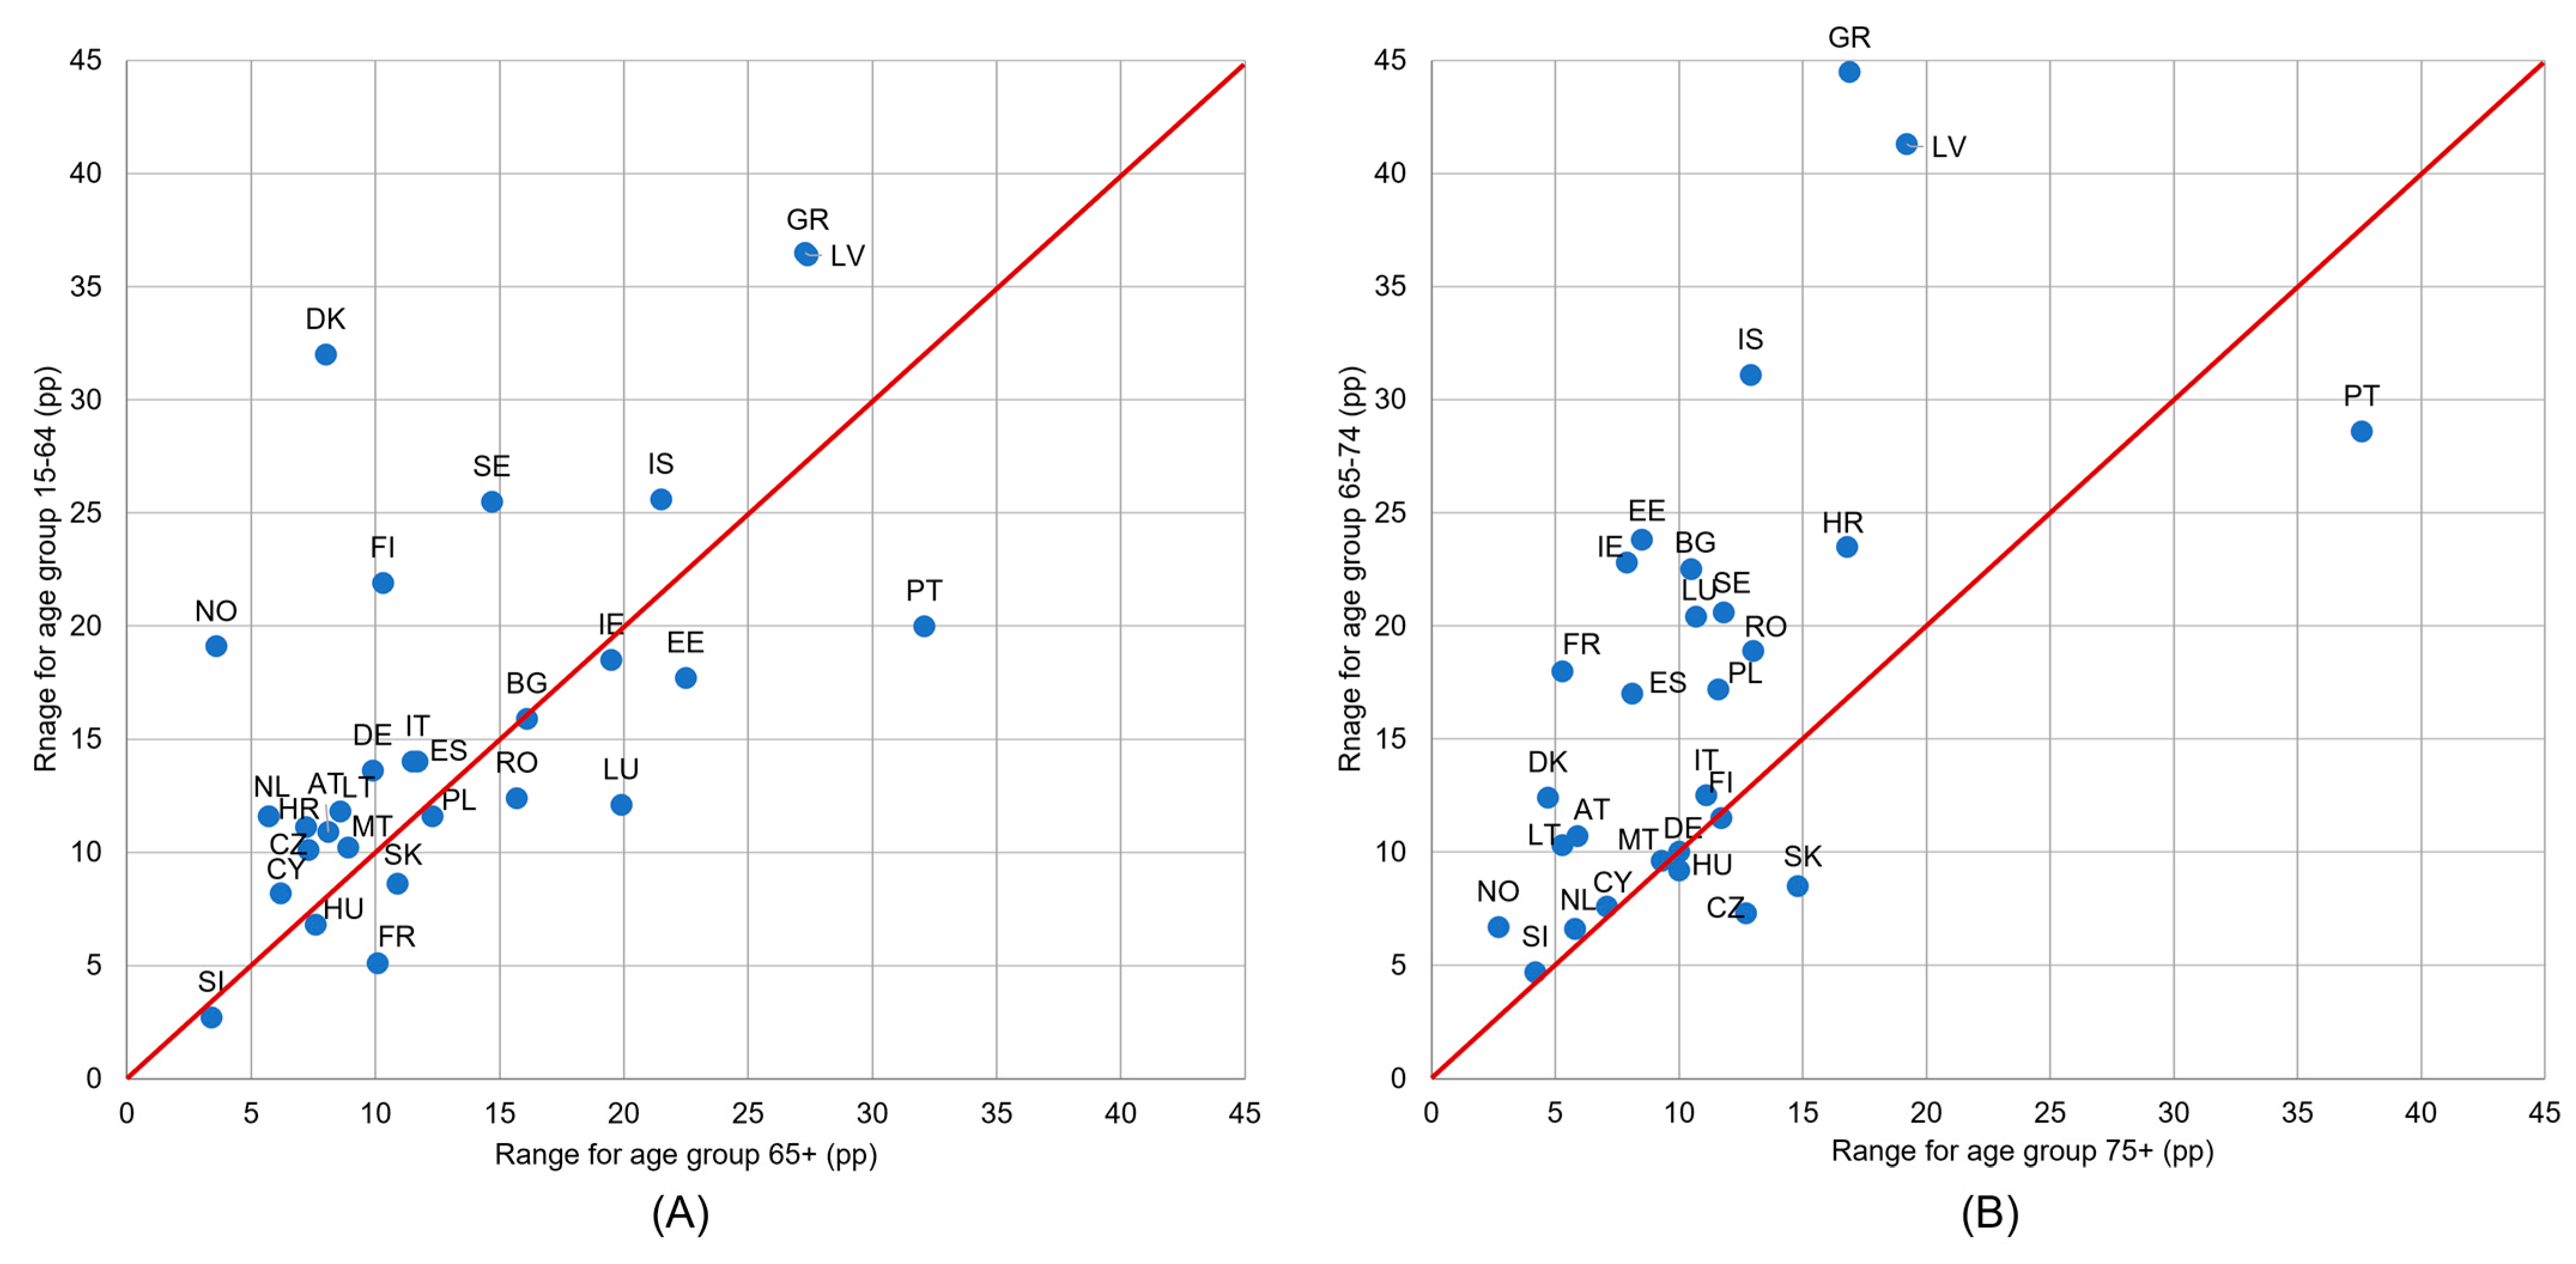
3.4.3. Activity Limitations
4. Discussion
4.1. Reasons of UHCN
4.2. UHCN Prevalence Association with Predisposing Factors
4.3. UHCN Prevalence Association with Enabling Factors
4.4. Study Limitations
4.5. Implications of the Study
4.5.1. Implications for Decisions-Makers
4.5.2. Implications for Researchers
5. Conclusions
Supplementary Materials
Funding
Institutional Review Board Statement
Informed Consent Statement
Data Availability Statement
Conflicts of Interest
References
- World Health Organization. Integrated Care for Older People. Realigning primary health care to respond to population ageing. Tech. Ser. Prim. Health Care 2018, 1, 24. [Google Scholar]
- Lawrence, R. Understanding Environmental Quality Through Quality of Life (QOL) Studies. Landsc. Urban Plan. 2003, 65, 73–83. [Google Scholar] [CrossRef]
- Magnan, S. Social Determinants of Health 101 for Health Care: Five Plus Five. NAM Perspect. 2017, 7. [Google Scholar] [CrossRef]
- Hood, C.M.; Gennuso, K.P.; Swain, G.R.; Catlin, B.B. County Health Rankings: Relationships between Determinant Factors and Health Outcomes. Am. J. Prev. Med. 2016, 50, 129–135. [Google Scholar] [CrossRef]
- Remington, P.L.; Catlin, B.B.; Gennuso, K.P. The County Health Rankings: Rationale and methods. Popul. Health Metr. 2015, 13, 11. [Google Scholar] [CrossRef]
- Eurostat. Population and Social Condition Database. Available online: https://ec.europa.eu/eurostat/en/web/main/data/database (accessed on 30 April 2023).
- Golinowska, S. (Ed.) Od Ekonomii do Ekonomiki Zdrowia: Podręcznik Ekonomiki Zdrowia (Health Economics: From Economics to HeaLTlth Economics); PWN: Warszawa, Poland, 2015. [Google Scholar]
- Carroll, C.; Sworn, K.; Booth, A.; Tsuchiya, A.; Maden, M.; Rosenberg, M. Equity in healthcare access and service coverage for older people: A scoping review of the conceptual literature. Integr. Health J. 2022, 4, e000092. [Google Scholar] [CrossRef]
- Aragon, M.J.A.; Chalkley, M.; Goddard, M. Defining and Measuring Unmet Need to Guide Healthcare Funding: Identifying and Filling the Gaps; Centre for Health Economics, University of York: York, UK, 2017. [Google Scholar]
- Sibley, L.M.; Glazier, R.H. Reasons for self-reported unmet healthcare needs in Canada: A population-based provincial comparison. Health Policy 2009, 5, 87–101. [Google Scholar] [CrossRef]
- Allin, S.; Grignon, M.; Le Grand, J. Subjective unmet need and utilization of health care services in Canada: What are the equity implications? Soc. Sci. Med. 2010, 70, 465–472. [Google Scholar] [CrossRef]
- Allan, I.; Ammi, M. Evolution of the determinants of unmet health care needs in a universal health care system: Canada, 2001–2014. Health Econ. Policy Law 2020, 16, 400–423. [Google Scholar] [CrossRef]
- Allin, S.; Masseria, C. Unmeet need as an indicator of health care access. Eurohealth 2009, 15, 7–9. [Google Scholar]
- Eurostat. Unmet Health Care Needs Statistics. Available online: https://ec.europa.eu/eurostat/statistics-explained/index.php?title=Unmet_health_care_needs_statistics (accessed on 30 April 2023).
- OECD/European Union. Health at a Glance: Europe 2020 State of Health in the EU Cycle; OECD Publishing: Paris, France, 2020. [Google Scholar]
- Smith, S.; Connolly, S. Re-thinking unmet need for health care: Introducing a dynamic perspective. Health Econ. Policy Law 2019, 15, 440–457. [Google Scholar] [CrossRef]
- Ramos, L.M.; Quintal, C.; Lourenço, Ó.; Antunes, M. Unmet needs across Europe: Disclosing knowledge beyond the ordinary measure. Health Policy 2019, 123, 1155–1162. [Google Scholar] [CrossRef]
- Chaupain-Guillot, S.; Guillot, O. Health system characteristics and unmet care needs in Europe: An analysis based on EU-SILC data. Eur. J. Health Econ. 2014, 16, 781–796. [Google Scholar] [CrossRef]
- Detollenaere, J.; Hanssens, L.; Vyncke, V.; De Maeseneer, J.; Willems, S. Do We Reap What We Sow? Exploring the Association between the Strength of European Primary Healthcare Systems and Inequity in Unmet Need. PLoS ONE 2017, 12, e0169274. [Google Scholar] [CrossRef]
- Fjær, E.L.; Stornes, P.; Borisova, L.V.; McNamara, C.L.; Eikemo, T.A. Subjective perceptions of unmet need for health care in Europe among social groups: Findings from the European social survey (2014) special module on the social determinants of health. Eur. J. Public Health 2017, 27 (Suppl. 1), 82–89. [Google Scholar] [CrossRef]
- Tavares, A.I. Older Europeans’ experience of unmet health care during the COVID-19 pandemic (first wave). BMC Health Serv. Res. 2022, 22, 182. [Google Scholar] [CrossRef]
- Arnault, L.; Jusot, F.; Rienaud, T. Economic vulnerability and unmet halthcare needs among the population aged 50+ years during the COVID-19 pandemic in Europe. Eur. J. Ageing 2022, 19, 811–825. [Google Scholar] [CrossRef]
- Gonzales-Touya, M.; Stoyanova, A.; Urbanos-Garrido, R.M. COVID-19 and Unmet Healthcare Needs of Older People: Did Inequity Arise in Europe? Int. J. Environ. Res. Public Health 2021, 18, 9177. [Google Scholar] [CrossRef]
- Smolić, S.; Čipin, I.; Međimurec, P. Access to healthcare for people aged 50+ in Europe during the COVID-19 outbreak. Eur. J. Ageing 2021, 19, 793–809. [Google Scholar] [CrossRef]
- Kalánková, D.; Stolt, M.; Scott, P.A.; Papastavrou, E.; Suhonen, R. Unmet care needs of older people: A scoping review. Nurs. Ethics 2020, 28, 149–178. [Google Scholar] [CrossRef]
- Kelly, G.; Mrengqwa, L.; Geffen, L. “They don’t care about us”: Older people’s experiences of primary healthcare in Cape Town, South Africa. BMC Geriatr. 2019, 19, 98. [Google Scholar] [CrossRef] [PubMed]
- Eimontas, J.; Gegieckaitė, G.; Zamalijeva, O.; Pakalniškienė, V. Unmet Healthcare Needs Predict Depression Symptoms among Older Adults. Int. J. Environ. Res. Public Health 2022, 19, 8892. [Google Scholar] [CrossRef]
- Cavalieri, M. Geographical variation of unmet medical needs in Italy: A multivariate logistic regression analysis. Int. J. Health Geogr. 2013, 12, 27. [Google Scholar] [CrossRef] [PubMed]
- Pappa, E.; Kontodimopoulos, N.; Papadopoulos, A.; Tountas, Y.; Niakas, D. Investigating Unmet Health Needs in Primary Health Care Services in a Representative Sample of the Greek Population. Int. J. Environ. Res. Public Health 2013, 10, 2017–2027. [Google Scholar] [CrossRef] [PubMed]
- Sanmartin, C.; Houle, C.; Tremblay, S.; Berthelot, J.-M. Changes in unmet health care needs. Health Rep. 2002, 13, 15–21. [Google Scholar]
- Carr, W.; Wolfe, S. Unmet needs as sociomedical indicators. Int. J. Health Serv. 1976, 6, 417–430. [Google Scholar] [CrossRef]
- Andersen, R.M. Revisiting the behavioral model and access to medical care: Does it matter? J. Health Soc. Behav. 1995, 36, 1–10. [Google Scholar] [CrossRef]
- Pan, L.; Wang, C.; Cao, X.; Zhu, H.; Luo, L. Unmet Healthcare Needs and Their Determining Factors among Inwell Migrants: A Comparative Study in Shanghai. Int. J. Environ. Res. Public Health 2022, 19, 5499. [Google Scholar] [CrossRef]
- Connolly, S.; Wren, M.-A. Unmet healthcare needs in Ireland: Analysis using the EU-SILC survey. Health Policy 2017, 121, 434–441. [Google Scholar] [CrossRef]
- LaChance, J. Exploring Unmet Healthcare Needs, Healthcare Access, and the Use of Complementary and Alternative Medicine by Chronic Pain Sufferers–An Analysis of the National Population Survey; Electronic Thesis and Dissertation Repository Thesis; Western University: London, ON, Canada, 2018; p. 5555. [Google Scholar]
- Levesque, J.-F.; Harris, M.F.; Russell, G. Patient-centered access to health care: Conceptualising access at the interface of health systems and populations. Int. J. Equity Health 2013, 12, 18. [Google Scholar] [CrossRef]
- Corso, B.; Anindya, K.; Ng, N.; Minicuci, N.; Rosenberg, M.; Kowal, P.; Byles, J. Measuring Unmet Need for Older Adults in Low-, Middle- and High-Income Countries: Theoretical and Analytical Model Building; WHO Centre for Health Development: Geneva, Switzerland, 2022. [Google Scholar]
- Yoon, Y.S.; Jung, B.; Kim, D.; Ha, I.-H. Factors Underlying Unmet Medical Needs: A Cross-Sectional Study. Int. J. Environ. Res. Public Health 2019, 16, 2391. [Google Scholar] [CrossRef] [PubMed]
- Ranjan, A.; Thiagarajan, S.; Garg, S. Measurement of unmet healthcare needs to assess progress on universal health coverage–exploring a novel approach based on household surveys. BMC Health Serv. Res. 2023, 23, 525. [Google Scholar] [CrossRef] [PubMed]
- Rahman, M.M.; Rosenberg, M.; Flores, G.; Parsell, N.; Akter, S.; Alam, M.A.; Rahman, M.M.; Edjer, T. A systematic review and meta-analysis of unmet needs for healthcare and long-term care among older people. Health Econ. Rev. 2022, 12, 60. [Google Scholar] [CrossRef] [PubMed]
- Eurostat. Quality report of the third wave of the European Health Interview Survey. 2022 Edition. Publication Office of the European Union. Luxembourg. Available online: https://ec.europa.eu/eurostat/documents/7870049/14937972/KS-FT-22-002-EN-N.pdf/40912c04-ac9d-012c-358e-111efe0a8976?t=1659613423879 (accessed on 12 December 2022).
- Plisko, R.; Rutkowski, J. PIH34-program 75+ free medicines for the elderly. Value Health 2018, 21, S218. [Google Scholar] [CrossRef]
- Luiu, C.; Tight, M.; Burrow, M. The unmet travel needs of the older population: A review of the literature. Transp. Rev. 2016, 37, 488–506. [Google Scholar] [CrossRef]
- Marshall, E.G. Do young adults have unmet health needs? J. Adolesc. Health 2011, 49, 490–497. [Google Scholar] [CrossRef]
- Jürges, H.; Stella, L. The social dynamics of unmet need, catastrophic healthcare expenses and satisfaction with health insurance coverage. In Health and Socio-Economic Status over the Life Course; Börsch-Supan, A., Bristle, J., Andersen-Ranberg, K., Brugiavini, A., Jusot, F., Litwin, H., Weber, G., Eds.; De Gruyter: Oldenbourg, Germany, 2019; pp. 269–278. [Google Scholar]
- Başar, D.; Dikmen, F.H.; Öztürk, S. The prevalence and determinants of unmet health care needs in Turkey. Health Policy 2021, 125, 786–792. [Google Scholar] [CrossRef]
- Reeves, A.; McKee, M.; Mackenbach, J.; Whitehead, M.; Stuckler, D. Public pensions and unmet medical need among older people: Cross-national analysis of 16 European countries, 2004–2010. J. Epidemiol. Community Health 2016, 71, 174–180. [Google Scholar] [CrossRef]
- Fiorillo, D. Reasons for unmet needs for health care: The role of social capital and social support in some western EU countries. Int. J. Health Econ. Manag. 2019, 20, 79–98. [Google Scholar] [CrossRef]
- Westin, M.; Ahs, A.; Persson, K.B.; Westerling, R. A large proportion of Swedish citizens refrain from seeking medical care-lack of confidence in the medical services a plausible explanation? Health Policy 2004, 68, 333–344. [Google Scholar] [CrossRef]
- Röttger, J.; Blümel, M.; Köppen, J.; Busse, R. Forgone care among chronically ill patients in Germany—Results from a cross-sectional survey with 15,565 individuals. Health Policy 2016, 120, 170–178. [Google Scholar] [CrossRef] [PubMed]
- Banerjee, S. Multimorbidity—Older adults need health care that can count past one. Lancet 2015, 385, 587–589. [Google Scholar] [CrossRef] [PubMed]
- World Health Organization. World Report on Ageing and Health. World Health Organization. Available online: https://apps.who.int/iris/handle/10665/186463 (accessed on 12 December 2022).
- Kocot, E. The impact of aging on different types of health care: The example of the Polish health insurance system. Int. J. Health Plan. Manag. 2018, 33, E557–E568. [Google Scholar] [CrossRef] [PubMed]
- van Ginneken, E.; Reed, S.; Siciliani, L.; Eriksen, A.; Schlepper, L.; Tille, F.; Zapata, T. Addressing backlogs and managing waiting lists during and beyond the COVID-19 pandemic. In Health Systems and Policy Analysis; Policy Brief 47; World Health Organization: Geneva, Switzerland, 2022. [Google Scholar]
- Goldman, N.; Lin, I.; Weinstein, M.; Lin, Y. Evaluating the quality of self-reports of hypertension and diabetes. J. Clin. Epidemiol. 2003, 56, 148–154. [Google Scholar] [CrossRef]
- de Jonge, P.; Slaets, J.P.J. Response set in self-report data and their association with personality traits. Eur. J. Psychiatr. 2005, 19, 209–214. [Google Scholar] [CrossRef]
- Short, M.E.; Goetzel, R.Z.; Pei, X.; Tabrizi, M.J.; Ozminkowski, R.J.; Gibson, T.B.; DeJoy, D.M.; Wilson, M.G. How Accurate are Self-Reports? Analysis of Self-Reported Health Care Utilization and Absence When Compared with Administrative Data. J. Occup. Environ. Med. Am. Coll. Occup. Environ. Med. 2009, 51, 786–796. [Google Scholar] [CrossRef]
- Rosenman, R.; Tennekoon, V.; Hill, L.G. Measuring bias in self-reported data. Int. J. Behav. Health Res. 2011, 2, 320–332. [Google Scholar] [CrossRef]

| Country | Total UHCN | ||||
|---|---|---|---|---|---|
| Total | 15–64 | 65+ | 65–74 | 75+ | |
| Austria | 24.9 | 26.2 | 20.1 | 20.8 | 19.2 |
| Bulgaria | 15.9 | 12.9 | 22.1 | 20.7 | 24.0 |
| Croatia | 33.0 | 28.9 | 40.3 | 38.8 | 41.6 |
| Cyprus | 5.8 | 5.4 | 7.5 | 7.8 | 7.2 |
| Czechia | 17.9 | 16.5 | 21.9 | 21.3 | 22.9 |
| Denmark | 33.0 | 36.8 | 20.9 | 20.9 | 21.0 |
| Estonia | 37.1 | 38.5 | 32.8 | 33.7 | 31.8 |
| Finland | 36.3 | 38.4 | 30.7 | 29.4 | 33.0 |
| France | 29.5 | 32.0 | 21.5 | 24.3 | 17.8 |
| Germany | 26.9 | 29.6 | 19.4 | 20.3 | 18.6 |
| Greece | 19.7 | 18.4 | 23.5 | 25.1 | 21.7 |
| Hungary | 22.5 | 23.2 | 20.3 | 21.5 | 18.7 |
| Iceland | 32.5 | 36.1 | 21.9 | 26.8 | 15.3 |
| Ireland | 22.8 | 23.9 | 17.8 | 19.1 | 15.9 |
| Italy | 26.6 | 25.2 | 29.9 | 29.1 | 30.7 |
| Latvia | 36.9 | 37.0 | 36.6 | 41.5 | 31.4 |
| Lithuania | 26.2 | 26.2 | 26.2 | 26.5 | 25.9 |
| Luxembourg | 38.8 | 41.3 | 26.6 | 23.9 | 33.1 |
| Malta | 21.5 | 20.3 | 25.7 | 25.0 | 26.7 |
| Netherlands | 15.4 | 17.0 | 10.1 | 9.9 | 10.6 |
| Norway | 11.7 | 14.3 | 2.4 | 2.9 | 1.7 |
| Poland | 29.6 | 27.3 | 37.9 | 37.8 | 38.0 |
| Portugal | 39.9 | 39.4 | 41.4 | 40.8 | 42.0 |
| Romania | 13.8 | 10.4 | 24.7 | 24.6 | 24.7 |
| Slovakia | 10.9 | 9.6 | 15.4 | 15.1 | 15.9 |
| Slovenia | 28.0 | 29.7 | 22.6 | 23.4 | 21.5 |
| Spain | 19.6 | 19.9 | 18.6 | 19.9 | 16.9 |
| Sweden | 31.7 | 33.7 | 26.6 | 26.6 | 26.5 |
| Country | Financial | Distance or Transportation | Waiting List | ||||||
|---|---|---|---|---|---|---|---|---|---|
| Age Group | |||||||||
| Total | 15–64 | 65+ | Total | 15–64 | 65+ | Total | 15–64 | 65+ | |
| Bulgaria | 91.2 | 88.4 | 93.7 | 18.2 | 16.3 | 21.3 | 30.8 | 34.1 | 26.7 |
| Romania | 87.7 | 88.5 | 85.0 | 12.3 | 9.6 | 15.8 | 26.1 | 24.0 | 29.1 |
| Norway | 74.4 | 74.8 | 50.0 | 11.1 | 9.8 | 25.0 | 33.3 | 33.6 | 37.5 |
| Greece | 73.1 | 76.6 | 64.3 | 25.4 | 17.9 | 37.0 | 63.5 | 59.2 | 68.5 |
| Finland | 70.8 | 77.3 | 46.6 | 11.6 | 10.9 | 13.4 | 68.0 | 66.4 | 74.9 |
| Latvia | 70.2 | 70.0 | 71.0 | 15.7 | 12.4 | 24.6 | 69.4 | 71.1 | 64.8 |
| Estonia | 70.1 | 71.7 | 64.3 | 9.7 | 8.8 | 12.8 | 69.0 | 69.9 | 66.8 |
| Denmark | 67.9 | 70.9 | 50.2 | 12.7 | 12.2 | 15.8 | 74.2 | 73.4 | 81.8 |
| Sweden | 65.3 | 67.7 | 58.6 | 11.0 | 10.4 | 12.8 | 77.0 | 77.7 | 73.7 |
| Portugal | 64.2 | 66.8 | 57.5 | 9.8 | 8.6 | 12.6 | 73.9 | 73.6 | 73.9 |
| Cyprus | 63.8 | 68.5 | 50.7 | 1.7 | 1.9 | 5.3 | 56.9 | 51.9 | 69.3 |
| Hungary | 62.7 | 65.1 | 55.7 | 12.9 | 11.6 | 17.7 | 59.1 | 58.6 | 61.1 |
| Lithuania | 56.5 | 56.5 | 56.1 | 12.6 | 11.1 | 16.8 | 75.2 | 78.6 | 65.6 |
| Slovenia | 55.7 | 58.6 | 46.0 | 11.1 | 10.8 | 11.9 | 81.4 | 83.2 | 77.4 |
| Croatia | 54.2 | 56.1 | 51.6 | 23.6 | 20.1 | 27.3 | 79.7 | 81.3 | 76.9 |
| Slovakia | 54.1 | 53.1 | 57.8 | 18.3 | 17.7 | 20.1 | 65.1 | 68.8 | 56.5 |
| Ireland | 53.1 | 56.1 | 36.0 | 10.1 | 9.6 | 14.6 | 80.3 | 80.3 | 82.0 |
| Spain | 52.6 | 55.3 | 42.5 | 5.6 | 5.5 | 7.5 | 66.8 | 65.8 | 71.0 |
| Italy | 51.1 | 56.0 | 42.1 | 31.2 | 29.4 | 34.1 | 94.7 | 96.0 | 91.3 |
| Germany | 49.1 | 49.7 | 46.4 | 17.8 | 16.9 | 20.6 | 79.2 | 82.8 | 68.0 |
| Iceland | 46.8 | 50.1 | 28.8 | 13.5 | 14.4 | 9.6 | N/A | N/A | N/A |
| Austria | 43.4 | 45.0 | 35.8 | 11.2 | 9.9 | 16.4 | 81.9 | 83.6 | 78.1 |
| France | 43.1 | 43.4 | 40.9 | 14.9 | 15.3 | 14.9 | 81.0 | 84.1 | 71.2 |
| Poland | 42.9 | 42.1 | 44.6 | 14.5 | 12.8 | 18.5 | 86.8 | 87.5 | 83.1 |
| Czechia | 39.7 | 38.2 | 42.5 | 28.5 | 23.0 | 40.2 | 79.3 | 83.6 | 69.9 |
| Netherlands | 34.4 | 38.2 | 14.9 | 16.2 | 15.3 | 23.8 | N/A | N/A | N/A |
| Luxembourg | 34.3 | 36.1 | 21.1 | 13.9 | 12.8 | 21.4 | 92.3 | 94.2 | 83.5 |
| Malta | 27.9 | 29.1 | 25.3 | 10.7 | 8.4 | 17.1 | 79.1 | 79.3 | 79.0 |
| Mean | 57.1 | 58.9 | 49.3 | 14.6 a | 13.0 | 18.9 a | 70.1 a | 70.9 | 68.5 a |
| SD | 15.6 | 15.6 | 17.3 | 6.3 a | 5.3 | 8.2 a | 17.4 a | 18.2 | 15.7 a |
| Median | 55.0 | 56.0 | 48.5 | 13.0 | 12.0 | 17.0 | 74.5 | 76.0 | 71.0 |
| test statistics b | 2.177 | −3.194 | −1.026 | ||||||
| p-value | 0.034 | 0.001 | 0.305 | ||||||
| Country | Financial | Distance or Transportation | Waiting List | ||||||
|---|---|---|---|---|---|---|---|---|---|
| Age Group | |||||||||
| 65+ | 65–74 | 75+ | 65+ | 65–74 | 75+ | 65+ | 65–74 | 75+ | |
| Bulgaria | 93.7 | 90.3 | 97.9 | 21.3 | 20.8 | 21.7 | 26.7 | 28.5 | 24.6 |
| Romania | 85.0 | 86.6 | 83.8 | 15.8 | 13.4 | 18.6 | 29.1 | 27.2 | 32.0 |
| Latvia | 71.0 | 70.8 | 71.3 | 24.6 | 20.0 | 30.9 | 64.8 | 70.6 | 57.0 |
| Estonia | 64.3 | 65.9 | 62.6 | 12.8 | 6.8 | 19.5 | 66.8 | 67.1 | 66.4 |
| Greece | 64.3 | 66.9 | 61.8 | 37.0 | 31.1 | 44.7 | 68.5 | 70.5 | 66.4 |
| Sweden | 58.6 | 60.5 | 56.2 | 12.8 | 8.3 | 17.7 | 73.7 | 76.7 | 70.2 |
| Slovakia | 57.8 | 58.9 | 56.0 | 20.1 | 15.9 | 25.8 | 56.5 | 60.3 | 50.3 |
| Portugal | 57.5 | 58.8 | 56.0 | 12.6 | 11.3 | 13.8 | 73.9 | 73.3 | 75.0 |
| Lithuania | 56.1 | 58.9 | 53.3 | 16.8 | 7.2 | 27.4 | 65.6 | 68.3 | 63.3 |
| Hungary | 55.7 | 57.7 | 52.9 | 17.7 | 18.1 | 16.6 | 61.1 | 61.4 | 60.4 |
| Croatia | 51.6 | 48.7 | 54.1 | 27.3 | 27.8 | 26.7 | 76.9 | 86.1 | 69.7 |
| Cyprus | 50.7 | 56.4 | 38.9 | 5.3 | 1.3 | 9.7 | 69.3 | 67.9 | 70.8 |
| Denmark | 50.2 | 46.9 | 55.2 | 15.8 | 15.3 | 16.2 | 81.8 | 86.6 | 74.3 |
| Norway | 50.0 | 51.7 | 52.9 | 25.0 | 27.6 | 17.6 | 37.5 | 37.9 | 41.2 |
| Finland | 46.6 | 50.3 | 40.3 | 13.4 | 12.9 | 13.9 | 74.9 | 75.2 | 74.2 |
| Germany | 46.4 | 49.8 | 43.0 | 20.6 | 14.8 | 25.8 | 68.0 | 69.0 | 67.2 |
| Slovenia | 46.0 | 49.1 | 41.9 | 11.9 | 7.7 | 16.7 | 77.4 | 81.2 | 73.0 |
| Poland | 44.6 | 44.2 | 45.3 | 18.5 | 15.1 | 23.7 | 83.1 | 84.1 | 81.8 |
| Spain | 42.5 | 42.7 | 43.2 | 7.5 | 6.0 | 8.9 | 71.0 | 71.9 | 70.4 |
| Czechia | 42.5 | 41.3 | 43.7 | 40.2 | 33.8 | 50.2 | 69.9 | 73.2 | 64.6 |
| Italy | 42.1 | 41.9 | 42.0 | 34.1 | 32.0 | 36.2 | 91.3 | 94.5 | 88.6 |
| France | 40.9 | 41.6 | 39.9 | 14.9 | 10.7 | 22.5 | 71.2 | 74.1 | 65.2 |
| Ireland | 36.0 | 39.3 | 29.6 | 14.6 | 15.2 | 13.8 | 82.0 | 82.7 | 79.9 |
| Austria | 35.8 | 37.0 | 34.4 | 16.4 | 13.0 | 20.3 | 78.1 | 79.3 | 77.1 |
| Iceland | 28.8 | 28.4 | 30.1 | 9.6 | 4.5 | 22.2 | N/A | N/A | N/A |
| Malta | 25.3 | 27.6 | 21.7 | 17.1 | 12.4 | 25.5 | 79.0 | 82.8 | 72.7 |
| Luxembourg | 21.1 | 23.4 | 17.2 | 21.4 | 11.7 | 38.7 | 83.5 | 87.4 | 77.0 |
| Netherlands | 14.9 | 19.2 | 8.5 | 23.8 | 11.1 | 36.8 | N/A | N/A | N/A |
| Mean | 49.3 | 50.6 | 47.6 | 18.9 a | 15.2 a | 23.7 a | 68.5 a | 70.7 a | 65.9 a |
| SD | 17.3 | 16.8 | 18.8 | 8.2 a | 8.6 a | 10.1 a | 15.7 a | 16.8 a | 14.8 a |
| Median | 48.5 | 49.5 | 44.5 | 17.0 | 13.0 | 22.0 | 71.0 | 73.0 | 71.0 |
| test statistics b | 0.622 | −3.337 | −1.657 | ||||||
| p-value | 0.537 | <0.001 | 0.097 | ||||||
| Age | Measure | Educational Level | F-Value | p-Value | ||
|---|---|---|---|---|---|---|
| Level 0–2 | Level 3–4 | Level 5–8 | ||||
| 15–64 | mean (SD) | 27.6 (9.5) | 25.7 (10.6) | 23.4 (10.7) | 1.184 | 0.311 |
| min/max | 6.3/45.1 | 6.5/44.2 | 4.0/43.7 | |||
| 65+ | mean (SD) | 24.5 (9.2) | 23.2 (8.7) | 21.9 (10.1) | 0.533 | 0.589 |
| min/max | 4.3/44.0 | 1.8/38.7 | 1.6/49.3 | |||
| 65–74 | mean (SD) | 25.7 (10.1) | 23.7 (8.8) | 21.9 (10.4) | 1.100 | 0.338 |
| min/max | 5.9/50.3 | 2.5/42.3 | 1.7/48.2 | |||
| 75+ | mean (SD) | 23.7 (9.4) | 22.4 (10.0) | 22.2 (10.6) | 0.199 | 0.820 |
| min/max | 3.1/44.1 | 1.0/41.7 | 1.3/50.5 | |||
| Age | Measure | Income Group | F-Value | p-Value | ||||
|---|---|---|---|---|---|---|---|---|
| First Quintile (1) | Second Quintile (2) | Third Quintile (3) | Fourth Quintile (4) | Fifth Quintile (5) | ||||
| 15–64 | mean (SD) | 34.7 (12.3) | 29.6(11.6) | 25.3 (10.8) | 22.8 (10.3) | 20.0 (9.6) | 7.899 | <0.001 |
| min/max | 10.6/62.5 | 7.5/49.7 | 4.9/43.4 | 3.8/39.7 | 2.4/39.4 | |||
| 65+ | mean (SD) | 29.3 (10.8) | 24.9 (9.6) | 22.7 (9.4) | 20.9 (10.0) | 18.0 (8.2) | 4.625 | 0.002 |
| min/max | 4.6/54.6 | 2.4/46.5 | 2.5/44.3 | 1.2/41.5 | 1.0/36.1 | |||
| 65–74 | mean (SD) | 32.7 (12.3) | 26.6 (10.7) | 22.8 (9.9) | 21.1 (10.0) | 17.1 (7.6) | 7.397 | <0.001 |
| min/max | 7.6/56.7 | 4.0/48.0 | 2.8/49.4 | 1.6/43.0 | 0.9/29.5 | |||
| 75+ | mean (SD) | 25.5 (11.3) | 23.5 (9.5) | 23.1 (10.2) | 20.8 (10.7) | 19.5 (10.6) | 1.246 | 0.295 |
| min/max | 2.7/55.9 | 1.2/45.4 | 2.2/45.1 | 0.0/40.1 | 1.6/48.6 | |||
| Age | Measure | Urbanization Group | F-Value | p-Value | ||
|---|---|---|---|---|---|---|
| Cities | Towns and Suburbs | Rural Areas | ||||
| 15–64 | mean (SD) | 27.9 (11.3) | 24.9 (9.7) | 23.5 (9.6) | 1.360 | 0.262 |
| min/max | 4.5/46.0 | 7.8/41.2 | 4.1/39.8 | |||
| 65+ | mean (SD) | 25.2 (9.9) | 24.2 (9.5) | 22.3 (8.6) | 0.688 | 0.506 |
| min/max | 1.7/43.0 | 2.1/42.0 | 3.1/46.7 | |||
| 65–74 | mean (SD) | 25.6 (9.9) | 24.5 (10.0) | 22.8 (9.0) | 0.574 | 0.566 |
| min/max | 2.9/46.9 | 1.9/41.7 | 4.0/48.9 | |||
| 75+ | mean (SD) | 24.6 (10.6) | 23.9 (10.0) | 21.7 (9.2) | 0.618 | 0.541 |
| min/max | 0.0/46.8 | 2.4/42.9 | 1.9/44.7 | |||
| Age | Measure | Activity Limitation Level | F-Value | p-Value | ||
|---|---|---|---|---|---|---|
| None (1) | Moderate (2) | Severe (3) | ||||
| 15–64 | mean (SD) | 21.2 (8.7) | 39.0 (12.1) | 50.6 (12.8) | 47.708 | <0.001 |
| min/max | 4.5/37.4 | 11.9/62.7 | 19.1/70.4 | |||
| 65+ | mean (SD) | 17.2 (7.0) | 28.0 (10.4) | 36.4 (12.0) | 25.690 | <0.001 |
| min/max | 1.4/32.8 | 3.6/50.3 | 9.0/62.4 | |||
| 65–74 | mean (SD) | 17.8 (7.2) | 30.7 (10.8) | 40.7 (13.8) | 35.129 | <0.001 |
| min/max | 1.8/32.0 | 4.2/51.4 | 11.3/67.8 | |||
| 75+ | mean (SD) | 16.2 (7.5) | 25.1 (10.8) | 33.1 (11.9) | 19.080 | <0.001 |
| min/max | 0.9/37.8 | 2.7/49.3 | 6.5/57.7 | |||
Disclaimer/Publisher’s Note: The statements, opinions and data contained in all publications are solely those of the individual author(s) and contributor(s) and not of MDPI and/or the editor(s). MDPI and/or the editor(s) disclaim responsibility for any injury to people or property resulting from any ideas, methods, instructions or products referred to in the content. |
© 2023 by the author. Licensee MDPI, Basel, Switzerland. This article is an open access article distributed under the terms and conditions of the Creative Commons Attribution (CC BY) license (https://creativecommons.org/licenses/by/4.0/).
Share and Cite
Kocot, E. Unmet Health Care Needs of the Older Population in European Countries Based on Indicators Available in the Eurostat Database. Healthcare 2023, 11, 2692. https://doi.org/10.3390/healthcare11192692
Kocot E. Unmet Health Care Needs of the Older Population in European Countries Based on Indicators Available in the Eurostat Database. Healthcare. 2023; 11(19):2692. https://doi.org/10.3390/healthcare11192692
Chicago/Turabian StyleKocot, Ewa. 2023. "Unmet Health Care Needs of the Older Population in European Countries Based on Indicators Available in the Eurostat Database" Healthcare 11, no. 19: 2692. https://doi.org/10.3390/healthcare11192692
APA StyleKocot, E. (2023). Unmet Health Care Needs of the Older Population in European Countries Based on Indicators Available in the Eurostat Database. Healthcare, 11(19), 2692. https://doi.org/10.3390/healthcare11192692