
Deep Neural Network Regression to Assist Non-Invasive Diagnosis of Portal Hypertension

 , , , ,
  ,
, 
Abstract
:1. Introduction
- A review of the related works in the literature is performed and presented to identify artificial intelligence and machine learning methods that have already been applied in the context of PHT diagnosis.
- An innovative neural network regression approach is developed for supporting the non-invasive diagnosis of PHT.
- Simulations are performed on two datasets in order to validate the efficacy of the proposed method.
2. Related Works
3. Data Preprocessing
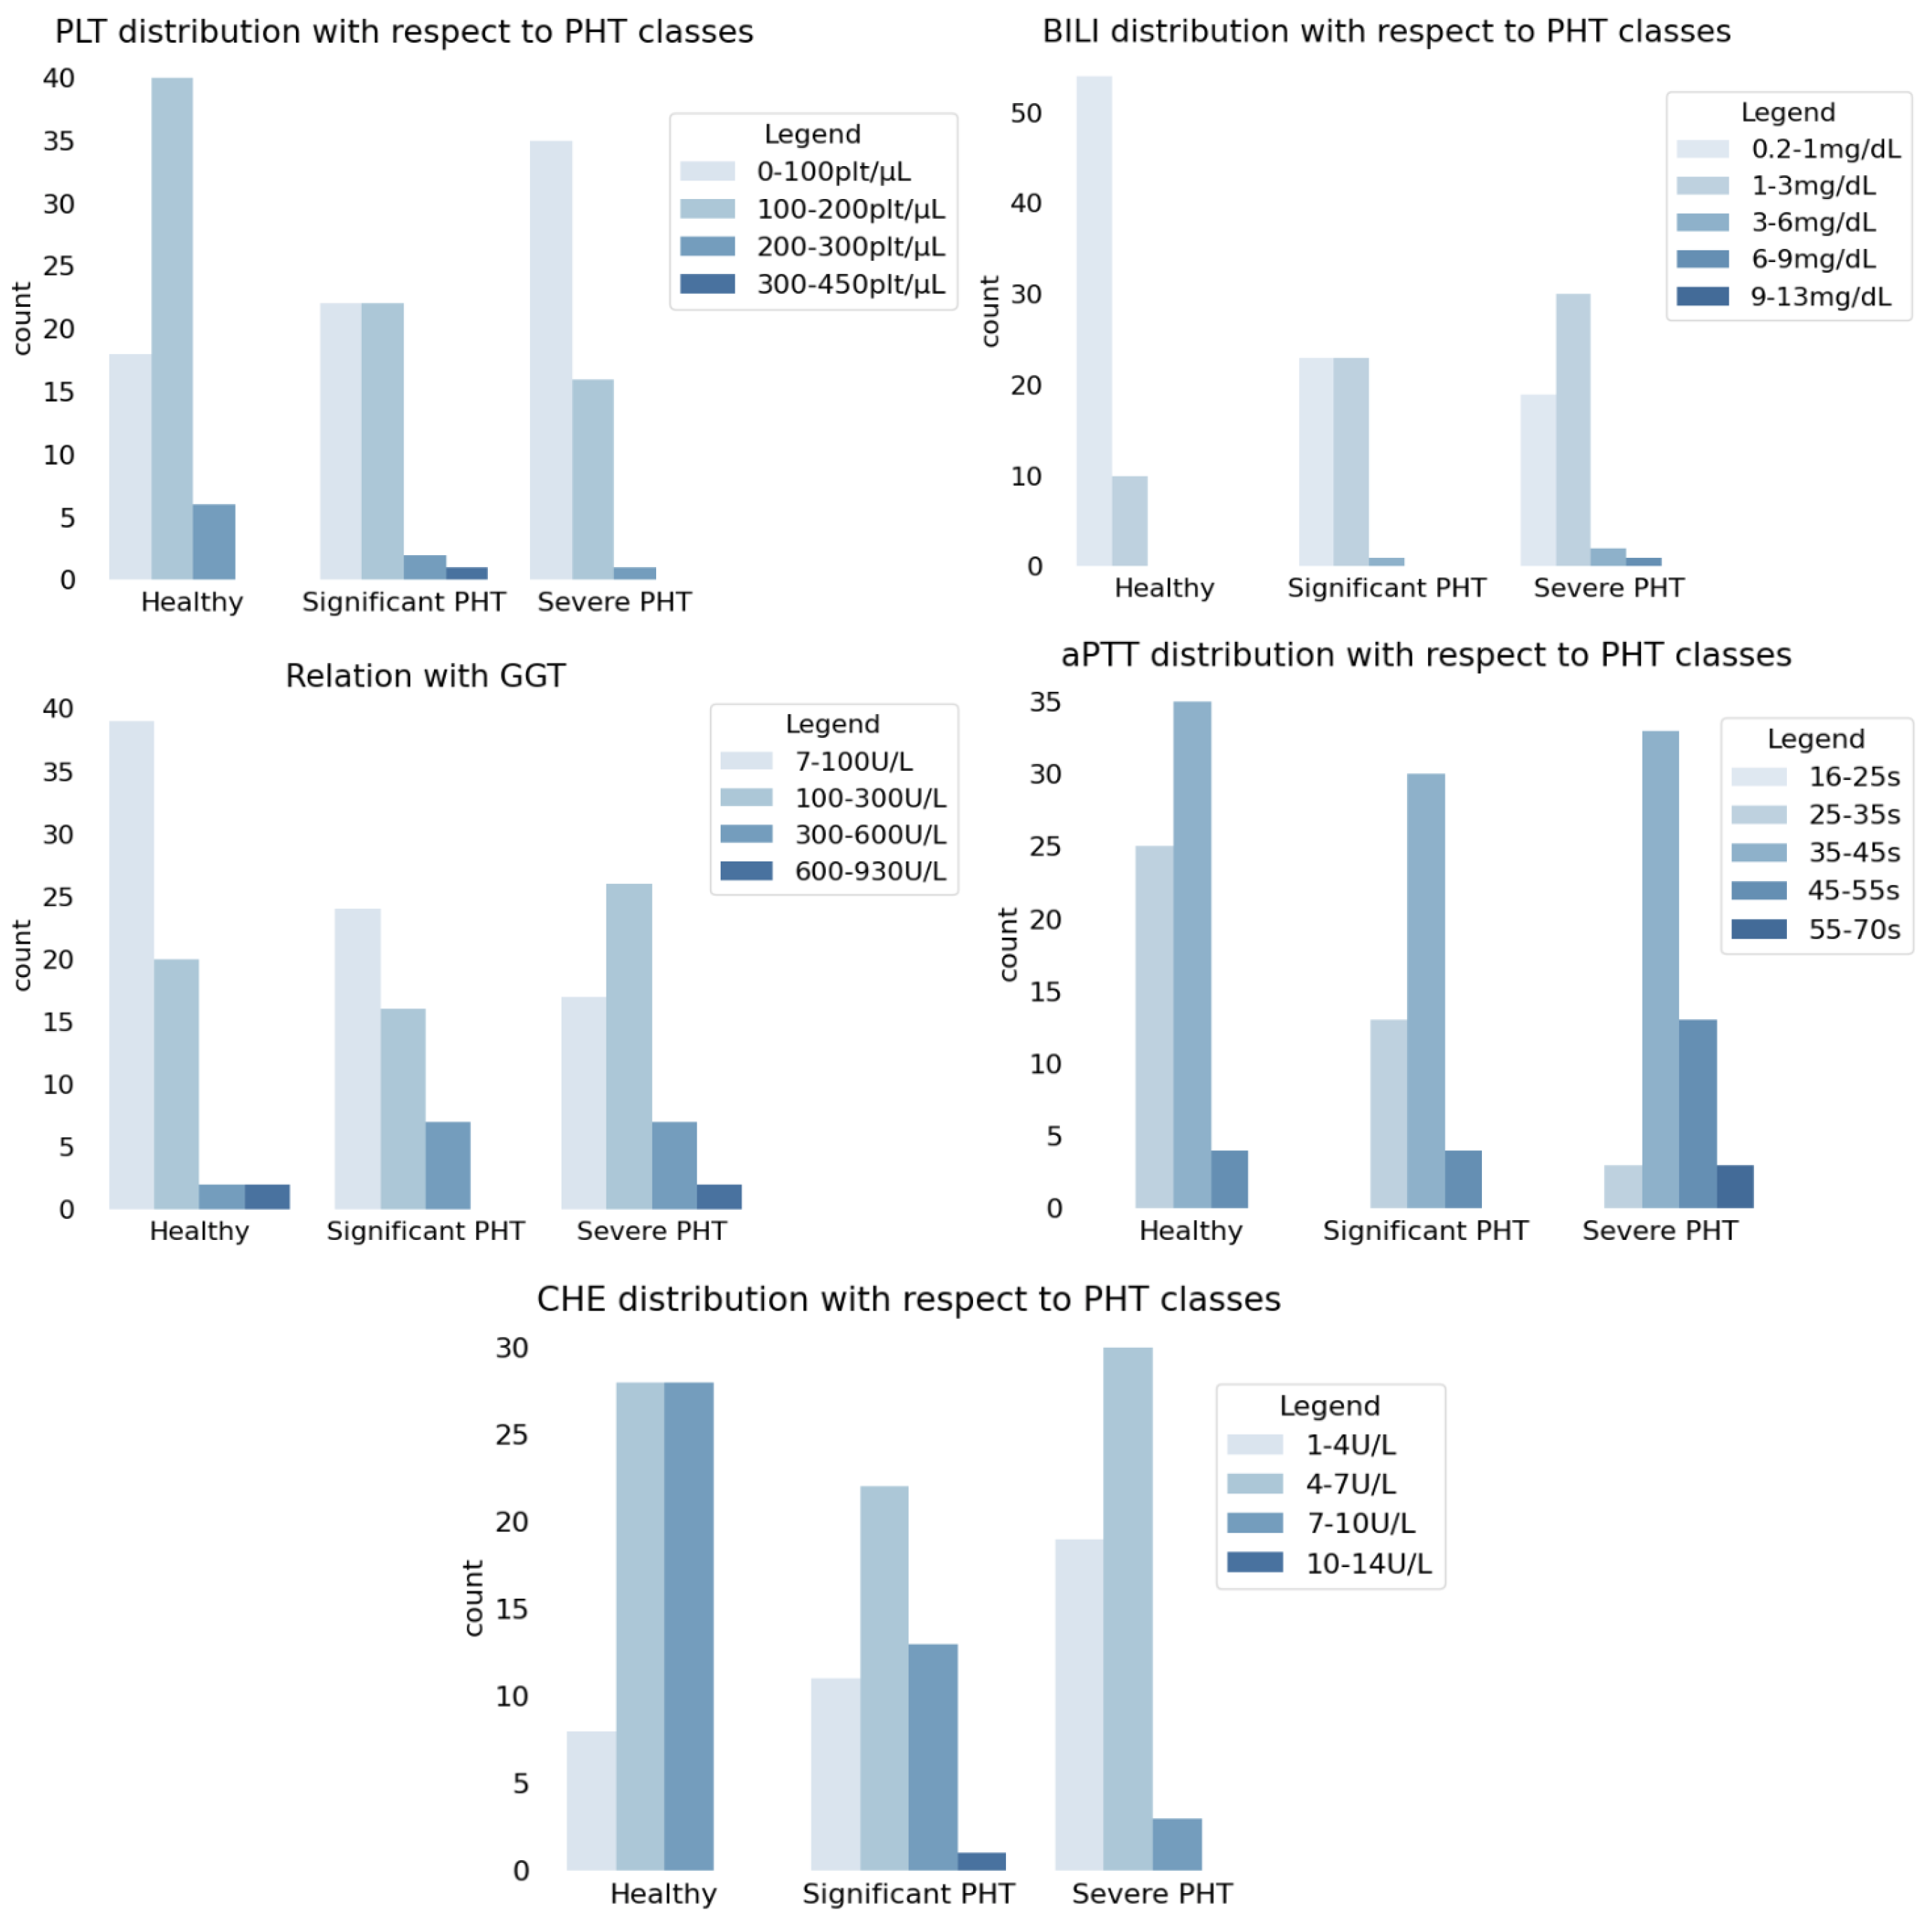
- Platelet count (PLT) measured in platelets/µL. Platelet count refers to the measurement of the number of platelets, also known as thrombocytes, in a given volume of blood, which is an important parameter for assessing the body’s ability to form blood clots and maintain proper hemostasis.
- Total serum bilirubin (BILI) measured in mg/dL. Total serum bilirubin refers to the measurement of the concentration of bilirubin, a yellow pigment produced during the breakdown of red blood cells, in the blood. It is an essential component of liver function tests. Elevated levels of total serum bilirubin may indicate impaired liver function or an underlying medical condition.
- Gamma-glutamyltransferase (GGT) measured in U/L. Gamma-glutamyltransferase is an enzyme found in various tissues, but it is predominantly present in the liver. GGT plays a crucial role in the metabolism of glutathione, a potent antioxidant involved in the detoxification of harmful substances in the body.
- Activated partial thromboplastin time (aPTT) measured in seconds. Activated partial thromboplastin time is a laboratory test that measures the time it takes for blood to clot and is used to evaluate the intrinsic pathway of the coagulation cascade and monitor the effectiveness of heparin therapy.
- Cholinesterase (CHE) measured in U/L. Cholinesterase refers to a group of enzymes that are responsible for breaking down the neurotransmitter acetylcholine in the body, regulating its levels and terminating its action.
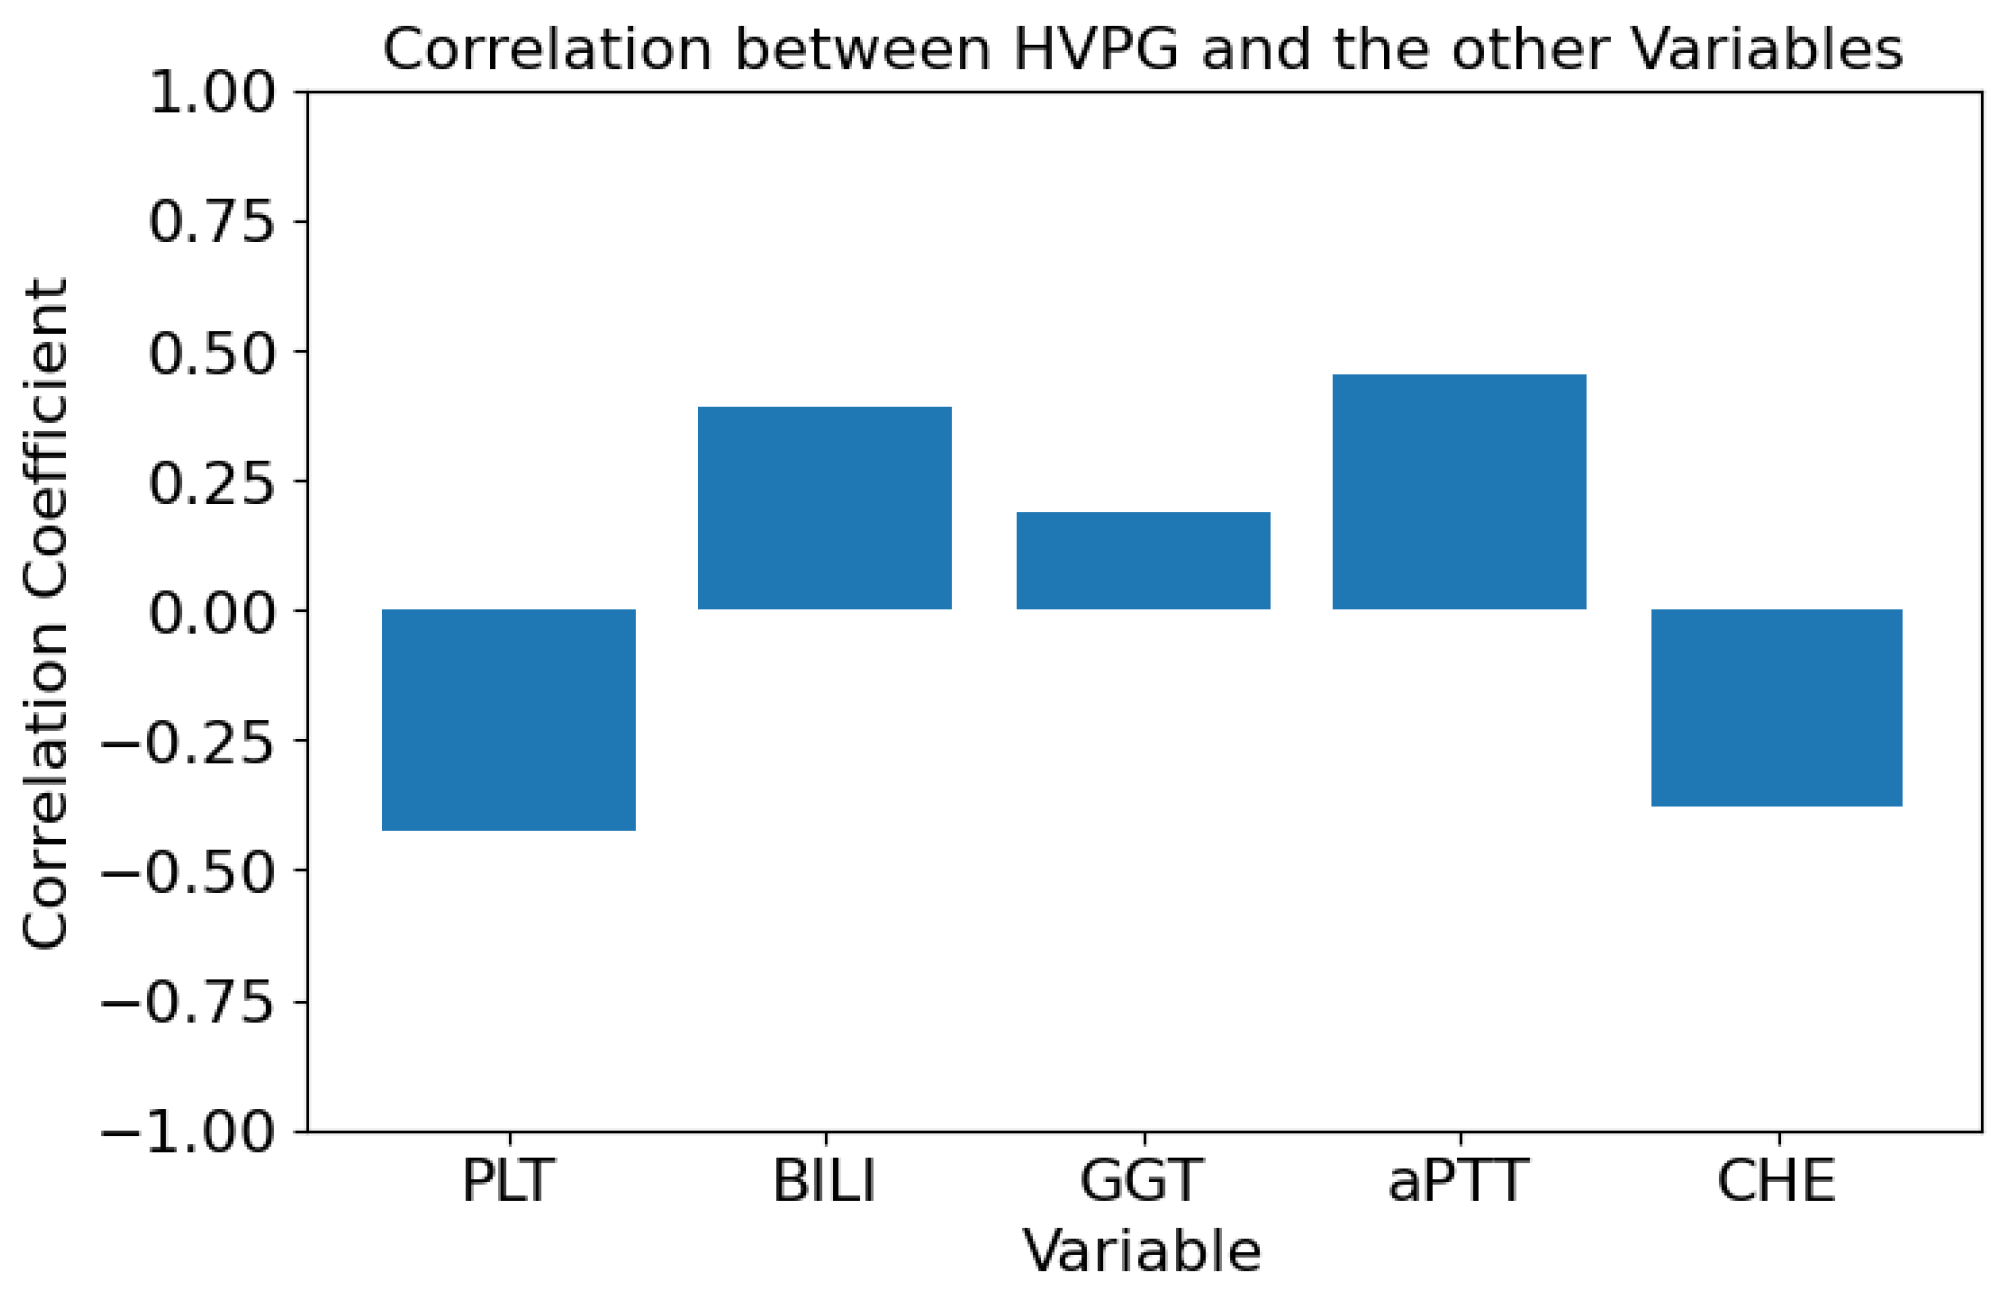
- Lower values of PLT are associated with more frequent occurrences of PHT, i.e., inverse proportionality between PLT and HVPG was presumed;
- Higher values of BILI are associated with more frequent occurrences of PHT, i.e., direct proportionality between BILI and HVPG was presumed;
- Higher values of GGT are associated with more frequent occurrences of PHT, i.e., direct proportionality between GGT and HVPG was presumed;
- Higher values of aPTT are associated with more frequent occurrences of PHT, i.e., direct proportionality between aPTT and HVPG was presumed;
- Lower values of CHE are associated with more frequent occurrences of PHT, i.e., inverse proportionality between CHE and HVPG was presumed.
| Algorithm 1 K-means algorithm |
|
4. Deep Neural Network Regression
- The architecture is composed of one input layer with five neurons, two hidden layers with 32 and 16 dimensions, respectively, and one output layer with one neuron, with a rectified linear unit activation function, which is used due to its ability to handle non-linear relationships [28]. Figure 5 depicts the architecture of the implemented network.
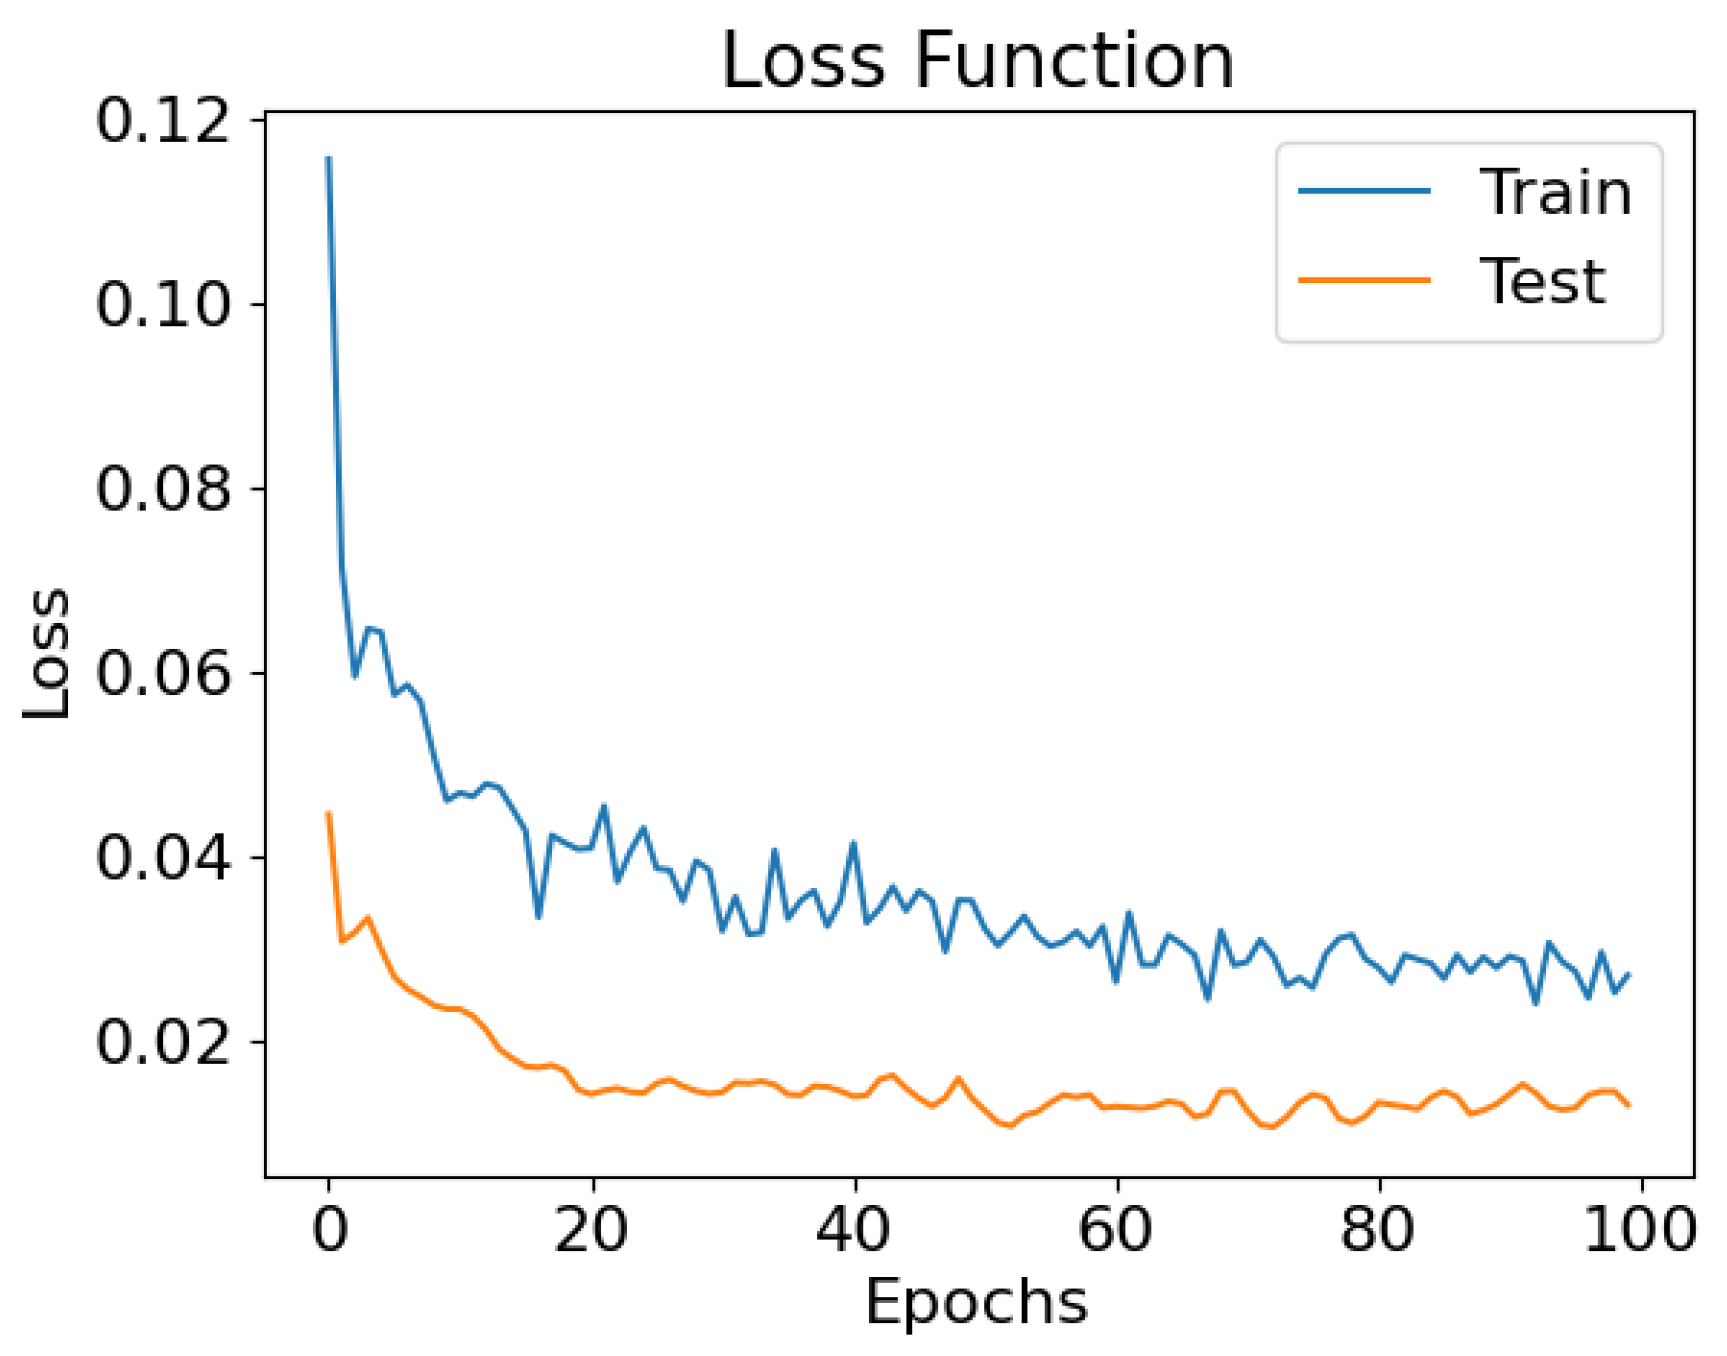
- Dropout is applied, which is a regularization technique that mitigates overfitting (i.e., a condition in which the model becomes excessively specialized to the training data, to the extent that it performs poorly on new, unseen data) and improves generalization performance. It randomly sets a fraction of the output values of neurons to zero during each training iteration. Such a process encourages the network to learn robust and less reliant representations by preventing co-adaptation among neurons.
- The mean square error is used as the loss function, measuring the average squared difference between the predicted values and the actual values of the target variable. Such a loss function calculates the squared difference between each predicted value and the corresponding true value , sums up these squared differences across all data points, and then takes the average. The resulting value represents the average magnitude of the errors or residuals in the predictions. It is given by the following formula:
- It is used as an Adam optimizer, which dynamically adjusts the learning rate based on the first-order and second-order moments of the gradients.
5. Conclusions
- Limited Dataset Quality and Size: One of the foremost limitations of our study is the quality and size of the dataset used. The dataset remains relatively small and noisy in comparison to the complexity of the problem. Moreover, the clinical features that are used to solve the regression problem are those that are currently considered to be the most significant for diagnosing portal hypertension and estimating the value of the hepatic venous pressure gradient. A dataset could be of higher quality if it includes more clinical features in addition to the current ones. The inclusion of more extensive and higher quality data would undoubtedly contribute to a more accurate performance.
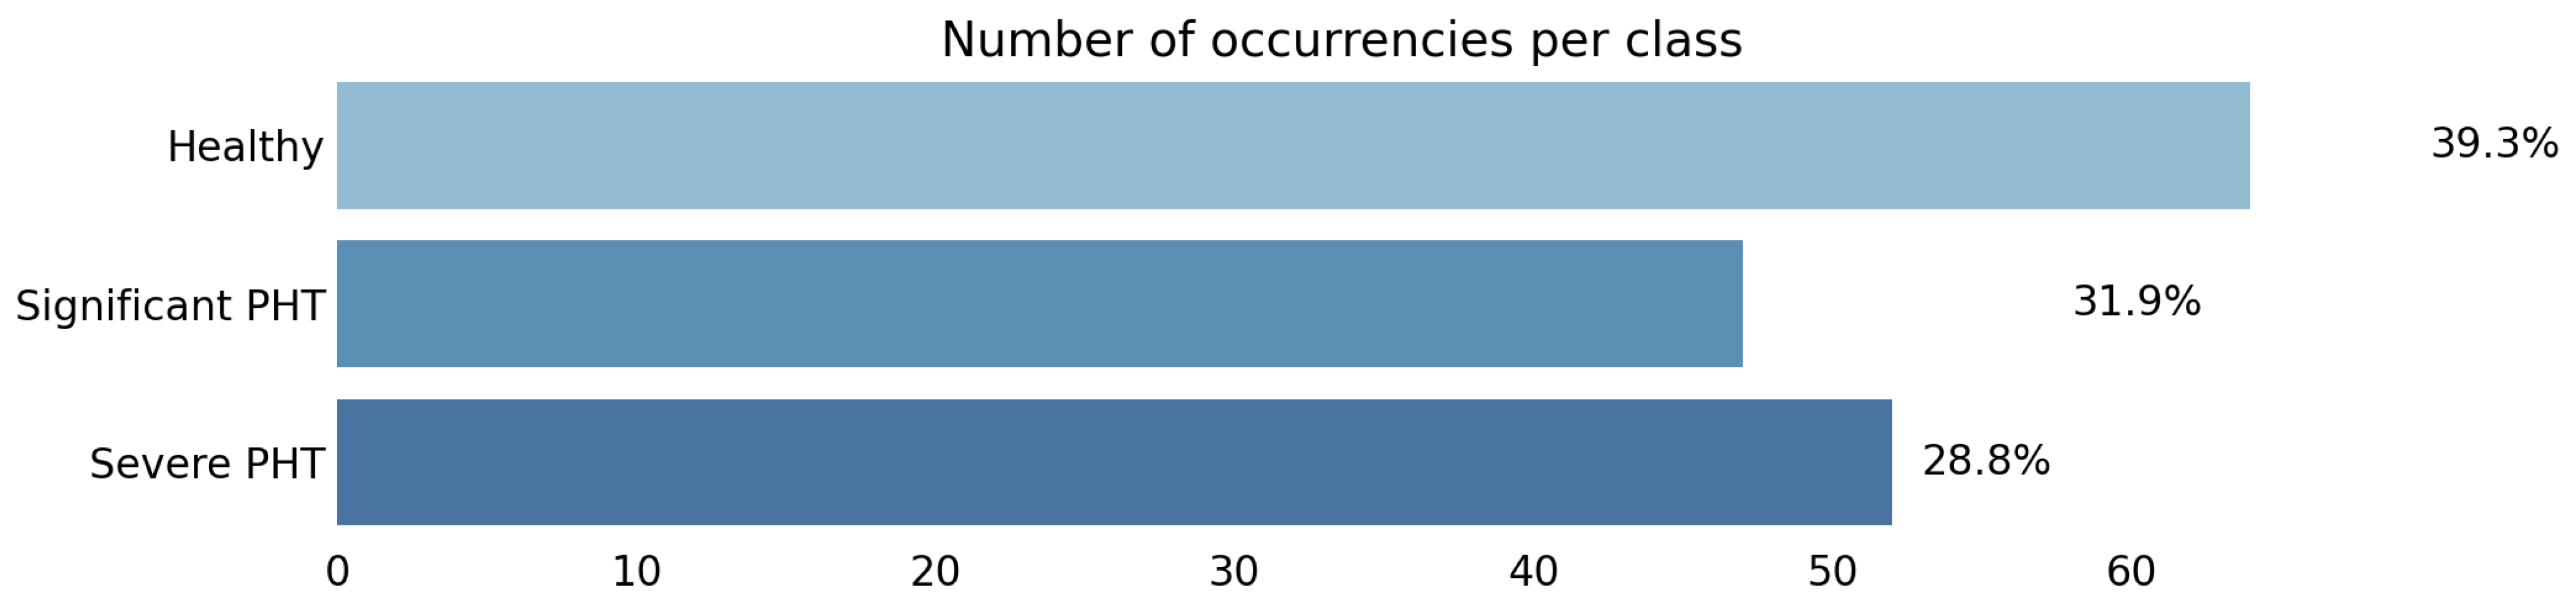
- Data Imbalance: An imbalanced class distribution can lead to biased model predictions. A larger and more balanced dataset would help mitigate this limitation and improve the model’s generalization to a broader range of patient profiles.
- Limitations Related to Prospective Study Design: A longitudinal study with prospective data collection through monitoring patients over an extended period could provide more insights into the predictive capabilities of the proposed method over time.
Author Contributions
Funding
Institutional Review Board Statement
Informed Consent Statement
Data Availability Statement
Acknowledgments
Conflicts of Interest
References
- Bosch, J.; Navasa, M.; Garcia-Pagan, J.; DeLacy, A.; Rodes, J. Portal hypertension. Med. Clin. North Am. 1989, 73, 931–953. [Google Scholar] [CrossRef]
- Garcia-Tsao, G.; Bosch, J. Management of varices and variceal hemorrhage in cirrhosis. N. Engl. J. Med. 2010, 362, 823–832. [Google Scholar] [CrossRef] [PubMed]
- Sanyal, A.J.; Bosch, J.; Blei, A.; Arroyo, V. Portal hypertension and its complications. Gastroenterology 2008, 134, 1715–1728. [Google Scholar] [CrossRef] [PubMed]
- Bosch, J.; Abraldes, J.G.; Berzigotti, A.; Garcia-Pagan, J.C. Portal hypertension and gastrointestinal bleeding. In Seminars in Liver Disease; ©Thieme Medical Publishers: New York, NY, USA, 2008; Volume 28, pp. 3–25. [Google Scholar]
- AMEI. L’ipertensione Portale. Available online: https://www.ameiitalia.org/temi-dinteresse/lipertensione-portale/ (accessed on 25 May 2023).
- Bari, K.; Garcia-Tsao, G. Treatment of portal hypertension. World J. Gastroenterol. WJG 2012, 18, 1166. [Google Scholar] [CrossRef]
- Esteva, A.; Kuprel, B.; Novoa, R.A.; Ko, J.; Swetter, S.M.; Blau, H.M.; Thrun, S. Dermatologist-level classification of skin cancer with deep neural networks. Nature 2017, 542, 115–118. [Google Scholar] [CrossRef]
- Attia, Z.I.; Kapa, S.; Lopez-Jimenez, F.; McKie, P.M.; Ladewig, D.J.; Satam, G.; Pellikka, P.A.; Enriquez-Sarano, M.; Noseworthy, P.A.; Munger, T.M.; et al. Screening for cardiac contractile dysfunction using an artificial intelligence–enabled electrocardiogram. Nat. Med. 2019, 25, 70–74. [Google Scholar] [CrossRef] [PubMed]
- Hosny, A.; Parmar, C.; Quackenbush, J.; Schwartz, L.H.; Aerts, H.J. Artificial intelligence in radiology. Nat. Rev. Cancer 2018, 18, 500–510. [Google Scholar] [CrossRef]
- LeCun, Y.; Bengio, Y.; Hinton, G. Deep learning. Nature 2015, 521, 436–444. [Google Scholar] [CrossRef]
- Krizhevsky, A.; Sutskever, I.; Hinton, G.E. Imagenet classification with deep convolutional neural networks. Adv. Neural Inf. Process. Syst. 2012, 25, 30. [Google Scholar] [CrossRef]
- Young, T.; Hazarika, D.; Poria, S.; Cambria, E. Recent trends in deep learning based natural language processing. IEEE Comput. IntelligenCe Mag. 2018, 13, 55–75. [Google Scholar] [CrossRef]
- Hinton, G.; Deng, L.; Yu, D.; Dahl, G.E.; Mohamed, A.R.; Jaitly, N.; Senior, A.; Vanhoucke, V.; Nguyen, P.; Sainath, T.N.; et al. Deep neural networks for acoustic modeling in speech recognition: The shared views of four research groups. IEEE Signal Process. Mag. 2012, 29, 82–97. [Google Scholar] [CrossRef]
- Levine, S.; Finn, C.; Darrell, T.; Abbeel, P. End-to-end training of deep visuomotor policies. J. Mach. Learn. Res. 2016, 17, 1334–1373. [Google Scholar]
- McCulloch, W.S.; Pitts, W. A logical calculus of the ideas immanent in nervous activity. Bull. Math. Biophys. 1943, 5, 115–133. [Google Scholar] [CrossRef]
- Goodfellow, I.; Bengio, Y.; Courville, A. Deep Learning; MIT Press: Cambridge, MA, USA, 2016. [Google Scholar]
- Bengio, Y.; Courville, A.; Vincent, P. Representation learning: A review and new perspectives. IEEE Trans. Pattern Anal. Mach. Intell. 2013, 35, 1798–1828. [Google Scholar] [CrossRef] [PubMed]
- Li, X.; Kang, N.; Qi, X.; Huang, Y. Artificial intelligence in the diagnosis of cirrhosis and portal hypertension. J. Med Ultrason. 2022, 49, 371–379. [Google Scholar] [CrossRef]
- Yu, Q.; Huang, Y.; Li, X.; Pavlides, M.; Liu, D.; Luo, H.; Ding, H.; An, W.; Liu, F.; Zuo, C.; et al. An imaging-based artificial intelligence model for non-invasive grading of hepatic venous pressure gradient in cirrhotic portal hypertension. Cell Rep. Med. 2022, 3, 100563. [Google Scholar] [CrossRef]
- Marozas, M.; Zykus, R.; Sakalauskas, A.; Kupčinskas, L.; Lukoševičius, A. Noninvasive evaluation of portal hypertension using a supervised learning technique. J. Healthc. Eng. 2017, 2017, 6183714. [Google Scholar] [CrossRef]
- Ahn, Y.; Yoon, J.S.; Lee, S.S.; Suk, H.I.; Son, J.H.; Sung, Y.S.; Lee, Y.; Kang, B.K.; Kim, H.S. Deep learning algorithm for automated segmentation and volume measurement of the liver and spleen using portal venous phase computed tomography images. Korean J. Radiol. 2020, 21, 987. [Google Scholar] [CrossRef]
- Bosch, J.; Chung, C.; Carrasco-Zevallos, O.M.; Harrison, S.A.; Abdelmalek, M.F.; Shiffman, M.L.; Rockey, D.C.; Shanis, Z.; Juyal, D.; Pokkalla, H.; et al. A machine learning approach to liver histological evaluation predicts clinically significant portal hypertension in NASH cirrhosis. Hepatology 2021, 74, 3146–3160. [Google Scholar] [CrossRef]
- Procopet, B.; Cristea, V.M.; Robic, M.A.; Grigorescu, M.; Agachi, P.S.; Metivier, S.; Peron, J.M.; Selves, J.; Stefanescu, H.; Berzigotti, A.; et al. Serum tests, liver stiffness and artificial neural networks for diagnosing cirrhosis and portal hypertension. Dig. Liver Dis. 2015, 47, 411–416. [Google Scholar] [CrossRef]
- Reiniš, J.; Petrenko, O.; Simbrunner, B.; Hofer, B.S.; Schepis, F.; Scoppettuolo, M.; Saltini, D.; Indulti, F.; Guasconi, T.; Albillos, A.; et al. Assessment of portal hypertension severity using machine learning models in patients with compensated cirrhosis. J. Hepatol. 2023, 78, 390–400. [Google Scholar] [CrossRef]
- Lekadir, K.; Osuala, R.; Gallin, C.; Lazrak, N.; Kushibar, K.; Tsakou, G.; Aussó, S.; Alberich, L.C.; Marias, K.; Tsiknakis, M.; et al. FUTURE-AI: Guiding principles and consensus recommendations for trustworthy artificial intelligence in medical imaging. arXiv 2021, arXiv:2109.09658. [Google Scholar]
- Cohen, I.; Huang, Y.; Chen, J.; Benesty, J.; Benesty, J.; Chen, J.; Huang, Y.; Cohen, I. Pearson correlation coefficient. In Noise Reduction in Speech Processing; Springer: Berlin/Heidelberg, Germany, 2009; pp. 1–4. [Google Scholar]
- Likas, A.; Vlassis, N.; Verbeek, J.J. The global k-means clustering algorithm. Pattern Recognit. 2003, 36, 451–461. [Google Scholar] [CrossRef]
- Agarap, A.F. Deep learning using rectified linear units (relu). arXiv 2018, arXiv:1803.08375. [Google Scholar]
- Menegatti, D.; Giuseppi, A.; Delli Priscoli, F.; Pietrabissa, A.; Di Giorgio, A.; Baldisseri, F.; Mattioni, M.; Monaco, S.; Lanari, L.; Panfili, M.; et al. CADUCEO: A Platform to Support Federated Healthcare Facilities through Artificial Intelligence. Healthcare 2023, 11, 2199. [Google Scholar] [CrossRef]


| Patient ID | PLT (G/L) | BILI (mg/dL) | GGT (U/L) | aPTT (s) | CHE (kU/L) |
|---|---|---|---|---|---|
| 1 | 108.0 | 0.47 | 19.0 | 38.9 | 6.28 |
| 2 | 171.0 | 0.51 | 67.0 | 34.9 | 7.74 |
| 3 | 106.0 | 0.84 | 304.0 | 33.5 | 7.63 |
| 4 | 131.0 | 1.03 | 263.0 | 41.5 | 7.70 |
| 5 | 133.0 | 0.87 | 81.0 | 38.7 | 9.06 |
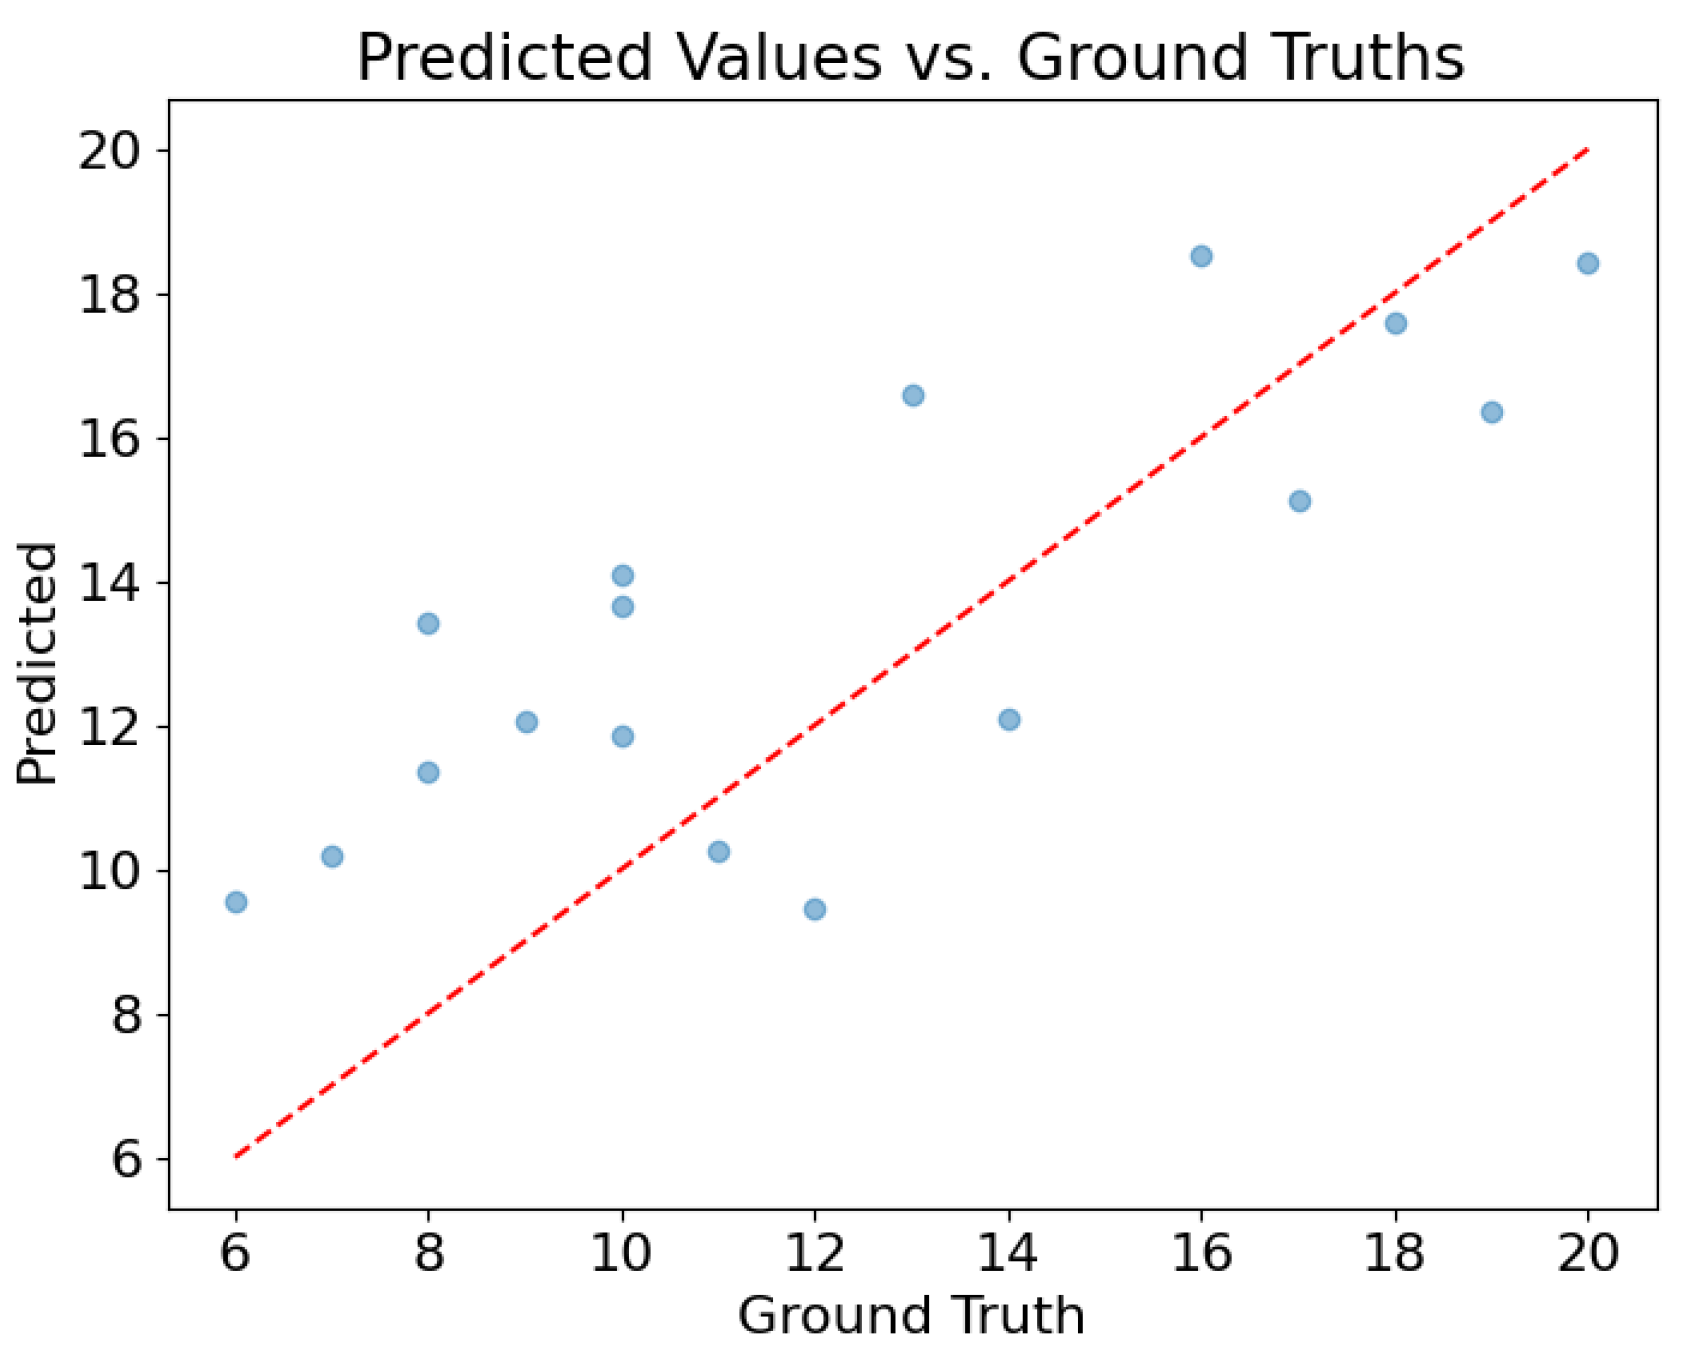
| Test Set | Mean Absolute Error | Standard Deviation |
|---|---|---|
| Vienna | 2.70 | 2.65 |
| Madrid | 2.88 | 3.55 |
Disclaimer/Publisher’s Note: The statements, opinions and data contained in all publications are solely those of the individual author(s) and contributor(s) and not of MDPI and/or the editor(s). MDPI and/or the editor(s) disclaim responsibility for any injury to people or property resulting from any ideas, methods, instructions or products referred to in the content. |
© 2023 by the authors. Licensee MDPI, Basel, Switzerland. This article is an open access article distributed under the terms and conditions of the Creative Commons Attribution (CC BY) license (https://creativecommons.org/licenses/by/4.0/).
Share and Cite
Baldisseri, F.; Wrona, A.; Menegatti, D.; Pietrabissa, A.; Battilotti, S.; Califano, C.; Cristofaro, A.; Di Giamberardino, P.; Facchinei, F.; Palagi, L.; et al. Deep Neural Network Regression to Assist Non-Invasive Diagnosis of Portal Hypertension. Healthcare 2023, 11, 2603. https://doi.org/10.3390/healthcare11182603
Baldisseri F, Wrona A, Menegatti D, Pietrabissa A, Battilotti S, Califano C, Cristofaro A, Di Giamberardino P, Facchinei F, Palagi L, et al. Deep Neural Network Regression to Assist Non-Invasive Diagnosis of Portal Hypertension. Healthcare. 2023; 11(18):2603. https://doi.org/10.3390/healthcare11182603
Chicago/Turabian StyleBaldisseri, Federico, Andrea Wrona, Danilo Menegatti, Antonio Pietrabissa, Stefano Battilotti, Claudia Califano, Andrea Cristofaro, Paolo Di Giamberardino, Francisco Facchinei, Laura Palagi, and et al. 2023. "Deep Neural Network Regression to Assist Non-Invasive Diagnosis of Portal Hypertension" Healthcare 11, no. 18: 2603. https://doi.org/10.3390/healthcare11182603
APA StyleBaldisseri, F., Wrona, A., Menegatti, D., Pietrabissa, A., Battilotti, S., Califano, C., Cristofaro, A., Di Giamberardino, P., Facchinei, F., Palagi, L., Giuseppi, A., & Delli Priscoli, F. (2023). Deep Neural Network Regression to Assist Non-Invasive Diagnosis of Portal Hypertension. Healthcare, 11(18), 2603. https://doi.org/10.3390/healthcare11182603