
The Associations of Body Mass Index, Body Image, Perceived Stress, and Mental Health among Female Nursing Students: A Cross-Sectional Study in Taiwan


Abstract
:1. Introduction
2. Materials and Methods
2.1. Design
2.2. Setting and Sample
- First-year students may perceive more stress [32].
2.3. Data Collection and Measures
2.3.1. Procedure
2.3.2. Demographic Data
2.3.3. Body Mass Index
2.3.4. Multidimensional Body-Self Relations Questionnaire—Appearance Scale
2.3.5. Perceived Stress Scale
2.3.6. Chinese Health Questionnaire
2.4. Data Analysis
3. Results
3.1. Characteristics of the Participants
3.2. Associations of Self-Reported BMI and Other Variables
3.3. Differences in Variables among BMI Subgroups
4. Discussion
- Self-reported BMI had no significant associations with computer and smartphone use, exercise participation, dietary habits, mental health, and perceived stress;
- Self-reported BMI was correlated to body image and expected BMI;
- There were differences in body image and expected BMI among BMI subgroups.
4.1. Associations of Self-Reported BMI and Other Variables
4.2. Differences in Variables among BMI Subgroups
4.3. Suggestions and Limitations
4.3.1. Body Image
4.3.2. Dietary Habits
4.3.3. Perceived Stress and Mental Health
4.3.4. Exercise
4.3.5. Limitations
5. Conclusions
Author Contributions
Funding
Institutional Review Board Statement
Informed Consent Statement
Data Availability Statement
Acknowledgments
Conflicts of Interest
References
- GBD Obesity Collaborators. Health effects of overweight and obesity in 195 countries over 25 years. N. Engl. J. Med. 2017, 377, 13–27. [Google Scholar] [CrossRef] [PubMed]
- World Health Organization. Obesity and Overweight. Available online: https://www.who.int/news-room/fact-sheets/detail/obesity-and-overweight (accessed on 30 July 2023).
- Jiang, Y.; Wang, J.; Wu, S.; Li, N.; Wang, Y.; Liu, J.; Xu, X.; He, Z.; Cheng, Y.; Zeng, X. Association between take-out food consumption and obesity among Chinese university students: A cross-sectional study. Int. J. Environ. Res. Public Health 2019, 16, 1071. [Google Scholar] [CrossRef]
- Ahmed, J.; Alnasir, F.; Jaradat, A.; Al Marabheh, A.J.; Hamadeh, R.R. Association of overweight and obesity with high fast food consumption by Gulf Cooperation Council medical students. Ecol. Food Nutr. 2019, 58, 495–510. [Google Scholar] [CrossRef] [PubMed]
- Bennasar-Veny, M.; Yañez, A.M.; Pericas, J.; Ballester, L.; Fernandez-Dominguez, J.C.; Tauler, P.; Aguilo, A. Cluster analysis of health-related lifestyles in university students. Int. J. Environ. Res. Public Health 2020, 17, 1776. [Google Scholar] [CrossRef] [PubMed]
- Yasuda, T. Anthropometric, body composition, and somatotype characteristics of Japanese young women: Implications for normal-weight obesity syndrome and sarcopenia diagnosis criteria. Interv. Med. Appl. Sci. 2019, 11, 117–121. [Google Scholar] [CrossRef]
- You, S.; Shin, K. Sociocultural influences, drive for thinness, drive for muscularity, and body dissatisfaction among Korean undergraduates. Int. J. Environ. Res. Public Health 2020, 17, 5260. [Google Scholar] [CrossRef] [PubMed]
- Radwan, H.; Hasan, H.A.; Ismat, H.; Hakim, H.; Khalid, H.; Al-Fityani, L.; Mohammed, R.; Ayman, A. Body mass index perception, body image dissatisfaction and their relations with weight-related behaviors among university students. Int. J. Environ. Res. Public Health 2019, 16, 1541. [Google Scholar] [CrossRef]
- Kim, N.; Lee, J. The associations of appearance comparisons with peers and Chinese and Korean media figures with thin-ideal internalization, body dissatisfaction, and the drive for thinness among female Korean-Chinese college students in China. Int. J. Commun. 2019, 13, 4376–4399. [Google Scholar]
- McLester, C.N.; Hicks, C.S.; Miller, L.; McLester, J.R. An investigation of the differences between perceived vs. measured body composition, social physique anxiety, and overall appearance satisfaction among college students. Int. J. Exerc. Sci. 2018, 11, 957–967. [Google Scholar]
- Davies, A.; Wellard-Cole, L.; Rangan, A.; Allman-Farinelli, M. Validity of self-reported weight and height for BMI classification: A cross-sectional study among young adults. Nutrition 2020, 71, 110622. [Google Scholar] [CrossRef]
- Grasdalsmoen, M.; Eriksen, H.R.; Lønning, K.J.; Sivertsen, B. Physical exercise and body-mass index in young adults: A national survey of Norwegian university students. BMC Public Health 2019, 19, 1354. [Google Scholar] [CrossRef] [PubMed]
- Grimaldi-Puyana, M.; Fernández-Batanero, J.M.; Fennell, C.; Sañudo, B. Associations of objectively-assessed smartphone use with physical activity, sedentary behavior, mood, and sleep quality in young adults: A cross-sectional study. Int. J. Environ. Res. Public Health 2020, 17, 3499. [Google Scholar] [CrossRef] [PubMed]
- Zhai, X.; Ye, M.; Wang, C.; Gu, Q.; Huang, T.; Wang, K.; Chen, Z.; Fan, X. Associations among physical activity and smartphone use with perceived stress and sleep quality of Chinese college students. Ment. Health Phys. Act. 2020, 18, 100323. [Google Scholar] [CrossRef]
- Chen, B.; Liu, F.; Ding, S.; Ying, X.; Wang, L.; Wen, Y. Gender differences in factors associated with smartphone addiction: A cross-sectional study among medical college students. BMC Psychiatry 2017, 17, 341. [Google Scholar] [CrossRef] [PubMed]
- Pfeiler, T.M.; Egloff, B. Personality and eating habits revisited: Associations between the Big Five, food choices, and body mass index in a representative Australian sample. Appetite 2020, 149, 104607. [Google Scholar] [CrossRef] [PubMed]
- Hootman, K.C.; Guertin, K.A.; Cassano, P.A. Stress and psychological constructs related to eating behavior are associated with anthropometry and body composition in young adults. Appetite 2018, 125, 287–294. [Google Scholar] [CrossRef]
- Haidar, S.A.; De Vries, N.; Karavetian, M.; El-Rassi, R. Stress, anxiety, and weight gain among university and college students: A systematic review. J. Acad. Nutr. Diet. 2018, 118, 261–274. [Google Scholar] [CrossRef]
- Almomani, E.Y.; Qablan, A.M.; Almomany, A.M.; Atrooz, F.Y. The coping strategies followed by university students to mitigate the COVID-19 quarantine psychological impact. Curr. Psychol. 2021, 40, 5772–5781. [Google Scholar] [CrossRef]
- Cilar, L.; Barr, O.; Štiglic, G.; Pajnkihar, M. Mental well-being among nursing students in Slovenia and Northern Ireland: A survey. Nurse Educ. Pract. 2019, 39, 130–135. [Google Scholar] [CrossRef]
- He, F.X.; Turnbull, B.; Kirshbaum, M.N.; Phillips, B.; Klainin-Yobas, P. Assessing stress, protective factors and psychological well-being among undergraduate nursing students. Nurse Educ. Today 2018, 68, 4–12. [Google Scholar] [CrossRef]
- Choi, J. Impact of stress levels on eating behaviors among college students. Nutrients 2020, 12, 1241. [Google Scholar] [CrossRef]
- Cohen, S.; Williamson, G. Perceived stress in a probability sample of the United States. In The Social Psychology of Health: Claremont Symposium on Applied Social Psychology; Spacapan, S., Oskamp, S., Eds.; Sage: Newbury Park, CA, USA, 1988; pp. 31–67. [Google Scholar]
- Denovan, A.; Dagnall, N.; Dhingra, K.; Grogan, S. Evaluating the Perceived Stress Scale among UK university students: Implications for stress measurement and management. Stud. High. Educ. 2019, 44, 120–133. [Google Scholar] [CrossRef]
- Zhang, Y.; Peters, A.; Chen, G. Perceived stress mediates the associations between sleep quality and symptoms of anxiety and depression among college nursing students. Int. J. Nurs. Educ. Scholarsh. 2018, 15, 20170020. [Google Scholar] [CrossRef] [PubMed]
- Karaca, A.; Yildirim, N.; Cangur, S.; Acikgoz, F.; Akkus, D. Relationship between mental health of nursing students and coping, self-esteem and social support. Nurse Educ. Today 2019, 76, 44–50. [Google Scholar] [CrossRef] [PubMed]
- Deary, I.J.; Watson, R.; Hogston, R. A longitudinal cohort study of burnout and attrition in nursing students. J. Adv. Nurs. 2003, 43, 71–81. [Google Scholar] [CrossRef] [PubMed]
- Watson, R.; Watanabe, K.; Yamashita, A.; Yamaguchi, M.; Bradbury-Jones, C.; Irvine, F. A Japanese version of the stressors in nursing students (SINS) scale. Int. J. Nurs. Sci. 2018, 5, 181–185. [Google Scholar] [CrossRef]
- Watson, R.; Yanhua, C.; Ip, M.Y.; Smith, G.D.; Wong, T.K.; Deary, I.J. The structure of stress: Confirmatory factor analysis of a Chinese version of the stressors in Nursing Students Scale (SINS). Nurse Educ. Today 2013, 33, 160–165. [Google Scholar] [CrossRef]
- Allen, D. Tackling the challenges of nurses and weight gain. Nurs. Stand. 2018, 33, 53–55. [Google Scholar] [CrossRef]
- Yeh, T.-L.; Chen, H.-H.; Chiu, H.-H.; Chiu, Y.-H.; Hwang, L.-C.; Wu, S.-L. Morbidity associated with overweight and obesity in health personnel: A 10-year retrospective of hospital-based cohort study in Taiwan. Diabetes Metab. Syndr. Obes. Targets Ther. 2019, 12, 267–274. [Google Scholar] [CrossRef]
- Maymon, R.; Hall, N.C. A review of first-year student stress and social support. Soc. Sci. 2021, 10, 472. [Google Scholar] [CrossRef]
- Faul, F.; Erdfelder, E.; Lang, A.-G.; Buchner, A. G* Power 3: A flexible statistical power analysis program for the social, behavioral, and biomedical sciences. Behav. Res. Methods 2007, 39, 175–191. [Google Scholar] [CrossRef] [PubMed]
- Ho, C.-C.; Lai, H.-R.; Yao, Y.-Y. The relationship between dietary behavior and cognition of school dietary policy and environment among technologic university students. Chin. J. Sch. Health 2009, 67–86. [Google Scholar] [CrossRef]
- Yeh, S.-R.; Chang, C.-M. A study of relationship among body image, exercise participation, and self-esteem of collegiate students. J. Sport Leis. Hosp. Res. 2008, 3, 105–120. [Google Scholar] [CrossRef]
- Fox, K.R. Physical Self-Perceptions and Exercise Involvement. Ph.D. Thesis, Arizona State University, Tempe, AZ, USA, 1987. [Google Scholar]
- Regional Office for the Western Pacific of the World Health Organization. The Asia-Pacific Perspective: Redefining Obesity and Its Treatment. Available online: https://apps.who.int/iris/handle/10665/206936 (accessed on 18 August 2017).
- Cash, T.F. The Multidimensional Body-Self Relations Questionnaire: Users’ Manual, 3rd ed. Available online: http://www.body-images.com/assessments/ (accessed on 11 September 2015).
- Leung, D.Y.; Lam, T.-H.; Chan, S.S. Three versions of Perceived Stress Scale: Validation in a sample of Chinese cardiac patients who smoke. BMC Public Health 2010, 10, 513. [Google Scholar] [CrossRef]
- Cheng, T.-A.; Williams, P. The design and development of a screening questionnaire (CHQ) for use in community studies of mental disorders in Taiwan. Psychol. Med. 1986, 16, 415–422. [Google Scholar] [CrossRef]
- Cheng, T.A.; Wu, J.; Chong, M.; Williams, P. Internal consistency and factor structure of the Chinese Health Questionnaire. Acta Psychiatr. Scand. 1990, 82, 304–308. [Google Scholar] [CrossRef]
- Polit, D.F. Statistics and Data Analysis for Nursing Research, 2nd ed.; Pearson: Boston, MA, USA, 2010. [Google Scholar]
- Rosner, B. Fundamentals of Biostatistics, 6th ed.; Thomson-Brooks/Cole: Belmont, CA, USA, 2006. [Google Scholar]
- Yönder Ertem, M.; Karakaş, M. Relationship between emotional eating and coping with stress of nursing students. Perspect. Psychiatr. Care 2021, 57, 433–442. [Google Scholar] [CrossRef]
- Erikson, E.H. Eight ages of man. Int. J. Psychiatry 1966, 2, 281–307. [Google Scholar]
- Martinez-Gomez, D.; Ortega, F.B.; Hamer, M.; Lopez-Garcia, E.; Struijk, E.; Sadarangani, K.P.; Lavie, C.J.; Rodríguez-Artalejo, F. Physical activity and risk of metabolic phenotypes of obesity: A prospective Taiwanese cohort study in more than 200,000 adults. Mayo Clin. Proc. 2019, 94, 2209–2219. [Google Scholar] [CrossRef] [PubMed]
- Yamamiya, Y.; Shimai, S.; Homan, K.J. Exploring the gratitude model of body appreciation and intuitive eating among Japanese women. Body Image 2021, 36, 230–237. [Google Scholar] [CrossRef]
- Dumuid, D.; Olds, T.; Sawyer, S.M. Moving beyond more: Towards a healthy balance of daily behaviours. Lancet 2021, 398, 373–374. [Google Scholar] [CrossRef]
- Dunstan, D.W.; Kingwell, B.A.; Larsen, R.; Healy, G.N.; Cerin, E.; Hamilton, M.T.; Shaw, J.E.; Bertovic, D.A.; Zimmet, P.Z.; Salmon, J.; et al. Breaking up prolonged sitting reduces postprandial glucose and insulin responses. Diabetes Care 2012, 35, 976–983. [Google Scholar] [CrossRef]
- Sallis, R.; Franklin, B.; Joy, L.; Ross, R.; Sabgir, D.; Stone, J. Strategies for promoting physical activity in clinical practice. Prog. Cardiovasc. Dis. 2015, 57, 375–386. [Google Scholar] [CrossRef]
- World Health Organization. Physical Activity Fact Sheet. Available online: https://www.who.int/publications/i/item/WHO-HEP-HPR-RUN-2021.2 (accessed on 8 July 2023).
- Romeo, A.; Edney, S.; Plotnikoff, R.; Curtis, R.; Ryan, J.; Sanders, I.; Crozier, A.; Maher, C. Can smartphone apps increase physical activity? Systematic review and meta-analysis. J. Med. Internet Res. 2019, 21, e12053. [Google Scholar] [CrossRef] [PubMed]
- Kerr, N.A.; Yore, M.M.; Ham, S.A.; Dietz, W.H. Increasing stair use in a worksite through environmental changes. Am. J. Health Promot. 2004, 18, 312–315. [Google Scholar] [CrossRef] [PubMed]
- Martínez-Vizcaíno, V.; Pozuelo-Carrascosa, D.P.; García-Prieto, J.C.; Cavero-Redondo, I.; Solera-Martínez, M.; Garrido-Miguel, M.; Díez-Fernández, A.; Ruiz-Hermosa, A.; Sánchez-López, M. Effectiveness of a school-based physical activity intervention on adiposity, fitness and blood pressure: MOVI-KIDS study. Br. J. Sport. Med. 2020, 54, 279–285. [Google Scholar] [CrossRef] [PubMed]
- Garrett, S.L.; Pina-Thomas, D.M.; Peterson, K.A.; Benton, M.J. Tracking physical activity in baccalaureate nursing students in the United States prior to graduation: A longitudinal study. Nurse Educ. Today 2019, 80, 28–33. [Google Scholar] [CrossRef]


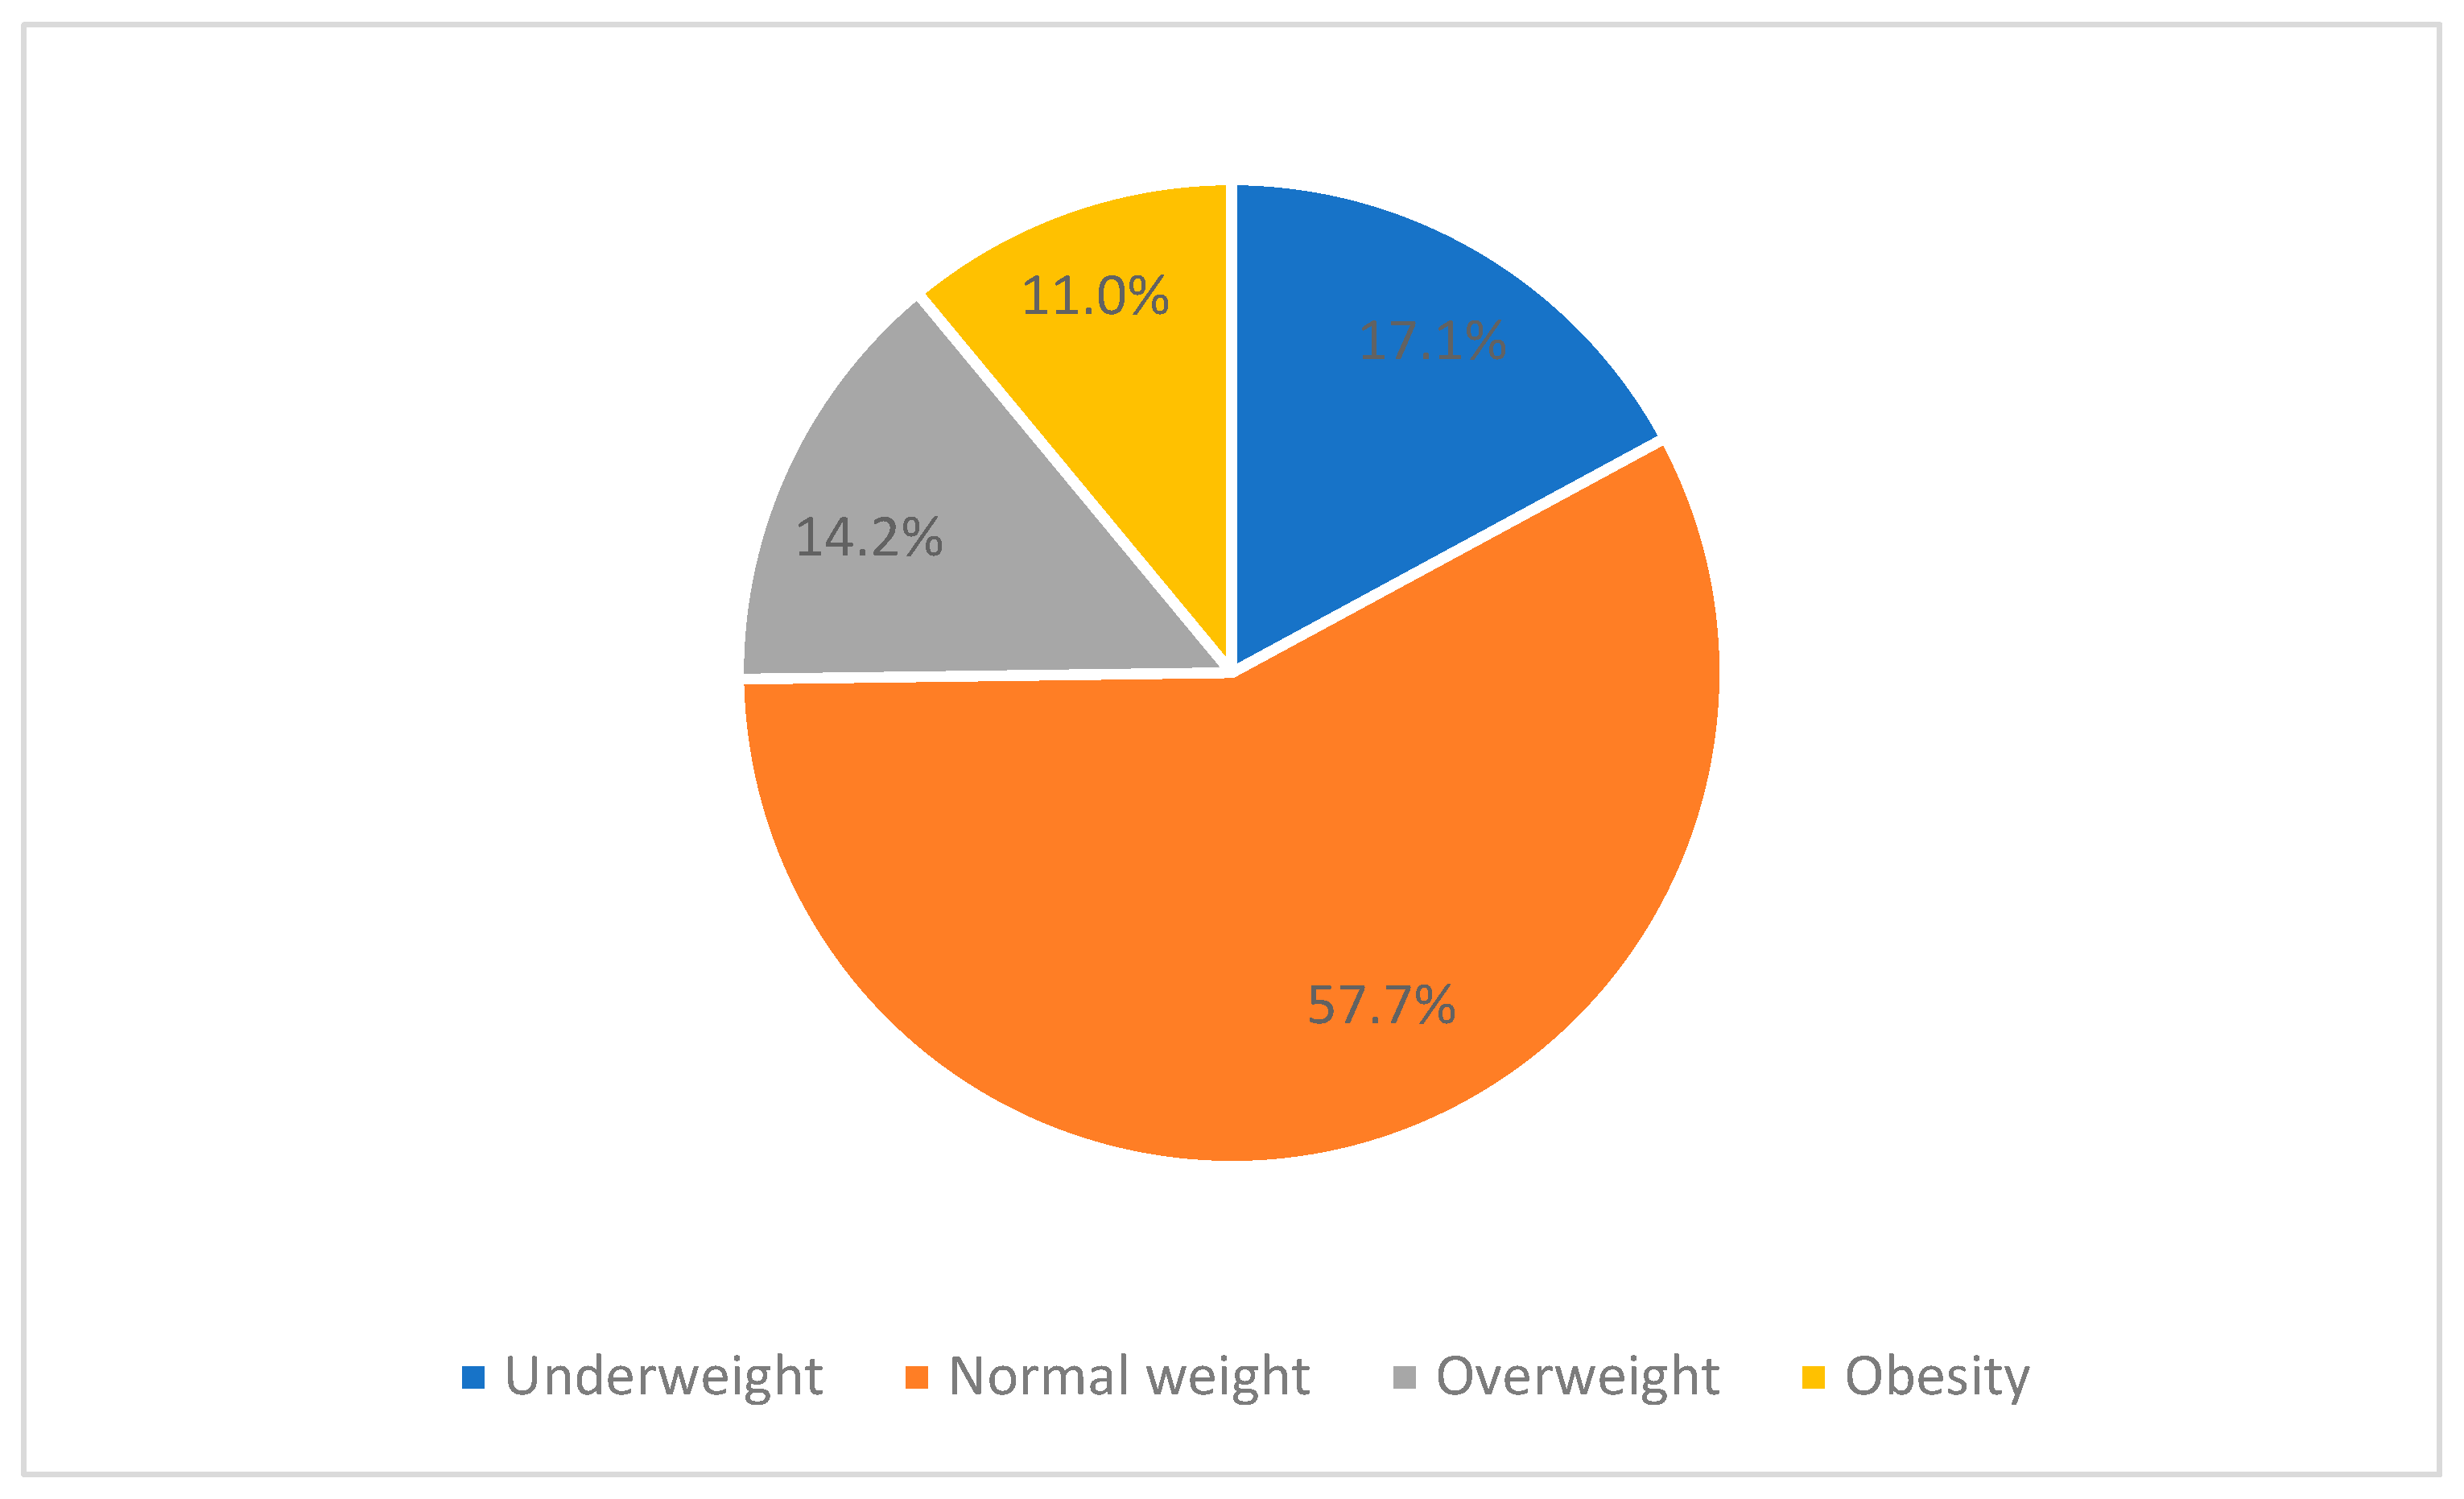
| Weight Status | World Health Organization [2] | The Regional Office for the Western Pacific of the World Health Organization [37] |
|---|---|---|
| Underweight | BMI < 18.5 kg/m2 | BMI < 18.5 kg/m2 |
| Normal weight | 18.5 kg/m2 ≤ BMI < 25 kg/m2 | 18.5 kg/m2 ≤ BMI < 23 kg/m2 |
| Overweight | 25 kg/m2 ≤ BMI < 30 kg/m2 | 23 kg/m2 ≤ BMI < 25 kg/m2 |
| Obesity | BMI ≥ 30 kg/m2 | BMI ≥ 25 kg/m2 |
| Variable | n | % | Median | IQR |
|---|---|---|---|---|
| Bachelor’s degree program | ||||
| 145 | 46.8 | ||
| Second-year students | 9 | 2.9 | ||
| Third-year students | 94 | 30.3 | ||
| Fourth-year students | 42 | 13.5 | ||
| 165 | 53.2 | ||
| First-year students | 131 | 42.3 | ||
| Second-year students | 34 | 11.0 | ||
| Accommodation | ||||
| Dormitory | 305 | 98.4 | ||
| Rented room | 2 | 0.6 | ||
| Home (with parents) | 3 | 1.0 | ||
| Alcohol use in previous month | ||||
| No | 296 | 95.5 | ||
| Yes | 14 | 4.5 | ||
| Cigarette use in previous month | ||||
| No | 309 | 99.7 | ||
| Yes | 1 | 0.3 | ||
| Weight management experience | ||||
| No | 56 | 18.1 | ||
| Yes | 254 | 81.9 | ||
| Purpose of weight management | ||||
| Increase weight | 2 | 0.6 | ||
| Decrease weight | 201 | 64.8 | ||
| Maintain weight | 51 | 16.5 | ||
| Non-applicable | 56 | 18.1 | ||
| Weight management strategies (multiple response type) | ||||
| Diet control | 223 | 71.9 | ||
| Exercise control | 213 | 68.7 | ||
| Western medication | 10 | 3.2 | ||
| Auricular acupressure | 2 | 0.6 | ||
| Exercise with a companion | ||||
| Yes | 175 | 56.5 | ||
| No | 50 | 16.1 | ||
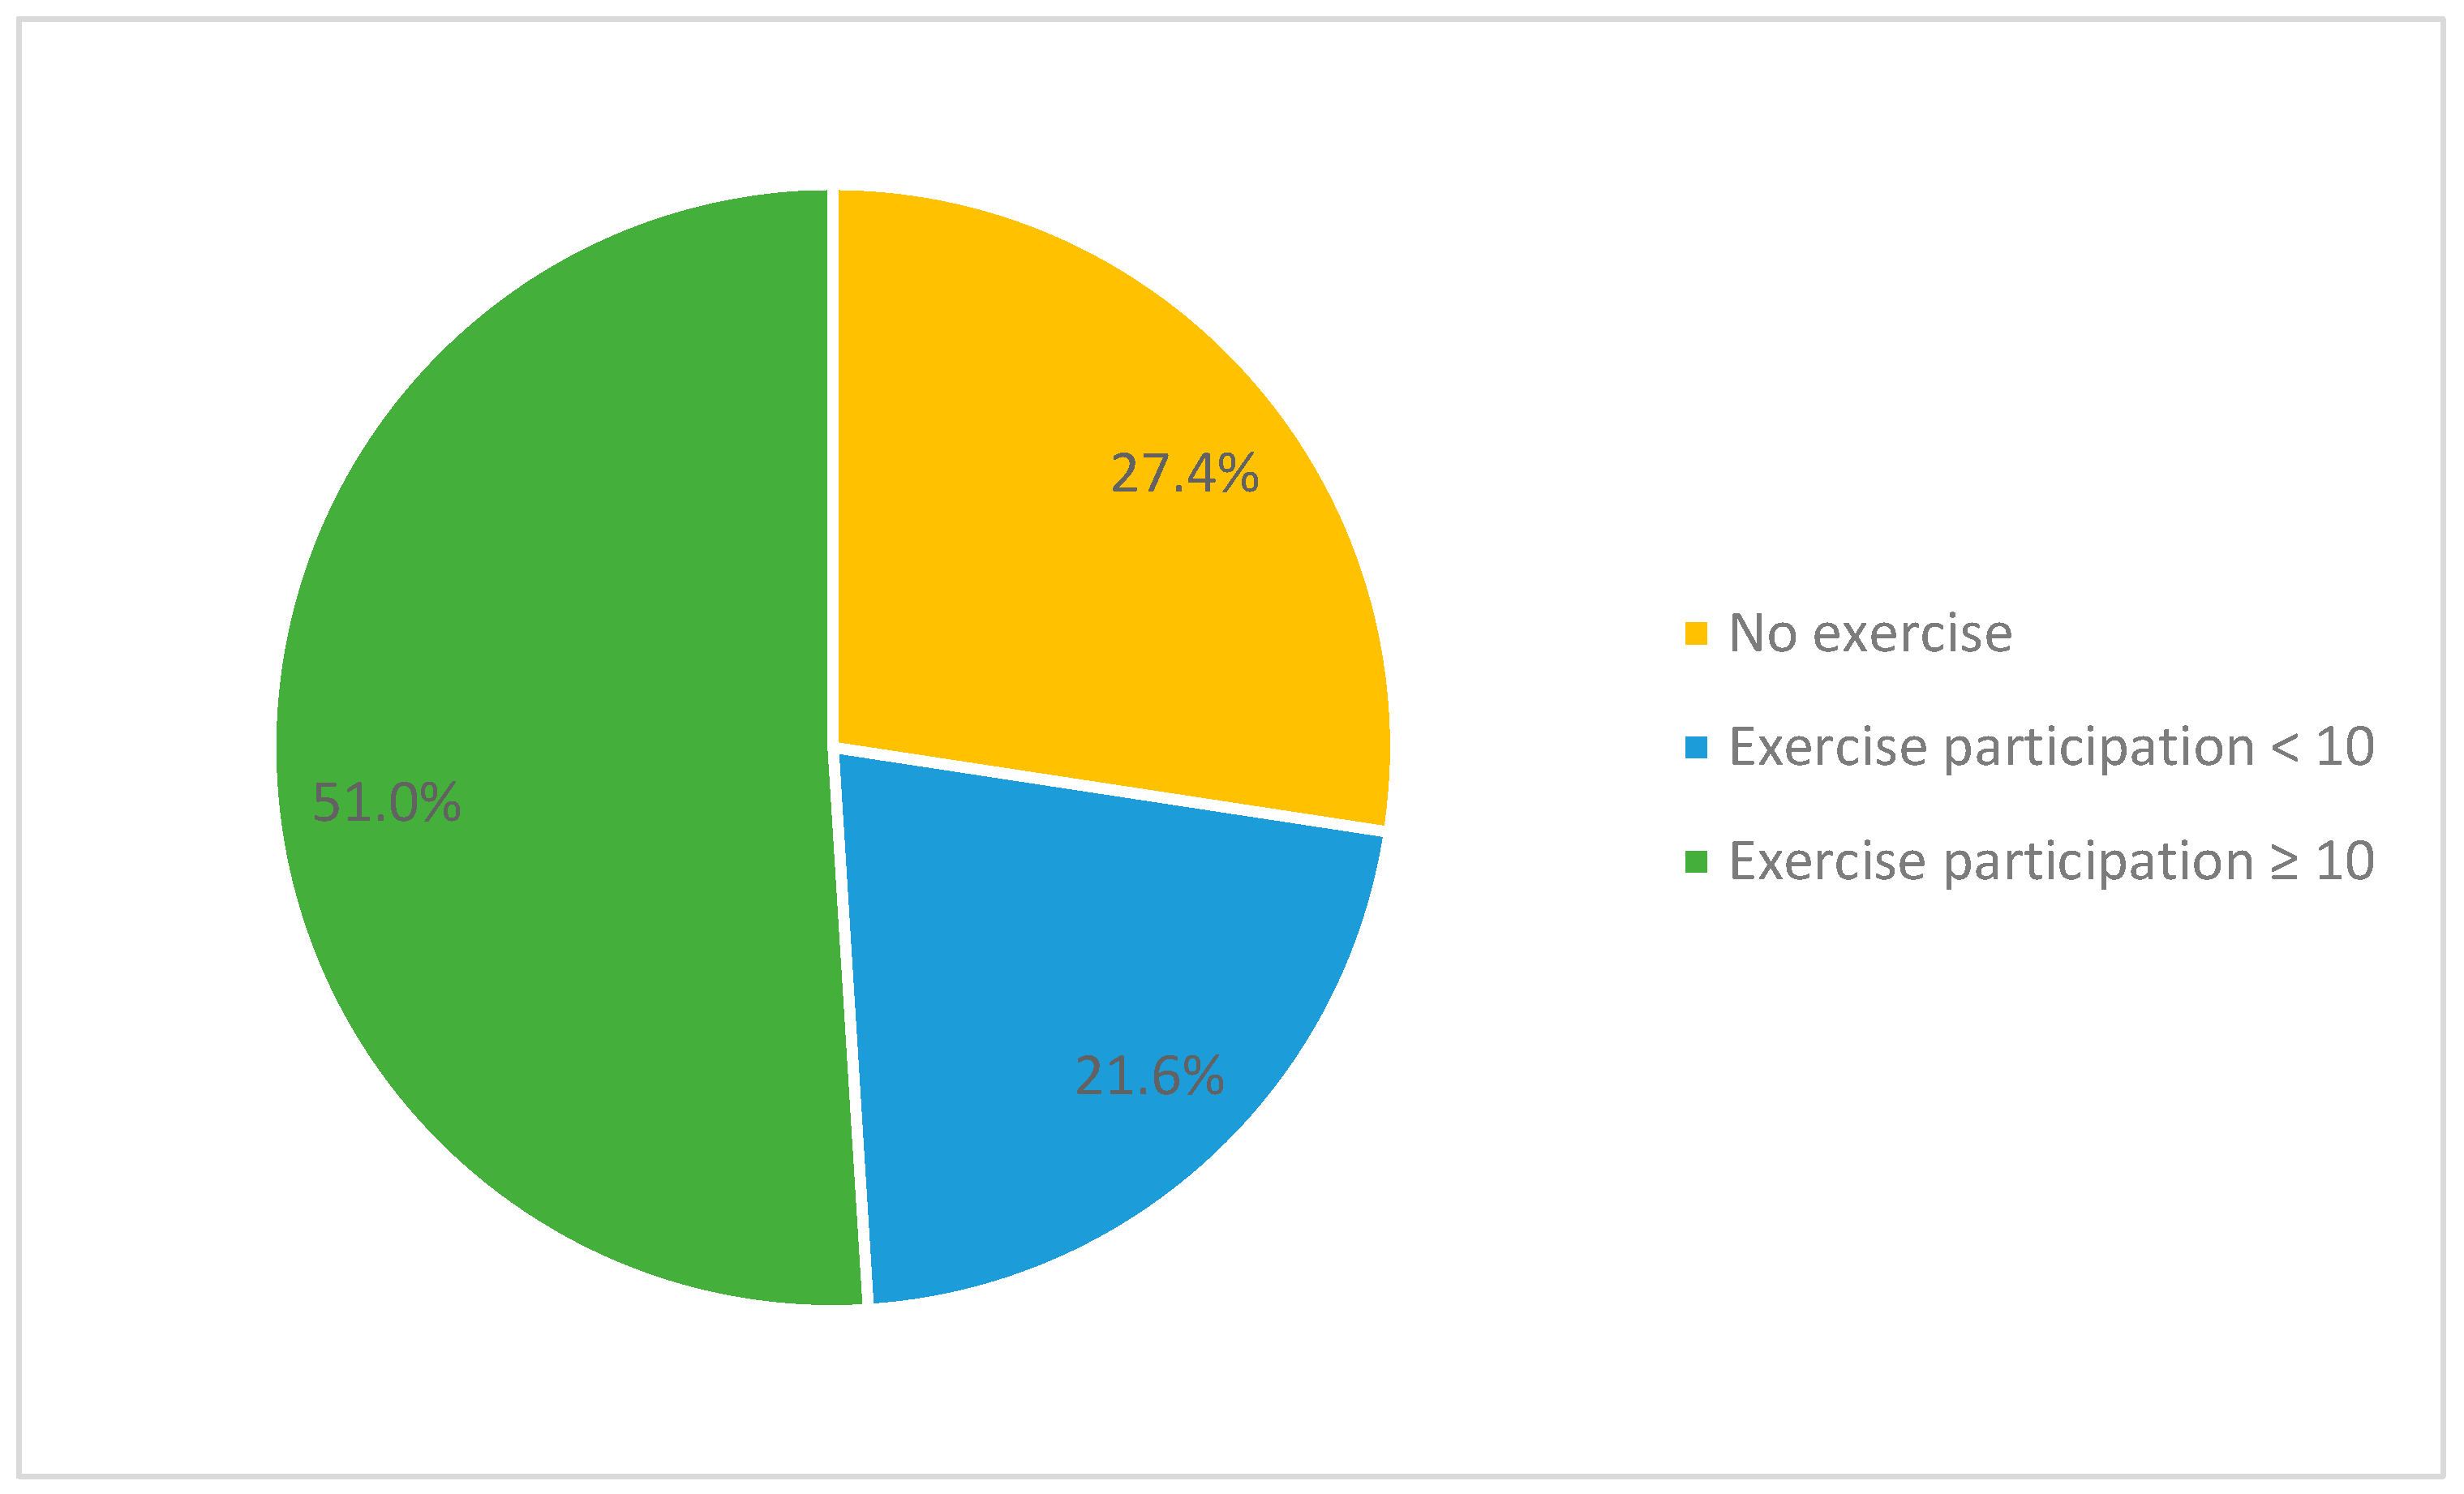
| Non-applicable (no exercise) | 85 | 27.4 | ||
| Exercise participation | 10 | 15 | ||
| Computer use (h/wk) | 10 | 16 | ||
| Smartphone use (h/wk) | 28 | 35 | ||
| Dietary habits | 19 | 6 | ||
| Food choices | 9 | 4 | ||
| Eating situations | 10 | 3 | ||
| Self-reported body height (cm) | 160 | 8 | ||
| Expected body height (cm) | 163 | 5 | ||
| Self-reported body weight (kg) | 54 | 10 | ||
| Expected body weight (kg) | 50 | 6 | ||
| Self-reported BMI (kg/m2) | 20.83 | 3.66 | ||
| Expected BMI (kg/m2) | 18.37 | 1.90 | ||
| PSS | 18 | 7 | ||
| MBSRQ-AS | ||||
| Appearance evaluation | 3.14 | 0.71 | ||
| Appearance orientation | 3.67 | 0.67 | ||
| Body area satisfaction | 3.00 | 0.67 | ||
| Overweight preoccupation | 2.75 | 1.00 | ||
| Self-classified weight | 3.50 | 1.00 | ||
| CHQ (original scores) | 21 | 7 | ||
| Somatic symptoms | 5 | 3 | ||
| Anxiety/worry | 4 | 2 | ||
| Depression and poor relations | 10 | 3 | ||
| Poor sleep | 2 | 1 | ||
| CHQ (transforming scores) | 2 | 1 | ||
| Somatic symptoms | 0 | 0 | ||
| Anxiety/worry | 0 | 1 | ||
| Depression and poor relations | 2 | 1 | ||
| Poor sleep | 2 | 1 | ||
| Normal status: ≤2 | 170 | 54.8 | ||
| Mental disturbance: ≥3 | 140 | 45.2 |
| Variable | 1 | 2 | 3 | 4 | 5 | 6 | 7 | 8 | 9 | 10 | 11 | 12 | |
|---|---|---|---|---|---|---|---|---|---|---|---|---|---|
| 1 | Self-reported BMI | – | |||||||||||
| 2 | Computer use | 0.00 | – | ||||||||||
| 3 | Smartphone use | −0.11 | 0.28 ** | – | |||||||||
| 4 | Exercise participation | 0.04 | 0.01 | −0.06 | – | ||||||||
| 5 | Dietary habits | −0.04 | 0.00 | −0.17 ** | 0.05 | – | |||||||
| 6 | CHQ | 0.00 | 0.11 | 0.02 | −0.05 | −0.07 | – | ||||||
| 7 | PSS | 0.04 | 0.09 | 0.03 | −0.02 | −0.20 ** | 0.55 ** | – | |||||
| 8 | AE | −0.33 ** | −0.09 | 0.03 | 0.01 | 0.14 * | −0.24 ** | −0.24 ** | – | ||||
| 9 | AO | −0.02 | −0.01 | 0.18 ** | 0.08 | −0.09 | −0.04 | −0.02 | 0.20 ** | – | |||
| 10 | BAS | −0.34 ** | −0.10 | −0.03 | 0.07 | 0.18 ** | −0.23 ** | −0.26 ** | 0.66 ** | −0.03 | – | ||
| 11 | OP | 0.38 ** | −0.06 | −0.08 | 0.10 | −0.08 | 0.09 | 0.20 ** | −0.15 ** | 0.36 ** | −0.32 ** | – | |
| 12 | SCW | 0.80 ** | 0.08 | −0.07 | 0.08 | −0.06 | 0.08 | 0.15 ** | −0.40 ** | 0.04 | −0.46 ** | 0.44 ** | – |
| 13 | Expected BMI | 0.71 ** | 0.02 | −0.10 | 0.05 | 0.05 | −0.05 | −0.06 | −0.11 * | −0.09 | −0.07 | 0.12 * | 0.52 ** |
| Underweight a (n = 53) | Normal weight b (n = 179) | Overweight c (n = 44) | Obesity d (n = 34) | ||||||||
|---|---|---|---|---|---|---|---|---|---|---|---|
| Variable | Median | (IQR) | Median | (IQR) | Median | (IQR) | Median | (IQR) | p | Post Hoc | |
| Computer use | 8 | (20) | 12 | (16) | 9.5 | (21) | 14 | (15) | 0.73 | ||
| Smartphone use | 30 | (38) | 28 | (34) | 26 | (23.25) | 28 | (45.75) | 0.26 | ||
| Exercise participation | 8 | (13.25) | 10 | (15) | 10 | (15) | 9 | (17) | 0.84 | ||
| Dietary habits | 19 | (6) | 19 | (6) | 19.5 | (6.75) | 18 | (6.5) | 0.59 | ||
| PSS | 17 | (6.5) | 18 | (7) | 19 | (5.75) | 16.5 | (6) | 0.62 | ||
| CHQ | 21 | (8.5) | 21 | (5) | 20 | (6.75) | 21 | (8) | 0.94 | ||
| MBSRQ-AS | |||||||||||
| AE | 3.29 | (0.57) | 3.14 | (0.86) | 2.86 | (0.68) | 2.64 | (0.86) | <0.001 | a > b, c, d; b > d | |
| AO | 3.67 | (0.83) | 3.67 | (0.67) | 3.67 | (0.48) | 3.58 | (0.69) | 0.92 | ||
| BAS | 3.33 | (0.83) | 3.00 | (0.67) | 2.78 | (0.67) | 2.78 | (0.72) | <0.001 | a > b, c, d; b > d | |
| OP | 2.00 | (1.13) | 2.75 | (0.75) | 3.13 | (0.75) | 3.25 | (0.75) | <0.001 | a < b, c, d | |
| SCW | 2.00 | (1.25) | 3.50 | (0.50) | 4.00 | (0.38) | 4.50 | (1.00) | <0.001 | a < b < c, d | |
| Expected BMI | 17.58 | (1.36) | 18.37 | (1.38) | 20.30 | (1.76) | 21.48 | (3.09) | <0.001 | a < b < c, d | |
Disclaimer/Publisher’s Note: The statements, opinions and data contained in all publications are solely those of the individual author(s) and contributor(s) and not of MDPI and/or the editor(s). MDPI and/or the editor(s) disclaim responsibility for any injury to people or property resulting from any ideas, methods, instructions or products referred to in the content. |
© 2023 by the authors. Licensee MDPI, Basel, Switzerland. This article is an open access article distributed under the terms and conditions of the Creative Commons Attribution (CC BY) license (https://creativecommons.org/licenses/by/4.0/).
Share and Cite
Huang, C.-F.; Chou, F.-H.; Chang, C.-H.; Guo, S.-E. The Associations of Body Mass Index, Body Image, Perceived Stress, and Mental Health among Female Nursing Students: A Cross-Sectional Study in Taiwan. Healthcare 2023, 11, 2426. https://doi.org/10.3390/healthcare11172426
Huang C-F, Chou F-H, Chang C-H, Guo S-E. The Associations of Body Mass Index, Body Image, Perceived Stress, and Mental Health among Female Nursing Students: A Cross-Sectional Study in Taiwan. Healthcare. 2023; 11(17):2426. https://doi.org/10.3390/healthcare11172426
Chicago/Turabian StyleHuang, Ching-Feng, Fan-Hao Chou, Chia-Hao Chang, and Su-Er Guo. 2023. "The Associations of Body Mass Index, Body Image, Perceived Stress, and Mental Health among Female Nursing Students: A Cross-Sectional Study in Taiwan" Healthcare 11, no. 17: 2426. https://doi.org/10.3390/healthcare11172426
APA StyleHuang, C.-F., Chou, F.-H., Chang, C.-H., & Guo, S.-E. (2023). The Associations of Body Mass Index, Body Image, Perceived Stress, and Mental Health among Female Nursing Students: A Cross-Sectional Study in Taiwan. Healthcare, 11(17), 2426. https://doi.org/10.3390/healthcare11172426