Abstract
The goal of this study was to examine how regular physical activity before and during pregnancy affected life quality throughout pregnancy. Between July 2020 and May 2021, 218 pregnant women were recruited from 11 outpatient clinics for this survey. Data were collected prospectively in a panel format beginning with the 10th gestational week over a 20-week period. Prior to pregnancy, a previous time point was also defined. The International Physical Activity Questionnaire, the EQ-5D-3L questionnaire, and the EQ-VAS questionnaire were used to collect data on the duration and intensity of daily physical exercises, as well as to assess health-related quality of life and self-estimated health status. The final survey included data from 113 women. During pregnancy, physical activity decreased dramatically. The duration of strenuous activities, but not moderate activities, was significantly reduced. Continuous physical activity independently predicted higher life quality scores at all points of assessment. Cases who participated in moderate and strenuous activities on a regular basis had higher self-estimated health status scores than cases who only participated in moderate activity. Instead of focusing solely on specific types of physical activity, we believe that strategies for motivating all pregnant women to be constantly active should be developed.
1. Introduction
Studies show that regular exercise improves maternal health. It enhances maternal cardiovascular function, reduces musculoskeletal discomfort, diminishes weight gain, and decreases the risk of preterm birth, gestational diabetes, and gestational hypertension [1].
Physical inactivity has been identified as the fourth leading risk factor for global early mortality. As a result, national and international guidelines recommend physical activity prior to and following pregnancy [2]. Despite the evident benefit, numerous studies showed that women reduced or even stopped their physical activity after the onset of pregnancy [3,4,5,6,7,8,9]. Furthermore, sedentary activities increased throughout pregnancy [10,11]. Few women performed the bare minimum of exercise recommendation before or during gestation [12]. In a Brazilian study, 14.8% and 12.9% of the women reported engaging in some type of physical activity prior to and during pregnancy, respectively, with 4.3% active throughout the pregnancy [3]. Most studies found that pregnant women increased their physical activity in the second trimester and decreased it in the third [10,13]. During all three trimesters, the majority of the women walked [3,6].
Using health-related quality of life (HRQoL) scores to assess pregnancy-related symptoms, physical exercise has shown a healthy quality improvement, as in blood pressure [14], depression [15,16], and musculoskeletal-related symptoms [17]. Krzepota et al. reported a significant increase in the life quality level in polish pregnant women with increased physical activity in the second and third trimesters [11]. Similarly, Mourady et al. documented this observation in their study at three measurement time points [18]. Contrarily, Tendais et al. showed that physical and mental components are influenced differently by pregnancy course, regardless of physical activity status [19].
The correlation between physical activity and quality of life, examined in the aforementioned studies, is limited to specific measurement time points, e.g., specific week of gestation (WG) or specific trimester. Therefore, it is not possible to draw objective conclusions about the impact of physical activity on HRQoL levels throughout pregnancy. Consequently, we designed a study to assess the impact of physical activity before and during gestation at different gestational weeks (GW) (10th, 20th, and 30th GW). To the best of our knowledge, no such data have been found in the literature in Germany.
2. Materials and Methods
2.1. Research Goals
The aim of this study is to collect data on the physical and athletic activity and quality of life of pregnant women before pregnancy and in the weeks 10, 20, and 30 of pregnancy in order to answer the following central research questions:
1. How physically and athletically active are pregnant women during pregnancy?
2. Is there a correlation between physical activity and health-related quality of life in pregnant women?
2.2. Study Design and Participants
This survey was conducted between July 2020 and May 2021. Pregnant women were recruited in eleven outpatient clinics. The data were collected prospectively in a panel format over 20-week period. We defined one retrospective time point before the pregnancy (T1) and three prospective measurement time points during pregnancy (T2: 10th GW, T3: 20th GW, and T4: 30th GW). The pre-pregnancy data were collected from participants at the same time as the first interview (T2) to determine whether certain sociodemographic characteristics influence the discontinuation or continuation of physical activity during pregnancy.
Inclusion criteria were pregnant women ≥18 years of age with a voluntary consent, gestational age ≤10th GW, and basic ability to participate in sports. Exclusion criteria were a physician’s prohibition of sports or strenuous physical activity during pregnancy and all pregnant women whose pregnancies were ended before the 30th week of gestation.
2.3. Data Collection
For comparison, the questionnaires were identical at each measurement time point. We used a short form and German version of the International Physical Activity Questionnaire (IPAQ) [20]. We performed the questionnaires as paper–pencil surveys in the physicians’ offices and anonymized the questionnaires by an individual code.
The survey included the questions about duration and intensity of various daily physical exercises such as walking, jogging, swimming, bicycling, inline skating, yoga, gymnastics, aerobics, fitness centre training, and others. We defined moderate activity as a physical effort that require little more than normal breathing. Strenuous activity was defined as a physical effort that require significantly more breathing than normal.
To assess HRQoL, we used a registered simplified three-answer option EQ-5D-3L questionnaire. The EQ-5D questionnaire is a validated tool to measure health-related quality of life in five dimensions (mobility, self-care, general activities, pain/physical discomfort, and anxiety/depression) [20]. Therefore, we registered the study at the Euroquol. We also included a vertical visual analogue scale (EQ-VAS). In which participants were asked to rate their health status on a scale of 0 to 100, with zero representing the worst possible and 100 representing the best possible health status.
Data on age, BMI, number of children, and type of health insurance were also recorded. In addition, in an open-ended response, we asked participants to report their occupation. The responses were classified in three groups as academic, medium level of education, and housewives or unskilled.
2.4. Evaluation
Due to the importance of the impact of continued physical activity on the respective dependent variable (e.g., quality of life), we reported the activity status and intensity, as well as the types of sports practiced at each measurement time point. Another variable investigated was the persistence of physical activity during pregnancy, as shown in Table 1.

Table 1.
Examples of physical activity persistence during pregnancy.
Data for the EQ-5D were calculated using Greiner et al. validated model [20]. The resulting variable is interval-scaled and polarized, with high values representing high quality of life and low values representing low quality of life. The maximum value of 1.0 is only theoretically possible, as demonstrated by the equation displayed in Figure 1.

Figure 1.
Greiner equation. The number 2 in brackets (2) will only be included if the participant indicated the highest grade on the evaluation scale for the respective problem. “N3“was so named by Greiner et al. It indicated that any of the three given problems was referred to as being extreme (grade 3) [20].
2.5. Statistical Analysis
IBM SPSS version 26 (IBM Corp., Armonk, NY, USA) was used to analyse the data. A test power calculation was performed for the group comparisons using the program G*Power. The statistical power of the T1, T2, T3, and T4 groups was 0.401, 0.888, 0.688, and 0.885 for SEHS scores and 0.275, 0.885, 0.887, and 0.973 for HRQol scores, respectively. The parametric tests used here were based on the group size of more than 30 cases. Numerical data were presented as average and standard deviation (STD) and analysed using the t-Student Test. Categorical data were presented as numbers and percentages and analysed using the Chi-squared test. To investigate changes over time within one group, the analysis of variance (ANOVA) method was used. Multivariate logistic regression analysis was used to test the impact of physical activity engagement and consistency in predicting HRQoL and self-estimated health scores at each measurement point. The level of statistical significance of <0.05 was considered significant.
3. Results
This survey included 218 participants from 11 outpatient clinics. For the T1 and T2 measurement time points, 216 participants provided data. The remaining two participants were excluded because they did not meet the inclusion criteria. At the T3 measurement time point, data from 140 participants were available after excluding seven patients due to exclusion criteria, with 69 participants discontinuing on their own terms. At the last survey, T4, 27 women dropped out, leaving data from 113 women for final analysis. Figure 2 represents a flowchart of study cases.
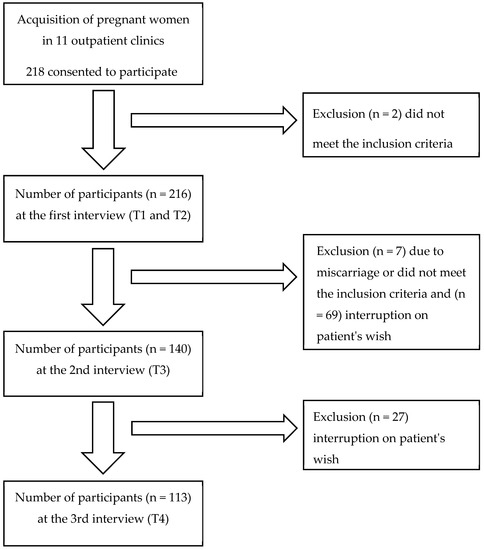
Figure 2.
Flowchart of included study cases. Inclusion criteria were pregnant women ≥18 years of age with a voluntary consent, gestational age ≤10th GW, and basic ability to participate in sports. Exclusion criteria were a physician’s prohibition of sports or strenuous physical activity during pregnancy and all pregnant women whose pregnancies were ended before the 30th week of gestation.
3.1. Study Population
The mean age of the participants was 30.95 ± 5.4 years. Data showed that 20% (41/216) of study cases had two or more children, 32% (70/216) had only one child, and 48% (105/216) had none. Seven women had multiple pregnancies. Due to this number, no subgroup analysis was possible. Approximately 90% of participants had public insurance, while 10% had private health insurance. In addition, we found that 22.2% of the study participants had an academic occupation, 57.9% had an intermediate occupation, 6% were unskilled, and 4.6% were housewives. No assignment was possible for the remaining 9.3% (Table 2).
Table 2.
Demographic features of study cases.
3.2. Baseline Population Data Recorded at Different Intervals
Different measurements that were recorded at study intervals are presented in Table 3. The best self-estimated health status and life quality scores were recorded at T1. With the onset of pregnancy, the proportion of cases with no practiced physical activity were increased by 16%, 13%, and 26% at T2, T3, and T4, respectively. In addition, we observed that the number of days per week and duration per day of moderate and/or strenuous activities were decreased throughout the gestation compared with the data before pregnancy. Results of walking activity showed the same scenario. Participants, on the other hand, had a longer duration of sedentary activities during pregnancy than at T1. The results showed a wide span of data.
Table 3.
Baseline population data was obtained at different intervals.
Data on the proportion of women practicing different types of sports during pregnancy are presented in Table 4. We found that most types of practiced sports were reduced throughout the pregnancy period except for walking which increased from 29.6% at T1 to 32.7% at T4. Moreover, compared with T1, the proportion of women who practiced yoga decreased at T2 and T3 and increased again at T4.
Table 4.
The proportion of women practicing different types of sports during pregnancy.
The proportions of women with activity over their pregnancies and trimester-specific participation percentage are summarized in Table 5. Prior to pregnancy, approximately [79% (170/215)] of all participants engaged in moderate physical activity at least one day per week. This proportion decreased at the beginning of pregnancy [70% (149/214)] and then increased slightly toward the second trimester [73% (99/136)]. At T4, only [59% (65/111)] of women engaged in moderate physical activity. The same scenario was observed in participants engaged in strenuous physical activity [at T1: 65% (140/216), at T2: 36% (78/216), at T3: 42% (59/140), and at T4: 35% (38/110)]. Women who engaged in continuous activity, on the other hand, showed a gradually decreasing proportion of participation in both moderate and strenuous activities. Strenuous physical activity had the most distinct reduction. In addition, the proportion of women who participated in at least one sport decreased by 26% at the start of pregnancy and slightly decreased with the advanced gestation age. This proportion decreased by 13% and 22% in women who continued practicing activities at T3 and T4 compared with T2.
Table 5.
Proportion of women with consistent and inconsistent physical activity throughout the gestation.
3.3. Duration of Strenuous and Moderate Activities, Walking and Sitting throughout Pregnancy Period
These data were calculated in cases, which participated in all four measurement points (N = 113). As shown in Figure 3A, there was a significant decrease in strenuous activity at T2, T3, and T4 when compared to T1 (p = 0.001, p = 0.037, p < 0.001, respectively) and remained unchanged until the third trimester (T2 vs. T3: p = 0.242; T2 vs. T4: p = 0.573; T3 vs. T4: p = 0.083). Compared to T1, there was a statistically significant decrease of the strenuous activity per day in minutes in the last trimester of gestation T4 (p = 0.048) (Figure 3B).
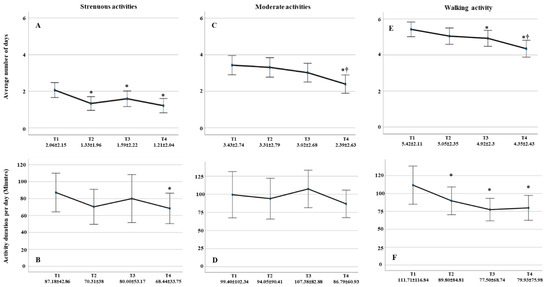
Figure 3.
Number of days and duration per day in minutes for strenuous-, moderate-, and walking activities throughout the pregnancy. (A) Average number of days of strenuous activities engagement reduced significantly by pregnancy onset. (B) Strenuous activities duration per day reduced significantly at T4 compared with T1. (C) Average number of days of moderate activities engagement reduced significantly at T4 compared with T1. (D) Duration of practicing moderate activities per day showed no significant differences between all measurement points. (E) Average number of days practicing walking reduced at T3 and T4 compared with T1. (F) Walking duration per day reduced significantly throughout gestation. Data displayed as average ± STD. ⁕ significancy compared with T1. † Significancy compared with previous measurements.
Number of days per week of moderate activity decreased significantly at T4 compared with T1, T2, and T3 (p < 0.001, p = 0.001 and p = 0.003, respectively) (Figure 3C). However, the average duration per day remained constant throughout gestation (Figure 3D).
There was an insignificant decrease in walking days with the onset of pregnancy (p = 0.055), which becomes significant in the second and third trimesters (p = 0.041, p < 0.001) (Figure 3E). In addition, the average walking duration per day decreased significantly with advanced gestation compared with duration before pregnancy onset (T2: p = 0.047, T3: p = 0.010, and T4: p = 0.012) but becomes insignificant with progressive pregnancy (T2 vs. T3: p = 0.112, T2 vs. T4: p = 0.231, and T3 vs. T4: p = 0.691) (Figure 3F). Women tended to walk around 20 to 30 min more before pregnancy than during pregnancy.
On the other hand, hours of sitting per day increased at T2 (7.70 ± 3.69) and T4 (7.64 ± 3.96) compared with T1 (6.70 ± 3.22) (p = 0.002 and p = 0.025, respectively). Duration at T3 (7.13 ± 3.86) showed no significant difference compared with T1 (p = 0.169). There was no significant change with progressive pregnancy (T2 vs. T3: p = 0.062, T2 vs. T4: p = 0.874, and T3 vs. T4: p = 0.105).
3.4. The Correlation of Discontinuation of Sporting Activity with Different Clinical Characteristics
We had 113 cases who continued to participate in this study at the T4 measurement point. A total of 40 cases (35%) had continuous physical activity throughout the pregnancy, while 73 (75%) had their physical activity interrupted at one measurement point.
At T2, our findings revealed that discontinuation of the sporting activity was correlated with maternal age and BMI. Women over the age of 35 are more likely to continue physical activity than women under the age of 35 [Chi2 (df = 1) = 3.452, p = 0.037], and women who stopped exercising had a lower BMI than those who continued [Average STD: 24.335.85 vs. 26.235.11; Chi2 (df = 182) = 2.266, p = 0.025]. 5. HRQoL and Self-Estimated Health Status Scores and Their Correlation with Physical Activity throughout the Pregnancy.
Pre-pregnancy HRQoL scores were significantly higher than at any other time point during gestation (all p < 0.001). From T2 to T3, there was a non-significant increase in quality of life, followed by a significant decrease from T3 to T4 (p < 0.001). Furthermore, women who exercised continuously during pregnancy had moderately higher HRQoL scores than those who did not exercise continuously. When comparing women’s self-assessed health status scores, a similar scenario of results was observed. Scores during pregnancy were consistently higher in the active group than in the inactive group. Moreover, we found that the reduction in both scores during pregnancy was less pronounced in the active group compared to the inactive group. At T4, the reduction in HRQoL scores and women’s self-assessed health status scores in the inactive group was 9% and 12% higher than in the active group, respectively (Table 6).
Table 6.
HRQoL- and self-estimated health status scores according to physical activity throughout the pregnancy.
Then, using multivariate logistic regression analysis, we examined the impact of physical activity in predicting HRQoL scores at each measurement point when adjusted for age, BMI, having children, occupation, and type of health insurance. This analysis was performed for all cases included in the study. Our findings revealed that engaging in physical activity has a positive impact on HRQoL scores across all measurement points. The same analysis was used to examine the effect of physical activity consistency on HRQoL scores in participants who remained active until T4. Throughout the study period, we found that physical activity consistency has an independent positive impact on HRQoL scores as well as self-estimated health status scores (Table 7).
Table 7.
Impact of physical activity in predicting HRQoL- and self-estimated health status scores throughout the gestation.
We divided the cases who continued practicing their physical activities until T4 into two groups to investigate whether the impact of physical activity consistency on self-estimated health scores and/or HROoL scores is affected by the type of activity. The first group included cases with consistent moderate and strenuous activities, while the second group included cases with consistent moderate activity but no consistent strenuous activity. We found that consistent participation in both types of physical activities significantly improves self-estimated health scores and has a tendency to improve HROoL scores (Figure 4).
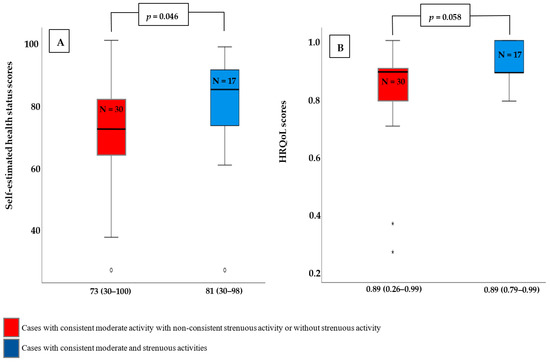
Figure 4.
Self-estimated health scores and HROoL scores according to the type of consistent physical activity. (A) Self-estimated health scores were significantly higher in those who engaged in consistent moderate- and strenuous activities compared to those who engaged in consistent moderate activity with non-consistent strenuous activity or none at all. (B) Cases with consistent moderate- and strenuous activities had higher HRQoL scores than cases with consistent moderate activity but no consistent strenuous activity or no strenuous activity. This difference, however, was not statistically significant. Data displayed as Mean (Range). p-value is calculated using Mann–Whitney-U-Test. N: Number of cases.
4. Discussion
In our study, we found that strenuous and moderate physical activities decrease with the onset of and throughout pregnancy. Being under the age of 35 and having a lower BMI were factors that contributed to the discontinuation. Consistent exercise contributed to a higher quality of life in our study group.
Prior to pregnancy, 90% of the participants were physically active (11% in strenuous, 25% in moderate, and 54% in combined moderate and strenuous activities). In the first trimester (T2), this number was reduced to 74% (4% in strenuous, 38% in moderate, and 32% in combined moderate and strenuous activities). Other studies also show a similar reduction of physical or sporting activities with the onset of pregnancy [6,9]. Haakstad et al. reported 19% (vs. 10% in our study) were non-exercisers before pregnancy, 30% in the first trimester, 36% in the second trimester, and 53% in the third trimester. A possible reason for the physical activity reduction during the first trimester is first-trimester complications and discomfort, e.g., nausea [21,22]. Unlike what was expected, the participation increased only to 77% (4% in strenuous, 37% in moderate, and 36% in combined moderate and strenuous activities) in the second trimester. One would expect more engagement in physical activity within the more “comfortable” second trimester. Due to the increasing abdominal girth and more exposure to pregnancy discomfort in the third trimester, the reduction of physical exercise in our study collective was expected. In the 3rd trimester (T4), only 64% remained active (4% in strenuous, 27% in moderate, and 33% in combined moderate and strenuous activities). Different studies, like ours, found that physical activities were lowest during the third trimester [6,10]. One possible explanation is a false fear of harming the foetus while exercising [22,23]. In the setting of an uncomplicated pregnancy, these concerns were not found to be true [24,25,26,27,28]. A further possible cause specific to our study collective could also be the restrictive nature of the Covid pandemic. In general, the era of the Covid pandemic resulted in various psychological problems, which resulted in overdependence on social media and decreased physical activity [29]. Yet, at least 150 min of moderate or 75 min of strenuous activity is recommended per week during pregnancy [30]. Physical inactivity is harmful to pregnant women and contributes significantly to premature mortality worldwide [31]. Therefore, it is recommended to encourage women with physiological pregnancies to engage in aerobic and strength-conditioning exercises throughout gestation. As a result, it is recommended that women with physiological pregnancies engage in aerobic and strength-conditioning exercises throughout their pregnancy [32].
Participating in non-hazardous sports increased with ongoing pregnancy. In our study, collective walking increased from slightly less than 30 percent before pregnancy to about one-third. Practicing Yoga and gymnastics decreased with onset and increased with ongoing gestation. Our findings are in line with the literature [3,6]. These exercises in pregnancy were extensively studied and found to be safe [33]. More hazardous or vigorous physical activity, e.g., cycling or inline skating, decreased steadily in the course of pregnancy. As expected, and in line with the literature, practicing physical exercise in a gym also decreased throughout pregnancy. A possible explanation for the latter one is the onset of the Covid pandemic [29,34]. Vigorous exercise was proven to be associated with a significant decrease in foetal weight. However, it was not associated with an increased rate of foetal growth restriction [35,36,37]. Currently, there is lacking evidence on the effect of vigorous physical activity on pregnancy [33].
In terms of practicing frequency per weak, we discovered that while strenuous activity frequency decreased significantly from the first trimester, walking and moderate activity frequency decreased significantly from the second and third trimesters, respectively. Furthermore, the average duration of moderate physical activity per day remained constant throughout pregnancy, allowing us to conclude that pregnancy was not an impediment or driver to moderate physical activity and that women are perfectly capable of performing moderate physical activities throughout pregnancy as they did before pregnancy.
Contrary to the literature, at the beginning of pregnancy, we found an association only between the age of the pregnant women (<35 years) and the cessation of physical activity [5]. In addition, we found a negative correlation between increased BMI and the cessation of physical activity. In a more recent study, a more favourable self-rated health before pregnancy onset and a lower BMI was associated with higher levels of physical activity [38]. In a review of 16 studies higher education and income, not having children at home, being white and more active before pregnancy was associated with higher exercise during pregnancy [39]. In our collective, education and the number of pre-existing children were not correlated to abandoning physical activity during gestation. This could be explained by cohort bias.
One of the most important implications of our study is that it investigates not only the impact of physical activity on quality of life but also the effect of consistency of physical activity participation. First, we found that the proportion of women who engage in physical activity, whether moderate or strenuous exercise or participation in a single sport decreased after pregnancy begins. However, when there was consistent exercise, less reduction in practicing strenuous activities was reported by the third trimester. These findings imply that continuous exercise may have a positive impact on exercise intensity. Second, the findings on quality of life highlight the importance of consistent physical activity throughout pregnancy. We found that HRQoL and self-reported health status were lower at all measurement points during pregnancy compared with pre-pregnancy scores. When compared to cases with continuous engagement, this reduction in the third trimester was greater in cases with uncontentious physical activity participation by at least 58% and 39% for HRQoL- and self-estimated health status scores, respectively. Furthermore, physical activity participation and consistency have been shown to independently predict HRQoL- and self-estimated health status scores.
Nevertheless, we found that many women reduced or stopped their physical activities during pregnancy. Our study further shows that it cannot be assumed that low-risk pregnant women will remain physically active with the onset of pregnancy. In different studies, exercise during pregnancy was shown to maintain physical fitness, decrease the risk of many complications, including gestational diabetes, hypertensive diseases, caesarean birth, and operative vaginal birth rates, increased postpartum recovery time, depressive disorders, and body pain, e.g., lumbar and sciatic pain [33,40,41,42,43,44,45,46,47,48,49,50,51,52]. It is not surprising, therefore, that international guidelines exist to encourage pregnant women to participate in physical activity during their pregnancy [30,31,32]. Based on our findings, we recommend women with uncomplicated pregnancies be encouraged to engage in physical exercise throughout gestation [2].
To the best of our knowledge, this is the first study to investigate the physical activity of women living in Germany prior to and during pregnancy. The main strength of this study is the analysis of how pregnant women’s HRQoL changed from prior pregnancy over a 20-week period with three measurement points during pregnancy, allowing us to exclude the effect of complications prior to and during pregnancy. Furthermore, data from such a large sample size might serve to offer utility-based case values in pregnant women at different stages of gestation in the clinic, as well as contribute to health economic research. It should be noted, however, that more closely timed data collection might allow for a more accurate assessment of causal relationships. Further, this survey was conducted anonymously. Therefore, it is acceptable to speculate that participants’ willingness to respond in terms of social desirability had no significant influence on the current data.
5. Conclusions
Our study highlighted a possible positive effect of physical activity behaviour in pregnant women on the HRQoL. Yet, the direct effect of physical activity on the quality of life still has to be examined in further studies. However, based on our findings, and in line with international recommendations, all pregnant women should be counselled on the advantages of physical activity early in pregnancy.
Author Contributions
Conceptualization and design: E.-F.S. and M.K. Data acquisition and curation: A.L., J.F., R.S., R.M.S. and B.H.H. Data analysis and interpretation: M.K., A.H. and A.L. Drafting and writing of the manuscript: M.K., A.H. and A.L. Reviewing and Editing: M.K. and A.H. Supervision: E.-F.S. and B.H.H. All authors have read and agreed to the published version of the manuscript.
Funding
This research received no external funding.
Institutional Review Board Statement
This study was approved by the Ethics Committee of the Saarland Medical Syndicate (Ref.No. 247/19, 6 April 2020).
Informed Consent Statement
Informed consent was obtained from all subjects involved in the study.
Data Availability Statement
The data that support the findings of this study are available on request from the corresponding author (M.K.).
Conflicts of Interest
The authors declare no conflict of interest.
References
- Barakat, R.; Pelaez, M.; Cordero, Y.; Perales, M.; Lopez, C.; Coteron, J.; Mottola, M.F. Exercise during pregnancy protects against hypertension and macrosomia: Randomized clinical trial. Am. J. Obstet. Gynecol. 2016, 214, 649.E1–649.E8. [Google Scholar] [CrossRef]
- Physical Activity and Exercise During Pregnancy and the Postpartum Period: ACOG Committee Opinion, Number 804. Obstet. Gynecol. 2020, 135, e178–e188. [CrossRef]
- Domingues, M.R.; Barros, A.J. Leisure-time physical activity during pregnancy in the 2004 Pelotas Birth Cohort Study. Rev. Saude Publica 2007, 41, 173–180. [Google Scholar] [CrossRef]
- Evenson, K.R.; Savitz, D.A.; Huston, S.L. Leisure-time physical activity among pregnant women in the US. Paediatr. Perinat. Epidemiol. 2004, 18, 400–407. [Google Scholar] [CrossRef]
- Fell, D.B.; Joseph, K.S.; Armson, B.A.; Dodds, L. The impact of pregnancy on physical activity level. Matern. Child Health J. 2009, 13, 597–603. [Google Scholar] [CrossRef]
- Haakstad, L.A.; Voldner, N.; Henriksen, T.; Bø, K. Physical activity level and weight gain in a cohort of pregnant Norwegian women. Acta Obstet. Gynecol. Scand. 2007, 86, 559–564. [Google Scholar] [CrossRef]
- Hegaard, H.K.; Hedegaard, M.; Damm, P.; Ottesen, B.; Petersson, K.; Henriksen, T.B. Leisure time physical activity is associated with a reduced risk of preterm delivery. Am. J. Obstet. Gynecol. 2008, 198, 180.e1–180.e5. [Google Scholar] [CrossRef] [PubMed]
- Schmidt, T.; Heilmann, T.; Savelsberg, L.; Maass, N.; Weisser, B.; Eckmann-Scholz, C. Physical Exercise During Pregnancy—How Active Are Pregnant Women in Germany and How Well Informed? Geburtshilfe Frauenheilkd 2017, 77, 508–515. [Google Scholar] [CrossRef] [PubMed]
- Sitzberger, C.; Hansl, J.; Felberbaum, R.; Brössner, A.; Oberhoffer-Fritz, R.; Wacker-Gussmann, A. Physical Activity in High-Risk Pregnancies. J. Clin. Med. 2022, 11, 703. [Google Scholar] [CrossRef] [PubMed]
- Huberty, J.L.; Buman, M.P.; Leiferman, J.A.; Bushar, J.; Adams, M.A. Trajectories of objectively-measured physical activity and sedentary time over the course of pregnancy in women self-identified as inactive. Prev. Med. Rep. 2016, 3, 353–360. [Google Scholar] [CrossRef]
- Krzepota, J.; Sadowska, D.; Biernat, E. Relationships between Physical Activity and Quality of Life in Pregnant Women in the Second and Third Trimester. Int. J. Environ. Res. Public Health 2018, 15, 2745. [Google Scholar] [CrossRef]
- Amezcua-Prieto, C.; Olmedo-Requena, R.; Jiménez-Mejías, E.; Mozas-Moreno, J.; Lardelli-Claret, P.; Jiménez-Moleón, J.J. Factors associated with changes in leisure time physical activity during early pregnancy. Int. J. Gynaecol. Obstet. 2013, 121, 127–131. [Google Scholar] [CrossRef]
- Ko, Y.L.; Chen, C.P.; Lin, P.C. Physical activities during pregnancy and type of delivery in nulliparae. Eur. J. Sport Sci. 2016, 16, 374–380. [Google Scholar] [CrossRef] [PubMed]
- Patrícia Medeiros Falcão, K.; Pedrozo Campos Antunes, T.; do Nascimento Andrade Feitosa, A.; Victor, E.G.; Nunes Alves de Sousa, M.; de Abreu, L.C.; Vilar de Asis, E.; Barros de Quental, O.; Pinheiro Bezerra, I.M.; Azevedo de Freitas Junior, H. Association between hypertension and quality of life in pregnancy. Hypertens Pregnancy 2016, 35, 306–314. [Google Scholar] [CrossRef]
- Marín-Jiménez, N.; Castro-Piñero, J.; Rodríguez-Ayllón, M.; Marchán-Rubio, A.; Delgado-Fernández, M.; Aparicio, V.A. The favourable association of self-reported physical fitness with depression and anxiety during pregnancy. The GESTAFIT project. Eur. J. Sport Sci. 2021, 22, 1932–1940. [Google Scholar] [CrossRef]
- Abbaszadeh, F.; Kafaei Atrian, M.; Masoudi Alavi, N.; Bagheri, A.; Sadat, Z.; Karimian, Z. Relationship between quality of life and depression in pregnant women. Nurs. Midwifery Stud. 2013, 2, 193–197. [Google Scholar] [CrossRef]
- Nascimento, S.L.; Surita, F.G.; Parpinelli, M.; Siani, S.; Pinto e Silva, J.L. The effect of an antenatal physical exercise programme on maternal/perinatal outcomes and quality of life in overweight and obese pregnant women: A randomised clinical trial. BJOG 2011, 118, 1455–1463. [Google Scholar] [CrossRef]
- Mourady, D.; Richa, S.; Karam, R.; Papazian, T.; Hajj Moussa, F.; El Osta, N.; Kesrouani, A.; Azouri, J.; Jabbour, H.; Hajj, A.; et al. Associations between quality of life, physical activity, worry, depression and insomnia: A cross-sectional designed study in healthy pregnant women. PLoS ONE 2017, 12, e0178181. [Google Scholar] [CrossRef]
- Tendais, I.; Figueiredo, B.; Mota, J.; Conde, A. Physical activity, health-related quality of life and depression during pregnancy. Cad. Saude Publica 2011, 27, 219–228. [Google Scholar] [CrossRef] [PubMed]
- Greiner, W.; Claes, C.; Busschbach, J.J.; von der Schulenburg, J.M. Validating the EQ-5D with time trade off for the German population. Eur. J. Health Econ. 2005, 6, 124–130. [Google Scholar] [CrossRef] [PubMed]
- Cioffi, J.; Schmied, V.; Dahlen, H.; Mills, A.; Thornton, C.; Duff, M.; Cummings, J.; Kolt, G.S. Physical activity in pregnancy: Women’s perceptions, practices, and influencing factors. J. Midwifery Womens Health 2010, 55, 455–461. [Google Scholar] [CrossRef] [PubMed]
- Duncombe, D.; Wertheim, E.H.; Skouteris, H.; Paxton, S.J.; Kelly, L. Factors related to exercise over the course of pregnancy including women’s beliefs about the safety of exercise during pregnancy. Midwifery 2009, 25, 430–438. [Google Scholar] [CrossRef] [PubMed]
- Connelly, M.; Brown, H.; van der Pligt, P.; Teychenne, M. Modifiable barriers to leisure-time physical activity during pregnancy: A qualitative study investigating first time mother’s views and experiences. BMC Pregnancy Childbirth 2015, 15, 100. [Google Scholar] [CrossRef]
- de Oliveria Melo, A.S.; Silva, J.L.; Tavares, J.S.; Barros, V.O.; Leite, D.F.; Amorim, M.M. Effect of a physical exercise program during pregnancy on uteroplacental and fetal blood flow and fetal growth: A randomized controlled trial. Obstet. Gynecol. 2012, 120, 302–310. [Google Scholar] [CrossRef]
- Price, B.B.; Amini, S.B.; Kappeler, K. Exercise in pregnancy: Effect on fitness and obstetric outcomes-a randomized trial. Med. Sci. Sports Exerc. 2012, 44, 2263–2269. [Google Scholar] [CrossRef]
- Barakat, R.; Pelaez, M.; Montejo, R.; Refoyo, I.; Coteron, J. Exercise throughout pregnancy does not cause preterm delivery: A randomized, controlled trial. J. Phys. Act. Health 2014, 11, 1012–1017. [Google Scholar] [CrossRef]
- Owe, K.M.; Nystad, W.; Skjaerven, R.; Stigum, H.; Bø, K. Exercise during pregnancy and the gestational age distribution: A cohort study. Med. Sci. Sports Exerc. 2012, 44, 1067–1074. [Google Scholar] [CrossRef]
- Thangaratinam, S.; Rogozińska, E.; Jolly, K.; Glinkowski, S.; Duda, W.; Borowiack, E.; Roseboom, T.; Tomlinson, J.; Walczak, J.; Kunz, R.; et al. Interventions to reduce or prevent obesity in pregnant women: A systematic review. Health Technol. Assess. 2012, 16, 1–191. [Google Scholar] [CrossRef]
- Kaur, H.; Singh, T.; Arya, Y.K.; Mittal, S. Physical Fitness and Exercise During the COVID-19 Pandemic: A Qualitative Enquiry. Front. Psychol. 2020, 11, 2943. [Google Scholar] [CrossRef]
- Piercy, K.L.; Troiano, R.P.; Ballard, R.M.; Carlson, S.A.; Fulton, J.E.; Galuska, D.A.; George, S.M.; Olson, R.D. The Physical Activity Guidelines for Americans. JAMA 2018, 320, 2020–2028. [Google Scholar] [CrossRef]
- Bull, F.C.; Al-Ansari, S.S.; Biddle, S.; Borodulin, K.; Buman, M.P.; Cardon, G.; Carty, C.; Chaput, J.P.; Chastin, S.; Chou, R.; et al. World Health Organization 2020 guidelines on physical activity and sedentary behaviour. Br. J. Sports Med. 2020, 1451–1462. [Google Scholar] [CrossRef]
- Syed, H.; Slayman, T.; DuChene Thoma, K. ACOG Committee Opinion No. 804: Physical Activity and Exercise During Pregnancy and the Postpartum Period. Obstet. Gynecol. 2021, 137, 375–376. [Google Scholar] [CrossRef] [PubMed]
- Berghella, V.; Saccone, G. Exercise in pregnancy! Am. J. Obstet. Gynecol. 2017, 216, 335–337. [Google Scholar] [CrossRef] [PubMed]
- Hargreaves, E.A.; Lee, C.; Jenkins, M.; Calverley, J.R.; Hodge, K.; Houge Mackenzie, S. Changes in Physical Activity Pre-, During and Post-lockdown COVID-19 Restrictions in New Zealand and the Explanatory Role of Daily Hassles. Front. Psychol. 2021, 12, 642954. [Google Scholar] [CrossRef]
- Kramer, M.S.; McDonald, S.W. Aerobic exercise for women during pregnancy. Cochrane Database Syst. Rev. 2006, 2006, Cd000180. [Google Scholar] [CrossRef]
- Lokey, E.A.; Tran, Z.V.; Wells, C.L.; Myers, B.C.; Tran, A.C. Effects of physical exercise on pregnancy outcomes: A meta-analytic review. Med. Sci. Sports Exerc. 1991, 23, 1234–1239. [Google Scholar] [CrossRef]
- Leet, T.; Flick, L. Effect of exercise on birthweight. Clin. Obstet. Gynecol. 2003, 46, 423–431. [Google Scholar] [CrossRef]
- Meander, L.; Lindqvist, M.; Mogren, I.; Sandlund, J.; West, C.E.; Domellöf, M. Physical activity and sedentary time during pregnancy and associations with maternal and fetal health outcomes: An epidemiological study. BMC Pregnancy Childbirth 2021, 21, 166. [Google Scholar] [CrossRef]
- Gaston, A.; Cramp, A. Exercise during pregnancy: A review of patterns and determinants. J. Sci. Med. Sport 2011, 14, 299–305. [Google Scholar] [CrossRef]
- Cordero, Y.; Mottola, M.F.; Vargas, J.; Blanco, M.; Barakat, R. Exercise Is Associated with a Reduction in Gestational Diabetes Mellitus. Med. Sci. Sports Exerc. 2015, 47, 1328–1333. [Google Scholar] [CrossRef]
- Dempsey, J.C.; Sorensen, T.K.; Williams, M.A.; Lee, I.M.; Miller, R.S.; Dashow, E.E.; Luthy, D.A. Prospective study of gestational diabetes mellitus risk in relation to maternal recreational physical activity before and during pregnancy. Am. J. Epidemiol. 2004, 159, 663–670. [Google Scholar] [CrossRef]
- Liu, J.; Laditka, J.N.; Mayer-Davis, E.J.; Pate, R.R. Does physical activity during pregnancy reduce the risk of gestational diabetes among previously inactive women? Birth 2008, 35, 188–195. [Google Scholar] [CrossRef]
- Barakat, R.; Pelaez, M.; Lopez, C.; Montejo, R.; Coteron, J. Exercise during pregnancy reduces the rate of cesarean and instrumental deliveries: Results of a randomized controlled trial. J. Matern. Fetal Neonatal Med. 2012, 25, 2372–2376. [Google Scholar] [CrossRef]
- Pennick, V.E.; Young, G. Interventions for preventing and treating pelvic and back pain in pregnancy. Cochrane Database Syst. Rev. 2007, 18, 2. [Google Scholar] [CrossRef]
- Kołomańska-Bogucka, D.; Mazur-Bialy, A.I. Physical Activity and the Occurrence of Postnatal Depression-A Systematic Review. Medicina 2019, 55, 560. [Google Scholar] [CrossRef] [PubMed]
- Nakamura, A.; van der Waerden, J.; Melchior, M.; Bolze, C.; El-Khoury, F.; Pryor, L. Physical activity during pregnancy and postpartum depression: Systematic review and meta-analysis. J. Affect Disord. 2019, 246, 29–41. [Google Scholar] [CrossRef] [PubMed]
- Marín-Jiménez, N.; Acosta-Manzano, P.; Borges-Cosic, M.; Baena-García, L.; Coll-Risco, I.; Romero-Gallardo, L.; Aparicio, V.A. Association of self-reported physical fitness with pain during pregnancy: The GESTAFIT Project. Scand. J. Med. Sci. Sports 2019, 29, 1022–1030. [Google Scholar] [CrossRef]
- Wang, C.; Wei, Y.; Zhang, X.; Zhang, Y.; Xu, Q.; Sun, Y.; Su, S.; Zhang, L.; Liu, C.; Feng, Y.; et al. A randomized clinical trial of exercise during pregnancy to prevent gestational diabetes mellitus and improve pregnancy outcome in overweight and obese pregnant women. Am. J. Obstet. Gynecol. 2017, 216, 340–351. [Google Scholar] [CrossRef]
- Magro-Malosso, E.R.; Saccone, G.; Di Tommaso, M.; Roman, A.; Berghella, V. Exercise during pregnancy and risk of gestational hypertensive disorders: A systematic review and meta-analysis. Acta Obstet. Gynecol. Scand. 2017, 96, 921–931. [Google Scholar] [CrossRef]
- Jovanovic-Peterson, L.; Durak, E.P.; Peterson, C.M. Randomized trial of diet versus diet plus cardiovascular conditioning on glucose levels in gestational diabetes. Am. J. Obstet. Gynecol. 1989, 161, 415–419. [Google Scholar] [CrossRef]
- Keating, N.; Coveney, C.; McAuliffe, F.M.; Higgins, M.F. Aerobic or Resistance Exercise for Improved Glycaemic Control and Pregnancy Outcomes in Women with Gestational Diabetes Mellitus: A Systematic Review. Int. J. Environ. Res. Public Health 2022, 19, 10791. [Google Scholar] [CrossRef] [PubMed]
- Gilbert, L.; Gross, J.; Lanzi, S.; Quansah, D.Y.; Puder, J.; Horsch, A. How diet, physical activity and psychosocial well-being interact in women with gestational diabetes mellitus: An integrative review. BMC Pregnancy Childbirth 2019, 19, 60. [Google Scholar] [CrossRef]
Disclaimer/Publisher’s Note: The statements, opinions and data contained in all publications are solely those of the individual author(s) and contributor(s) and not of MDPI and/or the editor(s). MDPI and/or the editor(s) disclaim responsibility for any injury to people or property resulting from any ideas, methods, instructions or products referred to in the content. |
© 2023 by the authors. Licensee MDPI, Basel, Switzerland. This article is an open access article distributed under the terms and conditions of the Creative Commons Attribution (CC BY) license (https://creativecommons.org/licenses/by/4.0/).