

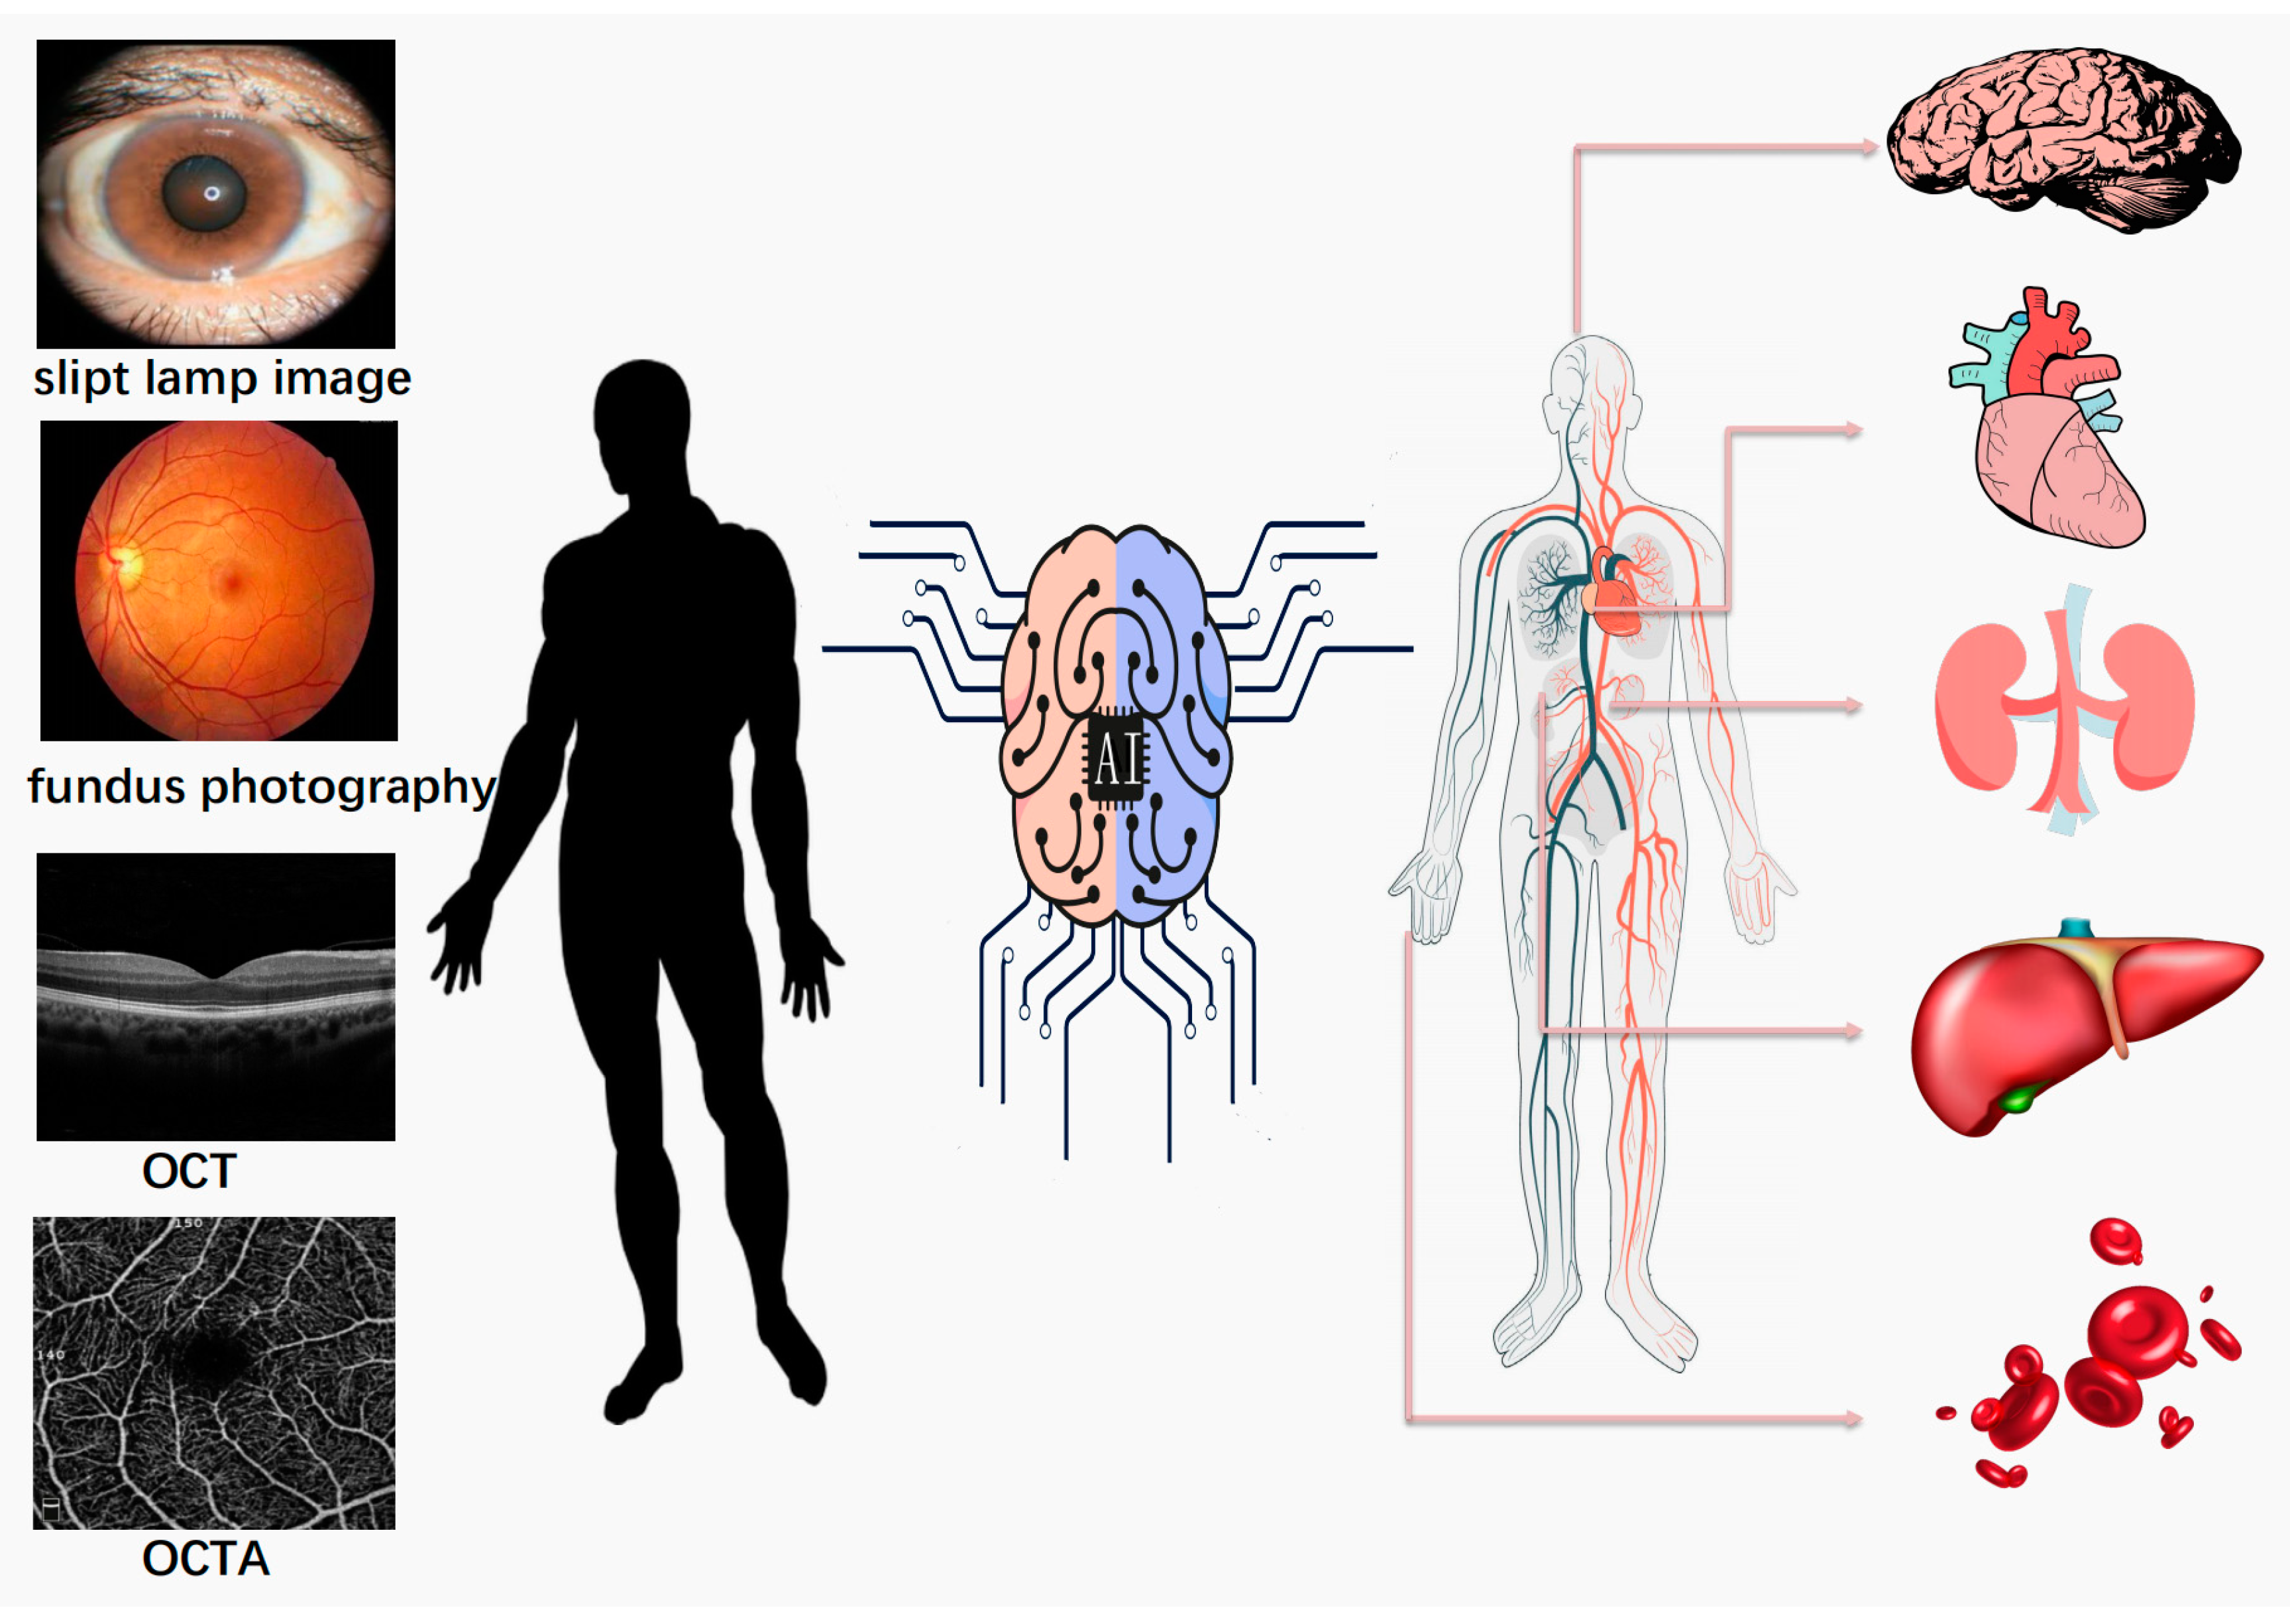
Diagnosing Systemic Disorders with AI Algorithms Based on Ocular Images


Abstract

1. Introduction
2. Materials and Methods
2.1. Inclusion and Exclusion Criteria
2.2. Data Extraction and Quality Assessment
3. Results
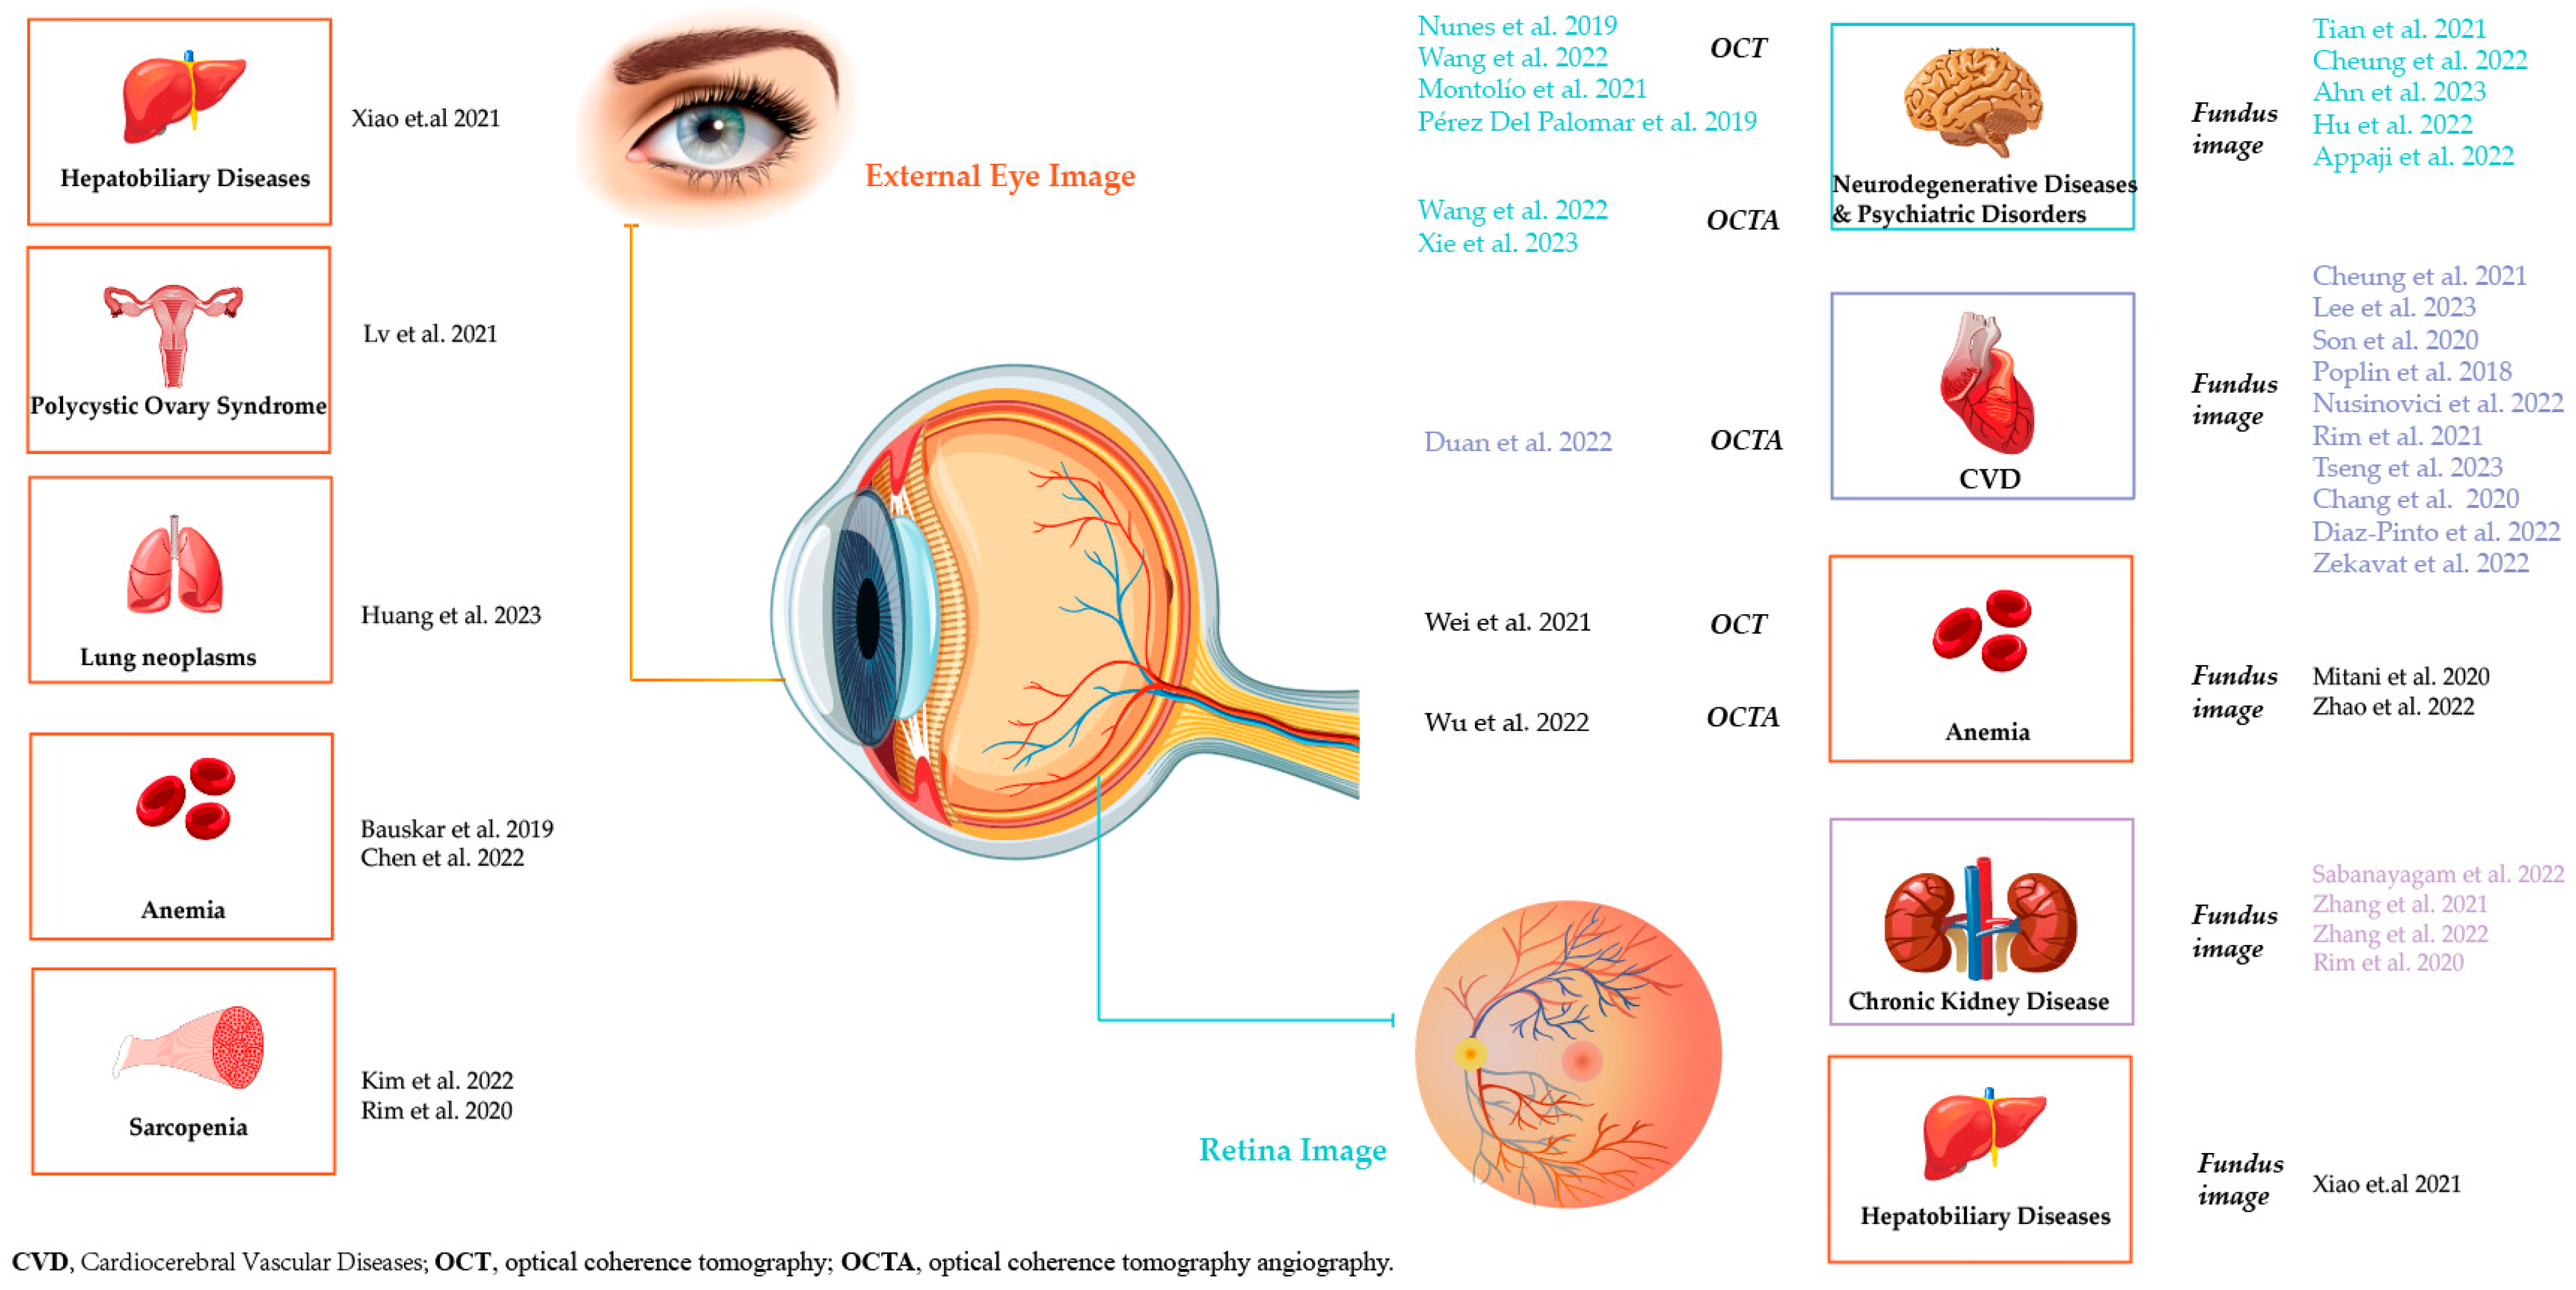
3.1. Detection of Cardiocerebral Vascular Diseases and Risk Stratification
3.1.1. Detection of Retinal Microvascular Morphological Parameters for Stratification
3.1.2. Prediction of Additional Risk Factors for Stratification
3.1.3. Prediction of Major Cardiocerebral Vascular Events
3.2. Detection of Neurodegenerative Diseases and Psychiatric Disorders
3.3. Detection of Chronic Kidney Disease and Renal Function
3.4. Detection of Hematological Diseases
3.5. Detection of Other Systemic Diseases
3.5.1. Detection of Hepatobiliary Diseases
3.5.2. Detection of Lung Neoplasms
3.5.3. Detection of Sarcopenia
4. Discussion
4.1. Dilemmas and Trends
4.2. Strength and Limitations
5. Conclusions
Supplementary Materials
Author Contributions
Funding
Institutional Review Board Statement
Informed Consent Statement
Data Availability Statement
Acknowledgments
Conflicts of Interest
References
- Hamet, P.; Tremblay, J. Artificial Intelligence in Medicine. Metabolism 2017, 69, S36–S40. [Google Scholar] [CrossRef]
- Topol, E.J. High-Performance Medicine: The Convergence of Human and Artificial Intelligence. Nat. Med. 2019, 25, 44–56. [Google Scholar] [CrossRef]
- Hosny, A.; Parmar, C.; Quackenbush, J.; Schwartz, L.H.; Aerts, H.J.W.L. Artificial Intelligence in Radiology. Nat. Rev. Cancer 2018, 18, 500–510. [Google Scholar] [CrossRef] [PubMed]
- Niazi, M.K.K.; Parwani, A.V.; Gurcan, M.N. Digital Pathology and Artificial Intelligence. Lancet Oncol. 2019, 20, e253–e261. [Google Scholar] [CrossRef]
- Bera, K.; Schalper, K.A.; Rimm, D.L.; Velcheti, V.; Madabhushi, A. Artificial Intelligence in Digital Pathology—New Tools for Diagnosis and Precision Oncology. Nat. Rev. Clin. Oncol. 2019, 16, 703–715. [Google Scholar] [CrossRef]
- Baxi, V.; Edwards, R.; Montalto, M.; Saha, S. Digital Pathology and Artificial Intelligence in Translational Medicine and Clinical Practice. Mod. Pathol. 2022, 35, 23–32. [Google Scholar] [CrossRef] [PubMed]
- Hogarty, D.T.; Su, J.C.; Phan, K.; Attia, M.; Hossny, M.; Nahavandi, S.; Lenane, P.; Moloney, F.J.; Yazdabadi, A. Artificial Intelligence in Dermatology—Where We Are and the Way to the Future: A Review. Am. J. Clin. Dermatol. 2020, 21, 41–47. [Google Scholar] [CrossRef] [PubMed]
- Young, A.T.; Xiong, M.; Pfau, J.; Keiser, M.J.; Wei, M.L. Artificial Intelligence in Dermatology: A Primer. J. Invest. Dermatol. 2020, 140, 1504–1512. [Google Scholar] [CrossRef]
- Attia, Z.I.; Harmon, D.M.; Behr, E.R.; Friedman, P.A. Application of Artificial Intelligence to the Electrocardiogram. Eur. Heart J. 2021, 42, 4717–4730. [Google Scholar] [CrossRef]
- Hormel, T.T.; Hwang, T.S.; Bailey, S.T.; Wilson, D.J.; Huang, D.; Jia, Y. Artificial Intelligence in OCT Angiography. Prog. Retin. Eye Res. 2021, 85, 100965. [Google Scholar] [CrossRef]
- Jin, K.; Ye, J. Artificial Intelligence and Deep Learning in Ophthalmology: Current Status and Future Perspectives. Adv. Ophthalmol. Pract. Res. 2022, 2, 100078. [Google Scholar] [CrossRef]
- Farrah, T.E.; Dhillon, B.; Keane, P.A.; Webb, D.J.; Dhaun, N. The Eye, the Kidney, and Cardiovascular Disease: Old Concepts, Better Tools, and New Horizons. Kidney Int. 2020, 98, 323–342. [Google Scholar] [CrossRef]
- London, A.; Benhar, I.; Schwartz, M. The Retina as a Window to the Brain—From Eye Research to CNS Disorders. Nat. Rev. Neurol. 2013, 9, 44–53. [Google Scholar] [CrossRef]
- Whiting, P.F.; Rutjes, A.W.S.; Westwood, M.E.; Mallett, S.; Deeks, J.J.; Reitsma, J.B.; Leeflang, M.M.G.; Sterne, J.A.C.; Bossuyt, P.M.M.; QUADAS-2 Group. QUADAS-2: A Revised Tool for the Quality Assessment of Diagnostic Accuracy Studies. Ann. Intern. Med. 2011, 155, 529–536. [Google Scholar] [CrossRef]
- Cheung, C.Y.; Xu, D.; Cheng, C.-Y.; Sabanayagam, C.; Tham, Y.-C.; Yu, M.; Rim, T.H.; Chai, C.Y.; Gopinath, B.; Mitchell, P.; et al. A Deep-Learning System for the Assessment of Cardiovascular Disease Risk via the Measurement of Retinal-Vessel Calibre. Nat. Biomed. Eng. 2021, 5, 498–508. [Google Scholar] [CrossRef] [PubMed]
- Zekavat, S.M.; Raghu, V.K.; Trinder, M.; Ye, Y.; Koyama, S.; Honigberg, M.C.; Yu, Z.; Pampana, A.; Urbut, S.; Haidermota, S.; et al. Deep Learning of the Retina Enables Phenome- and Genome-Wide Analyses of the Microvasculature. Circulation 2022, 145, 134–150. [Google Scholar] [CrossRef] [PubMed]
- Duan, H.; Xie, J.; Zhou, Y.; Zhang, H.; Liu, Y.; Tang, C.; Zhao, Y.; Qi, H. Characterization of the Retinal Microvasculature and FAZ Changes in Ischemic Stroke and Its Different Types. Transl. Vis. Sci. Technol. 2022, 11, 21. [Google Scholar] [CrossRef] [PubMed]
- Poplin, R.; Varadarajan, A.V.; Blumer, K.; Liu, Y.; McConnell, M.V.; Corrado, G.S.; Peng, L.; Webster, D.R. Prediction of Cardiovascular Risk Factors from Retinal Fundus Photographs via Deep Learning. Nat. Biomed. Eng. 2018, 2, 158–164. [Google Scholar] [CrossRef] [PubMed]
- Nusinovici, S.; Rim, T.H.; Yu, M.; Lee, G.; Tham, Y.-C.; Cheung, N.; Chong, C.C.Y.; Da Soh, Z.; Thakur, S.; Lee, C.J.; et al. Retinal Photograph-Based Deep Learning Predicts Biological Age, and Stratifies Morbidity and Mortality Risk. Age Ageing 2022, 51, afac065. [Google Scholar] [CrossRef] [PubMed]
- Son, J.; Shin, J.Y.; Chun, E.J.; Jung, K.-H.; Park, K.H.; Park, S.J. Predicting High Coronary Artery Calcium Score from Retinal Fundus Images with Deep Learning Algorithms. Transl. Vis. Sci. Technol. 2020, 9, 28. [Google Scholar] [CrossRef]
- Rim, T.H.; Lee, C.J.; Tham, Y.-C.; Cheung, N.; Yu, M.; Lee, G.; Kim, Y.; Ting, D.S.W.; Chong, C.C.Y.; Choi, Y.S.; et al. Deep-Learning-Based Cardiovascular Risk Stratification Using Coronary Artery Calcium Scores Predicted from Retinal Photographs. Lancet Digit. Health 2021, 3, e306–e316. [Google Scholar] [CrossRef] [PubMed]
- Tseng, R.M.W.W.; Rim, T.H.; Shantsila, E.; Yi, J.K.; Park, S.; Kim, S.S.; Lee, C.J.; Thakur, S.; Nusinovici, S.; Peng, Q.; et al. Validation of a Deep-Learning-Based Retinal Biomarker (Reti-CVD) in the Prediction of Cardiovascular Disease: Data from UK Biobank. BMC Med. 2023, 21, 28. [Google Scholar] [CrossRef] [PubMed]
- Chang, J.; Ko, A.; Park, S.M.; Choi, S.; Kim, K.; Kim, S.M.; Yun, J.M.; Kang, U.; Shin, I.H.; Shin, J.Y.; et al. Association of Cardiovascular Mortality and Deep Learning-Funduscopic Atherosclerosis Score Derived from Retinal Fundus Images. Am. J. Ophthalmol. 2020, 217, 121–130. [Google Scholar] [CrossRef] [PubMed]
- Diaz-Pinto, A.; Ravikumar, N.; Attar, R.; Suinesiaputra, A.; Zhao, Y.; Levelt, E.; Dall’Armellina, E.; Lorenzi, M.; Chen, Q.; Keenan, T.D.L.; et al. Predicting Myocardial Infarction through Retinal Scans and Minimal Personal Information. Nat. Mach. Intell. 2022, 4, 55–61. [Google Scholar] [CrossRef]
- Lee, Y.C.; Cha, J.; Shim, I.; Park, W.-Y.; Kang, S.W.; Lim, D.H.; Won, H.-H. Multimodal Deep Learning of Fundus Abnormalities and Traditional Risk Factors for Cardiovascular Risk Prediction. npj Digit. Med. 2023, 6, 14. [Google Scholar] [CrossRef]
- Nunes, A.; Silva, G.; Duque, C.; Januário, C.; Santana, I.; Ambrósio, A.F.; Castelo-Branco, M.; Bernardes, R. Retinal Texture Biomarkers May Help to Discriminate between Alzheimer’s, Parkinson’s, and Healthy Controls. PLoS ONE 2019, 14, e0218826. [Google Scholar] [CrossRef]
- Wang, X.; Wang, Y.; Liu, H.; Zhu, X.; Hao, X.; Zhu, Y.; Xu, B.; Zhang, S.; Jia, X.; Weng, L.; et al. Macular Microvascular Density as a Diagnostic Biomarker for Alzheimer’s Disease. J. Alzheimer’s Dis. JAD 2022, 90, 139–149. [Google Scholar] [CrossRef]
- Wang, X.; Jiao, B.; Liu, H.; Wang, Y.; Hao, X.; Zhu, Y.; Xu, B.; Xu, H.; Zhang, S.; Jia, X.; et al. Machine Learning Based on Optical Coherence Tomography Images as a Diagnostic Tool for Alzheimer’s Disease. CNS Neurosci. Ther. 2022, 28, 2206–2217. [Google Scholar] [CrossRef]
- Cheung, C.Y.; Ran, A.R.; Wang, S.; Chan, V.T.T.; Sham, K.; Hilal, S.; Venketasubramanian, N.; Cheng, C.-Y.; Sabanayagam, C.; Tham, Y.C.; et al. A Deep Learning Model for Detection of Alzheimer’s Disease Based on Retinal Photographs: A Retrospective, Multicentre Case-Control Study. Lancet Digit. Health 2022, 4, e806–e815. [Google Scholar] [CrossRef]
- Xie, J.; Yi, Q.; Wu, Y.; Zheng, Y.; Liu, Y.; Macerollo, A.; Fu, H.; Xu, Y.; Zhang, J.; Behera, A.; et al. Deep Segmentation of OCTA for Evaluation and Association of Changes of Retinal Microvasculature with Alzheimer’s Disease and Mild Cognitive Impairment. Br. J. Ophthalmol. 2023. [Google Scholar] [CrossRef]
- Hu, W.; Wang, W.; Wang, Y.; Chen, Y.; Shang, X.; Liao, H.; Huang, Y.; Bulloch, G.; Zhang, S.; Kiburg, K.; et al. Retinal Age Gap as a Predictive Biomarker of Future Risk of Parkinson’s Disease. Age Ageing 2022, 51, afac062. [Google Scholar] [CrossRef]
- Ahn, S.; Shin, J.; Song, S.J.; Yoon, W.T.; Sagong, M.; Jeong, A.; Kim, J.H.; Yu, H.G. Neurologic Dysfunction Assessment in Parkinson Disease Based on Fundus Photographs Using Deep Learning. JAMA Ophthalmol. 2023, 141, 234–240. [Google Scholar] [CrossRef] [PubMed]
- Pérez Del Palomar, A.; Cegoñino, J.; Montolío, A.; Orduna, E.; Vilades, E.; Sebastián, B.; Pablo, L.E.; Garcia-Martin, E. Swept Source Optical Coherence Tomography to Early Detect Multiple Sclerosis Disease. The Use of Machine Learning Techniques. PLoS ONE 2019, 14, e0216410. [Google Scholar] [CrossRef] [PubMed]
- Montolío, A.; Martín-Gallego, A.; Cegoñino, J.; Orduna, E.; Vilades, E.; Garcia-Martin, E.; Palomar, A.P.D. Machine Learning in Diagnosis and Disability Prediction of Multiple Sclerosis Using Optical Coherence Tomography. Comput. Biol. Med. 2021, 133, 104416. [Google Scholar] [CrossRef] [PubMed]
- Tian, J.; Smith, G.; Guo, H.; Liu, B.; Pan, Z.; Wang, Z.; Xiong, S.; Fang, R. Modular Machine Learning for Alzheimer’s Disease Classification from Retinal Vasculature. Sci. Rep. 2021, 11, 238. [Google Scholar] [CrossRef] [PubMed]
- Appaji, A.; Harish, V.; Korann, V.; Devi, P.; Jacob, A.; Padmanabha, A.; Kumar, V.; Varambally, S.; Venkatasubramanian, G.; Rao, S.V.; et al. Deep Learning Model Using Retinal Vascular Images for Classifying Schizophrenia. Schizophr. Res. 2022, 241, 238–243. [Google Scholar] [CrossRef]
- Sabanayagam, C.; Xu, D.; Ting, D.S.W.; Nusinovici, S.; Banu, R.; Hamzah, H.; Lim, C.; Tham, Y.-C.; Cheung, C.Y.; Tai, E.S.; et al. A Deep Learning Algorithm to Detect Chronic Kidney Disease from Retinal Photographs in Community-Based Populations. Lancet Digit. Health 2020, 2, e295–e302. [Google Scholar] [CrossRef]
- Zhang, K.; Liu, X.; Xu, J.; Yuan, J.; Cai, W.; Chen, T.; Wang, K.; Gao, Y.; Nie, S.; Xu, X.; et al. Deep-Learning Models for the Detection and Incidence Prediction of Chronic Kidney Disease and Type 2 Diabetes from Retinal Fundus Images. Nat. Biomed. Eng. 2021, 5, 533–545. [Google Scholar] [CrossRef]
- Zhang, S.; Chen, R.; Wang, Y.; Hu, W.; Kiburg, K.V.; Zhang, J.; Yang, X.; Yu, H.; He, M.; Wang, W.; et al. Association of Retinal Age Gap and Risk of Kidney Failure: A UK Biobank Study. Am. J. Kidney Dis. 2022, 81, 537–544.e1. [Google Scholar] [CrossRef]
- Rim, T.H.; Lee, G.; Kim, Y.; Tham, Y.-C.; Lee, C.J.; Baik, S.J.; Kim, Y.A.; Yu, M.; Deshmukh, M.; Lee, B.K.; et al. Prediction of Systemic Biomarkers from Retinal Photographs: Development and Validation of Deep-Learning Algorithms. Lancet Digit. Health 2020, 2, e526–e536. [Google Scholar] [CrossRef]
- Bauskar, S.; Jain, P.; Gyanchandani, M. A Noninvasive Computerized Technique to Detect Anemia Using Images of Eye Conjunctiva. Pattern Recognit. Image Anal. 2019, 29, 438–446. [Google Scholar] [CrossRef]
- Chen, Y.; Zhong, K.; Zhu, Y.; Sun, Q. Two-Stage Hemoglobin Prediction Based on Prior Causality. Front. Public Health 2022, 10, 1079389. [Google Scholar] [CrossRef] [PubMed]
- Wu, Y.; Wang, D.; Wu, X.; Shen, L.; Zhao, L.; Wang, W.; Xiao, H.; Wang, X.; Liu, L.; Lin, Z.; et al. Optical Coherence Tomography Angiography for the Characterisation of Retinal Microvasculature Alterations in Pregnant Patients with Anaemia: A Nested Case—control Study. Br. J. Ophthalmol. 2022. [Google Scholar] [CrossRef] [PubMed]
- Mitani, A.; Huang, A.; Venugopalan, S.; Corrado, G.S.; Peng, L.; Webster, D.R.; Hammel, N.; Liu, Y.; Varadarajan, A.V. Detection of Anaemia from Retinal Fundus Images via Deep Learning. Nat. Biomed. Eng. 2020, 4, 18–27. [Google Scholar] [CrossRef] [PubMed]
- Zhao, X.; Meng, L.; Su, H.; Lv, B.; Lv, C.; Xie, G.; Chen, Y. Deep-Learning-Based Hemoglobin Concentration Prediction and Anemia Screening Using Ultra-Wide Field Fundus Images. Front. Cell Dev. Biol. 2022, 10, 888268. [Google Scholar] [CrossRef] [PubMed]
- Wei, H.; Shen, H.; Li, J.; Zhao, R.; Chen, Z. AneNet: A Lightweight Network for the Real-Time Anemia Screening from Retinal Vessel Optical Coherence Tomography Images. Opt. Laser Technol. 2021, 136, 106773. [Google Scholar] [CrossRef]
- Xiao, W.; Huang, X.; Wang, J.H.; Lin, D.R.; Zhu, Y.; Chen, C.; Yang, Y.H.; Xiao, J.; Zhao, L.Q.; Li, J.-P.O.; et al. Screening and Identifying Hepatobiliary Diseases through Deep Learning Using Ocular Images: A Prospective, Multicentre Study. Lancet Digit. Health 2021, 3, e88–e97. [Google Scholar] [CrossRef]
- Huang, Q.; Lv, W.; Zhou, Z.; Tan, S.; Lin, X.; Bo, Z.; Fu, R.; Jin, X.; Guo, Y.; Wang, H.; et al. Machine Learning System for Lung Neoplasms Distinguished Based on Scleral Data. Diagnostics 2023, 13, 648. [Google Scholar] [CrossRef]
- Lv, W.; Song, Y.; Fu, R.; Lin, X.; Su, Y.; Jin, X.; Yang, H.; Shan, X.; Du, W.; Huang, Q.; et al. Deep Learning Algorithm for Automated Detection of Polycystic Ovary Syndrome Using Scleral Images. Front. Endocrinol. 2021, 12, 789878. [Google Scholar] [CrossRef]
- Kim, B.R.; Yoo, T.K.; Kim, H.K.; Ryu, I.H.; Kim, J.K.; Lee, I.S.; Kim, J.S.; Shin, D.-H.; Kim, Y.-S.; Kim, B.T. Oculomics for Sarcopenia Prediction: A Machine Learning Approach toward Predictive, Preventive, and Personalized Medicine. EPMA J. 2022, 13, 367–382. [Google Scholar] [CrossRef]
- Wang, J.J.; Liew, G.; Wong, T.Y.; Smith, W.; Klein, R.; Leeder, S.R.; Mitchell, P. Retinal Vascular Calibre and the Risk of Coronary Heart Disease-Related Death. Heart 2006, 92, 1583–1587. [Google Scholar] [CrossRef]
- Wong, T.Y.; Kamineni, A.; Klein, R.; Sharrett, A.R.; Klein, B.E.; Siscovick, D.S.; Cushman, M.; Duncan, B.B. Quantitative Retinal Venular Caliber and Risk of Cardiovascular Disease in Older Persons: The Cardiovascular Health Study. Arch. Intern. Med. 2006, 166, 2388–2394. [Google Scholar] [CrossRef] [PubMed]
- Seidelmann, S.B.; Claggett, B.; Bravo, P.E.; Gupta, A.; Farhad, H.; Klein, B.E.; Klein, R.; Di Carli, M.; Solomon, S.D. Retinal Vessel Calibers in Predicting Long-Term Cardiovascular Outcomes: The Atherosclerosis Risk in Communities Study. Circulation 2016, 134, 1328–1338. [Google Scholar] [CrossRef] [PubMed]
- Wong, T.Y.; Islam, F.M.A.; Klein, R.; Klein, B.E.K.; Cotch, M.F.; Castro, C.; Sharrett, A.R.; Shahar, E. Retinal Vascular Caliber, Cardiovascular Risk Factors, and Inflammation: The Multi-Ethnic Study of Atherosclerosis (MESA). Investig. Ophthalmol. Vis. Sci. 2006, 47, 2341–2350. [Google Scholar] [CrossRef] [PubMed]
- Wong, T.Y.; Klein, R.; Klein, B.E.K.; Tielsch, J.M.; Hubbard, L.; Nieto, F.J. Retinal Microvascular Abnormalities and Their Relationship with Hypertension, Cardiovascular Disease, and Mortality. Surv. Ophthalmol. 2001, 46, 59–80. [Google Scholar] [CrossRef] [PubMed]
- Zhu, Z.; Chen, Y.; Wang, W.; Wang, Y.; Hu, W.; Shang, X.; Liao, H.; Shi, D.; Huang, Y.; Ha, J.; et al. Association of Retinal Age Gap with Arterial Stiffness and Incident Cardiovascular Disease. Stroke 2022, 53, 3320–3328. [Google Scholar] [CrossRef]
- Zhu, Z.; Hu, W.; Chen, R.; Xiong, R.; Wang, W.; Shang, X.; Chen, Y.; Kiburg, K.; Shi, D.; He, S.; et al. Retinal Age Gap as a Predictive Biomarker of Stroke Risk. BMC Med. 2022, 20, 466. [Google Scholar] [CrossRef]
- Tang, M.Y.; Blazes, M.S.; Lee, C.S. Imaging Amyloid and Tau in the Retina: Current Research and Future Directions. J. Neuroophthalmol. 2022, 42, 149–152. [Google Scholar] [CrossRef]
- Lemmens, S.; Van Craenendonck, T.; Van Eijgen, J.; De Groef, L.; Bruffaerts, R.; de Jesus, D.A.; Charle, W.; Jayapala, M.; Sunaric-Mégevand, G.; Standaert, A.; et al. Combination of Snapshot Hyperspectral Retinal Imaging and Optical Coherence Tomography to Identify Alzheimer’s Disease Patients. Alzheimer’s Res. Ther. 2020, 12, 144. [Google Scholar] [CrossRef]
- Lustig-Barzelay, Y.; Sher, I.; Sharvit-Ginon, I.; Feldman, Y.; Mrejen, M.; Dallasheh, S.; Livny, A.; Schnaider Beeri, M.; Weller, A.; Ravona-Springer, R.; et al. Machine Learning for Comprehensive Prediction of High Risk for Alzheimer’s Disease Based on Chromatic Pupilloperimetry. Sci. Rep. 2022, 12, 9945. [Google Scholar] [CrossRef]
- Spaide, R.F.; Curcio, C.A. Evaluation of Segmentation of the Superficial and Deep Vascular Layers of the Retina by Optical Coherence Tomography Angiography Instruments in Normal Eyes. JAMA Ophthalmol. 2017, 135, 259–262. [Google Scholar] [CrossRef]
- Wei, Q.; Cao, H.; Shi, Y.; Xu, X.; Li, T. Machine Learning Based on Eye-Tracking Data to Identify Autism Spectrum Disorder: A Systematic Review and Meta-Analysis. J. Biomed. Inform. 2023, 137, 104254. [Google Scholar] [CrossRef]
- Cortes-Briones, J.A.; Tapia-Rivas, N.I.; D’Souza, D.C.; Estevez, P.A. Going Deep into Schizophrenia with Artificial Intelligence. Schizophr. Res. 2022, 245, 122–140. [Google Scholar] [CrossRef]
- Kanhirakadavath, M.R.; Chandran, M.S.M. Investigation of Eye-Tracking Scan Path as a Biomarker for Autism Screening Using Machine Learning Algorithms. Diagnostics 2022, 12, 518. [Google Scholar] [CrossRef] [PubMed]
- Xie, J.; Wang, L.; Webster, P.; Yao, Y.; Sun, J.; Wang, S.; Zhou, H. Identifying Visual Attention Features Accurately Discerning Between Autism and Typically Developing: A Deep Learning Framework. Interdiscip. Sci. Comput. Life Sci. 2022, 14, 639–651. [Google Scholar] [CrossRef] [PubMed]
- Chen, Y.-M.; Miaou, S.-G.; Bian, H. Examining Palpebral Conjunctiva for Anemia Assessment with Image Processing Methods. Comput. Methods Programs Biomed. 2016, 137, 125–135. [Google Scholar] [CrossRef] [PubMed]
- Korkmaz, M.F.; Can, M.E.; Kazancı, E.G. Effects of Iron Deficiency Anemia on Peripapillary and Macular Vessel Density Determined Using Optical Coherence Tomography Angiography on Children. Graefes Arch. Clin. Exp. Ophthalmol. 2020, 258, 2059–2068. [Google Scholar] [CrossRef]
- Yuan, T.-H.; Yue, Z.-S.; Zhang, G.-H.; Wang, L.; Dou, G.-R. Beyond the Liver: Liver-Eye Communication in Clinical and Experimental Aspects. Front. Mol. Biosci. 2021, 8, 823277. [Google Scholar] [CrossRef]
- Sung, H.; Ferlay, J.; Siegel, R.L.; Laversanne, M.; Soerjomataram, I.; Jemal, A.; Bray, F. Global Cancer Statistics 2020: GLOBOCAN Estimates of Incidence and Mortality Worldwide for 36 Cancers in 185 Countries. CA Cancer J. Clin. 2021, 71, 209–249. [Google Scholar] [CrossRef]
- Cruz-Jentoft, A.J.; Sayer, A.A. Sarcopenia. Lancet 2019, 393, 2636–2646. [Google Scholar] [CrossRef] [PubMed]
- Cunningham, P.J. The Growing Financial Burden of Health Care: National and State Trends, 2001–2006. Health Aff. 2010, 29, 1037–1044. [Google Scholar] [CrossRef]
- Price, W.N.; Cohen, I.G. Privacy in the Age of Medical Big Data. Nat. Med. 2019, 25, 37–43. [Google Scholar] [CrossRef] [PubMed]
- Xu, J.; Xue, K.; Zhang, K. Current Status and Future Trends of Clinical Diagnoses via Image-Based Deep Learning. Theranostics 2019, 9, 7556–7565. [Google Scholar] [CrossRef] [PubMed]
- Castelvecchi, D. Can We Open the Black Box of AI? Nat. News 2016, 538, 20. [Google Scholar] [CrossRef] [PubMed]
- Wadden, J.J. Defining the Undefinable: The Black Box Problem in Healthcare Artificial Intelligence. J. Med. Ethics 2022, 48, 764–768. [Google Scholar] [CrossRef] [PubMed]
- Braun, M.; Hummel, P.; Beck, S.; Dabrock, P. Primer on an Ethics of AI-Based Decision Support Systems in the Clinic. J. Med. Ethics 2020, 47, e3. [Google Scholar] [CrossRef]
- Ghassemi, M.; Oakden-Rayner, L.; Beam, A.L. The False Hope of Current Approaches to Explainable Artificial Intelligence in Health Care. Lancet Digit. Health 2021, 3, e745–e750. [Google Scholar] [CrossRef]
- Tjoa, E.; Guan, C. A Survey on Explainable Artificial Intelligence (XAI): Toward Medical XAI. IEEE Trans. Neural Netw. Learn. Syst. 2021, 32, 4793–4813. [Google Scholar] [CrossRef]
- Sheng, B.; Chen, X.; Li, T.; Ma, T.; Yang, Y.; Bi, L.; Zhang, X. An Overview of Artificial Intelligence in Diabetic Retinopathy and Other Ocular Diseases. Front. Public Health 2022, 10, 971943. [Google Scholar] [CrossRef]
- Cheung, C.Y.; Biousse, V.; Keane, P.A.; Schiffrin, E.L.; Wong, T.Y. Hypertensive Eye Disease. Nat. Rev. Dis. Primer 2022, 8, 14. [Google Scholar] [CrossRef] [PubMed]
- Bahn, R.S. Graves’ Ophthalmopathy. N. Engl. J. Med. 2010, 362, 726–738. [Google Scholar] [CrossRef] [PubMed]
- James, W.P.T.; Chunming, C.; Inoue, S. Appropriate Asian Body Mass Indices? Obes. Rev. 2002, 3, 139. [Google Scholar] [CrossRef] [PubMed]


| Author, Year | Target Disease | Input | Architectures | Training/Testing Dataset | External Validation | Recruitment | Task 3 | Outcome | Output | Results 1 |
|---|---|---|---|---|---|---|---|---|---|---|
| Cheung et al., 2021 [15] | CVD | Fundus images | CNN | SEED: 5309 images | 10 external datasets: 5636 images | Retrospective | Prediction | Retinal-vessel morphological parameters | Regression | Related 2 |
| Lee et al., 2023 [25] | CVD | Fundus images | CNN, DNN | Samsung Medical Center: 3518 images for training, 2954 images for internal validation | UK Biobank: 11,298 images | Retrospective | Prediction | Clinical diagnosis | Binary | AUC = 0.872 |
| Son et al., 2020 [20] | CVD | Fundus images | Inception-v3 | Seoul National University Bundang Hospital: 44,184 images for training, and 5-fold validation | N/A | Retrospective | Prediction | Coronary artery calcium score | Binary | AUC = 0.832 |
| Poplin et al., 2018 [18] | MACE | Fundus images | Inception-v3 | UK Biobank: 96,082 images for training, 24,008 images for validation; EyePACS: 1,682,938 images for training, 1958 images for validation | N/A | Retrospective | Prediction | Clinical diagnosis | Binary | AUC = 0.70 |
| Nusinovici et al., 2022 [19] | CVD | Fundus images | RetiAGE | Korean Health Screening study: 129,236 images for training | UK Biobank: 56,301 patients. | Retrospective | Prediction | Biological age | Regression | Related |
| Rim et al., 2021 [21] | CACS | Fundus images | RetiCAC | South Korean health screening centre1: 5590 images for internal testing | South Korean health screening centre2: 18,920 images; CMERC-HI: 1054 images; SEED: 17,102 images; UK Biobank: 93,358 images | Retrospective | Prediction | Coronary artery calcium score | Binary | AUC = 0.742 |
| Tseng et al., 2023 [22] | CACS | Fundus images | Deep learning | UK Biobank: 48,260 patients | N/A | Retrospective | Prediction | Reti-CVD score | Regression | Related |
| Chang et al., 2020 [23] | CVD | Fundus images | DL-FAS | Seoul National University Hospital: 15,408 images for training | N/A | Retrospective | Prediction | Atherosclerosis Score | Binary | AUC = 0.713 |
| Duan et al., 2022 [17] | Ischemic Stroke | OCTA | OCTA-Net | Peking University Third Hospital: 60 patients | N/A | Retrospective | Identification | Retinal-vessel morphological parameters | Regression | Related |
| Diaz-Pinto et al., 2022 [24] | Myocardial Infarction | Fundus images | ResNet50 | UK Biobank: 87,476 participants | N/A | Retrospective | Prediction | Cardiac indices | Binary | AUC = 0.80 |
| Zekavat et al., 2022 [16] | Congestive heart failure | Fundus images | CNN | UK Biobank: 97,895 images | N/A | Retrospective | Prediction | Retinal-vessel morphological parameters | Regression | Related |
| Author, Year | Target Disease | Input | Architectures | Training/Testing Dataset | External Validation | Recruitment | Task 3 | Outcome | Output | Results 1 |
|---|---|---|---|---|---|---|---|---|---|---|
| Nunes et al., 2019 [26] | AD PD | OCT | SVM | University of Coimbra, Portugal: 20 AD patients, 28 PD patients, 27 HC | N/A | Retrospective | Identification | Clinical diagnosis | Ternary | ACC = 0.822 |
| Wang et al., 2022 [28] | AD | OCT | XGBoost | Xiangya Hospital:159 AD patients, 299 HC | N/A | Prospective | Identification | Clinical diagnosis | Binary | ACC = 0.74 |
| Wang et al., 2022 [27] | AD | OCTA | Adaptive boosting | Xiangya Hospital: 77 AD patients, 145 HC | N/A | Prospective | Identification | Clinical diagnosis | Binary | AUC = 0.73 |
| Xie et al., 2023 [30] | AD | OCTA | OCTA-Net, FAZ-Net | Affiliated People’s Hospital of Ningbo University, Peking University Hospital: 55 AD patients, 41 MCI patients, 62 HC | N/A | Prospective | Identification | Retinal-vessel morphological parameters | Regression | Related 2 |
| Tian et al., 2021 [35] | AD | Fundus images | Multi-stage machine learning | UK Biobank: 122 images AD patients and 52,492 images HC, for training and 5-fold cross-validation | N/A | Retrospective | Identification | Clinical diagnosis | Binary | ACC = 0.8244 |
| Cheung et al., 2022 [29] | AD | Fundus images | EfficientNet-b2 | Eight centers in four countries: 12 949 images for training and testing, 648 AD patients, 3240 HC | N/A | Retrospective | Identification | Clinical diagnosis | Binary | AUC = 0.73 |
| Ahn et al., 2023 [32] | PD | Fundus images | ResNet-18, Fully connected neural network | Kangbuk Samsung Hospital, Seoul National University Hospital and Yeungnam University Hospital: 266 PD patients, 349 HC | N/A | Prospective | Identification | Clinical diagnosis | Binary | AUC = 0.67 |
| Hu et al., 2022 [31] | PD | Fundus images | N/A | UK Biobank: 19,200 images | N/A | Retrospective | Prediction | Retinal age gap | Binary | AUC = 0.708 |
| Montolío et al., 2021 [34] | MS | OCT | LSTM recurrent neural network | Miguel Servet University Hospital: 108 MS patients, 104 HC | N/A | Prospective | Prediction and Identification | Clinical diagnosis | Binary | AUC = 0.8165 |
| Pérez Del Palomar et al., 2019 [33] | MS | OCT | Random Forest with Adaboost | Miguel Servet University Hospital: 80 MS patients, 180 HC | N/A | Prospective | Identification | Clinical diagnosis | Binary | AUC = 0.998 |
| Appaji et al., 2022 [36] | SCZ | Fundus images | CNN | NIMHANS: 139 SCZ patients, 188 HC for training; 33 patients, 23 HC for validation; 17 patients, 13 HC for Testing | N/A | Prospective | Identification | Clinical diagnosis | Binary | AUC = 0.98 |
| Author, Year | Target Disease | Input | Architectures | Training/Testing Dataset | External Validation | Recruitment | Task 3 | Outcome | Output | Results 1 |
|---|---|---|---|---|---|---|---|---|---|---|
| Sabanayagam et al., 2022 [37] | CKD | Fundus images | CondenseNet | SEED: 5188 patients for training, 1297 patients for validation | SP2:3735 patients BES: 1538 patients | Retrospective | Identification | Laboratory index(eGFR) and Clinical diagnosis | Binary | AUC = 0.835 |
| Zhang et al., 2021 [38] | CKD, Early CKD | Fundus images | ResNet-50 | CC-FII data: 60,244 images for training, 8614 images for tuning, and 17,454 images for internal testing | CC-Fll data: 16,118 images; COACS: 6162 images | Prospective | Prediction and Identification | Laboratory index(eGFR) and Clinical diagnosis | Binary Binary | AUC = 0.885 AUC = 0.834 |
| Zhang et al., 2022 [39] | Kidney Failure | Fundus images | N/A | UK Biobank: 35,864 participants | N/A | Retrospective | Prediction | Retinal age gap | Regression | Related 2 |
| Bauskar et al., 2019 [41] | Anemia | Conjunctiva images | Modified SVM | 48 anemia patients, 51 HC for training, and k-Fold cross-validation | N/A | Prospective | Identification | Clinical diagnosis | Binary | AUC = 0.93 |
| Chen et al., 2022 [42] | Anemia | Conjunctiva images | Mask RCNN, MobileNetv3 | Southwest Hospital: 1065 patients | N/A | Retrospective | Identification | Laboratory index (Hb) and Clinical diagnosis | Regression | R2 =0.512 |
| Mitani et al., 2020 [44] | Anemia | Fundus images | Inception-v4 | UK Biobank: 7163 participants, 70% for training, 10% for tuning, and 20% for validation | N/A | Retrospective | Identification | Laboratory index (Hb) and Clinical diagnosis | Binary | AUC = 0.87 |
| Zhao et al., 2022 [45] | Anemia | Fundus images | ASModel_UWF, ASModel_Cropped UWF | Peking Union Medical College Hospital: 9221 images for training, 577 images for validation, 1730 images for testing | N/A | Prospective | Identification | Laboratory index (Hb) and Clinical diagnosis | Binary | AUC = 0.93 |
| Wei et al., 2021 [46] | Anemia | OCT | AneNet | the Second Xiangya Hospital: 17 anemia patients, 221 images; 13 HC, 207 images for training, 5-fold cross-validation | N/A | Retrospective | Identification | Clinical diagnosis | Binary | AUC = 0.9983 |
| Wu et al., 2022 [43] | Anemia | OCTA | N/A | Zhongshan Ophthalmic Centre, First Affiliated Hospital of Sun Yat-sen University: 99 patients, 184 HC | N/A | Prospective | Identification | Clinical diagnosis | Binary | AUC = 0.874 |
| Author, Year | Target Disease | Input | Architectures | Training/Testing Dataset | External Validation | Recruitment | Task 2 | Outcome | Output | Results 1 |
|---|---|---|---|---|---|---|---|---|---|---|
| Xiao et al., 2021 [47] | Liver cancer, Liver cirrhosis, Chronic viral hepatitis, NAFLD Cholelithiasis, Hepatic cyst | Fundus images, Slit-lamp images | ResNet-101 | 1252 participants, 2481 slit-lamp images, 1989 retinal images; 75% for training,20% for tuning | 1069 slit-lamp images, 800 retinal images | Prospective | Identification | Clinical diagnosis | Slit-lamp; | |
| Fundus: | ||||||||||
| Binary | AUC = 0.93; 0.84 | |||||||||
| Binary | AUC = 0.90; 0.83 | |||||||||
| Binary | AUC = 0.69; 0.62 | |||||||||
| Binary | AUC = 0.63; 0.70 | |||||||||
| Binary | AUC = 0.58; 0.68 | |||||||||
| Binary | AUC = 0.66; 0.69 | |||||||||
| Huang et al., 2023 [48] | Lung neoplasms | Scleral images | U-Net, Resnet-18, MIL model | Emergency General Hospital: 950 scleral images | N/A | Prospective | Identification | Clinical diagnosis | Binary | AUC = 0.897 |
| Lv et al., 2021 [49] | PCOS | Scleral images | U-Net, Resnet-18, MIL model | Peking University Third Hospital: 4608 images for training, 1160 images for testing, 5-fold cross-validation | N/A | Retrospective | Identification | Clinical diagnosis | Binary | AUC = 0.979 |
| Rim et al., 2020 [40] | CKD Sarcopenia | Fundus images | VGG-16 | Seven Asian and European cohorts: 86,994 images for training, 21,698 for testing | Health screening center affiliated with the Severance Gangnam Hospital: 9324 images; BES: 4234 images; SEED: 63,275 images; UK Biobank: 50,732 images | Retrospective | Identification | Laboratory index (Creatinine) Body muscle mass | Regression Regression | R2 = 0.12 R2 = 0.36 |
| Kim et al., 2022 [50] | Sarcopenia | Fundus images, Slit-lamp images | XGBoost | KNHANES: 8092 participants | N/A | Retrospective | Identification | Clinical diagnosis | Binary | Male: AUC = 0.75 Female: AUC = 0.785 |
Disclaimer/Publisher’s Note: The statements, opinions and data contained in all publications are solely those of the individual author(s) and contributor(s) and not of MDPI and/or the editor(s). MDPI and/or the editor(s) disclaim responsibility for any injury to people or property resulting from any ideas, methods, instructions or products referred to in the content. |
© 2023 by the authors. Licensee MDPI, Basel, Switzerland. This article is an open access article distributed under the terms and conditions of the Creative Commons Attribution (CC BY) license (https://creativecommons.org/licenses/by/4.0/).
Share and Cite
Li, H.; Cao, J.; Grzybowski, A.; Jin, K.; Lou, L.; Ye, J. Diagnosing Systemic Disorders with AI Algorithms Based on Ocular Images. Healthcare 2023, 11, 1739. https://doi.org/10.3390/healthcare11121739
Li H, Cao J, Grzybowski A, Jin K, Lou L, Ye J. Diagnosing Systemic Disorders with AI Algorithms Based on Ocular Images. Healthcare. 2023; 11(12):1739. https://doi.org/10.3390/healthcare11121739
Chicago/Turabian StyleLi, Huimin, Jing Cao, Andrzej Grzybowski, Kai Jin, Lixia Lou, and Juan Ye. 2023. "Diagnosing Systemic Disorders with AI Algorithms Based on Ocular Images" Healthcare 11, no. 12: 1739. https://doi.org/10.3390/healthcare11121739
APA StyleLi, H., Cao, J., Grzybowski, A., Jin, K., Lou, L., & Ye, J. (2023). Diagnosing Systemic Disorders with AI Algorithms Based on Ocular Images. Healthcare, 11(12), 1739. https://doi.org/10.3390/healthcare11121739