
Needs Analysis for Non-Face-to-Face Services among Older Adults to Reduce Loneliness


Abstract
:1. Introduction
2. Materials and Methods
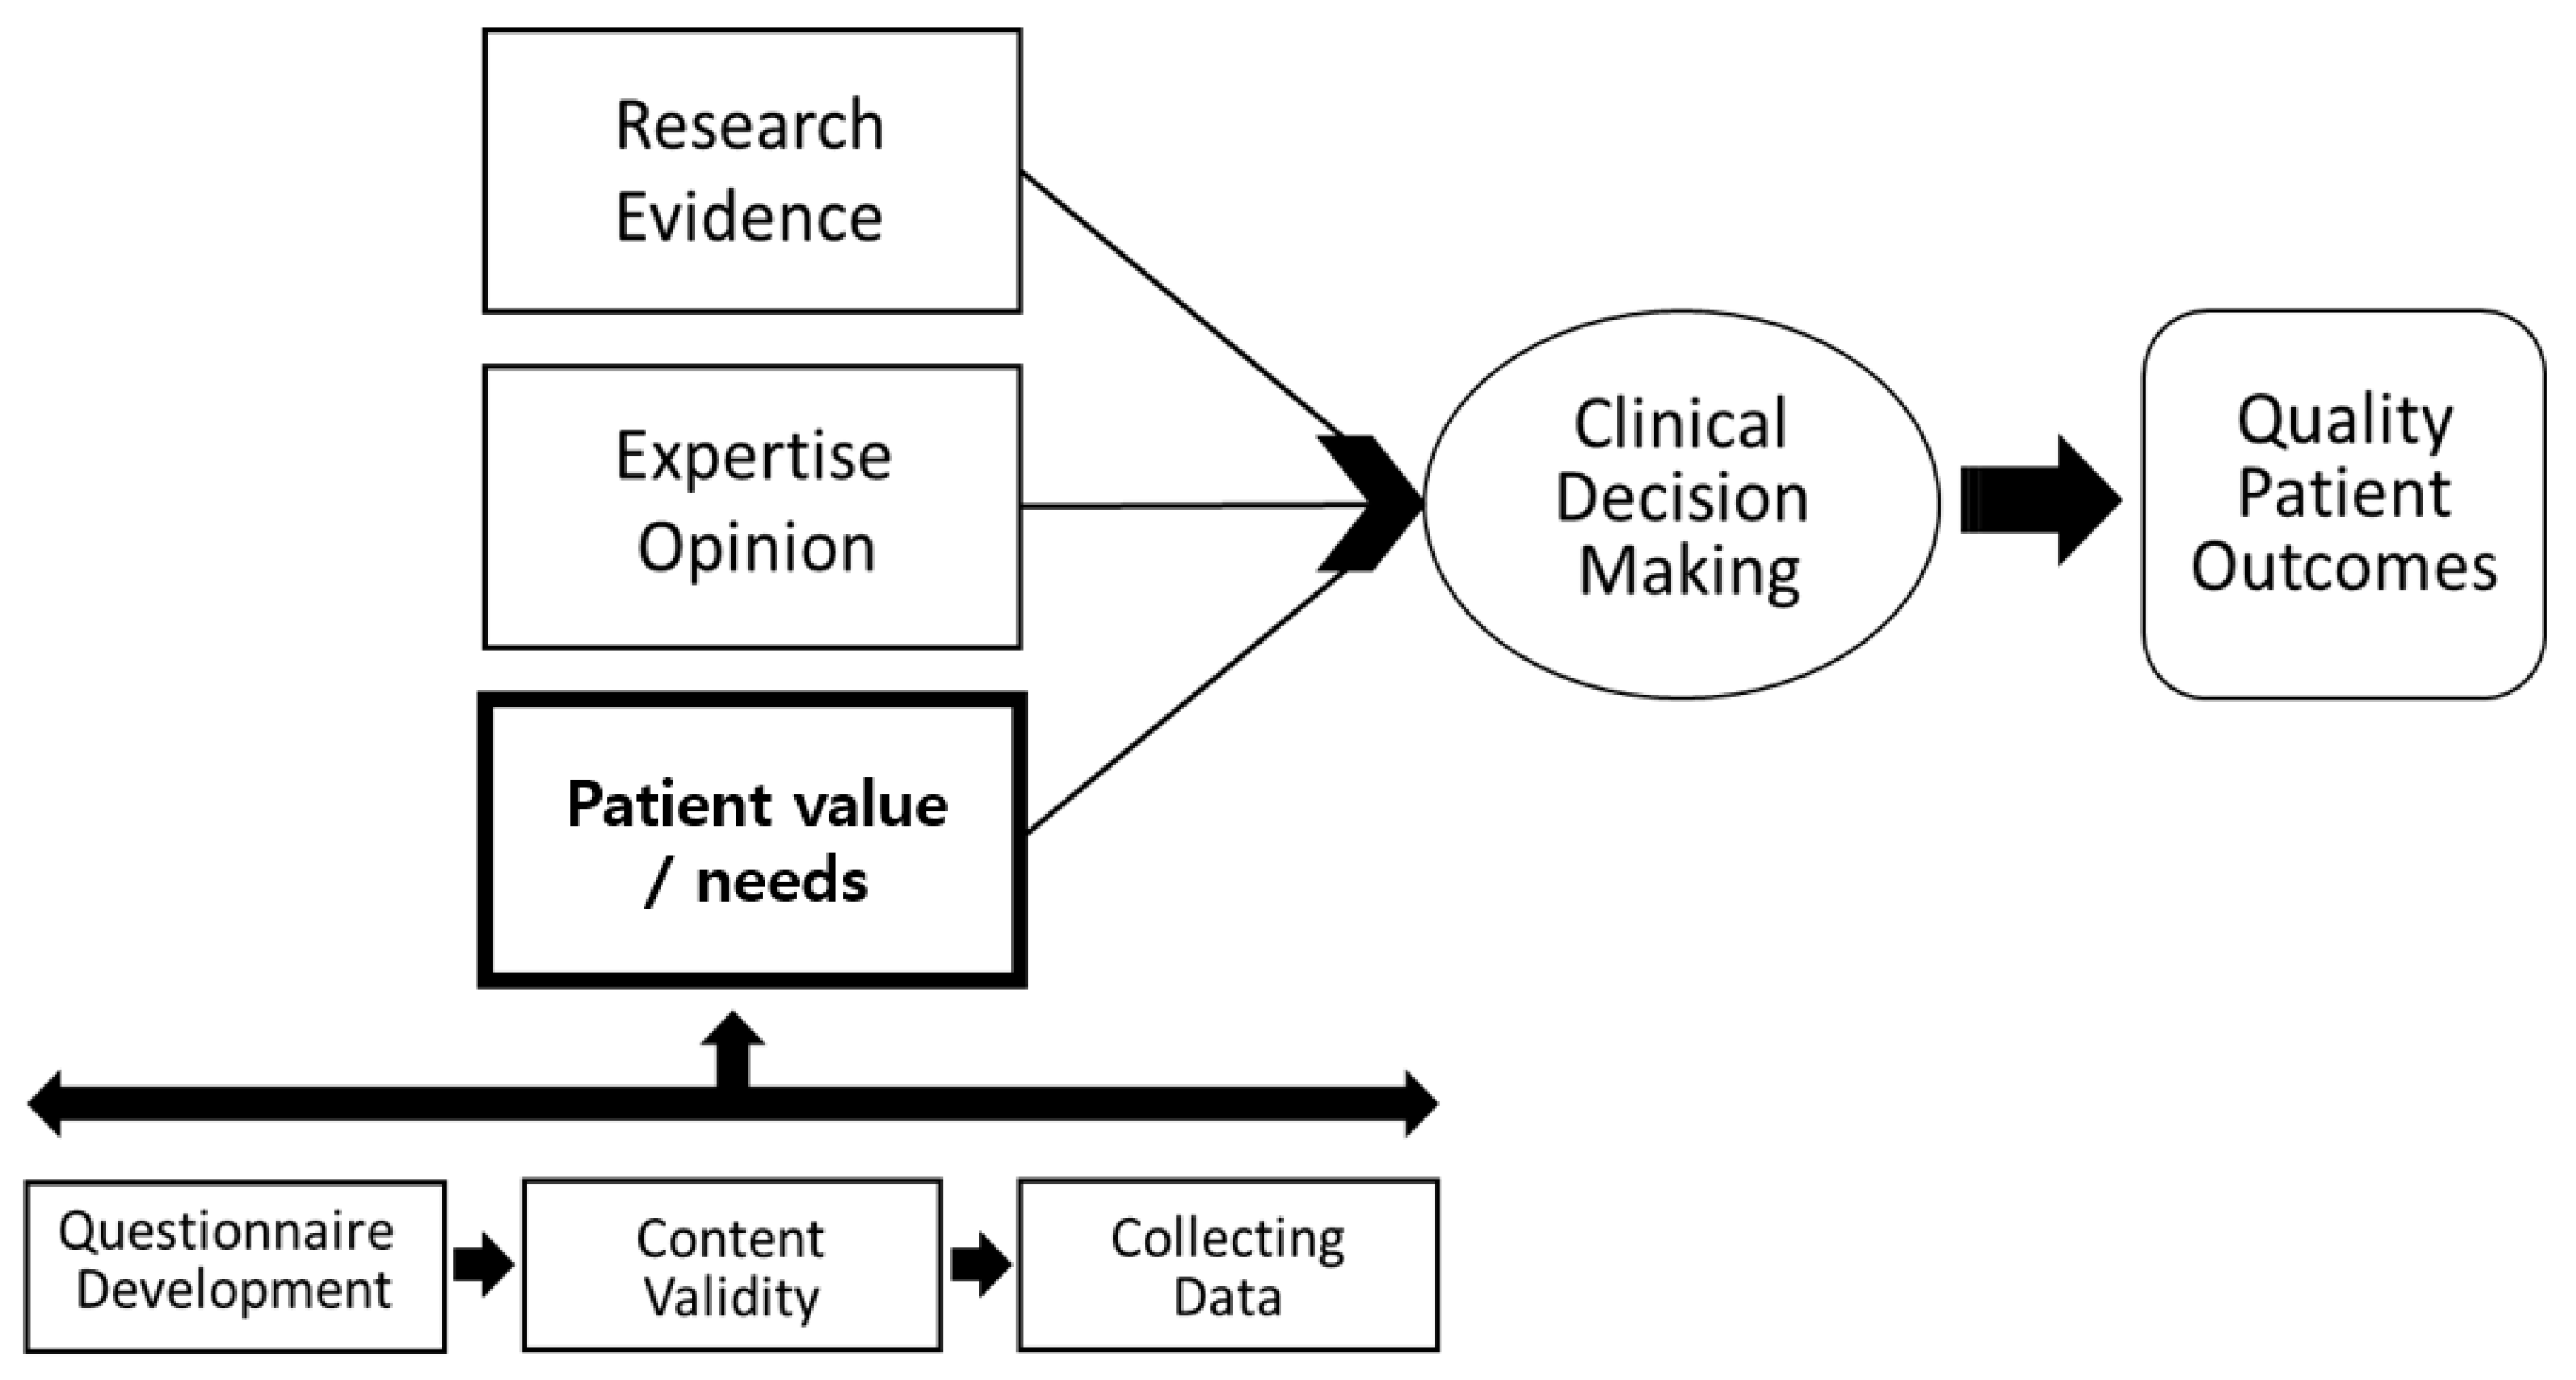
2.1. Research Frame Work
2.2. Participants and Sample Size Estimation
2.3. Questionnaire Development and Content Validity
2.4. Collecting Data and Statistical Analysis
2.5. Ethics
3. Results
3.1. Participants’ General Characteristics
3.2. Perceptions and Necessity of Non-Face-to-Face Services
3.3. Preferred Components of Non-Face-to-Face Service
3.4. Differences in Preference Related to Non-Face-to-Face Services According to Participants’ General Characteristics
3.4.1. Differences in Preference Related to Non-Face-to-Face Services According to Age
3.4.2. Differences in Preference Related to Non-Face-to-Face Services According to Gender
3.4.3. Differences in Preference Related to Non-Face-to-Face Services According to Education
3.4.4. Differences in Preference Related to Non-Face-to-Face Services According to Smart Device Experience
3.4.5. Differences in Preference Related to Non-Face-to-Face Services According to Exercise Implementation
3.4.6. Differences in Preference Related to Non-Face-to-Face Services According to Self-Rated Health Status
3.4.7. Differences in Preference Related to Non-Face-to-Face Services According to Self-Rated Economic Status
4. Discussion
4.1. Perceptions and Necessity
4.2. Preferred Components
4.3. Difference in Preference According to General Characteristics of Participants
4.4. Limitations
5. Conclusions
Author Contributions
Funding
Institutional Review Board Statement
Informed Consent Statement
Data Availability Statement
Acknowledgments
Conflicts of Interest
Appendix A. Developed Questionnaire on Non-Face-to-Face Service Needs of Community-Dwelling Older Adults in South Korea
Appendix A.1. Demographics
- What is your age? ( )
- What is your gender?
| ① Man | ② woman |
- 3.
- What is your residence status?
| ① Living alone | ② With spouse | ③ With spouse, sons, and daughters |
| ④ With sons and daughters | ⑤ Others ( ) |
- 4.
- What is the highest level of education?
| ① No formal education | ② Elementary school | ③ Middle school |
| ④ High school | ⑤ College/University | ⑥ Graduate school |
- 5.
- What is your self-rated economic status?
| ① High | ② Middle | ③ Low |
- 6.
- What is your self-rated health status?
| ① High | ② Middle | ③ Low |
- 7.
- Are you currently diagnosed with any disease? (Multiple answers allowed)
| ① Hypertension | ② Diabetes mellitus | ③ Dementia |
| ④ Depression | ⑤ Respiratory disease | ⑥ Parkinson’s disease |
| ⑦ Arthritis | ⑧ Osteoporosis | ⑨ Cardiovascular disease |
| ➉ Peripheral Neuropathy | ⑪ Tuberculosis | ⑫ Stroke |
| ⑬ Arrhythmia | ⑭ Other nervous system | ⑮ Others ( ) |
- 8.
- Do you usually exercise?
| ① Yes (→ Go to Q9) | ② No (→ Go to Q10) |
- 9.
- (① for Q8) What kind of exercise do you mainly do?
| ① Walking | ② Running | ③ Swimming |
| ④ Hiking | ⑤ Gymnastics | ⑥ Bicycle |
| ⑦ Others ( ) |
Appendix A.2. Perception and Necessity of Non-Face-to-Face Services for Older Adults
| ※ Definition of “non-face-to-face service” for older adults The non-face-to-face service for the elderly is to mediate the health, safety, and emotional parts of the elderly with electronic devices such as smartphones and tablets without meeting people |
- 10.
- Have you heard of non-face-to-face service?
| ① Yes | ② No |
- 11.
- Do you think non-face-to-face services are necessary for community-dwelling older adults?
| ① Strongly Agree | ② Agree | ③ Weakly agree | |
| ④ Neither agree nor disagree | ⑤ Disagree | ⑥ Strongly disagree | |
| ※ | ①–③ (→ Go to Q12) | ⑤, ⑥ (→ Go to Q13) | |
- 12.
- (①–③ for Q11) Why did you think the service was necessary?
| ① Because the elderly are inconvenient to move |
| ② Because there is a risk of infection such as COVID-19 |
| ③ Smart programs for the elderly are increasing |
| ④ I think it would be fun to use the service |
| ⑤ Using the service seems to reduce loneliness |
| ⑥ Others ( ) |
- 13.
- (⑤, ⑥ for Q11) Why did you think the service was unnecessary?
| ① It seems difficult to learn a new device |
| ② It seems that it will cost a lot to buy the device |
| ③ I want to use the device, but there is no one to help me |
| ④ It is better to meet people in person and do activities |
| ⑤ Others ( ) |
- 14.
- Will you participate in non-face-to-face service once it is established?
| ① Yes (→ go to Q15) | ② No (→ go to Q16) |
- 15.
- (“Yes” for Q14) What is the reason for participating the service?
| ① I think it will be interesting to experience new devices and services |
| ② Difficulty in direct visits to public health centers, senior citizens’ centers, etc. due to difficulty in mobility |
| ③ I think it would be better to have mediation at home because of COVID-19 |
| ④ I think I can get a lot of information about my health |
| ⑤ Using the service seems to reduce loneliness |
| ⑥ Others ( ) |
- 16.
- (“No” for Q14) What is the reason for not participating the service?
| ① No economic leeway |
| ② It is better to visit and receive service in person |
| ③ Inconvenient to use the device without a guardian |
| ④ Fear of learning a new device |
| ⑤ Wi-Fi is not available |
| ⑥ Others ( ) |
- 17.
- How much participation do you think is appropriate for non-face-to-face service?
| ① Once a week | ② Twice a week | ③ Three times a week |
| ④ Four times a week | ⑤ Five times a week |
- 18.
- How many hours do you think is appropriate for non-face-to-face service?
| ① Less than 30 min | ② More than 30 min to less than 1 h | ③ More than 1 h to less than 1 h 30 min |
| ④ More than 1 h 30 min to less than 2 h | ⑤ More than 2 h |
- 19.
- What is your favorite music genre? (Multiple answers allowed)
| ① Trot | ② Popular song | ③ Classic |
| ④ Traditional music | ⑤ Hymn | ⑥ Others ( ) |
- 20.
- What is your favorite game? (Multiple answers allowed)
| ① Shogi | ② Hwatu | ③ Omok |
| ④ Jigsaw puzzle | ⑤ Pairing | ⑥ Playing cards |
| ⑦ Memory quiz | ⑧ Baduk | ⑨ Smart game |
| ➉ Others ( ) |
- 21.
- What is your favorite book genre? (Multiple answers allowed)
| ① Traditional stories | ② Fairytale | ③ Poem |
| ④ Novel | ⑤ Religious books | ⑥ Others ( ) |
- 22.
- What is fun activities? (Multiple answers allowed)
| ① Biking | ② Climbing | ③ Walking |
| ④ Gymnastics | ⑤ Running | ⑥ Terra band |
| ⑦ Golf | ⑧ Ping-pong | ⑨ Badminton |
| ➉ Dance | ⑪ Others ( ) |
Appendix A.3. The Preference of Non-Face-to-Face Services for Older Adults
| Component | Preference | |||||
| Not at All Preferred | Low Preferred | Moderate | Preferred | Very Preferred | ||
| 1 | 2 | 3 | 4 | 5 | ||
| 23. Taking with smart devices | ||||||
| 24. Video calls | ||||||
| 25. Listening to music | ||||||
| 26. Sharing pictures | ||||||
| 27. Reading books | ||||||
| 28. Life information (Weather, news, etc.) | ||||||
| 29. Silver game | ||||||
| 30. Calendar and schedule | ||||||
| 31. Medication alarm | ||||||
| 32. Gymnastics with music | ||||||
| 33. Walking | ||||||
| 34. Health assessment (Oxygen saturation, pulse, blood pressure, blood sugar, body composition test, etc.) | ||||||
| 35. Nutrition education | ||||||
| 36. Daily intake record (Water, fruits, and vegetables, meat) | ||||||
| Comments | ||||||
References
- Lee, H.-J. The Impact of Isolation and Loneliness on Life Satisfaction and Depression in Community-Dwelling Elderly: The Mediating Effect of Perceived Control. J. Community Welf. 2012, 42, 157–177. [Google Scholar] [CrossRef]
- Chen, Y.-R.R.; Schulz, P.J. The effect of information communication technology interventions on reducing social isolation in the elderly: A systematic review. J. Med. Internet Res. 2016, 18, e4596. [Google Scholar] [CrossRef] [PubMed]
- Oh, S.-Y. Family function & loneliness on life satisfaction in the aged. J. Welf. Aged 2008, 42, 267–290. [Google Scholar]
- Ministry of Health and Welfare. 2018–2022 2nd Long-Term Care Master Plan; Ministry of Health and Welfare: Taiwan, China, 2018. Available online: http://www.mohw.go.kr/react/jb/sjb030301vw.jsp?PAR_MENU_ID=03&MENU_ID=0319&CONT_SEQ=345605&page=1 (accessed on 7 July 2021).
- Czaja, S.J.; Boot, W.R.; Charness, N.; Rogers, W.A.; Sharit, J. Improving social support for older adults through technology: Findings from the PRISM randomized controlled trial. Gerontologist 2018, 58, 467–477. [Google Scholar] [CrossRef] [PubMed]
- Chipps, J.; Jarvis, M.A.; Ramlall, S. The effectiveness of e-Interventions on reducing social isolation in older persons: A systematic review of systematic reviews. J. Telemed. Telecare 2017, 23, 817–827. [Google Scholar] [CrossRef]
- Dickens, A.P.; Richards, S.H.; Greaves, C.J.; Campbell, J.L. Interventions targeting social isolation in older people: A systematic review. BMC Public Health 2011, 11, 647. [Google Scholar] [CrossRef]
- Lee, J.-W. Changes and New Directions of Community Welfare in the Era of New Normal after COVID-19. Proc. Korea Assoc. Community Welf. Stud. 2020, 74, 3–28. [Google Scholar]
- Kim, Y.S. Current State and Development Directions for Dementia Care Technology. Health Welf. Policy Forum 2019, 2019, 42–57. [Google Scholar]
- Kim, J.Y.; Ko, Y.J. A Proposal of ICT Converged Service Design Scenarios for the Safe Living of the Elderly. J. Integr. Des. Res. 2018, 17, 129–139. [Google Scholar]
- Melnyk, B.M.; Gallagher-Ford, L.; Long, L.E.; Fineout-Overholt, E. The establishment of evidence-based practice competencies for practicing registered nurses and advanced practice nurses in real-world clinical settings: Proficiencies to improve healthcare quality, reliability, patient outcomes, and costs. Worldviews Evid.-Based Nurs. 2014, 11, 5–15. [Google Scholar] [CrossRef]
- Choi, H.K.; Lee, S.H. Trends and Effectiveness of ICT Interventions for the Elderly to Reduce Loneliness: A Systematic Review. Healthcare 2021, 9, 293. [Google Scholar] [CrossRef] [PubMed]
- Han, A.R.; Park, Y.H. Attitude Toward and Intention to Use Care Robot Technology in Older Adults and Family Members. Korean J. Adult Nurs. 2019, 31, 650–662. [Google Scholar] [CrossRef]
- Koo, B.M.; Joo, I.H. The effect of health related characteristics on the use of information and communication technology of older adults. J. Korea Gerontol. Soc. 2020, 40, 729–746. [Google Scholar] [CrossRef]
- Ju, K.; Kim, D.; Kim, J. Analysis of factors influencing digital divide on elderly and difference of gender. Soc. Welf. Policy 2018, 45, 209–234. [Google Scholar]
- Kim, G.E.; Park, H.J. Factors Affecting Consumers′ Experience of Using Smart Healthcare Focusing on Health Literacy and Personal Characteristics. J. Korea Contents Assoc. 2019, 19, 41–53. [Google Scholar]
- Walsh, K.; Callan, A. Perceptions, preferences, and acceptance of information and communication technologies in older-adult community care settings in Ireland: A case-study and ranked-care program analysis. Ageing Int. 2011, 36, 102–122. [Google Scholar] [CrossRef]
- Cohen, J. Statistical Power Analysis for the Behavioral Sciences; Routledge: London, UK, 2013. [Google Scholar]
- Loffredo, D.; Tavakkoli, A. What are European Union public attitudes towards robots. Syst. Cybern. Inform. 2016, 14, 11–19. [Google Scholar]
- Han, S. Cognitive aging and acceptance of information and communication technology. Seoul Natl. Univ. Inst. Econ. Res. 2017, 56, 51–60. [Google Scholar]
- Heerink, M.; Kröse, B.; Evers, V.; Wielinga, B. The influence of social presence on acceptance of a companion robot by older people. J. Phys. Agents 2008, 2, 33–40. [Google Scholar] [CrossRef]
- Oh, J.H.; Yi, Y.J.; Shin, C.J.; Park, C.; Kang, S.; Kim, J.; Kim, I.S. Effects of Silver-Care-Robot Program on Cognitive Function, Depression, and Activities of Daily Living for Institutionalized Elderly People. J. Korean Acad. Nurs. 2015, 45, 388–396. [Google Scholar] [CrossRef]
- Ali, R.; Hoque, E.; Duberstein, P.; Schubert, L.; Razavi, S.Z.; Kane, B.; Silva, C.; Daks, J.S.; Huang, M.; Van Orden, K. Aging and engaging: A pilot randomized controlled trial of an online conversational skills coach for older adults. Am. J. Geriatr. Psychiatry 2021, 29, 804–815. [Google Scholar] [CrossRef] [PubMed]
- Stafford, R.; Broadbent, E.; Jayawardena, C.; Unger, U.; Kuo, I.H.; Igic, A.; Wong, R.; Kerse, N.; Watson, C.; MacDonald, B.A. Improved robot attitudes and emotions at a retirement home after meeting a robot. In Proceedings of the 19th international symposium in robot and human interactive communication, Viareggio, Italy, 13–15 September 2010; IEEE: Piscataway, NJ, USA, 2010; pp. 82–87. [Google Scholar]
- Jayawardena, C.; Kuo, I.H.; Unger, U.; Igic, A.; Wong, R.; Watson, C.I.; Stafford, R.; Broadbent, E.; Tiwari, P.; Warren, J. Deployment of a service robot to help older people. In Proceedings of the 2010 IEEE/RSJ International Conference on Intelligent Robots and Systems, Taipei, Taiwan, 18–22 October 2010; IEEE: Piscataway, NJ, USA, 2010; pp. 5990–5995. [Google Scholar]
- Jo, H.S.; Kim, J.H.; Kim, S. Factors related to the effectiveness in the use of an ICT-based toy robot for the in-home care of community dwelling elderly. Korean J. Health Educ. Promot. 2019, 36, 43–51. [Google Scholar] [CrossRef]
- Ahn, J.H.; Lim, K.C.; Lee, Y.J.; Kim, K.S. Effects of Computer/Internet Game Play on Depression and Life Satisfaction among the Elderly: Mediating Effects ofPerceived Self-Control. J. Korea Contents Assoc. 2011, 11, 406–417. [Google Scholar] [CrossRef]
- Kim, Y.S.; Park, B.H.; Lee, H.Y. A study on predicting health literacy of Korean elderly using Andersen′s health behavior model. J. Welf. Aged Inst. 2014, 65, 35–57. [Google Scholar]
- Ministry of Health and Welfare. 2017 Survey Report on Seniors; Ministry of Health and Welfare: Taiwan, China, 2017.
- Joh, Y.H. A Study On Life Satisfaction With Social Activity In Elderly Women. Int. J. Adult Contin. Educ. 2009, 12, 1–28. [Google Scholar]
- Oh, Y.S.; Song, N.K. Investigating relationships between health-related problems and online health information seeking. CIN Comput. Inform. Nurs. 2017, 35, 29–35. [Google Scholar] [CrossRef] [PubMed]

| Variables | M ± SD/N (%) | Variables | M ± SD/N (%) | ||
|---|---|---|---|---|---|
| Age | Total | 73.2 ± 7.0 | Self-rated health status | Low | 20 (20.0) |
| ≤70 | 49 (49.0) | High | 15 (15.0) | ||
| 71~80 | 32 (32.0) | Middle | 66 (66.0) | ||
| ≥81 | 19 (19.0) | Exercise implementation | Yes | 71 (71.0) | |
| Gender | Men | 33 (33.0) | No | 29 (29.0) | |
| Women | 67 (67.0) | Types of exercise (multiple responses; n = 71) | Walking | 58 (81.7) | |
| Residence | Alone | 22 (22.0) | Running | 1 (1.4) | |
| With spouse | 44 (44.0) | Swimming | 3 (4.2) | ||
| With spouse, sons and daughters | 24 (24.0) | Hiking | 2 (2.8) | ||
| With sons and daughters | 9 (9.0) | Gymnastics | 11 (15.5) | ||
| Others | 1 (1.0) | Bicycle | 7 (9.9) | ||
| Education | Middle school or lower | 37 (37.0) | Others | 10 (14.1) | |
| High school or higher | 63 (63.0) | Experience in using smart device | Yes | 52 (52.0) | |
| Self-rated economic status | High | 13 (13.0) | No | 48 (48.0) | |
| Middle | 67 (67.0) | Current medical history | Yes | 88 (88.0) | |
| No | 12 (12.0) | ||||
| Variables | N (%) | |
|---|---|---|
| The need for non-face-to-face services for older adults | Strongly agree | 7 (7.0) |
| Agree | 41 (41.0) | |
| Weakly agree | 29 (29.0) | |
| Neither agree nor disagree | 12 (12.0) | |
| Disagree | 8 (8.0) | |
| Strongly disagree | 3 (3.0) | |
| Intention to use | Yes | 72 (72.0) |
| No | 28 (28.0) | |
| Number of interventions | Once a week | 37 (37.0) |
| Twice a week | 38 (38.0) | |
| Three times a week | 19 (19.0) | |
| Four times a week | 1 (1.0) | |
| Five times a week | 5 (5.0) | |
| Time per episode | Less than 30 min | 47 (47.0) |
| More than 30 min to less than 1 h | 44 (44.0) | |
| More than 1 h to less than 1 h 30 min | 4 (4.0) | |
| More than 1 h 30 min to less than 2 h | 3 (3.0) | |
| More than 2 h | 2 (2.0) | |
| Contents | Details | M ± SD |
|---|---|---|
| Talking with smart devices | Conversation with smart devices through voice recognition and AI speaker functions | 2.91 ± 1.22 |
| Video calls | Personalized video calls for older adults to easily participate in social activities because they are friendly and easy to communicate with people who frequently talk on the phone | 3.20 ± 1.19 |
| Listening to music | Listening to music that can be easily accessed and manipulated by securing preferred music sources | 3.37 ± 1.15 |
| Sharing pictures | Sharing pictures by accessing a community hub through smart devices | 3.41 ± 1.25 |
| Reading books | Reading books through smart devices reflecting the results of the preferred book genre survey | 3.24 ± 1.25 |
| Life information | Checking everyday information—such as weather and news—through smart devices | 3.33 ± 1.29 |
| Silver game | Playing games through smart devices reflecting the results of the preferred cognitive game genre survey | 2.90 ± 1.33 |
| Calendar and schedule | Checking one’s schedule—including anniversaries and meetings—through smart devices | 3.05 ± 1.14 |
| Medication alarm | Checking medication time alarm through smart devices | 3.06 ± 1.29 |
| Gymnastics with music | Connecting with smart devices to exercise with music in real-time classes | 2.99 ± 1.28 |
| Walking | Measuring steps per day through smart devices | 3.27 ± 1.15 |
| Health assessment | Measuring health information—such as oxygen saturation, pulse and blood pressure—through smart devices | 3.67 ± 1.17 |
| Nutrition education | Watching healthy eating and diet recipe videos through smart devices | 3.10 ± 1.31 |
| Daily intake record | Recording intake of water, fruits, vegetables, and meat through smart devices | 2.78 ± 1.13 |
| Variables | Age | Gender | Education | ||||||||||
|---|---|---|---|---|---|---|---|---|---|---|---|---|---|
| ≤70 (n = 49) | 71~80 (n = 32) | ≥81 (n = 19) | p | Post-Hoc | Men (n = 33) | Women (n = 67) | t | p | Middle school or lower (n = 37) | High school or higher (n = 63) | t | p | |
| Mean Rank | Mean Rank | Mean Rank | M ± SD | M ± SD | M ± SD | M ± SD | |||||||
| Talking with smart devices | 52.70 | 48.20 | 48.68 | 0.743 | 2.97 ± 1.16 | 2.88 ± 1.25 | 0.35 | 0.726 | 3.03 ± 1.30 | 2.84 ± 1.17 | 0.74 | 0.463 | |
| Video calls | 50.31 | 49.32 | 50.32 | 0.987 | 3.03 ± 1.05 | 3.29 ± 1.25 | −1.08 | 0.283 | 3.32 ± 1.23 | 3.13 ± 1.17 | 0.79 | 0.431 | |
| Listening to music | 49.33 | 52.09 | 48.16 | 0.863 | 2.97 ± 1.10 | 3.58 ± 1.12 | −2.56 | 0.013 | 3.54 ± 1.19 | 3.27 ± 1.12 | 1.12 | 0.266 | |
| Sharing pictures | 51.39 | 51.50 | 46.53 | 0.793 | 2.85 ± 1.06 | 3.69 ± 1.25 | −3.50 | 0.001 | 3.54 ± 1.26 | 3.33 ± 1.24 | 0.80 | 0.426 | |
| Reading books | 51.85 | 51.02 | 43.58 | 0.532 | 2.97 ± 1.19 | 3.38 ± 1.26 | −1.58 | 0.118 | 3.17 ± 1.34 | 3.29 ± 1.20 | −0.46 | 0.650 | |
| Life information | 48.40 | 52.63 | 52.34 | 0.766 | 3.52 ± 1.15 | 3.24 ± 1.35 | 1.07 | 0.290 | 3.32 ± 1.27 | 3.33 ± 1.31 | −0.03 | 0.973 | |
| Silver game | 53.56 | 47.77 | 47.21 | 0.570 | 3.21 ± 1.19 | 2.75 ± 1.37 | 1.74 | 0.085 | 2.73 ± 1.33 | 3.00 ± 1.33 | −0.98 | 0.329 | |
| Calendar and schedule | 49.04 | 51.34 | 52.84 | 0.862 | 3.18 ± 1.01 | 2.99 ± 1.20 | 0.86 | 0.394 | 3.08 ± 1.12 | 3.03 ± 1.16 | 0.21 | 0.836 | |
| Medication alarm | 44.73 | 53.53 | 58.06 | 0.156 | 3.00 ± 1.30 | 3.09 ± 1.30 | −0.32 | 0.749 | 3.19 ± 1.29 | 2.98 ± 1.30 | 0.76 | 0.447 | |
| Gymnastics with music | 47.79 | 57.36 | 42.94 | 0.160 | 2.79 ± 1.02 | 3.09 ± 1.39 | −1.23 | 0.223 | 2.89 ± 1.37 | 3.05 ± 1.23 | −0.59 | 0.559 | |
| Walking | 52.46 | 47.38 | 50.71 | 0.721 | 2.76 ± 1.15 | 2.61 ± 1.21 | 0.59 | 0.559 | 2.57 ± 1.26 | 2.71 ± 1.14 | −0.60 | 0.552 | |
| Health assessment | 44.73 | 60.34 | 48.79 | 0.045 | a < b | 3.42 ± 1.06 | 3.79 ± 1.21 | −1.55 | 0.126 | 3.57 ± 1.09 | 3.73 ± 1.22 | −0.67 | 0.506 |
| Nutrition education | 54.37 | 50.86 | 39.92 | 0.163 | 3.06 ± 1.03 | 3.12 ± 1.43 | −0.23 | 0.815 | 2.73 ± 1.28 | 3.32 ± 1.28 | −2.21 | 0.029 | |
| Daily intake record | 52.29 | 51.61 | 44.03 | 0.515 | 2.67 ± 0.99 | 2.84 ± 1.20 | −0.75 | 0.457 | 2.54 ± 1.17 | 2.92 ± 1.10 | −1.63 | 0.106 | |
| Variables | Smart Device Experience (n = 100) | Exercise Implementation (n = 99) | |||||||
|---|---|---|---|---|---|---|---|---|---|
| Yes (n = 53) | No (n = 47) | t | p | Yes (n = 70) | No (n = 29) | Mann-Whitney U | Z | p | |
| M ± SD | M ± SD | M ± SD | M ± SD | ||||||
| Talking with smart devices | 2.98 ± 1.20 | 2.83 ± 1.24 | 0.62 | 0.537 | 2.87 ± 1.17 | 3.07 ± 1.31 | 878.00 | −1.09 | 0.276 |
| Video calls | 3.31 ± 1.29 | 3.09 ± 1.06 | 0.94 | 0.349 | 3.12 ± 1.25 | 3.45 ± 0.99 | 837.00 | −1.31 | 0.190 |
| Listening to music | 3.51 ± 1.23 | 3.22 ± 1.03 | 1.27 | 0.208 | 3.26 ± 1.18 | 3.64 ± 1.06 | 778.50 | −1.64 | 0.101 |
| Sharing pictures | 3.49 ± 1.31 | 3.32 ± 1.18 | 0.68 | 0.496 | 3.50 ± 1.25 | 3.28 ± 1.19 | 907.50 | −0.85 | 0.396 |
| Reading books | 3.19 ± 1.32 | 3.30 ± 1.17 | −0.46 | 0.647 | 3.28 ± 1.28 | 3.21 ± 1.18 | 976.50 | −0.19 | 0.847 |
| Life information | 3.60 ± 1.26 | 3.02 ± 1.26 | 2.31 | 0.023 | 3.46 ± 1.26 | 3.10 ± 1.29 | 848.00 | −1.32 | 0.187 |
| Silver game | 3.02 ± 1.32 | 2.77 ± 1.34 | 0.95 | 0.345 | 2.89 ± 1.39 | 2.90 ± 1.21 | 1003.50 | −0.09 | 0.928 |
| Calendar and schedule | 3.25 ± 1.22 | 2.83 ± 1.01 | 1.84 | 0.069 | 3.20 ± 1.15 | 2.72 ± 1.07 | 775.00 | −1.92 | 0.055 |
| Medication alarm | 3.26 ± 1.39 | 2.83 ± 1.14 | 1.70 | 0.093 | 3.12 ± 1.33 | 2.97 ± 1.21 | 931.50 | −0.55 | 0.582 |
| Gymnastics with music | 3.19 ± 1.35 | 2.76 ± 1.18 | 1.67 | 0.098 | 3.04 ± 1.33 | 2.90 ± 1.18 | 945.00 | −0.44 | 0.657 |
| Walking | 3.56 ± 1.13 | 2.96 ± 1.10 | 2.67 | 0.009 | 3.36 ± 1.18 | 3.03 ± 1.09 | 838.50 | −1.32 | 0.188 |
| Health assessment | 3.92 ± 1.22 | 3.38 ± 1.05 | 2.36 | 0.020 | 3.80 ± 1.23 | 3.41 ± 0.95 | 792.00 | −1.79 | 0.073 |
| Nutrition education | 3.30 ± 1.26 | 2.87 ± 1.33 | 1.66 | 0.101 | 3.34 ± 1.30 | 2.59 ± 1.15 | 701.00 | −2.49 | 0.013 |
| Daily intake record | 3.04 ± 1.13 | 2.49 ± 1.08 | 2.48 | 0.015 | 2.96 ± 1.17 | 2.38 ± 0.94 | 708.00 | −2.51 | 0.012 |
| Variables | Self-Rated Health Status (n = 100) | Self-Rated Economic Status (n = 100) | ||||||
|---|---|---|---|---|---|---|---|---|
| High (n = 15) | Middle (n = 66) | Low (n = 19) | p | High (n = 13) | Middle (n = 67) | Low (n = 20) | p | |
| Mean Rank | Mean Rank | Mean Rank | Mean Rank | Mean Rank | Mean Rank | |||
| Talking with smart devices | 50.60 | 50.06 | 51.95 | 0.967 | 48.42 | 50.25 | 52.70 | 0.905 |
| Video calls | 48.60 | 48.18 | 57.32 | 0.444 | 61.65 | 50.00 | 42.43 | 0.153 |
| Listening to music | 38.10 | 54.05 | 45.53 | 0.098 | 58.96 | 46.07 | 57.74 | 0.123 |
| Sharing pictures | 37.53 | 50.70 | 60.03 | 0.070 | 56.23 | 51.33 | 44.00 | 0.438 |
| Reading books | 40.63 | 52.26 | 49.66 | 0.346 | 39.27 | 53.57 | 45.20 | 0.166 |
| Life information | 52.20 | 50.50 | 49.16 | 0.953 | 60.27 | 50.21 | 45.13 | 0.319 |
| Silver game | 58.97 | 51.30 | 41.03 | 0.173 | 48.00 | 51.61 | 48.40 | 0.855 |
| Calendar and schedule | 52.30 | 51.12 | 46.92 | 0.816 | 64.73 | 47.81 | 50.25 | 0.136 |
| Medication alarm | 47.40 | 50.26 | 51.22 | 0.919 | 57.62 | 49.76 | 45.85 | 0.496 |
| Gymnastics with music | 45.90 | 51.99 | 46.11 | 0.605 | 53.69 | 49.67 | 48.68 | 0.869 |
| Walking | 47.90 | 50.42 | 50.21 | 0.949 | 53.08 | 46.70 | 58.88 | 0.203 |
| Health assessment | 51.10 | 51.57 | 46.32 | 0.765 | 45.50 | 50.96 | 52.20 | 0.773 |
| Nutrition education | 41.83 | 52.78 | 49.42 | 0.389 | 58.54 | 49.99 | 46.98 | 0.496 |
| Daily intake record | 50.20 | 52.77 | 42.84 | 0.378 | 61.15 | 46.71 | 56.28 | 0.125 |
Publisher’s Note: MDPI stays neutral with regard to jurisdictional claims in published maps and institutional affiliations. |
© 2022 by the authors. Licensee MDPI, Basel, Switzerland. This article is an open access article distributed under the terms and conditions of the Creative Commons Attribution (CC BY) license (https://creativecommons.org/licenses/by/4.0/).
Share and Cite
Choi, H.K.; Lee, S.H. Needs Analysis for Non-Face-to-Face Services among Older Adults to Reduce Loneliness. Healthcare 2022, 10, 1576. https://doi.org/10.3390/healthcare10081576
Choi HK, Lee SH. Needs Analysis for Non-Face-to-Face Services among Older Adults to Reduce Loneliness. Healthcare. 2022; 10(8):1576. https://doi.org/10.3390/healthcare10081576
Chicago/Turabian StyleChoi, Hee Kyung, and Seon Heui Lee. 2022. "Needs Analysis for Non-Face-to-Face Services among Older Adults to Reduce Loneliness" Healthcare 10, no. 8: 1576. https://doi.org/10.3390/healthcare10081576
APA StyleChoi, H. K., & Lee, S. H. (2022). Needs Analysis for Non-Face-to-Face Services among Older Adults to Reduce Loneliness. Healthcare, 10(8), 1576. https://doi.org/10.3390/healthcare10081576