
SARIMA Model Forecasting Performance of the COVID-19 Daily Statistics in Thailand during the Omicron Variant Epidemic

Abstract
:1. Introduction
Background
2. Prior Work
3. Materials and Methods
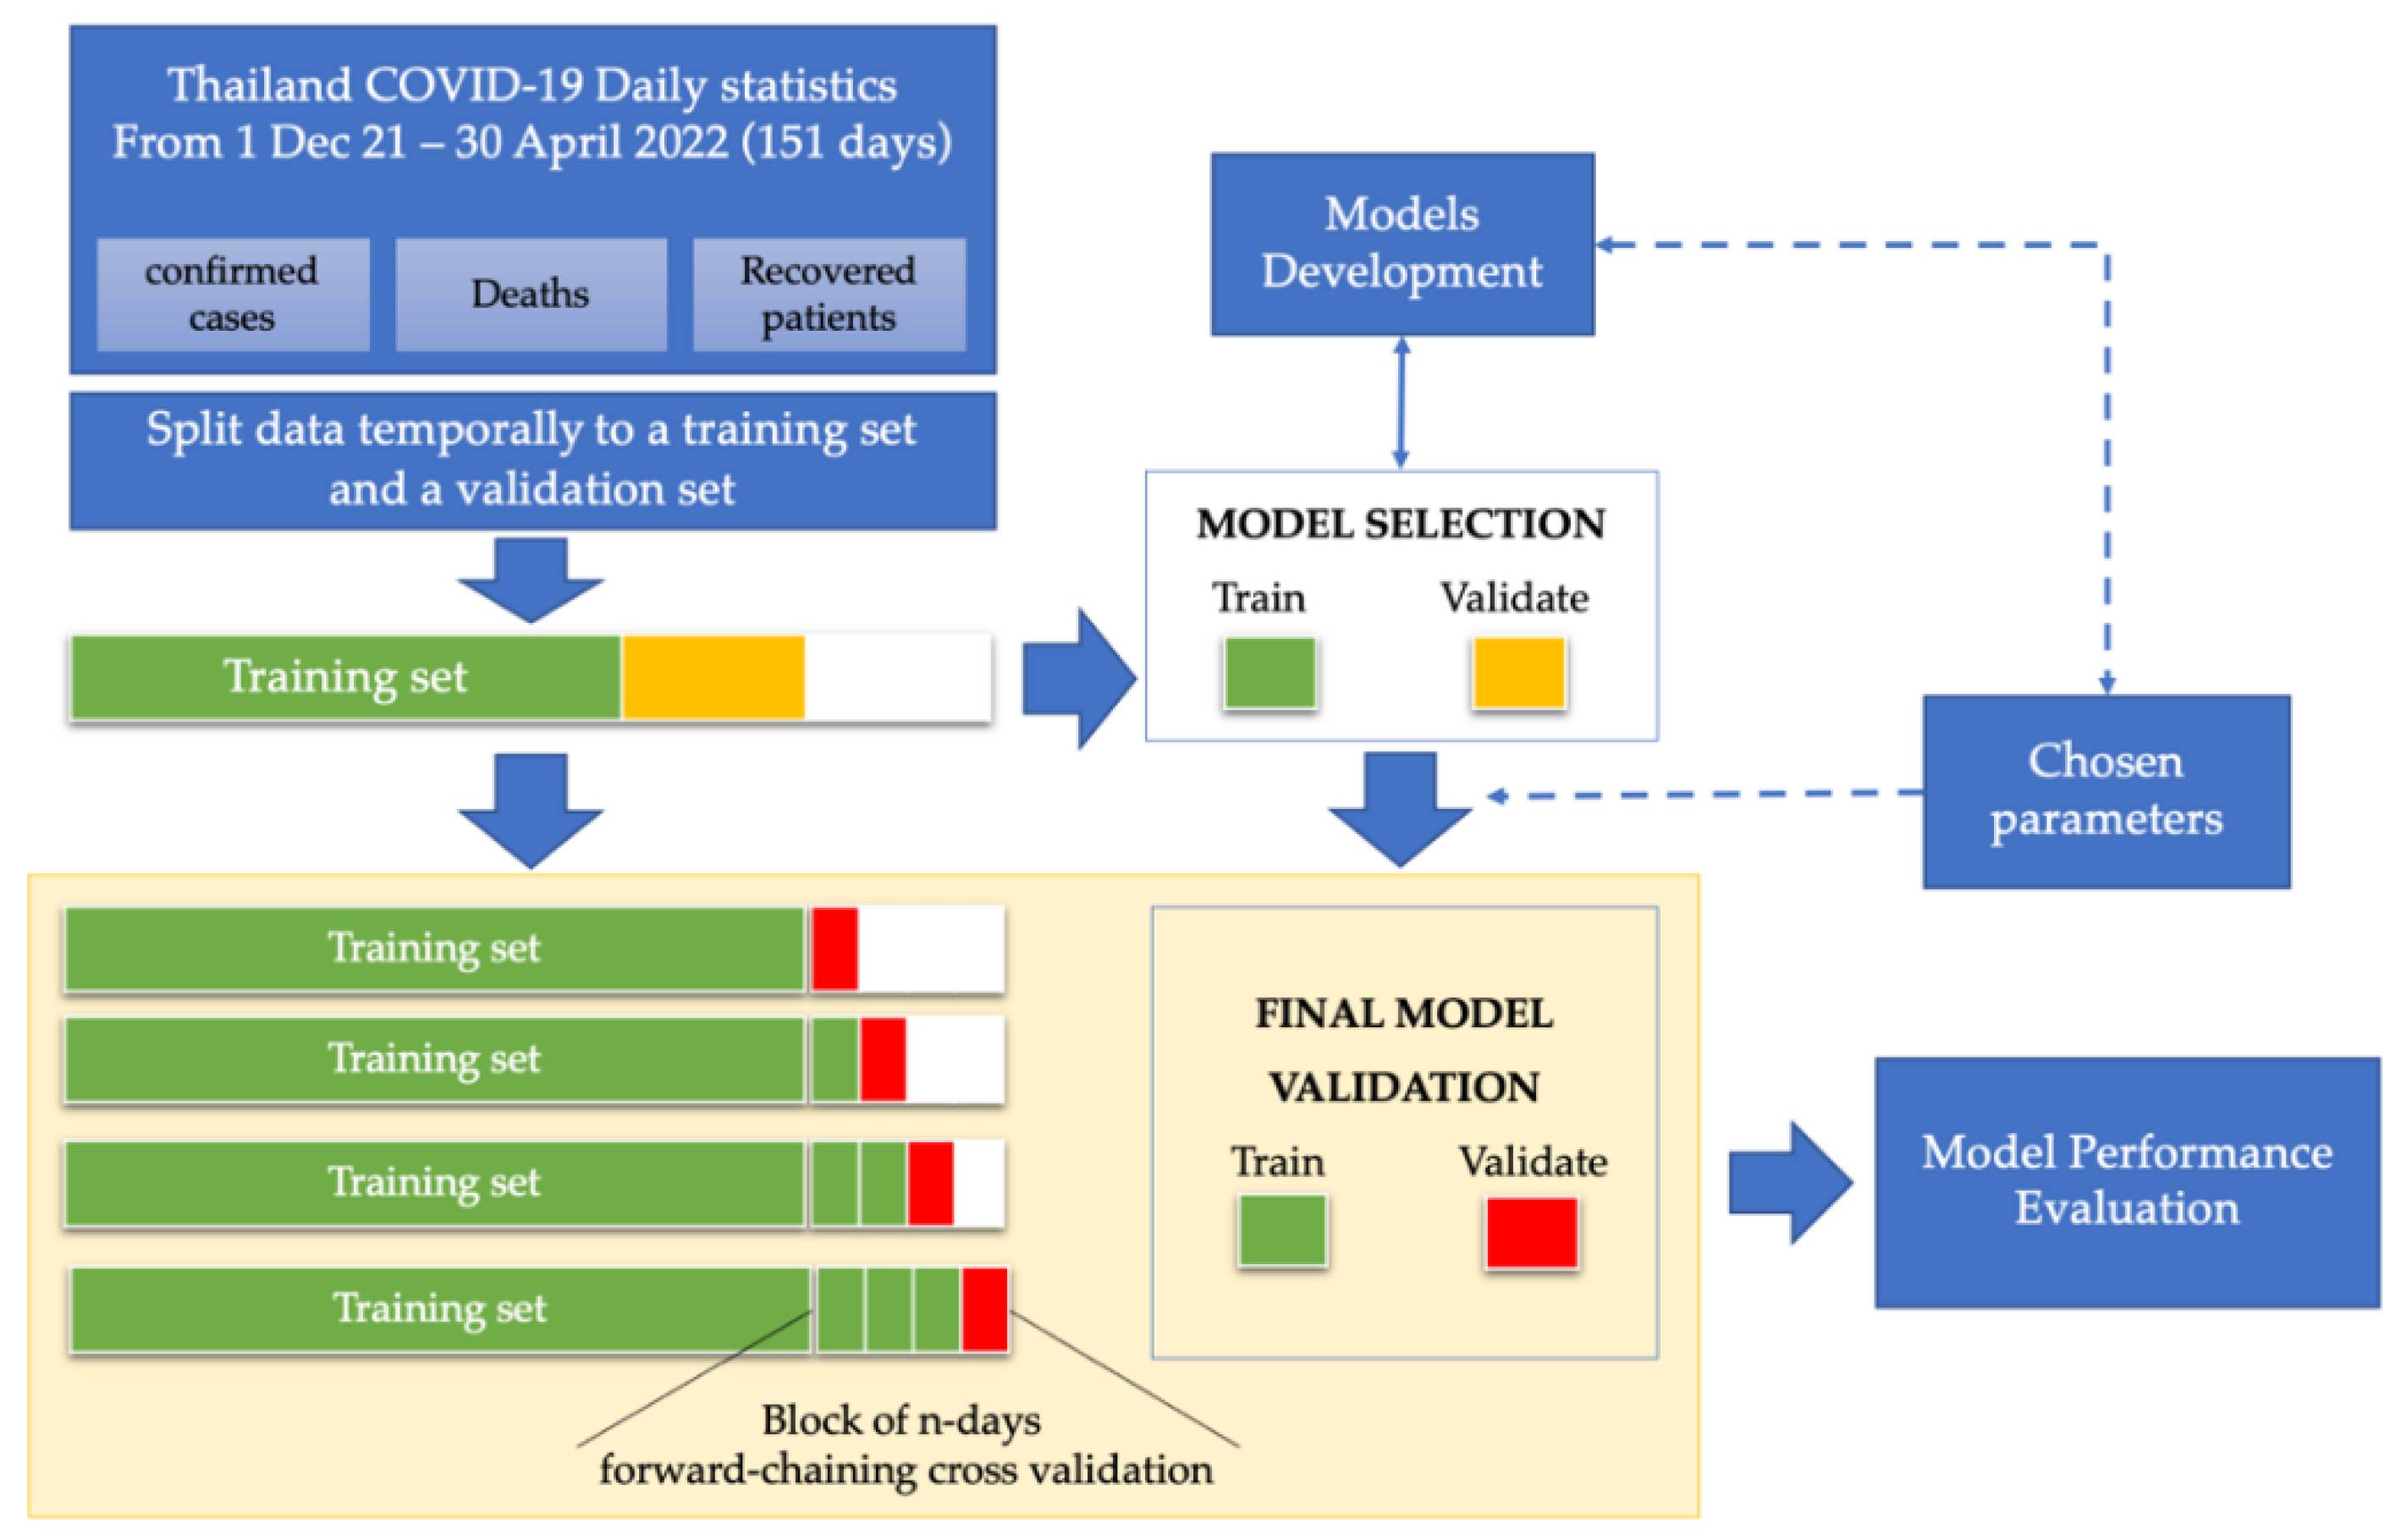
3.1. Data Processing
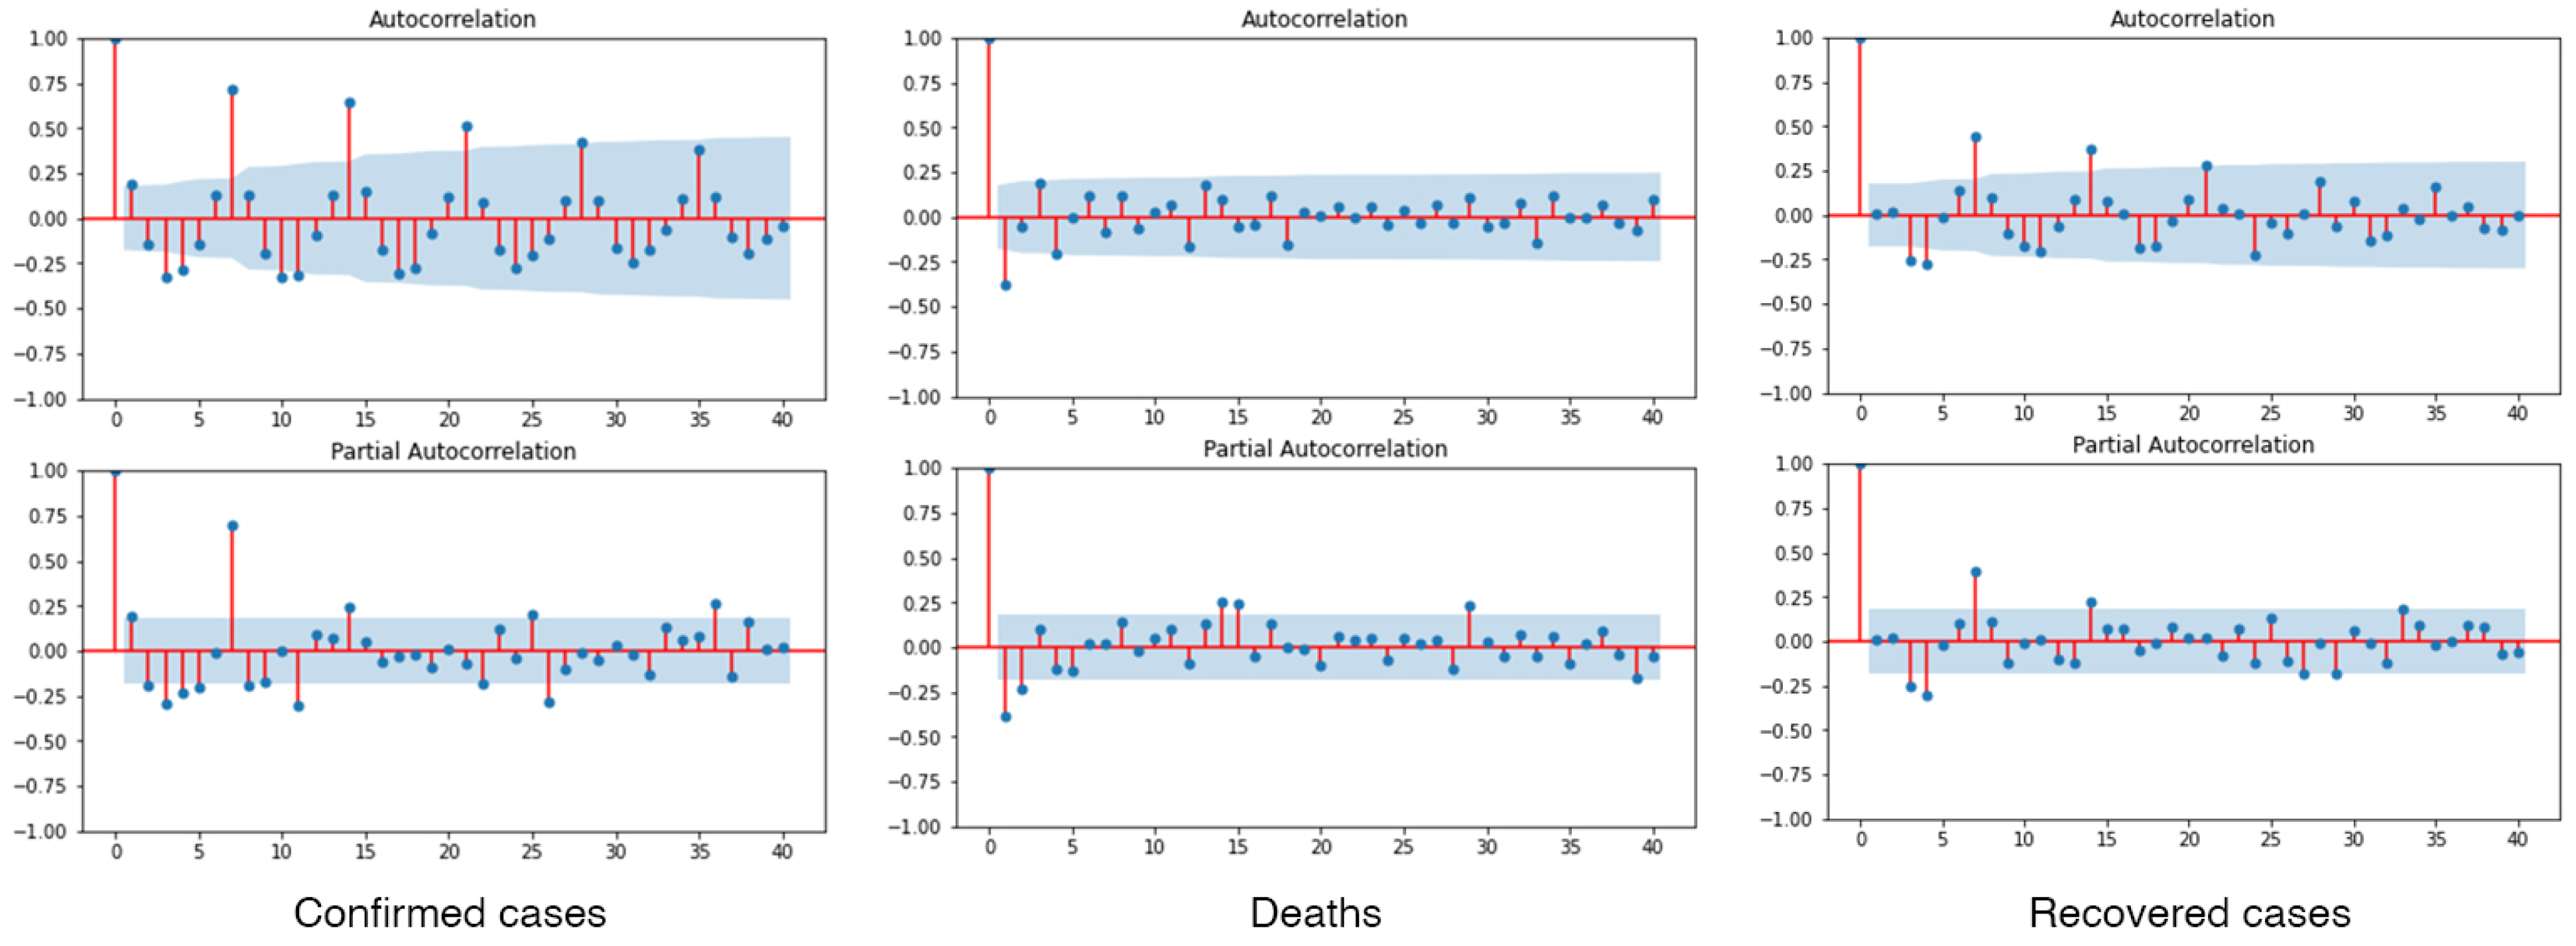
3.2. Model Development and Identification
3.3. Model Validation
4. Results
4.1. Model Development
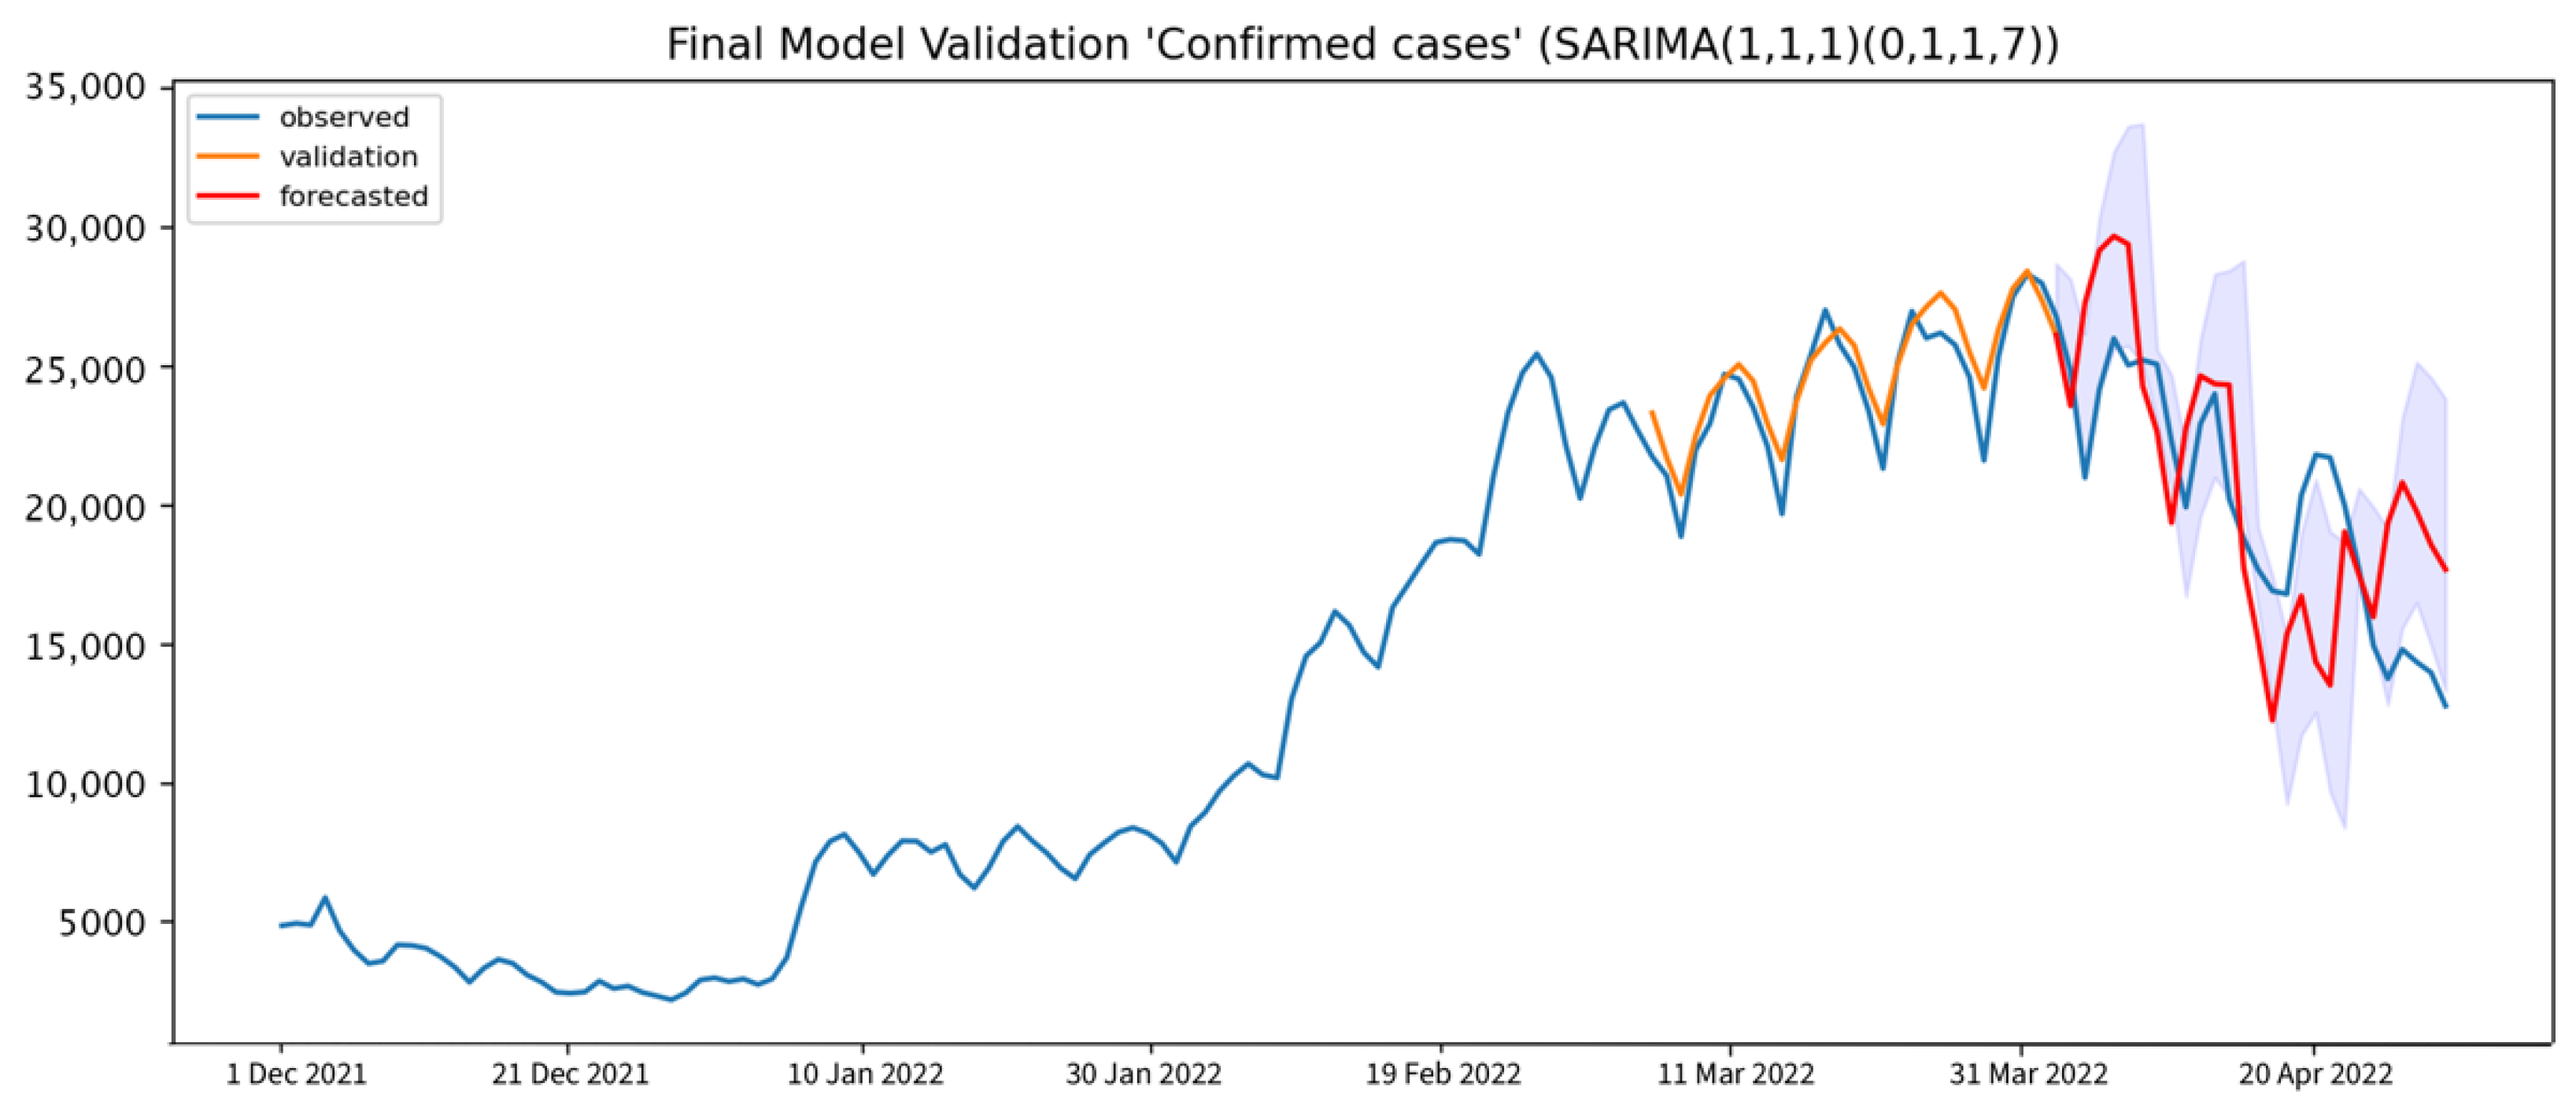
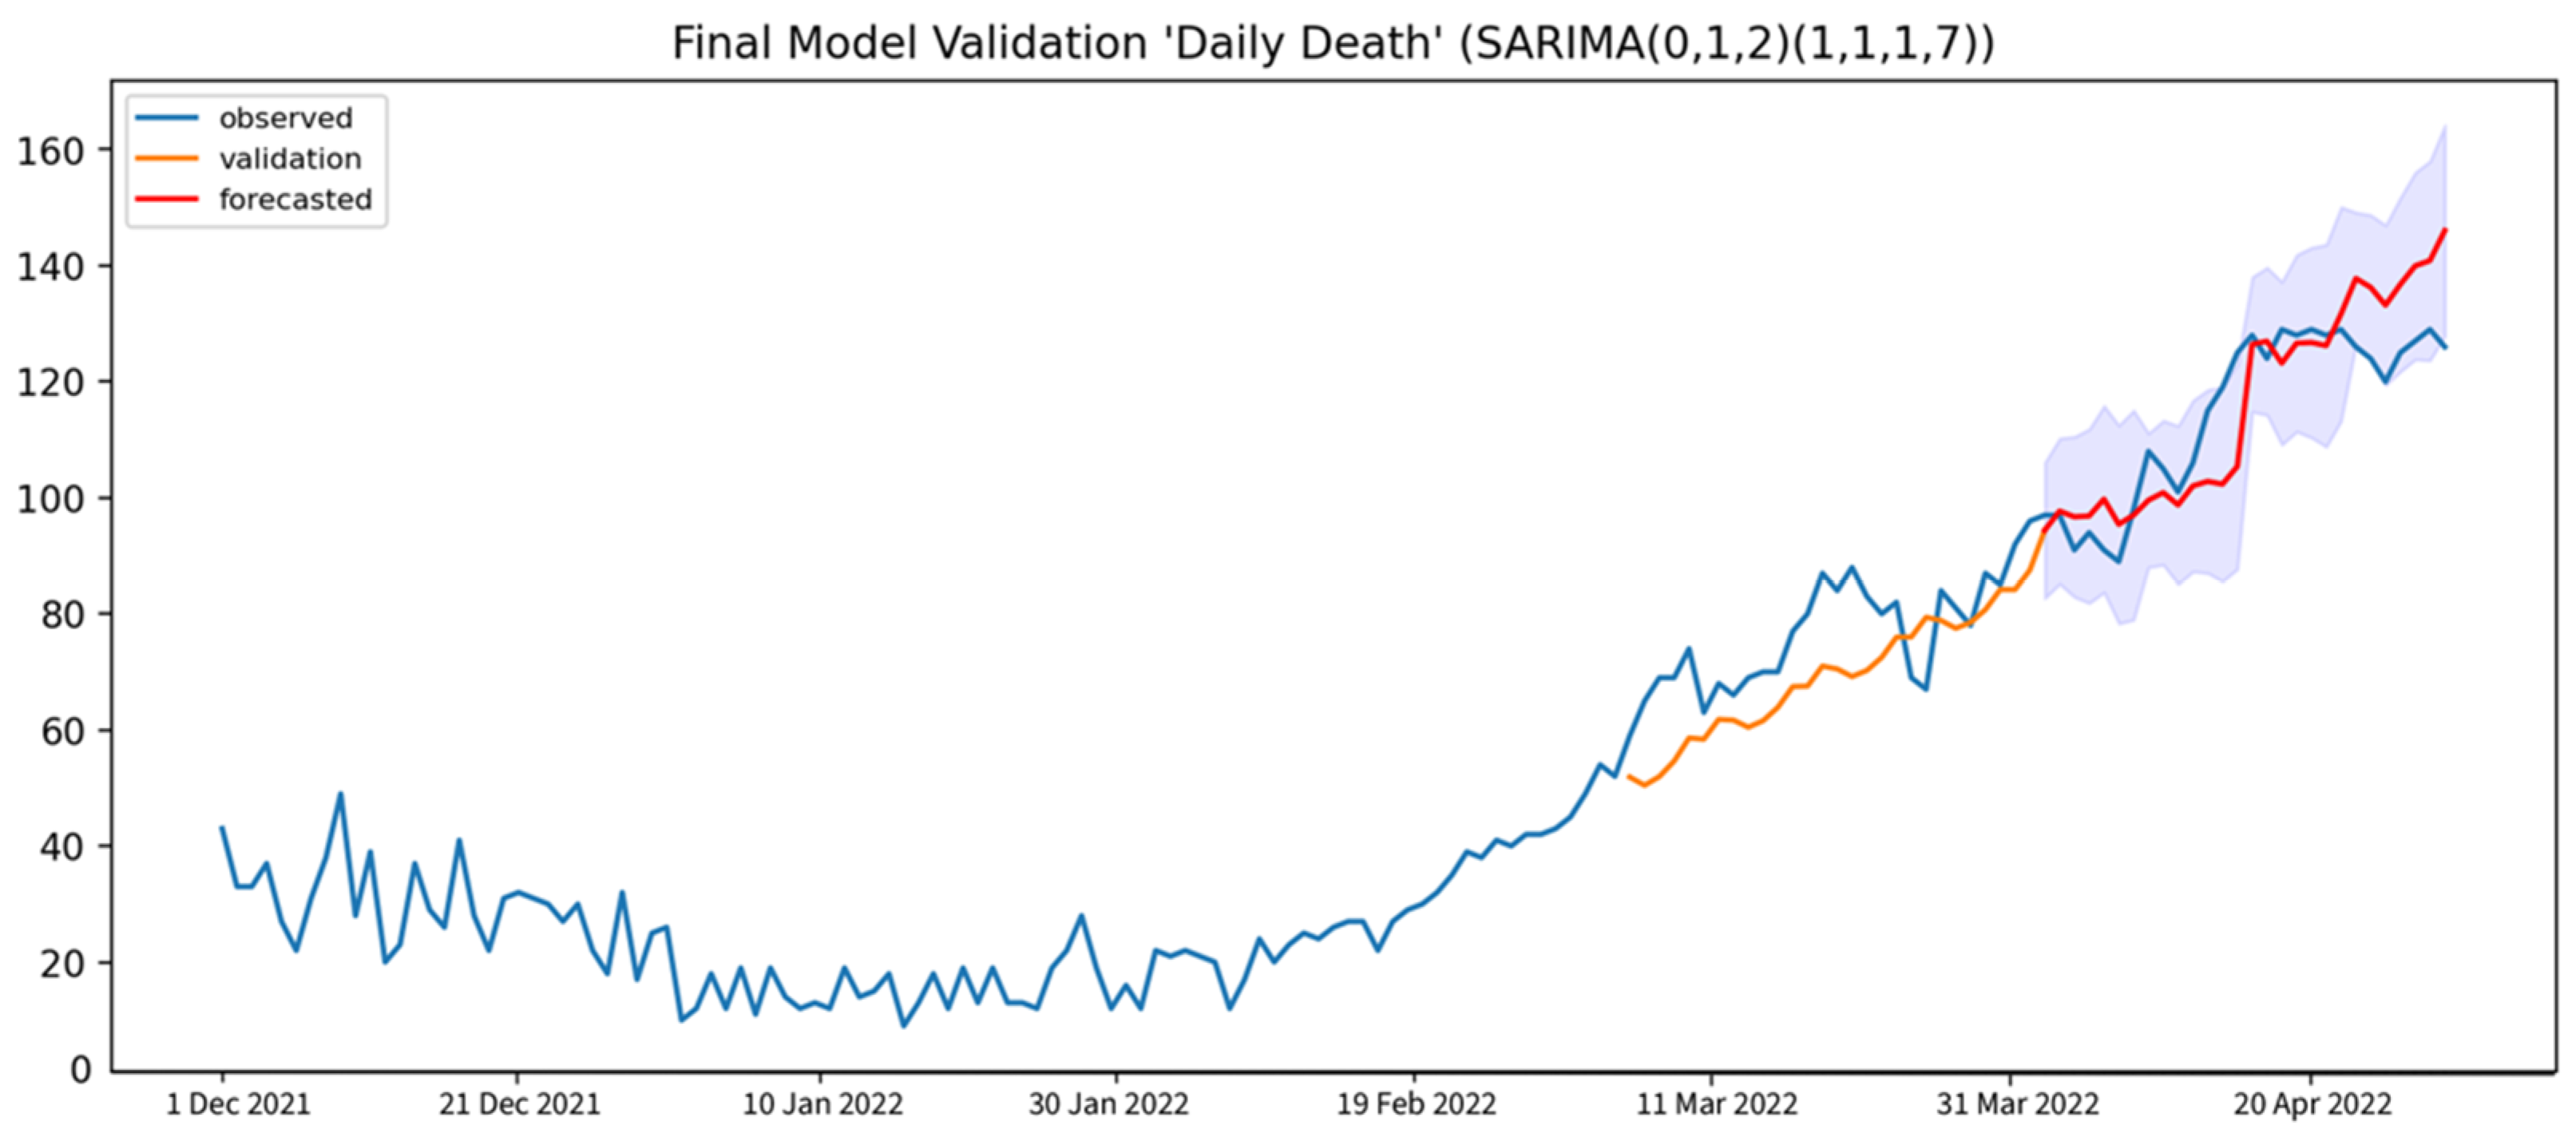
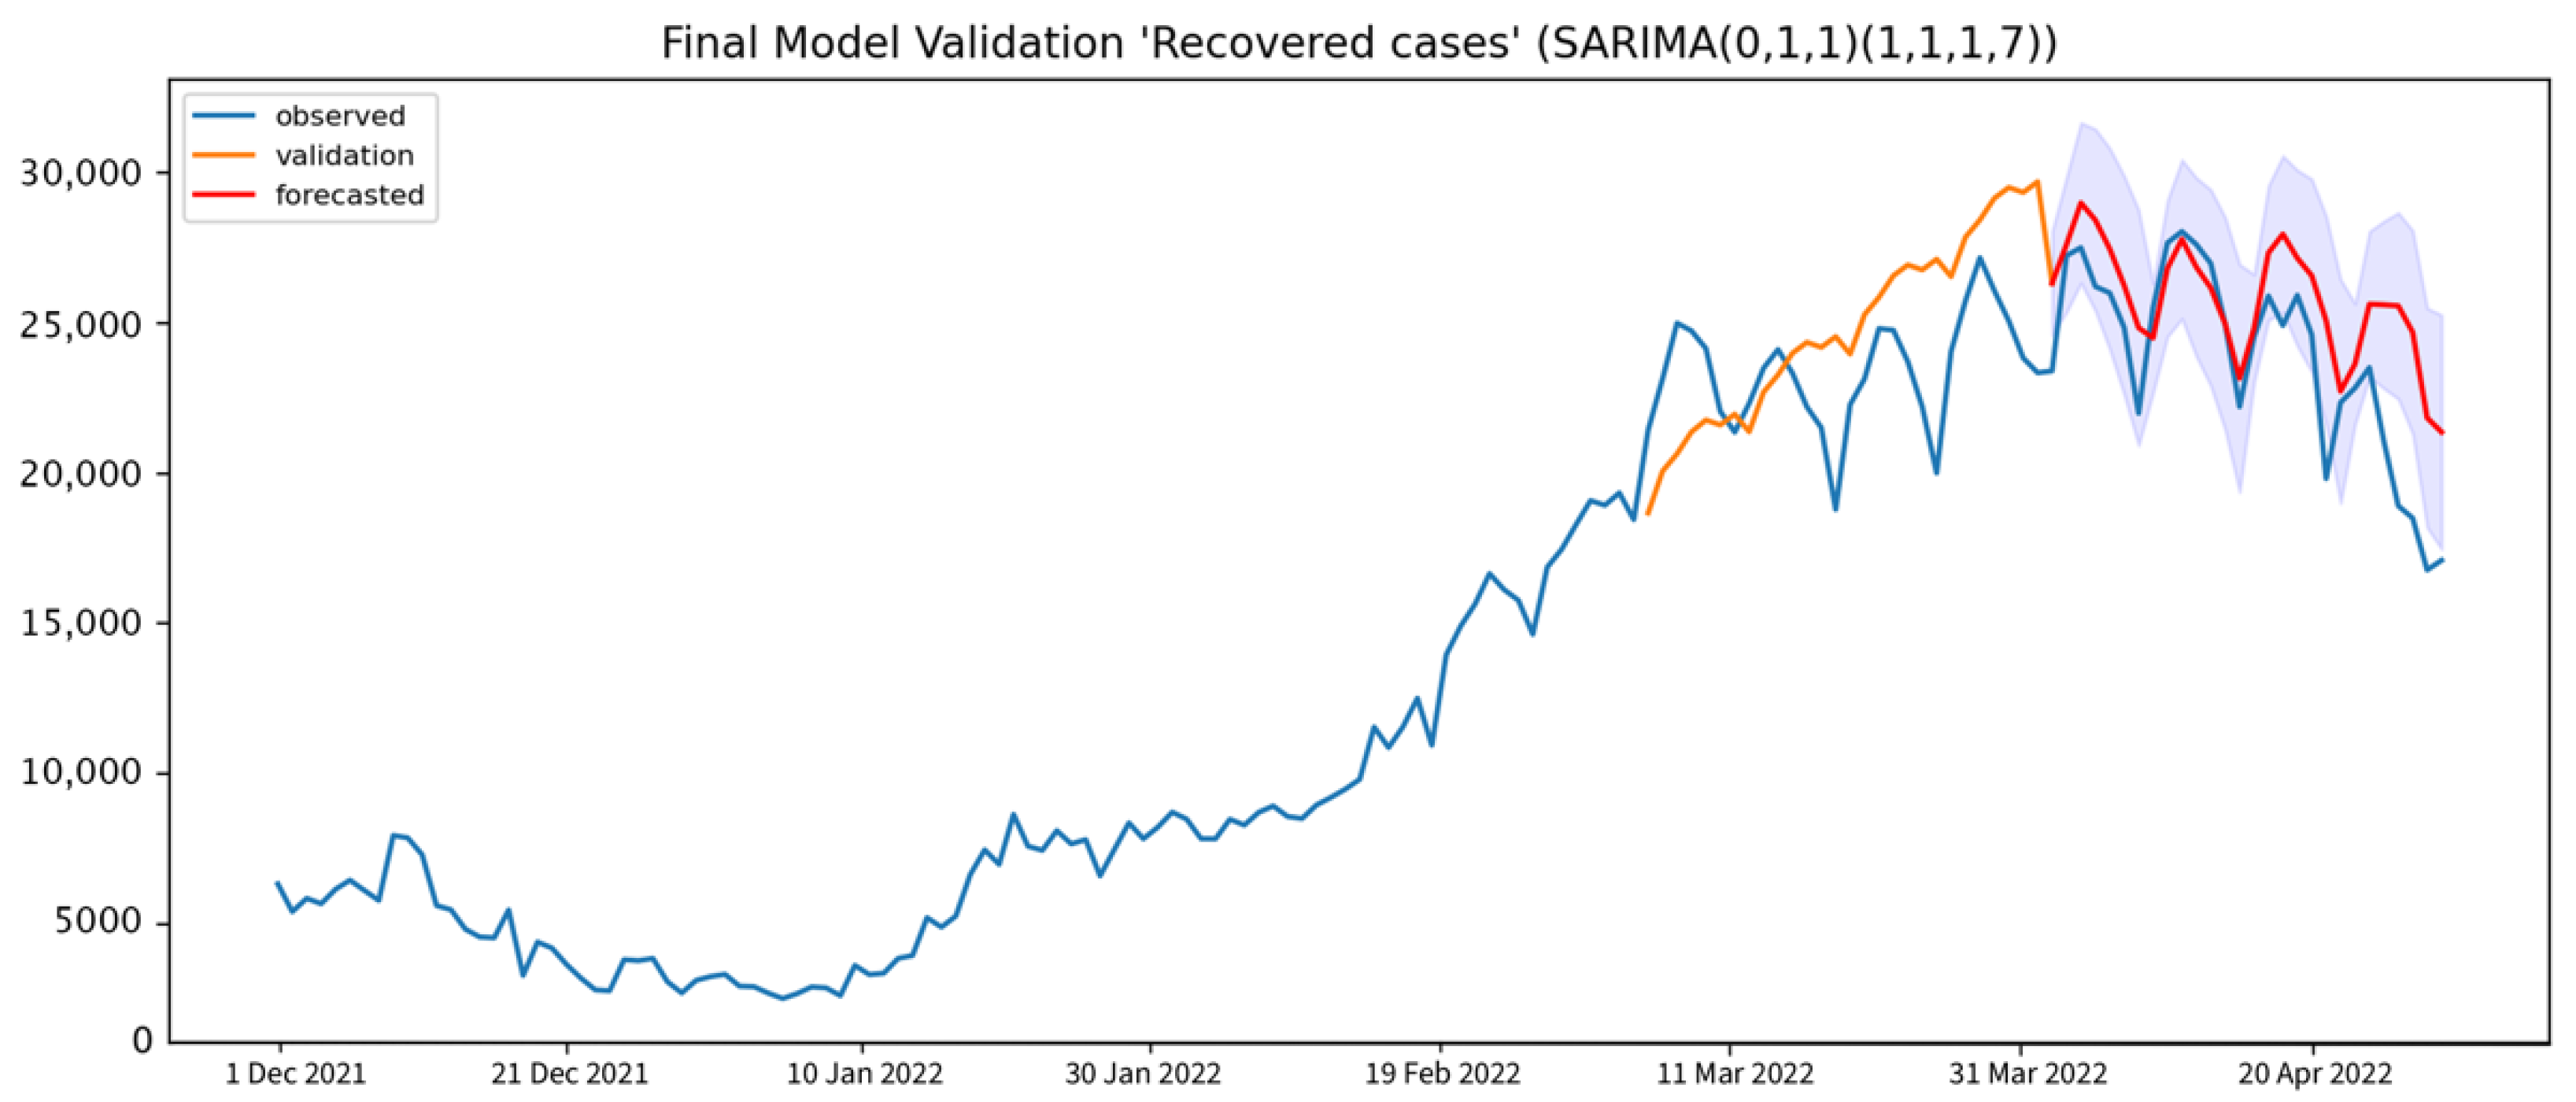
4.2. Model Identification and Validation
4.3. Model Performance Evaluation Results
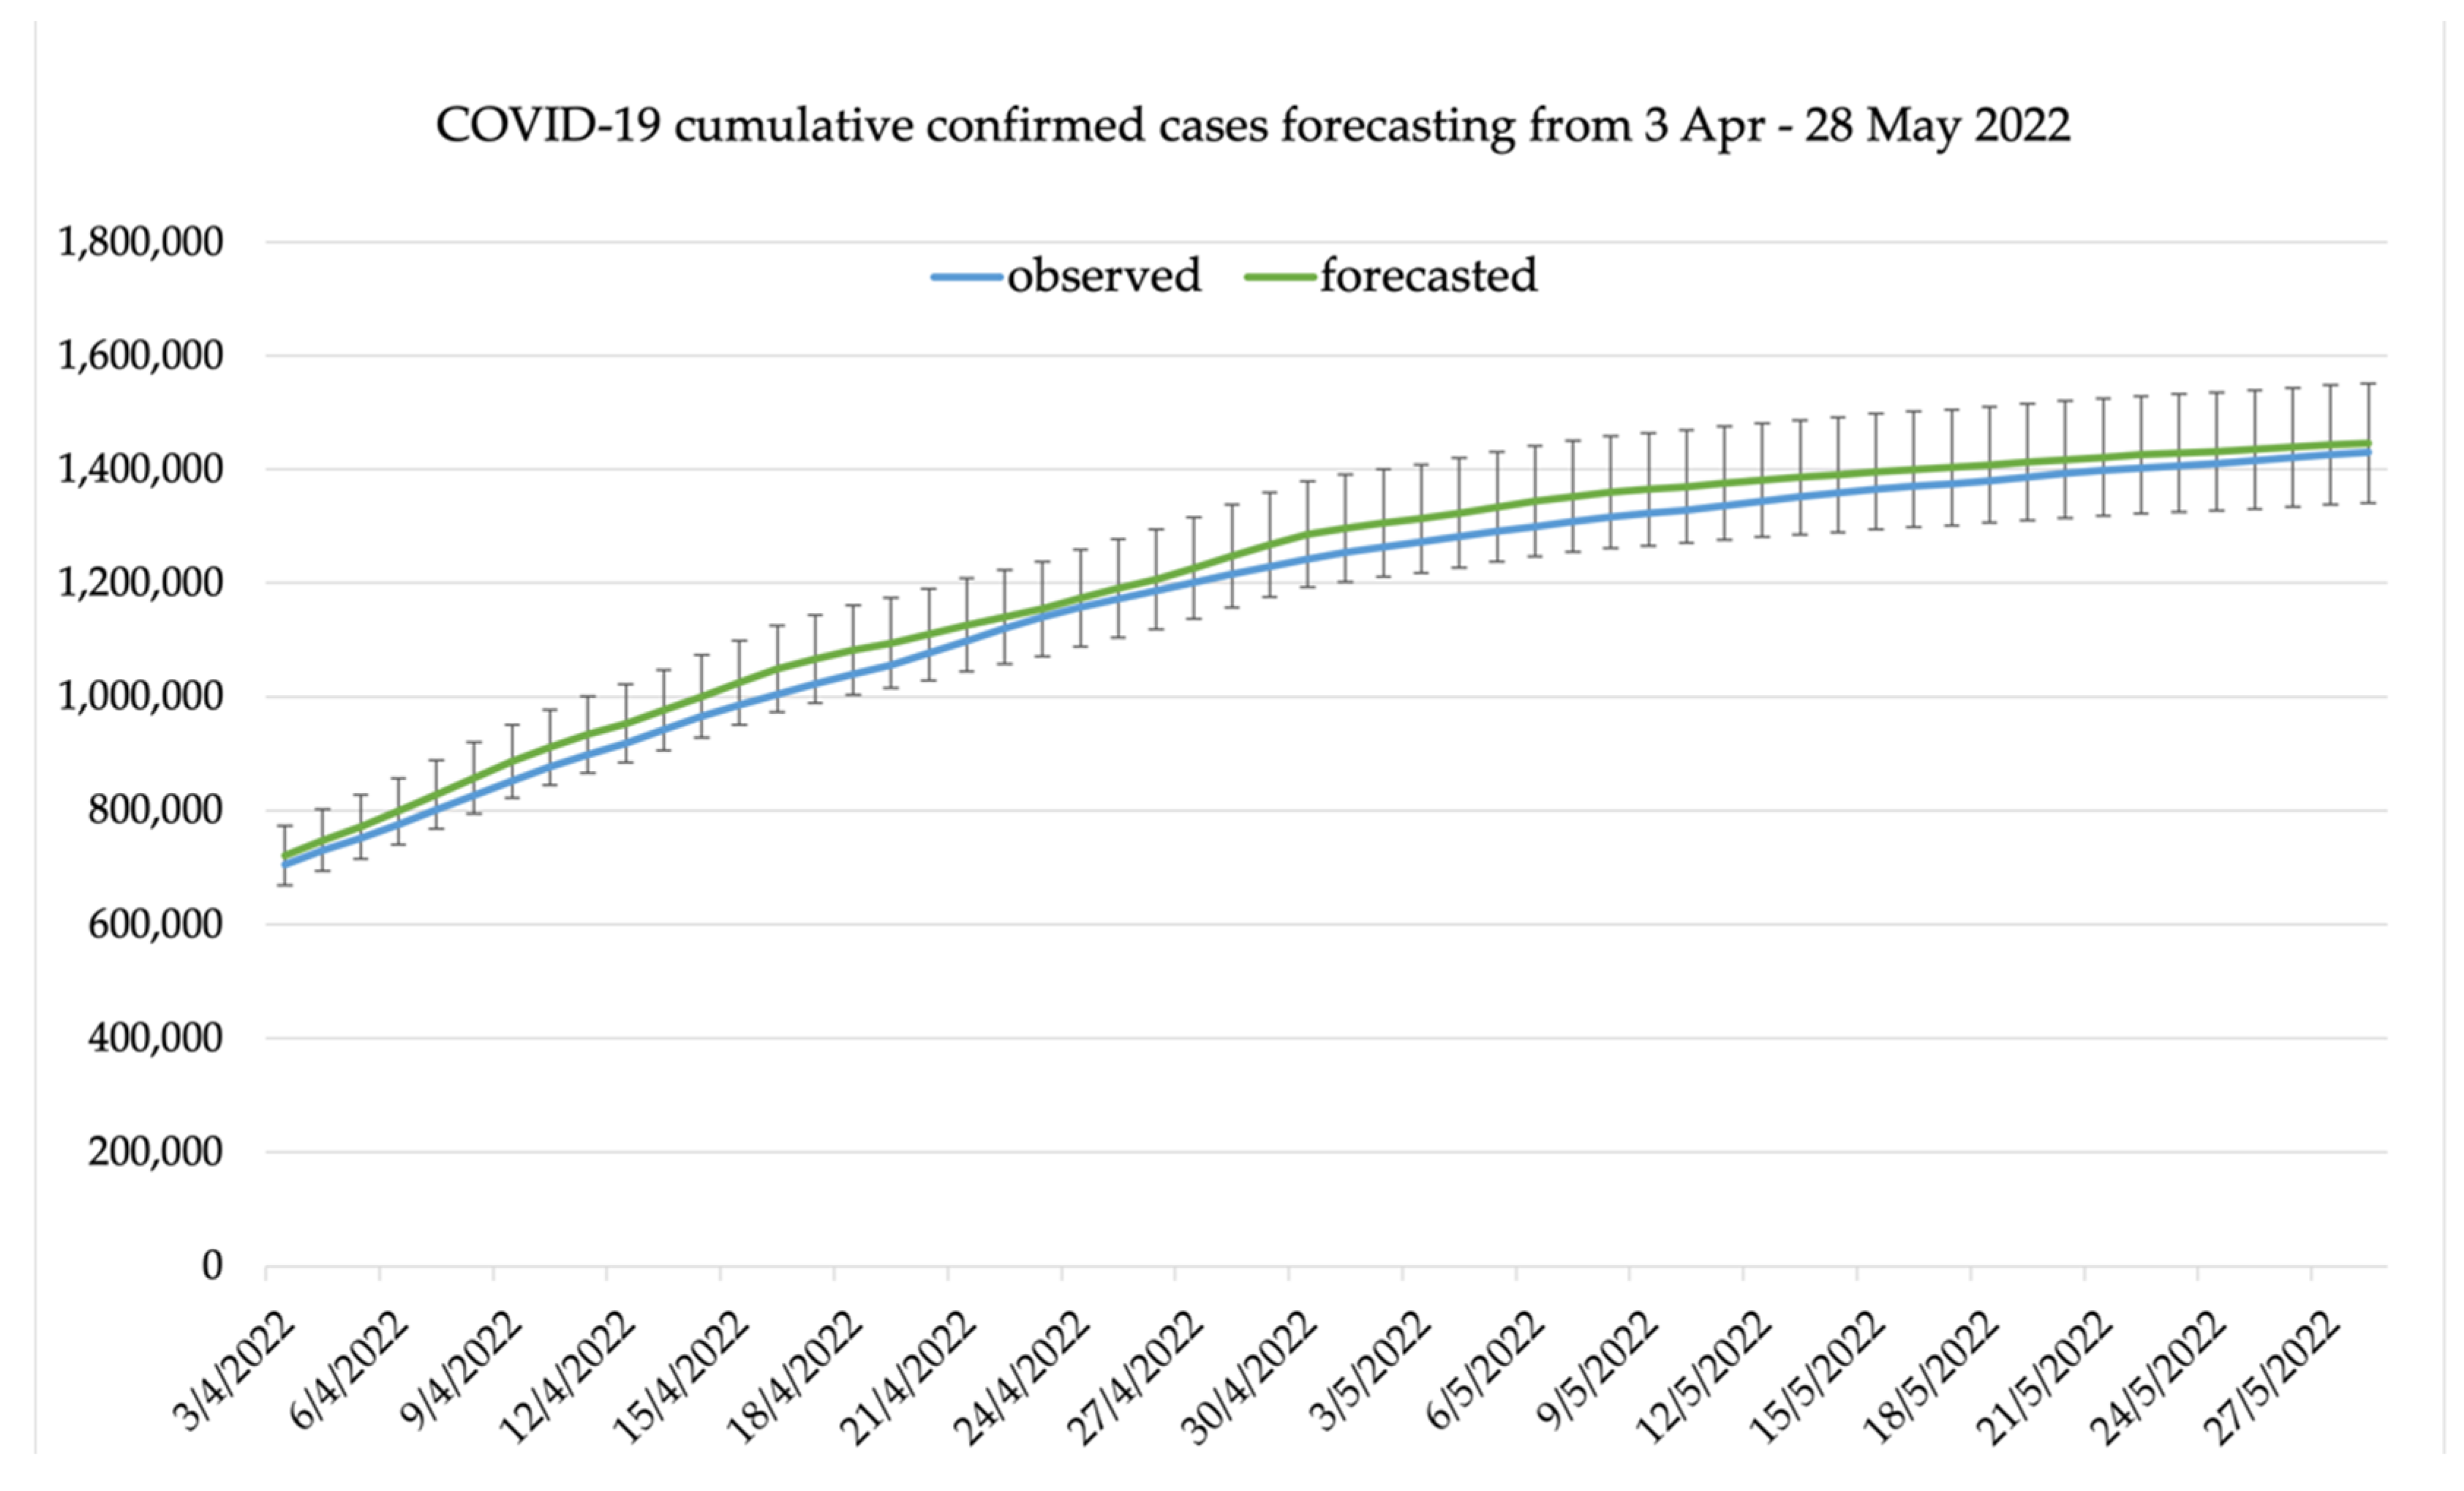
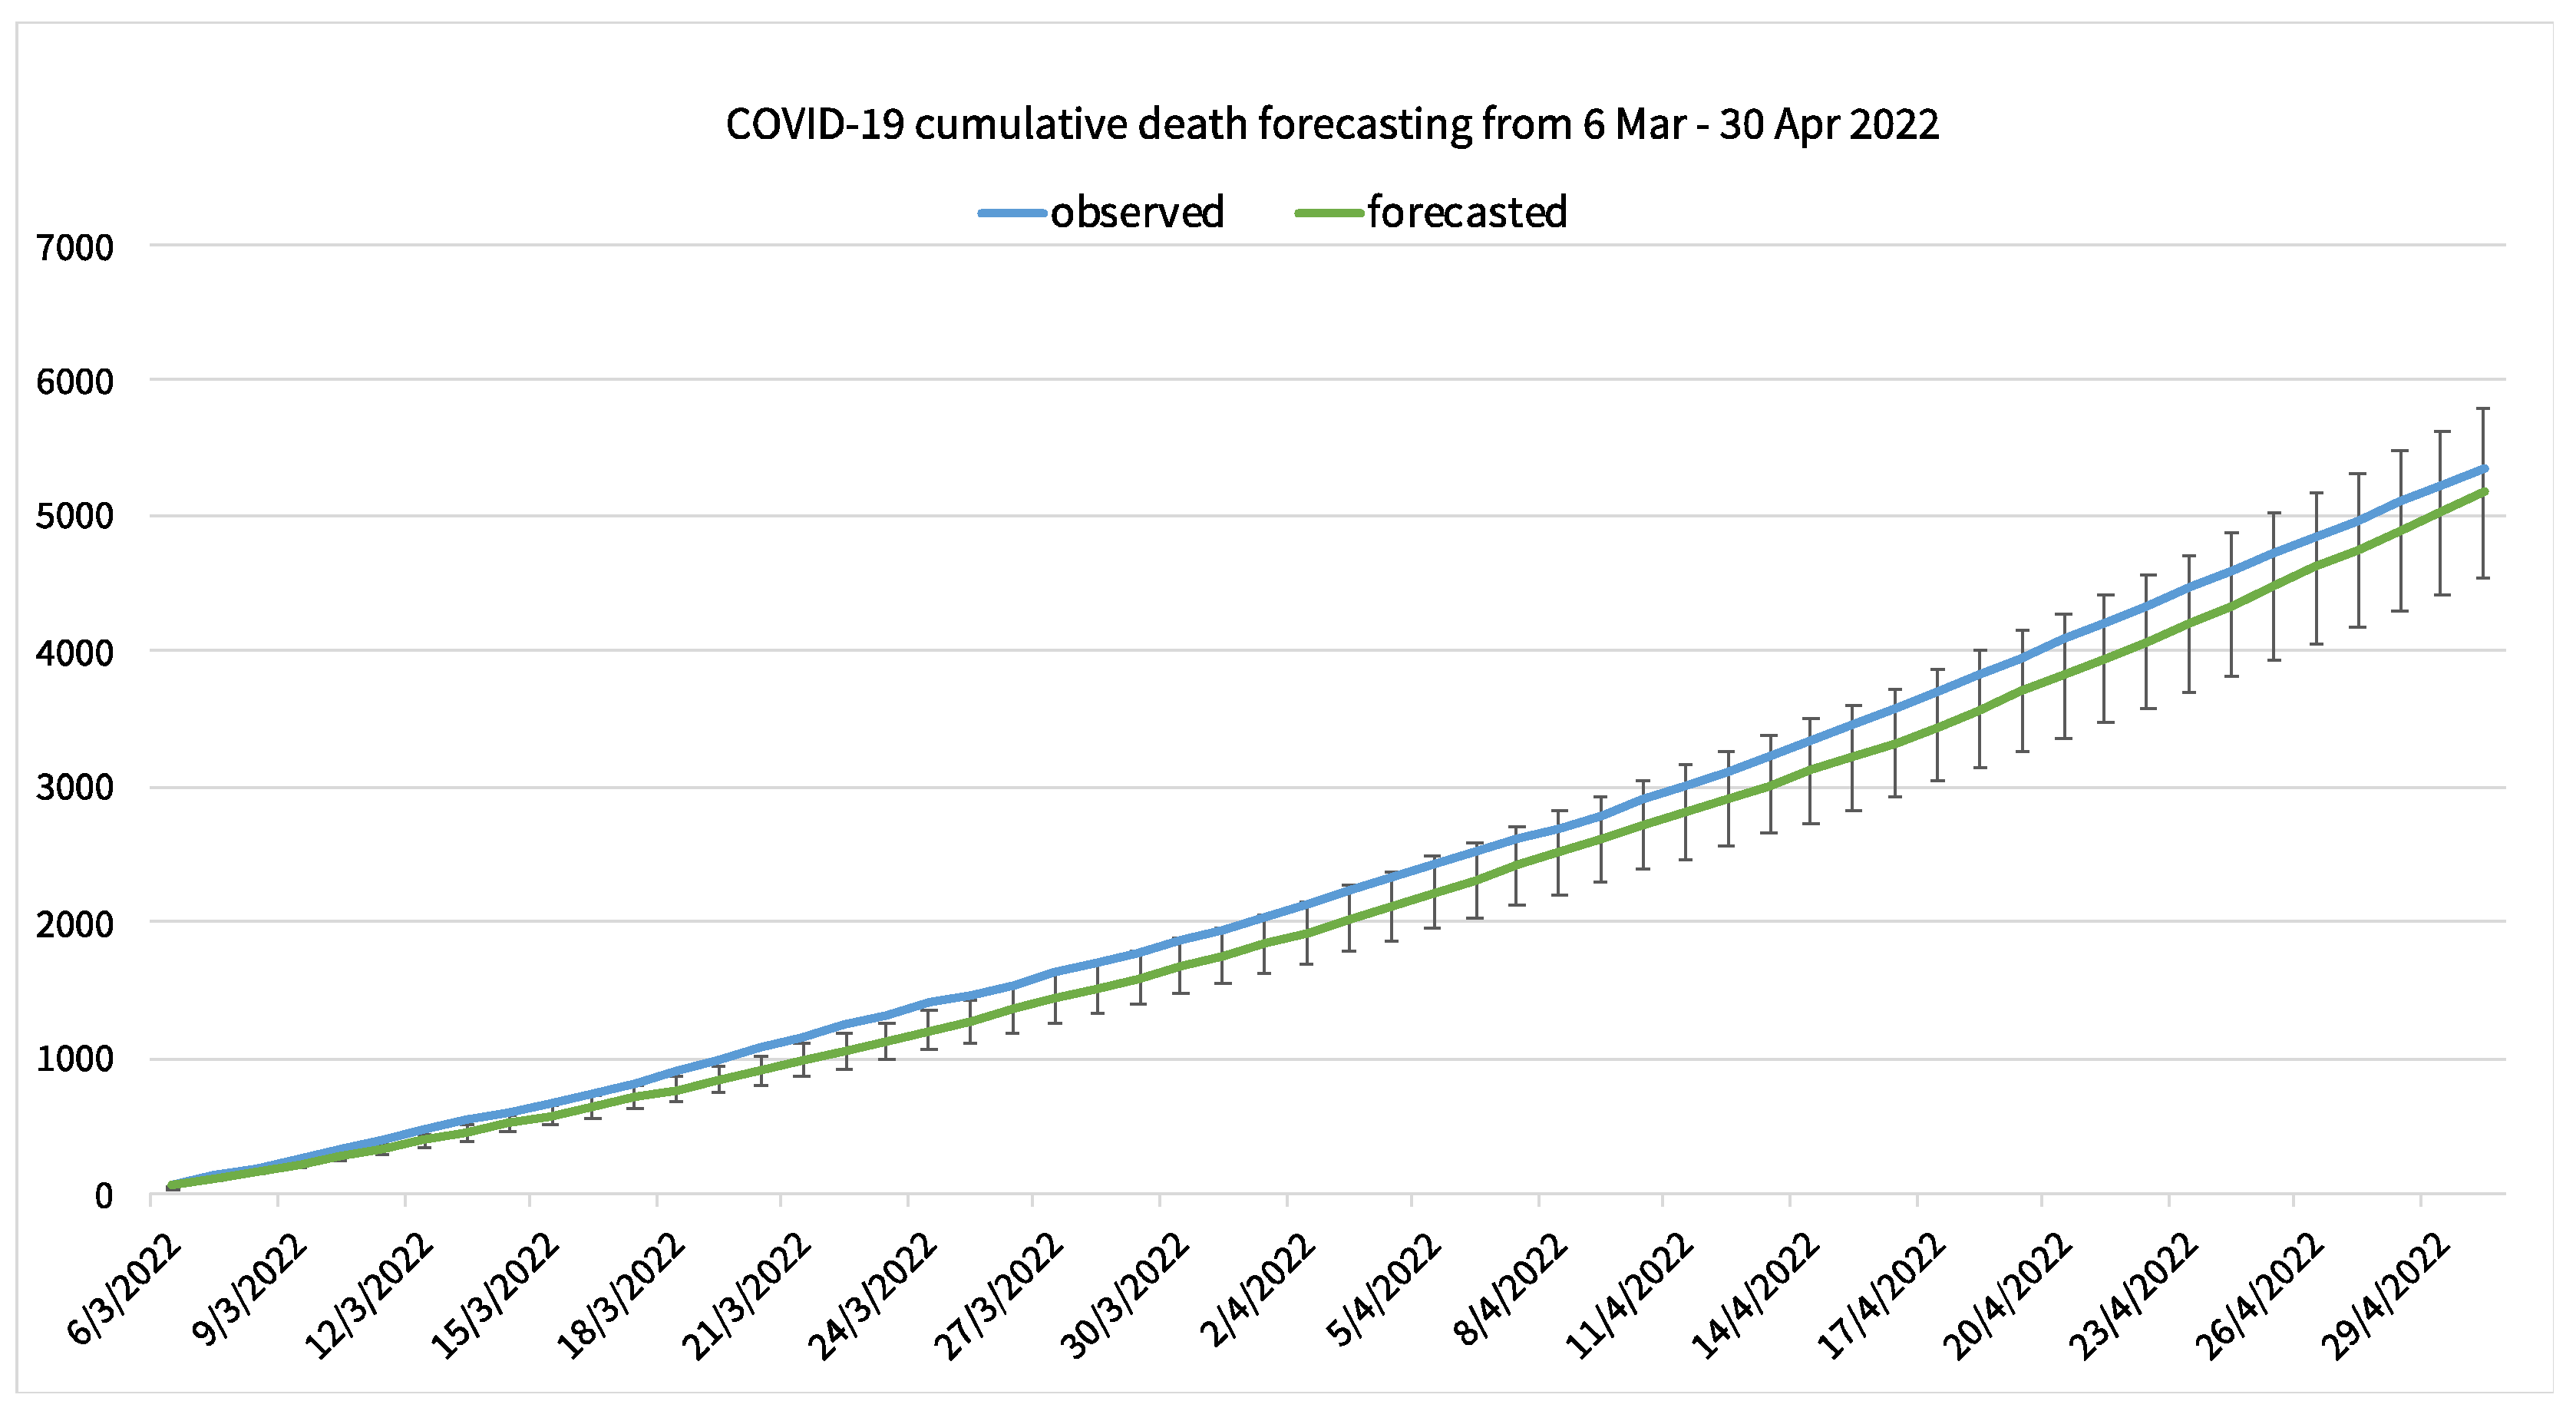
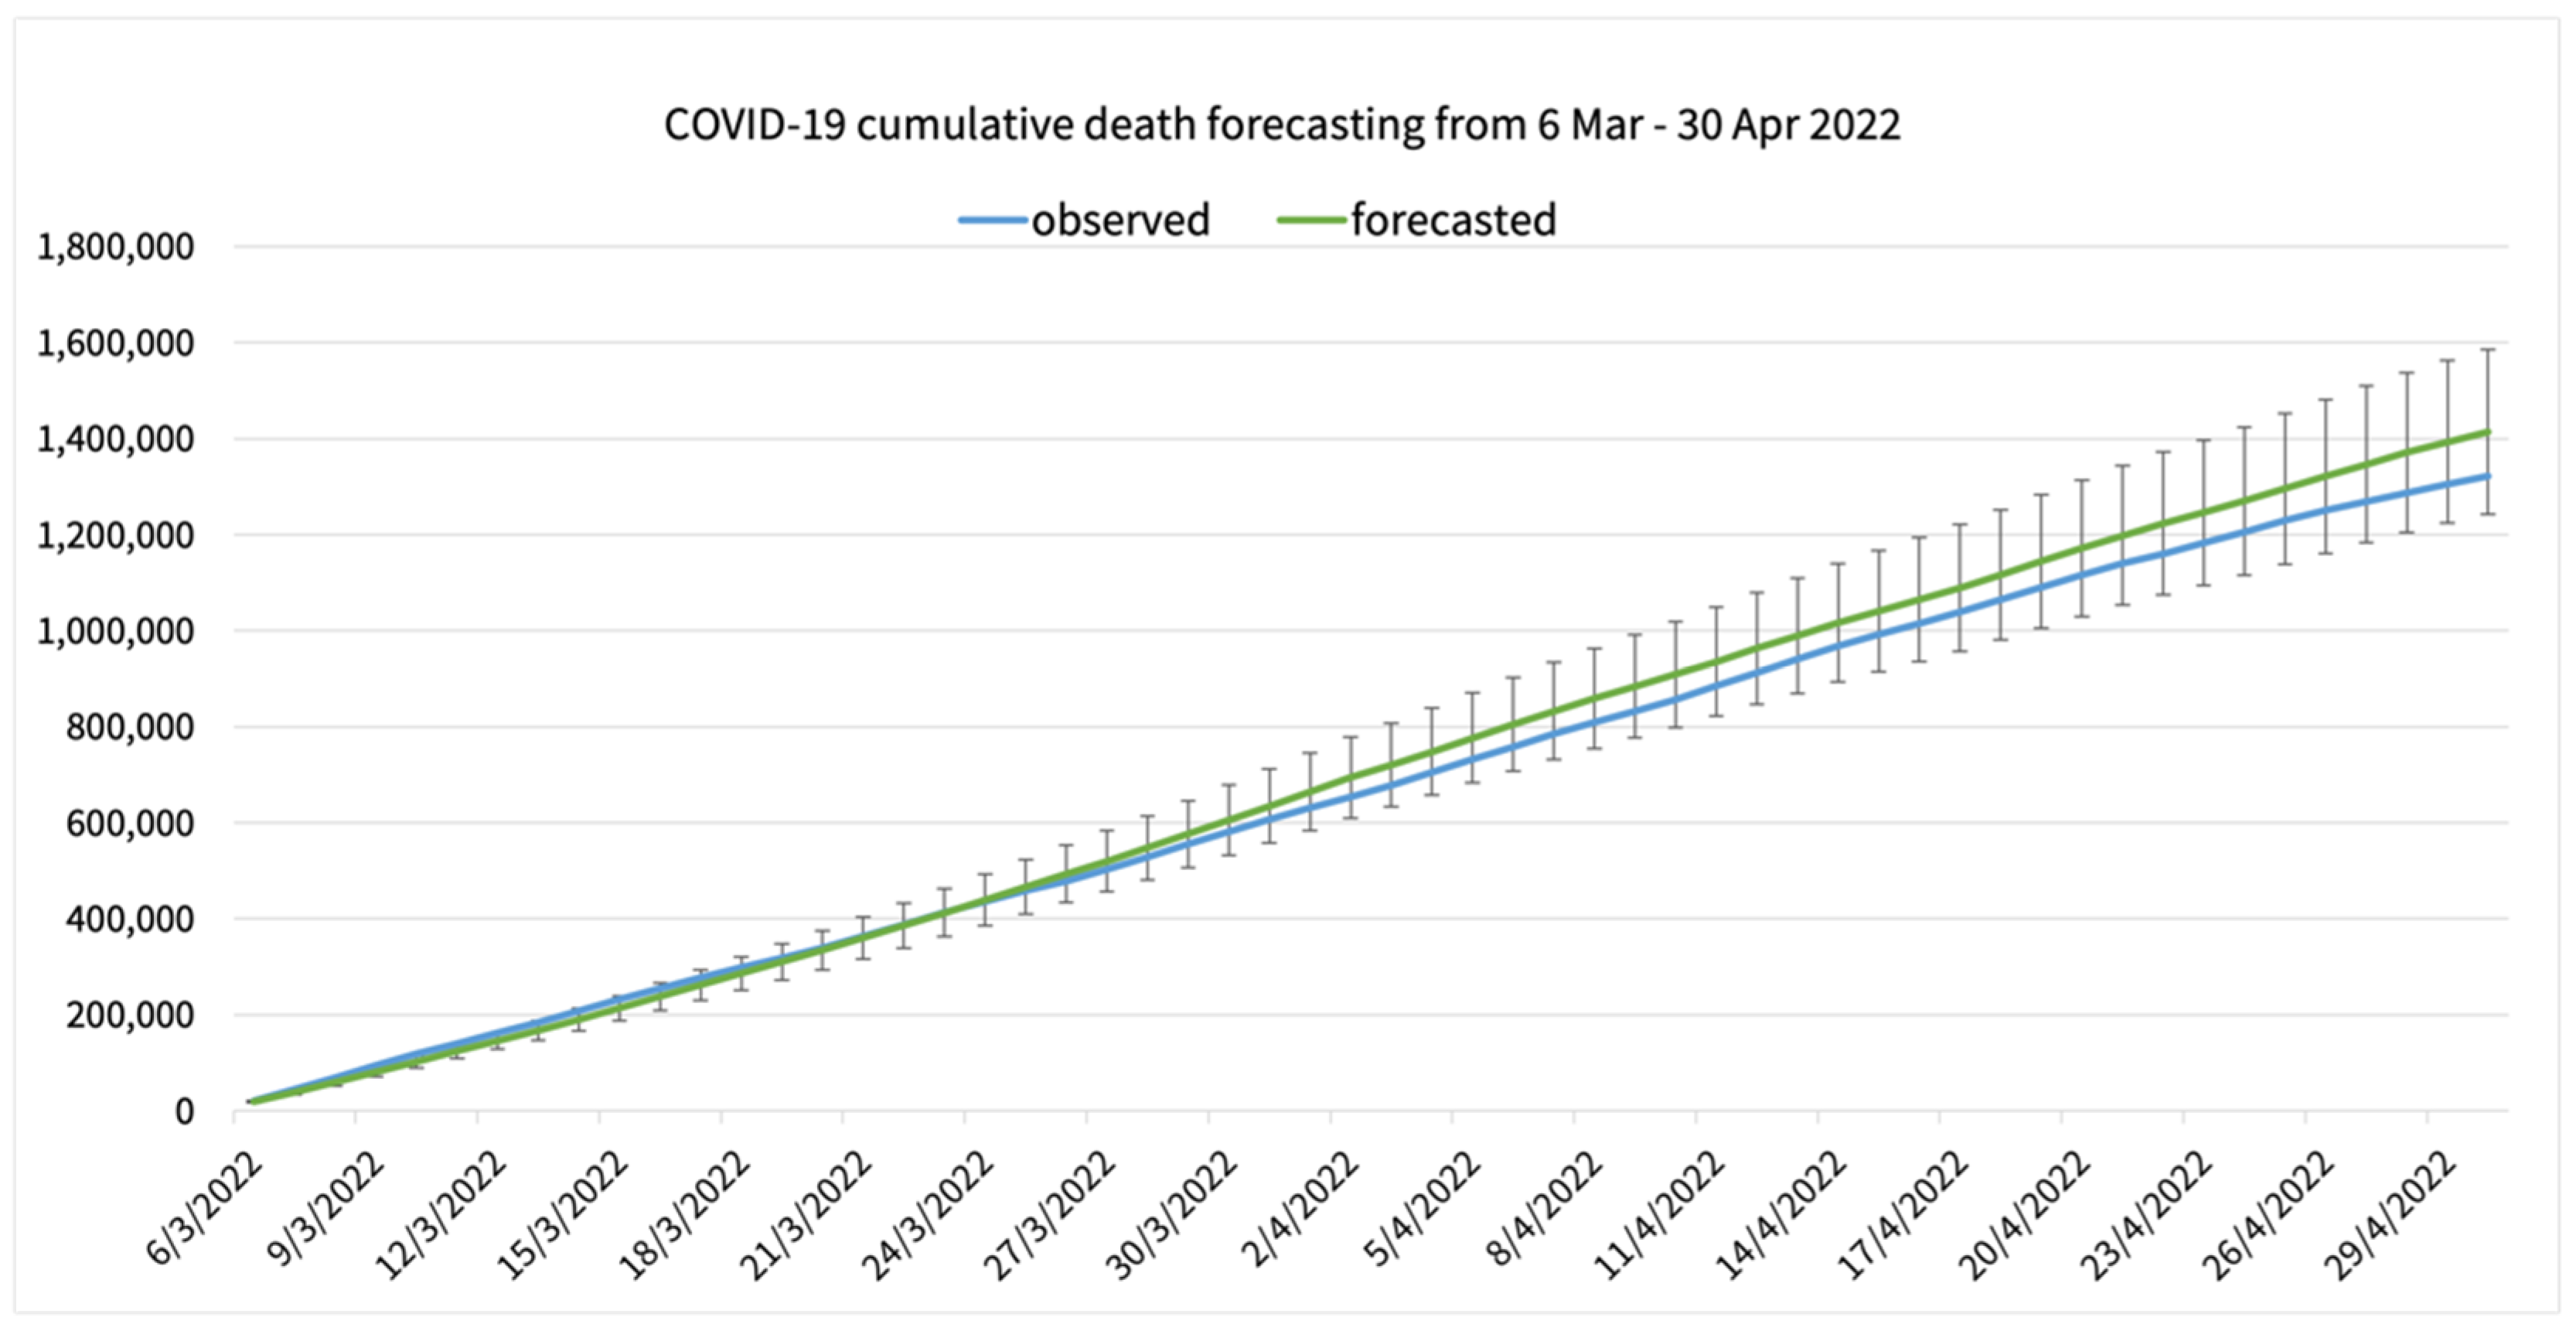
4.4. Forecasting Trend of Thailand COVID-19 Daily Statistics
5. Discussion
6. Conclusions
Author Contributions
Funding
Informed Consent Statement
Data Availability Statement
Acknowledgments
Conflicts of Interest
References
- Zhou, F.; Yu, T.; Du, R.; Fan, G.; Liu, Y.; Liu, Z.; Xiang, J.; Wang, Y.; Song, B.; Gu, X.; et al. Clinical Course and Risk Factors for Mortality of Adult Inpatients with COVID-19 in Wuhan, China: A Retrospective Cohort Study. Lancet 2020, 395, 1054–1062. [Google Scholar] [CrossRef]
- Intawong, K.; Olson, D.; Chariyalertsak, S. Application Technology to Fight the COVID-19 Pandemic: Lessons Learned in Thailand. Biochem. Biophys. Res. Commun. 2021, 534, 830–836. [Google Scholar] [CrossRef]
- Department of Disease Control Corona Virus Disease (COVID-19): Thailand Situation. Available online: https://ddc.moph.go.th/viralpneumonia/eng/index.php (accessed on 17 May 2021).
- Digital Government Development Agency Thailand Daily COVID-19 Report—Open Government Data of Thailand. Available online: https://data.go.th/en/dataset/covid-19-daily (accessed on 8 August 2021).
- Dong, E.; Du, H.; Gardner, L. An Interactive Web-Based Dashboard to Track COVID-19 in Real Time. Lancet Infectious Diseases 2020, 20, 533–534. [Google Scholar] [CrossRef]
- World Health Organization Update on Omicron. Available online: https://www.who.int/news/item/28-11-2021-update-on-omicron (accessed on 8 July 2022).
- Eftekhar Ardebili, M.; Naserbakht, M.; Bernstein, C.; Alazmani-Noodeh, F.; Hakimi, H.; Ranjbar, H. Healthcare Providers Experience of Working during the COVID-19 Pandemic: A Qualitative Study. Am. J. Infect. Control. 2021, 49, 547–554. [Google Scholar] [CrossRef]
- Brown-Johnson, C.; McCaa, M.D.; Giannitrapani, S.; Singer, S.J.; Lorenz, K.A.; Yano, E.M.; Thanassi, W.T.; Deshields, C.; Giannitrapani, K.F. Protecting the Healthcare Workforce during COVID-19: A Qualitative Needs Assessment of Employee Occupational Health in the US National Veterans Health Administration. BMJ Open 2021, 11, e049134. [Google Scholar] [CrossRef]
- Ranney, M.L.; Griffeth, V.; Jha, A.K. Critical Supply Shortages—The Need for Ventilators and Personal Protective Equipment during the COVID-19 Pandemic. N. Engl. J. Med. 2020, 382, e41. [Google Scholar] [CrossRef]
- Desai, A.N.; Kraemer, M.U.G.; Bhatia, S.; Cori, A.; Nouvellet, P.; Herringer, M.; Cohn, E.L.; Carrion, M.; Brownstein, J.S.; Madoff, L.C.; et al. Real-Time Epidemic Forecasting: Challenges and Opportunities. Health Secur. 2019, 17, 268–275. [Google Scholar] [CrossRef]
- Digital Disease Detection: Tracking Outbreaks in Real-Time. Available online: http://www.gobroadreach.com/broadreach-blog-tracking-global-outbreaks (accessed on 20 December 2015).
- Ioannidis, J.P.A.; Cripps, S.; Tanner, M.A. Forecasting for COVID-19 Has Failed. Int. J. Forecast. 2022, 38, 423–438. [Google Scholar] [CrossRef]
- Nobre, F.F.; Monteiro, A.B.; Telles, P.R.; Williamson, G.D. Dynamic Linear Model and SARIMA: A Comparison of Their Forecasting Performance in Epidemiology. Stat. Med. 2001, 20, 3051–3069. [Google Scholar] [CrossRef]
- Burkom, H.S.; Murphy, S.P.; Shmueli, G. Automated Time Series Forecasting for Biosurveillance. Stat. Med. 2007, 26, 4202–4218. [Google Scholar] [CrossRef]
- Lee, D.H.; Kim, Y.S.; Koh, Y.Y.; Song, K.Y.; Chang, I.H. Forecasting COVID-19 Confirmed Cases Using Empirical Data Analysis in Korea. Healthcare 2021, 9, 254. [Google Scholar] [CrossRef]
- Nsoesie, E.O.; Brownstein, J.S.; Ramakrishnan, N.; Marathe, M.V. A Systematic Review of Studies on Forecasting the Dynamics of Influenza Outbreaks. Influenza Other Respir. Viruses 2014, 8, 309–316. [Google Scholar] [CrossRef] [PubMed] [Green Version]
- Verma, P.; Khetan, M.; Dwivedi, S.; Dixit, S. Forecasting the COVID-19 Outbreak: An Application of ARIMA and Fuzzy Time Series Models. Res. Sq. 2020. [Google Scholar] [CrossRef]
- Gebretensae, Y.A.; Asmelash, D. Trend Analysis and Forecasting the Spread of COVID-19 Pandemic in Ethiopia Using Box–Jenkins Modeling Procedure. Int. J. Gen. Med. 2021, 14, 1485–1498. [Google Scholar] [CrossRef] [PubMed]
- Tan, C.V.; Singh, S.; Lai, C.H.; Zamri, A.S.S.M.; Dass, S.C.; Aris, T.B.; Ibrahim, H.M.; Gill, B.S. Forecasting COVID-19 Case Trends Using SARIMA Models during the Third Wave of COVID-19 in Malaysia. Int. J. Environ. Res. Public Health 2022, 19, 1504. [Google Scholar] [CrossRef]
- Singh, S.; Sundram, B.M.; Rajendran, K.; Law, K.B.; Aris, T.; Ibrahim, H.; Dass, S.C.; Gill, B.S. Forecasting Daily Confirmed COVID-19 Cases in Malaysia Using ARIMA Models. J. Infect. Dev. Ctries. 2020, 14, 971–976. [Google Scholar] [CrossRef]
- Lucic, M.; Ghazzai, H.; Lipizzi, C.; Massoud, Y. Integrating County-Level Socioeconomic Data for COVID-19 Forecasting in the United States. IEEE Open J. Eng. Med. Biol. 2021, 2, 235–248. [Google Scholar] [CrossRef]
- Malki, Z.; Atlam, E.-S.; Ewis, A.; Dagnew, G.; Alzighaibi, A.R.; Elmarhomy, G.; Elhosseini, M.A.; Hassanien, A.E.; Gad, I. ARIMA Models for Predicting the End of COVID-19 Pandemic and the Risk of Second Rebound. Neural Comput. Appl. 2021, 33, 2929–2948. [Google Scholar] [CrossRef]
- Alzahrani, S.I.; Aljamaan, I.A.; Al-Fakih, E.A. Forecasting the Spread of the COVID-19 Pandemic in Saudi Arabia Using ARIMA Prediction Model under Current Public Health Interventions. J. Infect. Public Health 2020, 13, 914. [Google Scholar] [CrossRef]
- Dicker, R.C.; Coronado, F.; Koo, D.; Gibson, R. Principles of Epidemiology in Public Health Practice: An Introduction to Applied Epidemiology and Biostatistics, 3rd ed.; US Department of Health and Human Services: Atlanta, GA, USA, 2011.
- Perktold, J.; Seabold, S.; Taylor, J. Statsmodels: Econometric and Statistical Modeling with Python. In Proceedings of the 9th Python in Science Conference (SciPy 2010), Austin, TX, USA, 28 June 2010; pp. 92–96. [Google Scholar]
- Raybaut, P.; Córdoba, C. Spyder: Python Package Index. Available online: https://pypi.python.org/pypi/spyder (accessed on 10 July 2022).
- Box, G.E.P.; Jenkins, G.M.; Reinsel, G.C.; Ljung, G.M. Time Series Analysis: Forecasting and Control, 5th ed.; Wiley & Sons, Incorporated, John: Hoboken, NJ, USA, 2015; ISBN 9781118675021. [Google Scholar]
- Deretić, N.; Stanimirović, D.; al Awadh, M.; Vujanović, N.; Djukić, A. SARIMA Modelling Approach for Forecasting of Traffic Accidents. Sustainability 2022, 14, 4403. [Google Scholar] [CrossRef]
- Ahlburg, D.A. Forecast Evaluation and Improvement Using Theil’s Decomposition. J. Forecast. 1984, 3, 345–351. [Google Scholar] [CrossRef]
- Ala’raj, M.; Majdalawieh, M.; Nizamuddin, N. Modeling and Forecasting of COVID-19 Using a Hybrid Dynamic Model Based on SEIRD with ARIMA Corrections. Infect Dis. Model 2021, 6, 98–111. [Google Scholar] [CrossRef] [PubMed]
- Marmarelis, V.Z. Predictive Modeling of COVID-19 Data in the US: Adaptive Phase-Space Approach. IEEE Open J. Eng. Med. Biol. 2020, 1, 207–213. [Google Scholar] [CrossRef] [PubMed]


| MAPE (%) | Interpretation |
|---|---|
| <10 | Highly accurate forecasting |
| 10–20 | Good forecasting |
| 20–50 | Reasonable forecasting |
| >50 | Inaccurate forecasting |
| Dataset | Diff a | ADF Value | p Value b |
|---|---|---|---|
| Daily confirmed cases | 0 | 0.31 | 0.98 |
| 1 | −1.94 | 0.31 | |
| Daily deaths | 0 | 0.79 | 0.99 |
| 1 | −6.99 | <0.01 | |
| Daily recovery cases | 0 | 0.55 | 0.99 |
| 1 | −2.24 | 0.19 |
| Model | AIC | RMSE | MAPE | Ljung–Box Test | |
|---|---|---|---|---|---|
| Score | p-Value | ||||
| Confirmed cases | |||||
| SARIMA(1, 1, 1),(0, 1, 1, 7) | 1336.32 | 1931.46 | 7.26% | 0.14 | 0.71 |
| SARIMA(1, 1, 1),(0, 1, 2, 7) | 1336.41 | 2230.31 | 8.18% | 0.18 | 0.68 |
| SARIMA(1, 1, 1),(1, 1, 1, 7) | 1336.42 | 2281.49 | 8.31% | 0.15 | 0.7 |
| SARIMA(0, 1, 1),(1, 1, 1, 7) | 1338.13 | 3185.02 | 11.28% | 0.82 | 0.37 |
| SARIMA(1, 1, 2),(0, 1, 1, 7) | 1338.29 | 1999.01 | 7.44% | 0.14 | 0.71 |
| Deaths | |||||
| SARIMA(0, 1, 2),(1, 1, 2, 7) | 756.04 | 8.93 | 5.87% | 0.07 | 0.8 |
| SARIMA(0, 1, 2),(1, 1, 1, 7) | 754.13 | 8.90 | 5.82% | 0.05 | 0.82 |
| SARIMA(1, 1, 1),(1, 1, 2, 7) | 756.57 | 9.27 | 6.22% | 0.18 | 0.68 |
| SARIMA(1, 1, 1),(1, 1, 1, 7) | 754.30 | 8.99 | 5.87% | 0.1 | 0.76 |
| SARIMA(1, 1, 2),(1, 1, 2, 7) | 758.35 | 9.01 | 5.91% | 0.07 | 0.79 |
| Recovered cases | |||||
| SARIMA(0, 1, 1),(0, 1, 1, 7) | 1410.43 | 3686.54 | 13.51% | 0.14 | 0.71 |
| SARIMA(0, 1, 2),(0, 1, 1, 7) | 1411.39 | 3799.29 | 13.90% | 0.49 | 0.48 |
| SARIMA(1, 1, 1),(0, 1, 1, 7) | 1411.87 | 3750.77 | 13.74% | 0.39 | 0.53 |
| SARIMA(0, 1, 1),(1, 1, 1, 7) | 1412.22 | 3312.99 | 12.13% | 0.09 | 0.76 |
| SARIMA(0, 1, 1),(0, 1, 2, 7) | 1412.23 | 3343.85 | 12.25% | 0.10 | 0.75 |
| n-Day Forward Chaining | Block | Training Period | Forecasted Period | RMSE | MAE | MAPE (%) | U1 |
|---|---|---|---|---|---|---|---|
| 7-day interval | 1 | 1 Dec 21–2 Apr 22 | 3–9 Apr 22 | 3097.87 | 2789.22 | 11.39 | 0.06 |
| 2 | 1 Dec 21–9 Apr 22 | 10–16 Apr 22 | 2649.41 | 1733.54 | 8.66 | 0.06 | |
| 3 | 1 Dec 21–16 Apr 22 | 17–23 Apr 22 | 4936.84 | 4325.87 | 21.69 | 0.14 | |
| 4 | 1 Dec 21–23 Apr 22 | 24–30 Apr 22 | 4514.16 | 4099.44 | 29.02 | 0.13 | |
| Average | 3799.57 | 3237.02 | 17.69 | 0.10 | |||
| 14-day interval | 1 | 1 Dec 21–2 Apr 22 | 3–16 Apr 22 | 5785.04 | 4890.97 | 22.30 | 0.11 |
| 2 | 1 Dec 21–16 Apr 22 | 17–30 Apr 22 | 4779.98 | 4407.78 | 26.30 | 0.15 | |
| Average | 5282.51 | 4649.38 | 24.30 | 0.13 | |||
| 28-day interval | 1 | 1 Dec 21–2 Apr 22 | 3–30 Apr 22 | 10,997.77 | 9429.39 | 55.08 | 0.22 |
| n-Day Forward Chaining | Block | Training Period | Forecasted Period | RMSE | MAE | MAPE (%) | U1 |
|---|---|---|---|---|---|---|---|
| 7-day interval | 1 | 1 Dec 21–2 Apr 22 | 3–9 Apr 22 | 4.88 | 4.01 | 4.37 | 0.03 |
| 2 | 1 Dec 21–9 Apr 22 | 10–16 Apr 22 | 11.45 | 9.59 | 8.27 | 0.05 | |
| 3 | 1 Dec 21–16 Apr 22 | 17–23 Apr 22 | 2.98 | 2.63 | 2.05 | 0.01 | |
| 4 | 1 Dec 21–23 Apr 22 | 24–30 Apr 22 | 13.68 | 13.40 | 10.70 | 0.05 | |
| Average | 8.25 | 7.41 | 6.35 | 0.04 | |||
| 14-day interval | 1 | 1 Dec 21–2 Apr 22 | 3–16 Apr 22 | 7.19 | 5.35 | 5.02 | 0.03 |
| 2 | 1 Dec 21–16 Apr 22 | 17–30 Apr 22 | 10.31 | 8.30 | 6.60 | 0.04 | |
| Average | 8.75 | 6.83 | 5.81 | 0.04 | |||
| 28-day interval | 1 | 1 Dec 21–2 Apr 22 | 3–30 Apr 22 | 8.90 | 6.90 | 5.82 | 0.04 |
| n-Day Forward Chaining | Block | Training Period | Forecasted Period | RMSE | MAE | MAPE (%) | U1 |
|---|---|---|---|---|---|---|---|
| 7-day interval | 1 | 1 Dec 21–2 Apr 22 | 3–9 Apr 22 | 1999.88 | 1814.99 | 7.41 | 0.03 |
| 2 | 1 Dec 21–9 Apr 22 | 10–16 Apr 22 | 748.85 | 663.08 | 2.57 | 0.01 | |
| 3 | 1 Dec 21–16 Apr 22 | 17–23 Apr 22 | 2523.33 | 1942.32 | 8.55 | 0.05 | |
| 4 | 1 Dec 21–23 Apr 22 | 24–30 Apr 22 | 4665.59 | 4235.41 | 22.55 | 0.10 | |
| Average | 2484.41 | 2163.95 | 10.27 | 0.05 | |||
| 14-day interval | 1 | 1 Dec 21–2 Apr 22 | 3–16 Apr 22 | 2484.92 | 2296.17 | 9.15 | 0.04 |
| 2 | 1 Dec 21–16 Apr 22 | 17–30 Apr 22 | 5238.33 | 4264.90 | 21.64 | 0.11 | |
| Average | 3861.63 | 3280.54 | 15.40 | 0.08 | |||
| 28-day interval | 1 | 1 Dec 21–2 Apr 22 | 3–30 Apr 22 | 7554.66 | 6023.39 | 28.41 | 0.14 |
Publisher’s Note: MDPI stays neutral with regard to jurisdictional claims in published maps and institutional affiliations. |
© 2022 by the authors. Licensee MDPI, Basel, Switzerland. This article is an open access article distributed under the terms and conditions of the Creative Commons Attribution (CC BY) license (https://creativecommons.org/licenses/by/4.0/).
Share and Cite
Duangchaemkarn, K.; Boonchieng, W.; Wiwatanadate, P.; Chouvatut, V. SARIMA Model Forecasting Performance of the COVID-19 Daily Statistics in Thailand during the Omicron Variant Epidemic. Healthcare 2022, 10, 1310. https://doi.org/10.3390/healthcare10071310
Duangchaemkarn K, Boonchieng W, Wiwatanadate P, Chouvatut V. SARIMA Model Forecasting Performance of the COVID-19 Daily Statistics in Thailand during the Omicron Variant Epidemic. Healthcare. 2022; 10(7):1310. https://doi.org/10.3390/healthcare10071310
Chicago/Turabian StyleDuangchaemkarn, Khanita, Waraporn Boonchieng, Phongtape Wiwatanadate, and Varin Chouvatut. 2022. "SARIMA Model Forecasting Performance of the COVID-19 Daily Statistics in Thailand during the Omicron Variant Epidemic" Healthcare 10, no. 7: 1310. https://doi.org/10.3390/healthcare10071310
APA StyleDuangchaemkarn, K., Boonchieng, W., Wiwatanadate, P., & Chouvatut, V. (2022). SARIMA Model Forecasting Performance of the COVID-19 Daily Statistics in Thailand during the Omicron Variant Epidemic. Healthcare, 10(7), 1310. https://doi.org/10.3390/healthcare10071310