
Adaptation of the Highly Sensitive Person Scale (HSP) and Psychometric Properties of Reduced Versions of the Highly Sensitive Person Scale (R-HSP Scale) in Spanish Nursing Students

 ,
,  , , , and
Abstract
:1. Introduction
2. Materials and Methods
2.1. Design
2.2. Participants
2.3. Data Collection
2.4. The Instruments for Data Colletion
2.5. Adaptation and Initial Validation of Instruments
2.6. Statistical Analysis
2.7. Ethical Considerations
3. Results
Initial Validation of the Reduced Versions of the Highly Sensitive Person Scale (R-HSP Scale)
4. Discussion
Limitations
5. Conclusions
Author Contributions
Funding
Institutional Review Board Statement
Informed Consent Statement
Data Availability Statement
Conflicts of Interest
References
- Aron, E.N.; Aron, A. Sensory-processing sensitivity and its relation to introversion and emotionality. J. Pers. Soc. Psychol. 1997, 73, 345–368. [Google Scholar] [CrossRef] [PubMed]
- Greven, C.U.; Lionetti, F.; Booth, C.; Aron, E.N.; Fox, E.; Schendan, H.E.; Pluess, M.; Bruining, H.; Acevedo, B.; Bijttebier, P.; et al. Sensory Processing Sensitivity in the context of Environmental Sensitivity: A critical review and development of research agenda. Neurosci. Biobehav. Rev. 2019, 98, 287–305. [Google Scholar] [CrossRef] [PubMed]
- Aron, E.N.; Aron, A.; Jagiellowicz, J. Sensory Processing Sensitivity. Pers. Soc. Psychol. Rev. 2012, 16, 262–282. [Google Scholar] [CrossRef] [PubMed] [Green Version]
- Pluess, M.; Assary, E.; Lionetti, F.; Lester, K.J.; Krapohl, E.; Aron, E.N.; Aron, A. Environmental sensitivity in children: Development of the Highly Sensitive Child Scale and identification of sensitivity groups. Dev. Psychol. 2018, 54, 51–70. [Google Scholar] [CrossRef]
- Ellis, B.J.; Boyce, W.T.; Belsky, J.; Bakermans-Kranenburg, M.J.; van Ijzendoorn, M.H. Differential susceptibility to the environment: An evolutionary–neurodevelopmental theory. Dev. Psychopathol. 2011, 23, 7–28. [Google Scholar] [CrossRef] [Green Version]
- Homberg, J.R.; Jagiellowicz, J. A neural model of vulnerability and resilience to stress-related disorders linked to differential susceptibility. Mol. Psychiatry 2021, 27, 514–524. [Google Scholar] [CrossRef]
- Pluess, M. Vantage Sensitivity: Environmental Sensitivity to Positive Experiences as a Function of Genetic Differences. J. Pers. 2015, 85, 38–50. [Google Scholar] [CrossRef]
- Lionetti, F.; Aron, A.; Aron, E.N.; Burns, G.L.; Jagiellowicz, J.; Pluess, M. Dandelions, tulips and orchids: Evidence for the existence of low-sensitive, medium-sensitive and high-sensitive individuals. Transl. Psychiatry 2018, 8, 24. [Google Scholar] [CrossRef] [Green Version]
- Rubaltelli, E.; Scrimin, S.; Moscardino, U.; Priolo, G.; Buodo, G. Media exposure to terrorism and people’s risk perception: The role of environmental sensitivity and psychophysiological response to stress. Br. J. Psychol. 2018, 109, 656–673. [Google Scholar] [CrossRef]
- Costa-López, B.; Ferrer-Cascales, R.; Ruiz-Robledillo, N.; Albaladejo-Blázquez, N.; Baryła-Matejczuk, M. Relationship between Sensory Processing and Quality of Life: A Systematic Review. J. Clin. Med. 2021, 10, 3961. [Google Scholar] [CrossRef]
- Ramón-Arbués, E.; Gea-Caballero, V.; Granada-López, J.M.; Juárez-Vela, R.; Pellicer-García, B.; Antón-Solanas, I. The Prevalence of Depression, Anxiety and Stress and Their Associated Factors in College Students. Int. J. Environ. Res. Public Health 2020, 17, 7001. [Google Scholar] [CrossRef] [PubMed]
- Yano, K.; Kase, T.; Oishi, K. The effects of sensory-processing sensitivity and sense of coherence on depressive symptoms in university students. Health Psychol. Open 2019, 6, 1–5. [Google Scholar] [CrossRef] [PubMed]
- Limone, P.; Zefferino, R.; Toto, G.A.; Tomei, G. Work Stress, Mental Health and Validation of Professional Stress Scale (PSS) in an Italian-Speaking Teachers Sample. Healthcare 2021, 9, 1434. [Google Scholar] [CrossRef]
- Weed, P.L. The Influence of Supervision on School Psychologists’ Sense of Self-Efficacy; Indiana University of Pennsylvania: Indiana, PA, USA, 2013. [Google Scholar]
- Labrague, L.J.; McEnroe-Petitte, D.M.; Santos, J.A.D.L.; Edet, O. Examining stress perceptions and coping strategies among Saudi nursing students: A systematic review. Nurse Educ. Today 2018, 65, 192–200. [Google Scholar] [CrossRef] [PubMed]
- Enns, A.; Eldridge, G.D.; Montgomery, C.; Gonzalez, V.M. Perceived stress, coping strategies, and emotional intelligence: A cross-sectional study of university students in helping disciplines. Nurse Educ. Today 2018, 68, 226–231. [Google Scholar] [CrossRef] [PubMed]
- Boterberg, S.; Warreyn, P. Making sense of it all: The impact of sensory processing sensitivity on daily functioning of children. Pers. Individ. Differ. 2016, 92, 80–86. [Google Scholar] [CrossRef] [Green Version]
- Tillmann, T.; Matany, E.K.; Duttweiler, H. Measuring Environmental Sensitivity in Educational Contexts: A Validation Study With German-Speaking Students. J. Educ. Dev. Psychol. 2018, 8, 17–28. [Google Scholar] [CrossRef] [Green Version]
- Acevedo, B.P.; Santander, T.; Marhenke, R.; Aron, A.; Aron, E. Sensory Processing Sensitivity Predicts Individual Differences in Resting-State Functional Connectivity Associated with Depth of Processing. Neuropsychobiology 2021, 80, 185–200. [Google Scholar] [CrossRef]
- Liu, C.H.; Stevens, C.; Wong, S.H.; Yasui, M.; Chen, J.A. The prevalence and predictors of mental health diagnoses and suicide among U.S. college students: Implications for addressing disparities in service use. Depression Anxiety 2018, 36, 8–17. [Google Scholar] [CrossRef]
- Gallego-Gómez, J.I.; Campillo-Cano, M.; Carrión-Martínez, A.; Balanza, S.; Rodríguez-González-Moro, M.T.; Simonelli-Muñoz, A.J.; Rivera-Caravaca, J.M. The COVID-19 Pandemic and Its Impact on Homebound Nursing Students. Int. J. Environ. Res. Public Health 2020, 17, 7383. [Google Scholar] [CrossRef]
- Simonelli-Muñoz, A.J.; Balanza, S.; Rivera-Caravaca, J.M.; Vera-Catalán, T.; Lorente, A.M.; Gallego-Gómez, J.I. Reliability and validity of the student stress inventory-stress manifestations questionnaire and its association with personal and academic factors in university students. Nurse Educ. Today 2018, 64, 156–160. [Google Scholar] [CrossRef]
- McCarthy, B.; Trace, A.; O’Donovan, M.; Brady-Nevin, C.; Murphy, M.; O’Shea, M.; O’Regan, P. Nursing and midwifery students’ stress and coping during their undergraduate education programmes: An integrative review. Nurse Educ. Today 2018, 61, 197–209. [Google Scholar] [CrossRef] [PubMed]
- Slagt, M.; Dubas, J.S.; van Aken, M.A.G.; Ellis, B.J.; Deković, M. Sensory processing sensitivity as a marker of differential susceptibility to parenting. Dev. Psychol. 2018, 54, 543–558. [Google Scholar] [CrossRef] [PubMed]
- Gallego-Gómez, J.I.; Balanza, S.; Leal-Llopis, J.; García-Méndez, J.A.; Oliva-Pérez, J.; Doménech-Tortosa, J.; Gómez-Gallego, M.; Simonelli-Muñoz, A.J.; Rivera-Caravaca, J. Effectiveness of music therapy and progressive muscle relaxation in reducing stress before exams and improving academic performance in Nursing students: A randomized trial. Nurse Educ. Today 2019, 84, 104217. [Google Scholar] [CrossRef] [PubMed]
- Chacón, A.; Pérez-Chacón, M.; Borda-Mas, M.; Avargues-Navarro, M.L.; López-Jiménez, A.M. Cross-Cultural Adaptation and Validation of the Highly Sensitive Person Scale to the Adult Spanish Population (HSPS-S). Psychol. Res. Behav. Manag. 2021, 14, 1041–1052. [Google Scholar] [CrossRef]
- Costa-López, B.; Ruiz-Robledillo, N.; Albaladejo-Blázquez, N.; Baryła-Matejczuk, M.; Ferrer-Cascales, R. Psychometric Properties of the Spanish Version of the Highly Sensitive Child Scale: The Parent Version. Int. J. Environ. Res. Public Health 2022, 19, 3101. [Google Scholar] [CrossRef]
- Konrad, S.; Herzberg, P.Y. Psychometric Properties and Validation of a German High Sensitive Person Scale (HSPS-G). Eur. J. Psychol. Assess. 2019, 35, 364–378. [Google Scholar] [CrossRef]
- Pluess, M. Protocol for the Adaptation of Questionnaires; Queen Mary University of London: London, UK, 2020. [Google Scholar]
- de Winter, J.C.F.; Dodou, D.; Wieringa, P.A. Exploratory Factor Analysis with Small Sample Sizes. Multivar. Behav. Res. 2009, 44, 147–181. [Google Scholar] [CrossRef]
- Evans, D.E.; Rothbart, M.K. Temperamental sensitivity: Two constructs or one? Pers. Individ. Differ. 2008, 44, 108–118. [Google Scholar] [CrossRef]
- Weyn, S.; Van Leeuwen, K.; Pluess, M.; Lionetti, F.; Greven, C.U.; Goossens, L.; Colpin, H.; Van Den Noortgate, W.; Verschueren, K.; Bastin, M.; et al. Propiedades psicométricas de la escala de niños altamente sensibles a través de la etapa de desarrollo, el género y el país. Actual Psicol. 2021, 40, 3309–3325. [Google Scholar]
- Assary, E.; Zavos, H.M.S.; Krapohl, E.; Keers, R.; Pluess, M. La arquitectura genética de la sensibilidad ambiental refleja múltiples componentes hereditarios: Un estudio de gemelos con adolescentes. Mol. Psiquiatr. 2020, 26, 4896–4904. [Google Scholar]
- De la Serna, J.M.; Chacón, M.P.; Chacón, A. Eres Altamente Sensible? Descubre todas las claves: Litres, Spain, 2022. [Google Scholar]


| Questionnaire Items | ICC (CI 95%) | F (p) |
|---|---|---|
| Item 1 The behavior of others affects me. | 0.735 (0.655–0.796) | 3.767 (<0.001) |
| Item 2 I tend to be sensitive to pain. | 0.719 (0.634–0.784) | 3.554 (<0.001) |
| Item 3 On busy days, I tend to need to leave, to lay down in bed, and to look for a dark room or any other place where I can find peace and relief from stimulation. | 0.569 (0.439–0.668) | 2.318 (<0.001) |
| Item 4 I am particularly sensitive to the effects of caffeine. | 0.811 (0.754–0.855) | 5.290 (<0.001) |
| Item 5 I tend to be easily overwhelmed by things such as bright lights, strong odors, coarse fabrics, or police or ambulance sirens. | 0.668 (0.568–0.745) | 3.014 (<0.001) |
| Item 6 Loud noises make me feel uncomfortable. | 0.720 (0.636–0.785) | 3.569 (<0.001) |
| Item 7 I have a rich and complex inner life, I tend to overthink things. | 0.527 (0.384–0.636) | 2.113 (<0.001) |
| Item 8 I get scared easily. | 0.813 (0.756–0.856) | 5.339 (<0.001) |
| Item 9 I become overwhelmed when I have a lot of things to do and little time | 0.723 (0.640–0.787) | 3.610 (<0.001) |
| Item 10 I am bothered that the rest want me to do too many things at the same time. | 0.564 (0.433–0.665) | 2.296 (<0.001) |
| Item 11 I tend to avoid violent films and violent series on television. | 0.788 (0.724–0.837) | 4.714 (<0.001) |
| Item 12 The activation provoked by the hustle around me is unpleasant for me. | 0.518 (0.373–0.629) | 2.074 (<0.001) |
| Item 13 Life changes shock me (moving, work changes, separations, births, deaths…). | 0.680 (0.584–0.754) | 3.126 (<0.001) |
| Item 14 When I was a child, my parents or teachers tended to see me as a sensitive or shy person. | 0.314 (0.107–0.472) | 1.457 (=0.003) |
| Item 15 For me, it is important to have a life in which I can avoid perturbing or overwhelming situations. | 0.357 (0.163–0.506) | 1.555 (=0.001) |
| Item 16 When I have to compete or be observed as I perform a task, I become nervous and unsure, and I do it worse than what I could do. | 0.531 (0.389–0.639) | 2.131 (<0.001) |
| Split-halves analysis | ||
| Cronbach’s α | ||
| Test | 0.705 | |
| Retest | 0.760 | |
| Correlation between parts | 0.795 | |
| Spearman’s Brown coefficient | 0.886 | |
| ITEMS | Item 1 | Item 2 | Item 3 | Item 4 | Item 5 | Item 6 | Item 7 | Item 8 | Item 9 | Item 10 | Item 11 | Item 12 | Item 13 | Item 14 | Item 15 | Item 16 | |
|---|---|---|---|---|---|---|---|---|---|---|---|---|---|---|---|---|---|
| Item 1 The behavior of others affects me. | rho p | - | |||||||||||||||
| Item 2 I tend to be sensitive to pain. | rho p | 0.162 0.015 | - | ||||||||||||||
| Item 3 On busy days, I tend to need to leave, to lay down in bed, and to look for a dark room or any other place where I can find peace and relief from stimulation. | rho p | 0.042 0.536 | 0.053 0.428 | - | |||||||||||||
| Item 4 I am particularly sensitive to the effects of caffeine. | rho p | 0.062 0.360 | 0.165 0.013 | 0.027 0.684 | - | ||||||||||||
| Item 5 I tend to be easily overwhelmed by things such as bright lights, strong odors, coarse fabrics, or police or ambulance sirens. | rho p | 0.183 0.006 | 0.053 0.430 | 0.034 0.616 | 0.191 0.004 | - | |||||||||||
| Item 6 Loud noises make me feel uncomfortable. | rho p | 0.129 0.053 | 0.210 0.002 | 0.156 0.019 | 0.147 0.028 | 0.456 <0.001 | - | ||||||||||
| Item 7 I have a rich and complex inner life, I tend to overthink things. | rho p | 0.165 0.013 | −0.024 0.724 | −0.019 0.780 | 0.095 0.156 | 0.131 0.051 | 0.068 0.311 | - | |||||||||
| Item 8 I get scared easily. | rho p | 0.120 0.073 | 0.111 0.097 | 0.104 0.121 | 0.034 0.612 | 0.192 0.004 | 0.137 0.411 | 0.081 0.226 | - | ||||||||
| Item 9 I become overwhelmed when I have a lot of things to do and little time | rho p | 0.103 0.125 | 0.074 0.269 | 0.191 0.004 | −0.014 0.836 | 0.050 0.460 | 0.196 0.003 | 0.037 0.587 | 0.172 0.010 | - | |||||||
| Item 10 I am bothered that the rest want me to do too many things at the same time. | rho p | 0.158 0.018 | 0.007 0.912 | 0.023 0.737 | 0.007 0.991 | 0.110 0.100 | 0.133 0.047 | 0.073 0.279 | 0.077 0.250 | 0.087 0.193 | - | ||||||
| Item 11 I tend to avoid violent films and violent series on television. | rho p | 0.012 0.855 | 0.069 0.306 | −0.005 0.935 | −0.021 0.754 | 0.118 0.079 | −0.033 0.623 | −0.028 0.674 | 0.049 0.469 | −0.068 0.310 | 0.114 0.088 | - | |||||
| Item 12 The activation provoked by the hustle around me is unpleasant for me. | rho p | 0.008 0.990 | 0.185 0.005 | 0.070 0.298 | 0.103 0.124 | 0.261 <0.001 | 0.127 0.058 | 0.068 0.308 | 0.173 0.009 | 0.132 0.049 | 0.101 0.133 | 0.126 0.059 | - | ||||
| Item 13 Life changes shock me (moving, work changes, separations, births, deaths…). | rho p | 0.034 0.613 | 0.087 0.193 | 0.218 0.001 | −0.023 0.736 | 0.134 0.045 | 0.289 <0.001 | 0.045 0.506 | 0.053 0.433 | 0.295 <0.001 | 0.081 0.227 | 0.059 0.380 | 0.255 <0.001 | - | |||
| Item 14 When I was a child, my parents or teachers tended to see me as a sensitive or shy person. | rho p | 0.180 0.007 | 0.092 0.168 | −0.025 0.709 | 0.056 0.403 | 0.137 0.041 | 0.156 0.019 | 0.030 0.651 | 0.249 <0.001 | 0.171 0.010 | 0.214 0.001 | 0.125 0.063 | 0.218 0.001 | 0.138 0.039 | - | ||
| Item 15 For me, it is important to have a life in which I can avoid perturbing or overwhelming situations. | rho p | 0.107 0.110 | 0.181 0.007 | 0.149 0.026 | −0.007 0.913 | 0.124 0.065 | 0.205 0.002 | 0.194 0.004 | 0.166 0.013 | 0.210 0.002 | 0.196 0.003 | 0.127 0.058 | 0.146 0.029 | 0.271 <0.001 | 0.192 0.004 | - | |
| Item 16 When I have to compete or be observed as I perform a task, I become nervous and unsure, and I do it worse than what I could do. | rho p | 0.059 0.381 | 0.173 0.010 | 0.140 0.037 | 0.161 0.016 | 0.153 0.022 | 0.242 <0.001 | 0.171 0.011 | 0.096 0.154 | 0.243 <0.001 | 0.149 0.026 | 0.006 0.930 | 0.241 <0.001 | 0.172 0.010 | 0.214 0.001 | 0.196 0.003 | - |
| Questionnaire Items | Mean ± Standard Deviation | Correlation of the Items with the Total Corrected Scale | Cronbach’s α When an Item Is Eliminated |
|---|---|---|---|
| Item 1 The behavior of others affects me. | 0.84 ± 0.36 | 0.285 | 0.690 |
| Item 2 I tend to be sensitive to pain. | 0.43 ± 0.49 | 0.276 | 0.691 |
| Item 3 On busy days, I tend to need to leave, to lay down in bed, and to look for a dark room or any other place where I can find peace and relief from stimulation. | 0.68 ± 0.46 | 0.178 | 0.702 |
| Item 4 I am particularly sensitive to the effects of caffeine. | 0.27 ± 0.44 | 0.157 | 0.703 |
| Item 5 I tend to be easily overwhelmed by things such as bright lights, strong odors, coarse fabrics, or police or ambulance sirens. | 0.23 ± 0.42 | 0.314 | 0.686 |
| Item 6 Loud noises make me feel uncomfortable. | 0.51 ± 0.50 | 0.437 | 0.670 |
| Item 7 I have a rich and complex inner life, I tend to overthink things. | 0.83 ± 0.37 | 0.185 | 0.699 |
| Item 8 I get scared easily. | 0.44 ± 0.49 | 0.275 | 0.691 |
| Item 9 I become overwhelmed when I have a lot of things to do and little time | 0.80 ± 0.40 | 0.380 | 0.680 |
| Item 10 I am bothered that the rest want me to do too many things at the same time. | 0.58 ± 0.49 | 0.229 | 0.696 |
| Item 11 I tend to avoid violent films and violent series on television. | 0.28 ± 0.45 | 0.296 | 0.688 |
| Item 12 The activation provoked by the hustle around me is unpleasant for me. | 0.47 ± 0.50 | 0.327 | 0.684 |
| Item 13 Life changes shock me (moving, work changes, separations, births, deaths…). | 0.75 ± 0.43 | 0.351 | 0.682 |
| Item 14 When I was a child, my parents or teachers tended to see me as a sensitive or shy person. | 0.50 ± 0.50 | 0.297 | 0.688 |
| Item 15 For me, it is important to have a life in which I can avoid perturbing or overwhelming situations. | 0.83 ± 0.37 | 0.377 | 0.681 |
| Item 16 When I have to compete or be observed as I perform a task, I become nervous and unsure, and I do it worse than what I could do. | 0.58 ± 0.49 | 0.421 | 0.672 |
| Cronbach’s α | 0.702 | ||
| Kaiser–Meyer–Olkin Test Bartlett Sphericity Test | 0.729 <0.001 | |||||
|---|---|---|---|---|---|---|
| ITEMS | Factor 1 Instability | Factor 2 Environment | Factor 3 Interaction with Others | Factor 4 Sensoperception | Factor 5 Sensitivity | Factor 6 Insecurity |
| Item 1 The behavior of others affects me. | −0.101 | 0.188 | 0.536 | −0.040 | 0.228 | 0.361 |
| Item 2 I tend to be sensitive to pain. | 0.154 | 0.244 | 0.157 | 0.002 | 0.690 | −0.108 |
| Item 3 On busy days, I tend to need to leave, to lay down in bed, and to look for a dark room or any other place where I can find peace and relief from stimulation. | −0.120 | 0.738 | 0.006 | 0.010 | 0.110 | −0.095 |
| Item 4 I am particularly sensitive to the effects of caffeine. | −0.004 | −0.136 | −0.004 | 0.244 | 0.667 | 0.158 |
| Item 5 I tend to be easily overwhelmed by things such as bright lights, strong odors, coarse fabrics, or police or ambulance sirens. | 0.006 | −0.050 | 0.170 | 0.835 | 0.094 | 0.053 |
| Item 6 Loud noises make me feel uncomfortable. | 0.260 | 0.221 | 0.031 | 0.672 | 0.118 | 0.101 |
| Item 7 I have a rich and complex inner life, I tend to overthink things. | 0.009 | 0.013 | 0.010 | 0.141 | 0.005 | 0.828 |
| Item 8 I get scared easily. | 0.052 | 0.054 | 0.607 | 0.136 | 0.103 | −0.057 |
| Item 9 I become overwhelmed when I have a lot of things to do and little time | 0.345 | 0.501 | 0.279 | −0.099 | 0.042 | 0.065 |
| Item 10 I am bothered that the rest want me to do too many things at the same time. | 0.008 | 0.155 | 0.538 | 0.214 | −0.368 | 0.131 |
| Item 11 I tend to avoid violent films and violent series on television. | 0.610 | −0.096 | 0.126 | 0.258 | 0.068 | −0.204 |
| Item 12 The activation provoked by the hustle around me is unpleasant for me. | 0.564 | 0.444 | −0.160 | 0.245 | −0.145 | −0.080 |
| Item 13 Life changes shock me (moving, work changes, separations, births, deaths…). | 0.465 | −0.025 | 0.589 | −0.034 | 0.045 | −0.074 |
| Item 14 When I was a child, my parents or teachers tended to see me as a sensitive or shy person. | 0.598 | −0.022 | 0.080 | −0.107 | 0.055 | 0.428 |
| Item 15 For me, it is important to have a life in which I can avoid perturbing or overwhelming situations. | 0.119 | 0.527 | 0.205 | 0.199 | −0.093 | 0.249 |
| Item 16 When I have to compete or be observed as I perform a task, I become nervous and unsure, and I do it worse than what I could do. | 0.454 | 0.265 | 0.056 | 0.138 | 0.273 | 0.194 |
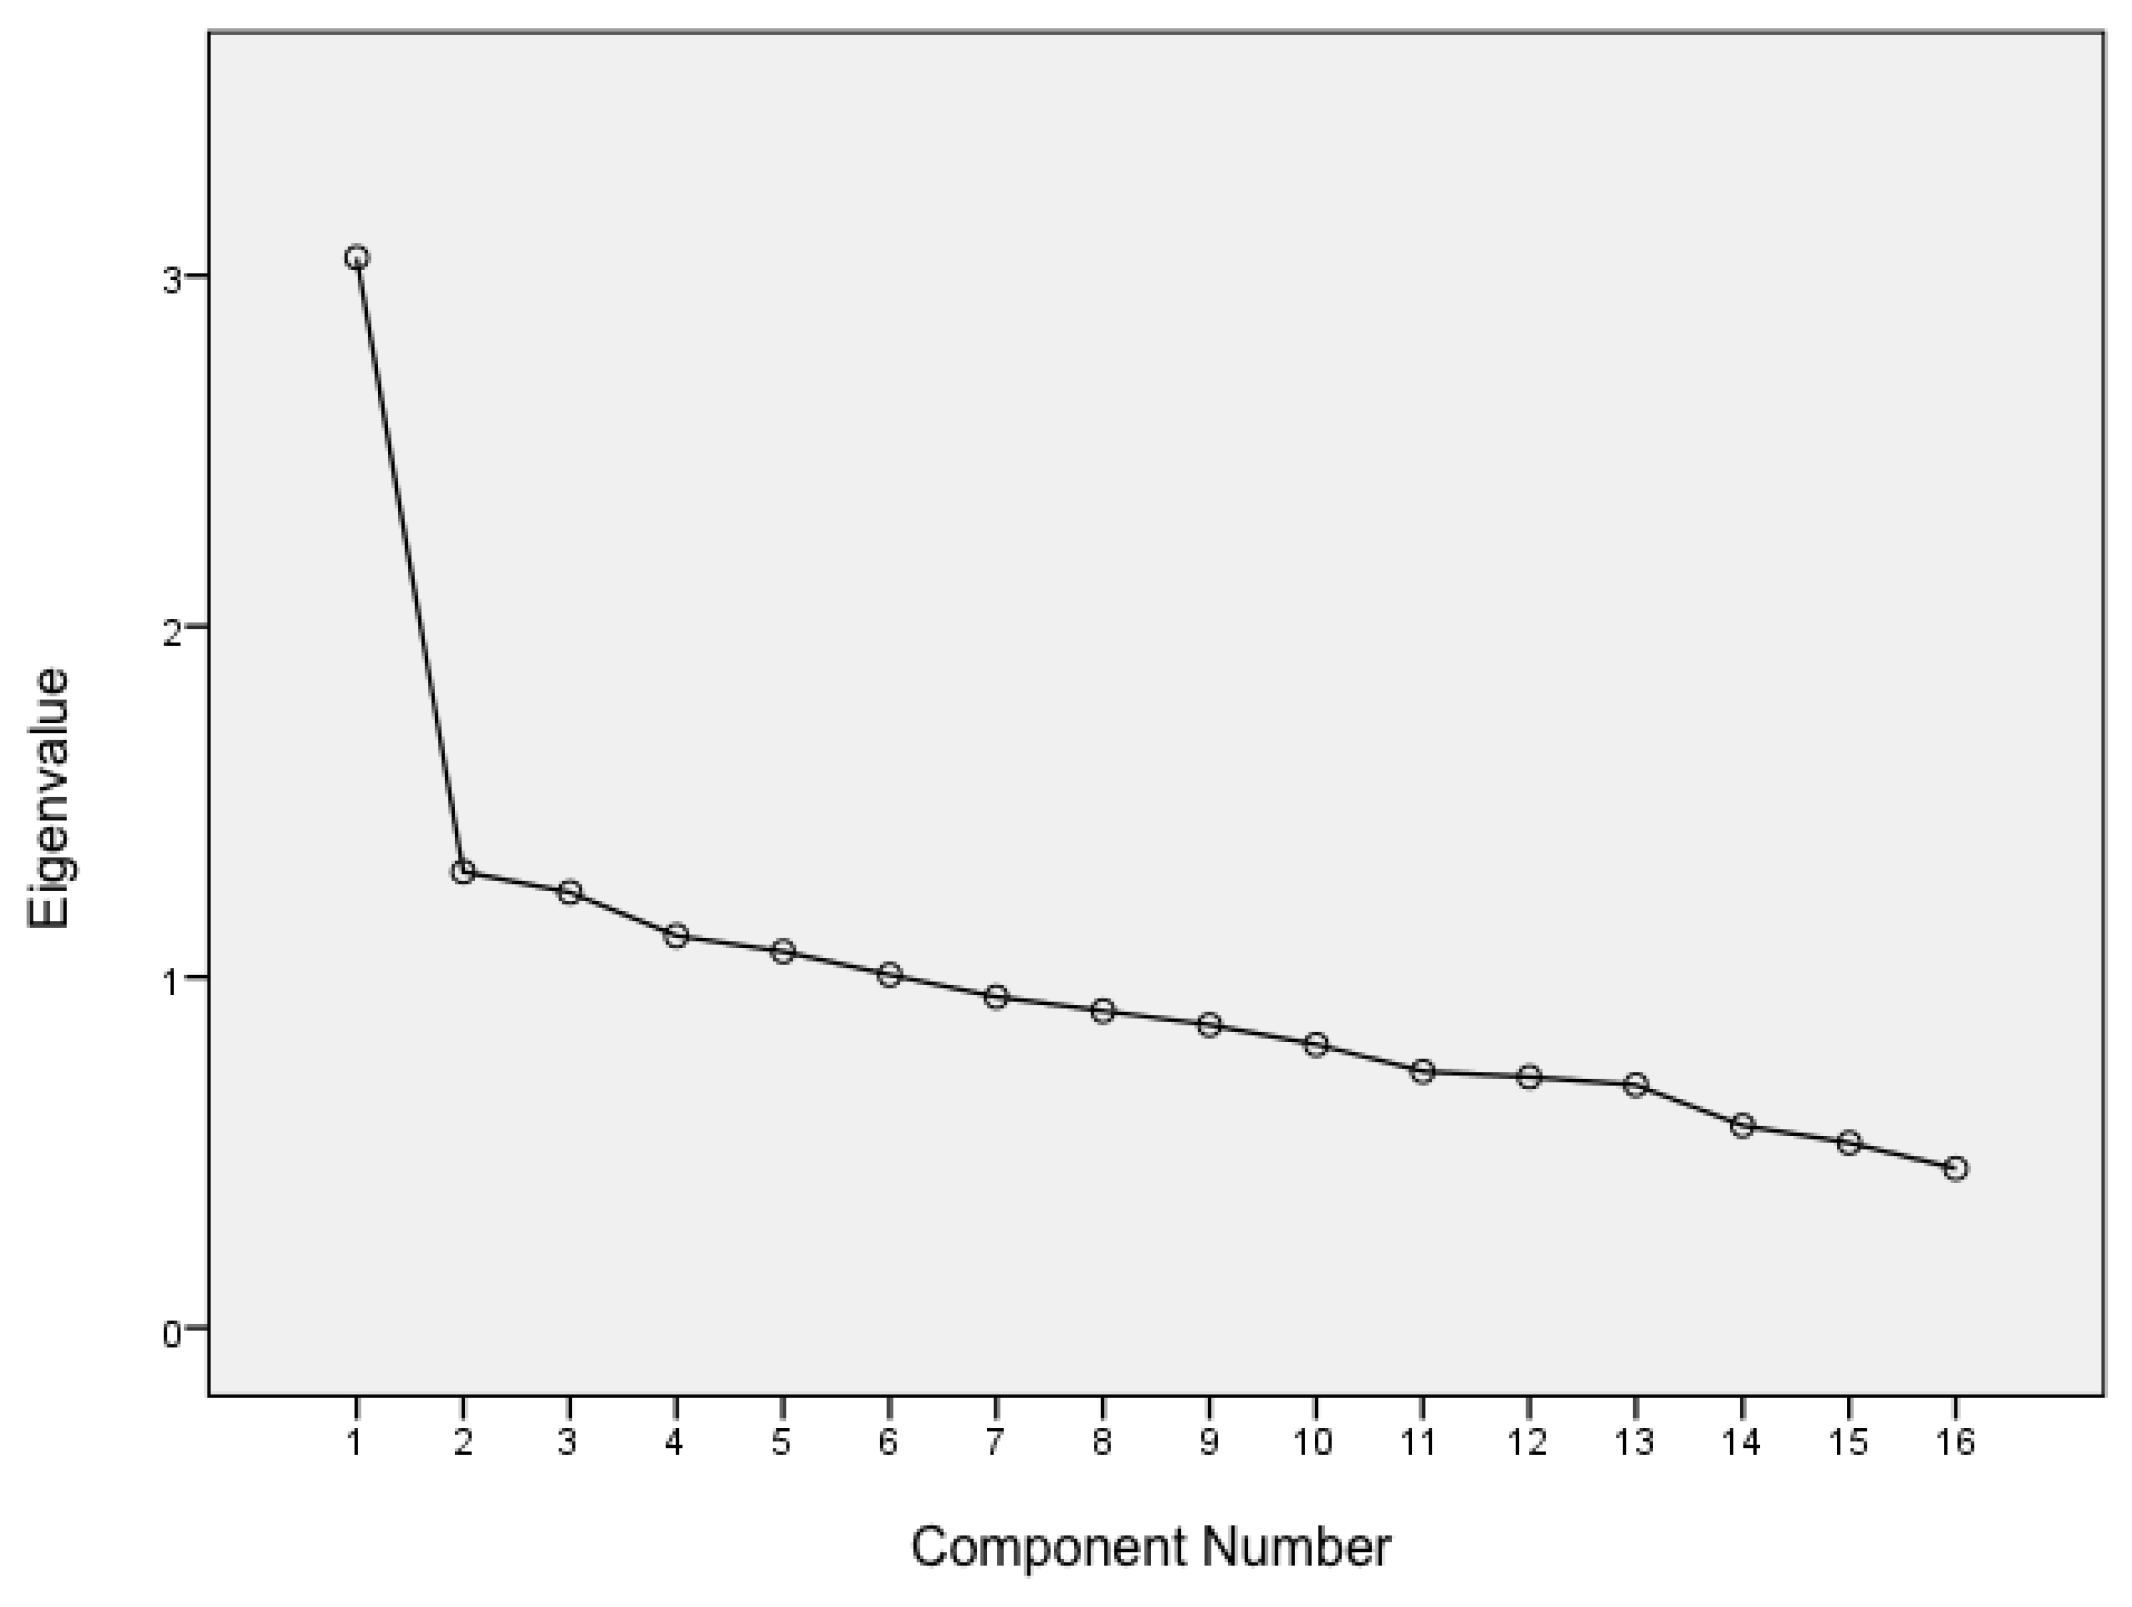
| Eigenvalue Variance | 3.051 19.1% | 1.300 8.1% | 1.241 7.7% | 1.118 7% | 1.073 6.7% | 1.006 6.3% |
| Variables Investigated | Factor 1 | Factor 2 | Factor 3 | Factor 4 | Factor 5 | Factor 6 | Total Scala HSP |
|---|---|---|---|---|---|---|---|
| Gender | |||||||
| Female (n = 213) | 2.79 ± 1.43 | 2.92 ± 1.03 | 2.82 ± 1.02 | 0.80 ± 0.79 | 0.72 ± 0.70 | 1.38 ± 0.65 | 9.61 ± 2.99 |
| Male (n = 71) | 1.94 ± 1.19 | 2.32 ± 1.22 | 1.94 ± 1.06 | 0.56 ± 0.69 | 0.62 ± 0.76 | 1.2 ± 0.68 | 7.1 ± 2.71 |
| p < 0.001 | p < 0.001 | p < 0.001 | p = 0.027 | p = 0.298 | p = 0.052 | p < 0.001 | |
| Academic year | |||||||
| First (n = 82) | 2.54 ± 1.44 | 2.80 ± 1.12 | 2.50 ± 1.25 | 0.65 ± 0.70 | 0.61 ± 0.68 | 1.30 ± 0.60 | 8.73 ± 3.19 |
| Second (n = 72) | 2.81 ± 1.49 | 2.81 ± 1.17 | 2.69 ± 1.03 | 0.78 ± 0.79 | 0.69 ± 0.70 | 1.40 ± 0.72 | 9.31 ± 3.42 |
| Third (n = 71) | 2.51 ± 1.29 | 2.72 ± 1.04 | 2.72 ± 0.97 | 0.75 ± 0.82 | 0.76 ± 0.74 | 1.38 ± 0.63 | 9.09 ± 2.59 |
| Fourth (n = 59) | 2.46 ± 1.47 | 2.76 ± 1.11 | 2.49 ± 1.10 | 0.81 ± 0.79 | 0.75 ± 0.77 | 1.22 ± 0.69 | 8.89 ± 3.18 |
| p = 0.479 | p = 0.959 | p = 0.458 | p = 0.596 | p = 0.572 | p = 0.401 | p = 0.683 | |
| Healthcare training | |||||||
| No (n = 212) | 2.58 ± 1.43 | 2.81 ± 1.11 | 2.67 ±1.08 | 0.66 ± 0.74 | 0.68 ± 0.71 | 1.34 ± 0.65 | 9.01 ± 3.08 |
| Yes (n = 72) | 2.60 ± 1.42 | 2.67 ± 1.10 | 2.42 ± 1.13 | 0.99 ± 0.81 | 0.75 ± 0.74 | 1.31 ± 0.72 | 8.98 ± 3.19 |
| p = 0.911 | p = 0.339 | p = 0.107 | p = 0.003 | p = 0.484 | p = 0.724 | p = 0.948 | |
| Family relations | |||||||
| Satisfactory (n = 259) | 2.57 ± 1.42 | 2.75 ± 1.12 | 2.58 ± 1.09 | 0.71 ± 0.77 | 0.68 ± 0.71 | 1.33 ± 0.68 | 8.89 ± 3.10 |
| Unsatisfactory (n = 25) | 2.68 ± 1.52 | 3.08 ± 0.90 | 2.88 ± 1.09 | 1 ± 0.81 | 0.88 ± 0.78 | 1.32 ± 0.55 | 10.16 ± 2.92 |
| p = 0.734 | p = 0.151 | p = 0.194 | p = 0.104 | p = 0.227 | p = 0.920 | p = 0.049 | |
| Relationship with partner | |||||||
| No partner (n = 146) | 2.58 ± 1.41 | 2.73 ± 1.09 | 2.57 ± 1.10 | 0.78 ± 0.77 | 0.71 ± 0.72 | 1.37 ± 0.65 | 9.03 ± 3.14 |
| Satisfactory (n = 127) | 2.64 ± 1.47 | 2.82 ± 1.14 | 2.61 ± 1.11 | 0.69 ± 0.77 | 0.68 ± 0.72 | 1.31 ± 0.68 | 8.97 ± 3.17 |
| Unsatisfactory (n = 11) | 2 ± 1 | 2.91 ± 1.04 | 2.91 ± 0.83 | 0.82 ± 0.87 | 0.73 ± 0.78 | 1.09 ± 0.70 | 9 ± 1.78 |
| p = 0.365 | p = 0.727 | p = 0.605 | p = 0.564 | p = 0.914 | p = 0.357 | p = 0.988 | |
| Social relations | |||||||
| Satisfactory (n = 275) | 2.59 ± 1.42 | 2.78 ± 1.10 | 2.59 ± 1.10 | 0.72 ± 0.76 | 0.69 ± 0.72 | 1.32 ± 0.67 | 8.97 ± 3.09 |
| Unsatisfactory (n = 9) | 2.33 ± 1.73 | 2.67 ± 1.50 | 3 ± 0.86 | 1.44 ± 0.88 | 0.78 ± 0.83 | 1.56 ± 0.52 | 10.11 ± 3.55 |
| p = 0.672 | p = 0.830 | p = 0.199 | p = 0.005 | p = 0.774 | p = 0.231 | p = 0.368 | |
| Age | rho = −0.055 | rho = 0.062 | rho = −0.129 | rho = 0.172 | rho = 0.159 | rho = −0.026 | rho = −0.008 |
| p = 0.352 | p = 0.298 | p = 0.030 | p = 0.004 | p = 0.007 | p = 0.666 | p = 0.899 |
Publisher’s Note: MDPI stays neutral with regard to jurisdictional claims in published maps and institutional affiliations. |
© 2022 by the authors. Licensee MDPI, Basel, Switzerland. This article is an open access article distributed under the terms and conditions of the Creative Commons Attribution (CC BY) license (https://creativecommons.org/licenses/by/4.0/).
Share and Cite
Ponce-Valencia, A.; Jiménez-Rodríguez, D.; Simonelli-Muñoz, A.J.; Gallego-Gómez, J.I.; Castro-Luna, G.; Echevarría Pérez, P. Adaptation of the Highly Sensitive Person Scale (HSP) and Psychometric Properties of Reduced Versions of the Highly Sensitive Person Scale (R-HSP Scale) in Spanish Nursing Students. Healthcare 2022, 10, 932. https://doi.org/10.3390/healthcare10050932
Ponce-Valencia A, Jiménez-Rodríguez D, Simonelli-Muñoz AJ, Gallego-Gómez JI, Castro-Luna G, Echevarría Pérez P. Adaptation of the Highly Sensitive Person Scale (HSP) and Psychometric Properties of Reduced Versions of the Highly Sensitive Person Scale (R-HSP Scale) in Spanish Nursing Students. Healthcare. 2022; 10(5):932. https://doi.org/10.3390/healthcare10050932
Chicago/Turabian StylePonce-Valencia, Alicia, Diana Jiménez-Rodríguez, Agustín Javier Simonelli-Muñoz, Juana Inés Gallego-Gómez, Gracia Castro-Luna, and Paloma Echevarría Pérez. 2022. "Adaptation of the Highly Sensitive Person Scale (HSP) and Psychometric Properties of Reduced Versions of the Highly Sensitive Person Scale (R-HSP Scale) in Spanish Nursing Students" Healthcare 10, no. 5: 932. https://doi.org/10.3390/healthcare10050932
APA StylePonce-Valencia, A., Jiménez-Rodríguez, D., Simonelli-Muñoz, A. J., Gallego-Gómez, J. I., Castro-Luna, G., & Echevarría Pérez, P. (2022). Adaptation of the Highly Sensitive Person Scale (HSP) and Psychometric Properties of Reduced Versions of the Highly Sensitive Person Scale (R-HSP Scale) in Spanish Nursing Students. Healthcare, 10(5), 932. https://doi.org/10.3390/healthcare10050932