
Modeling Patient Flow in an Emergency Department under COVID-19 Pandemic Conditions: A Hybrid Modeling Approach


Abstract
:1. Introduction
How can we build a simulation model of the emergency department patient flow during COVID-19 pandemic conditions while considering multiple agent behaviors?
2. Materials and Methods
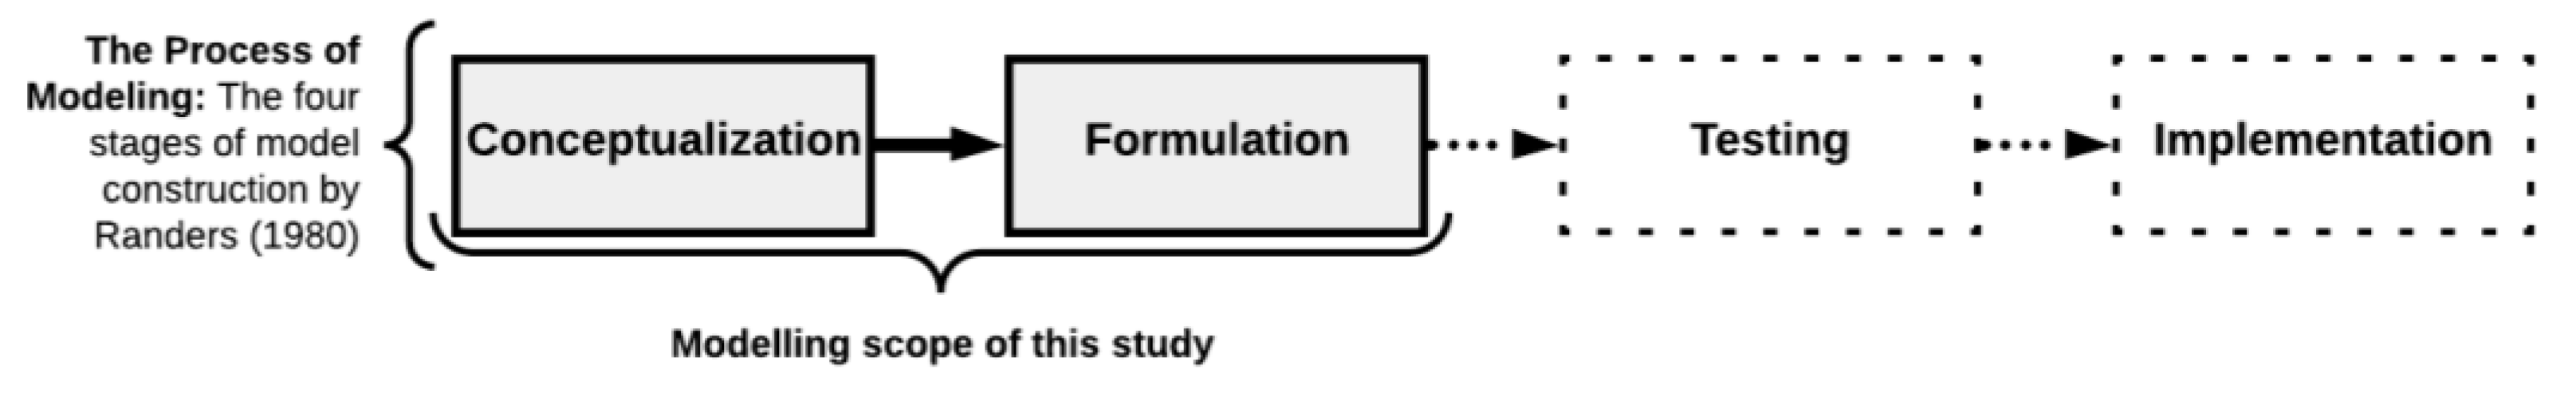
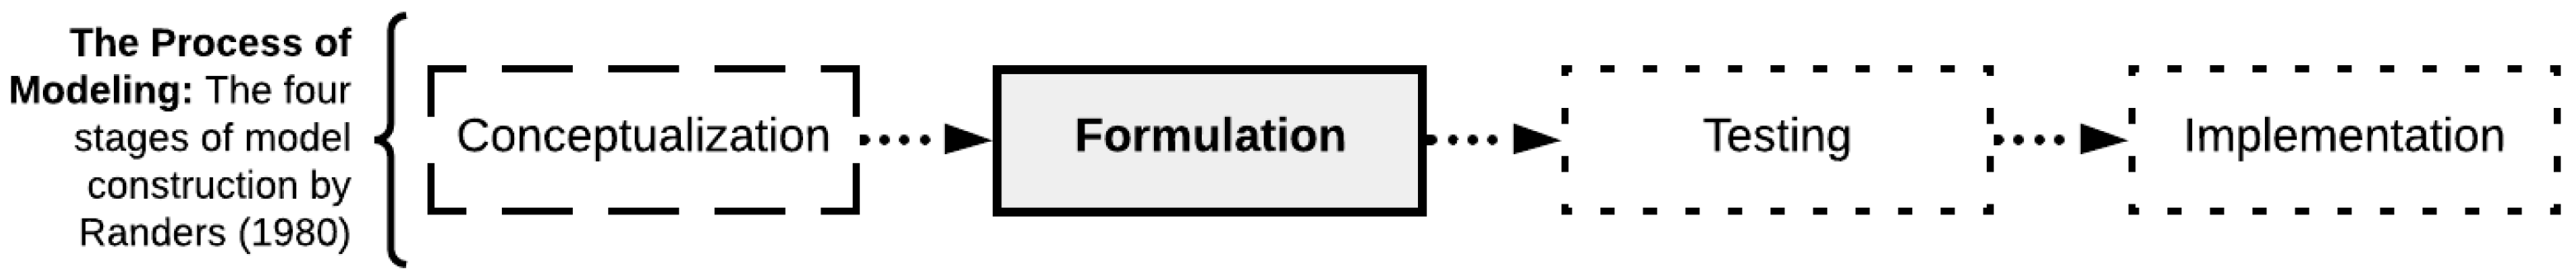
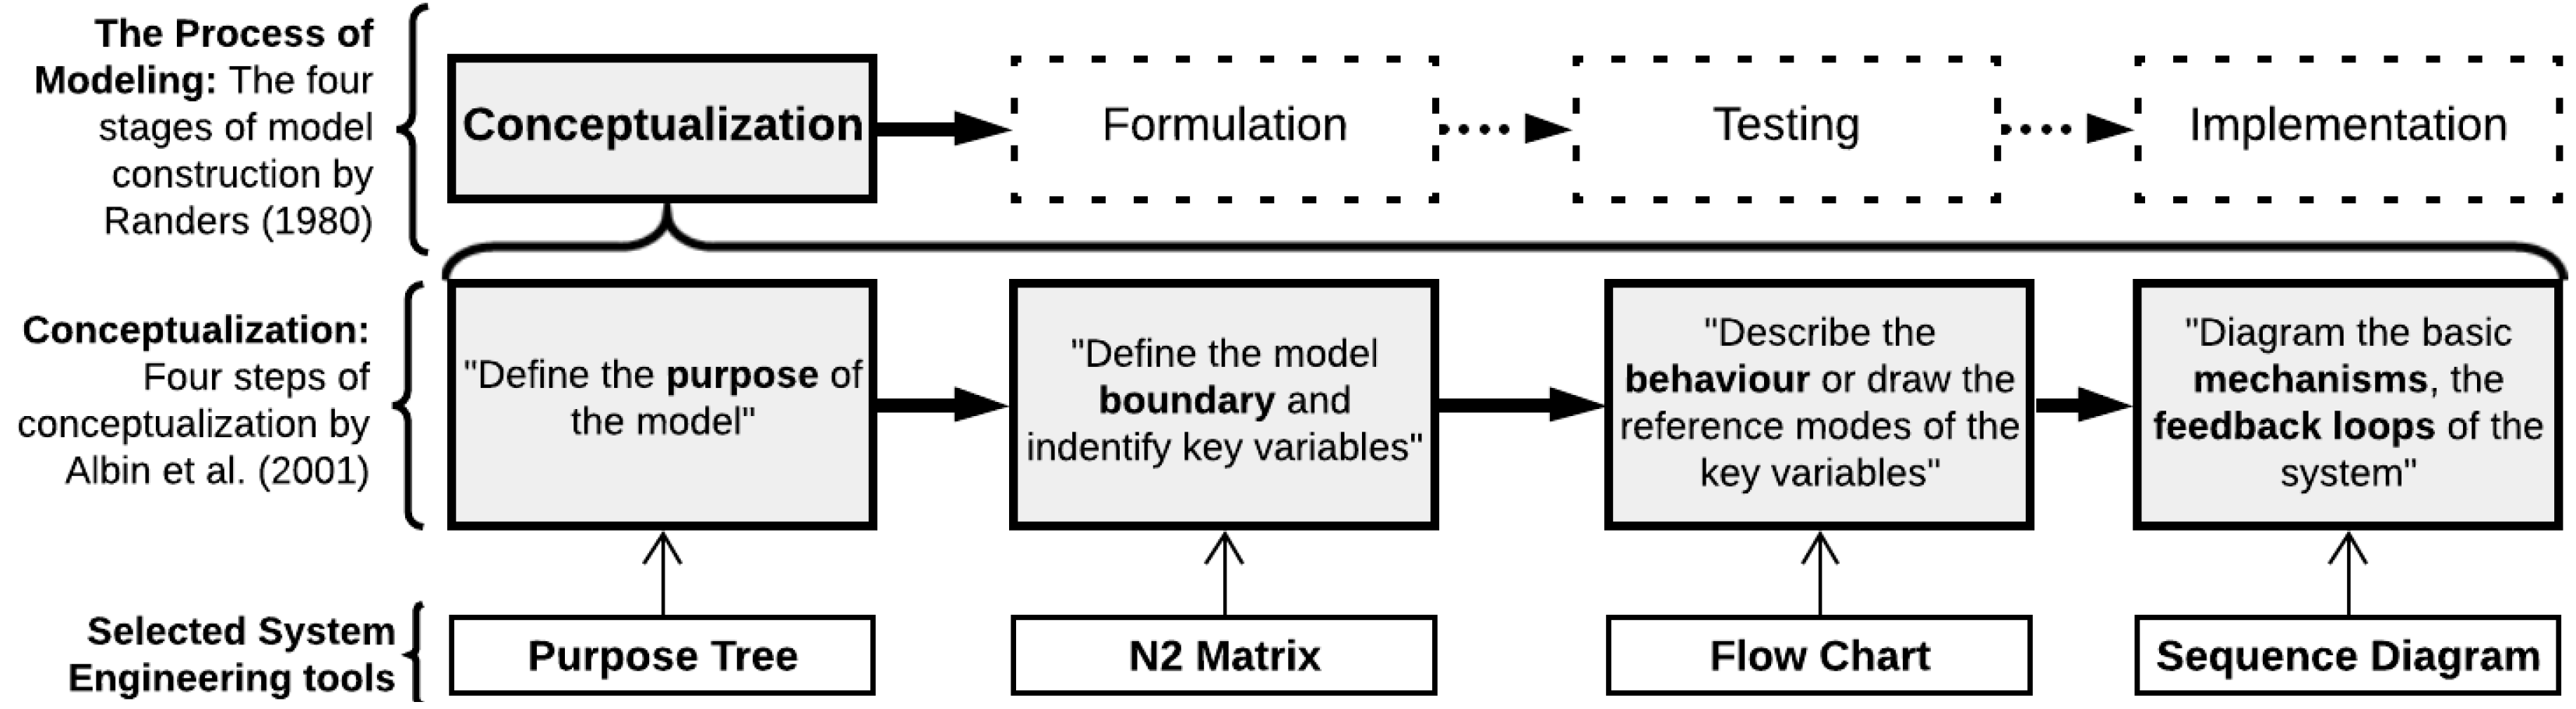
2.1. Simulation Modeling Methodology: Randers’ Model
2.1.1. Conceptual Modeling
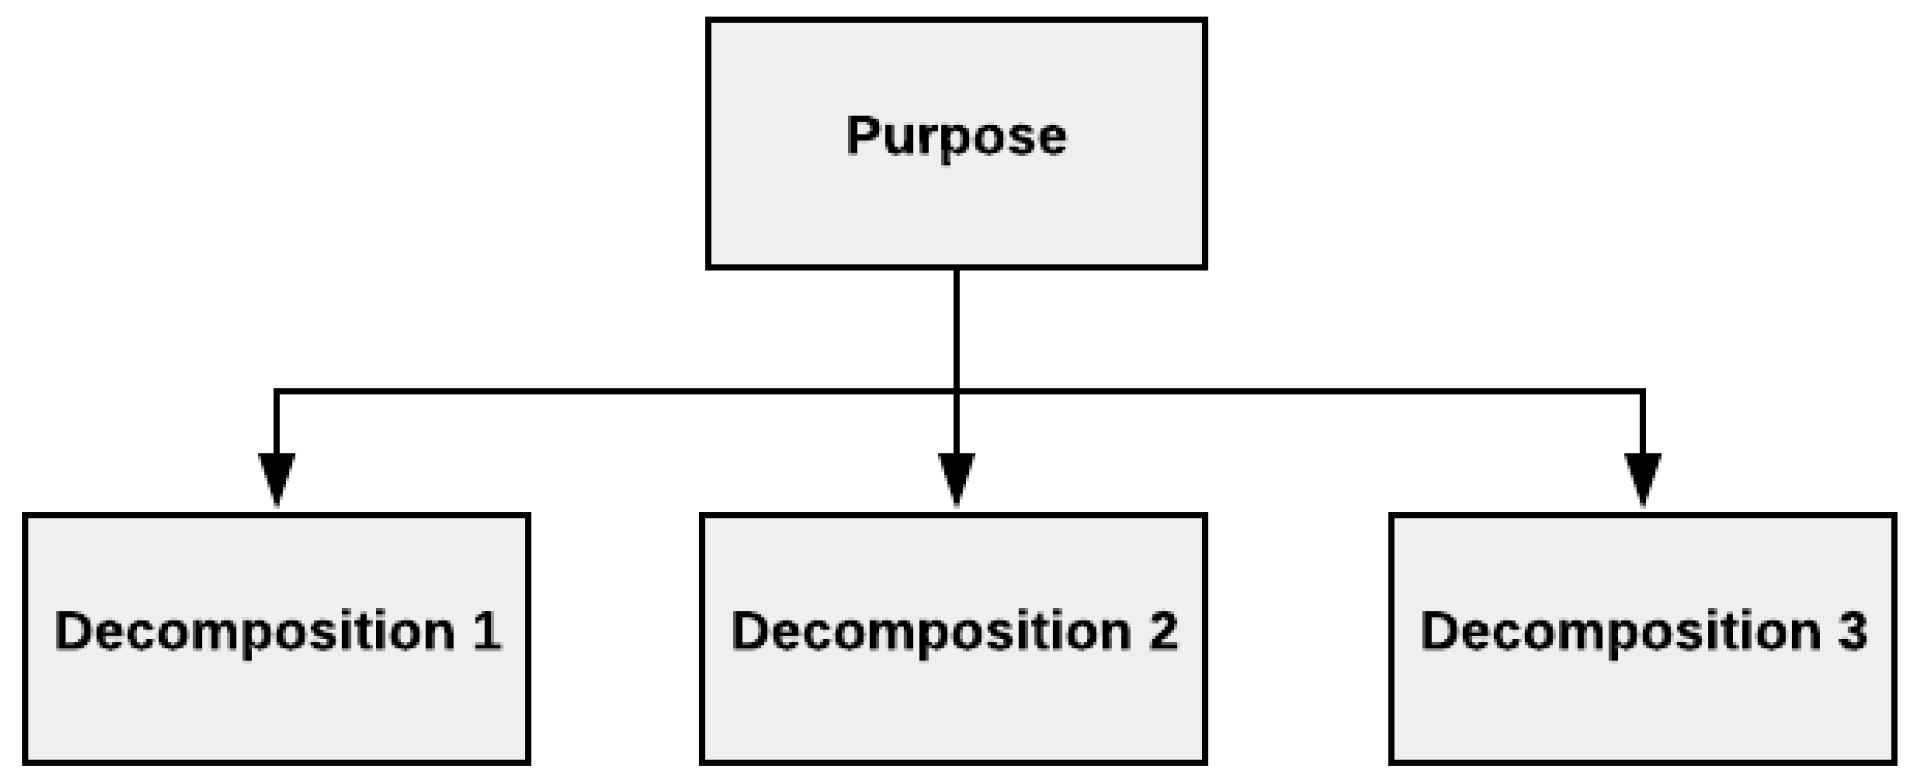
2.1.2. Purpose Tree
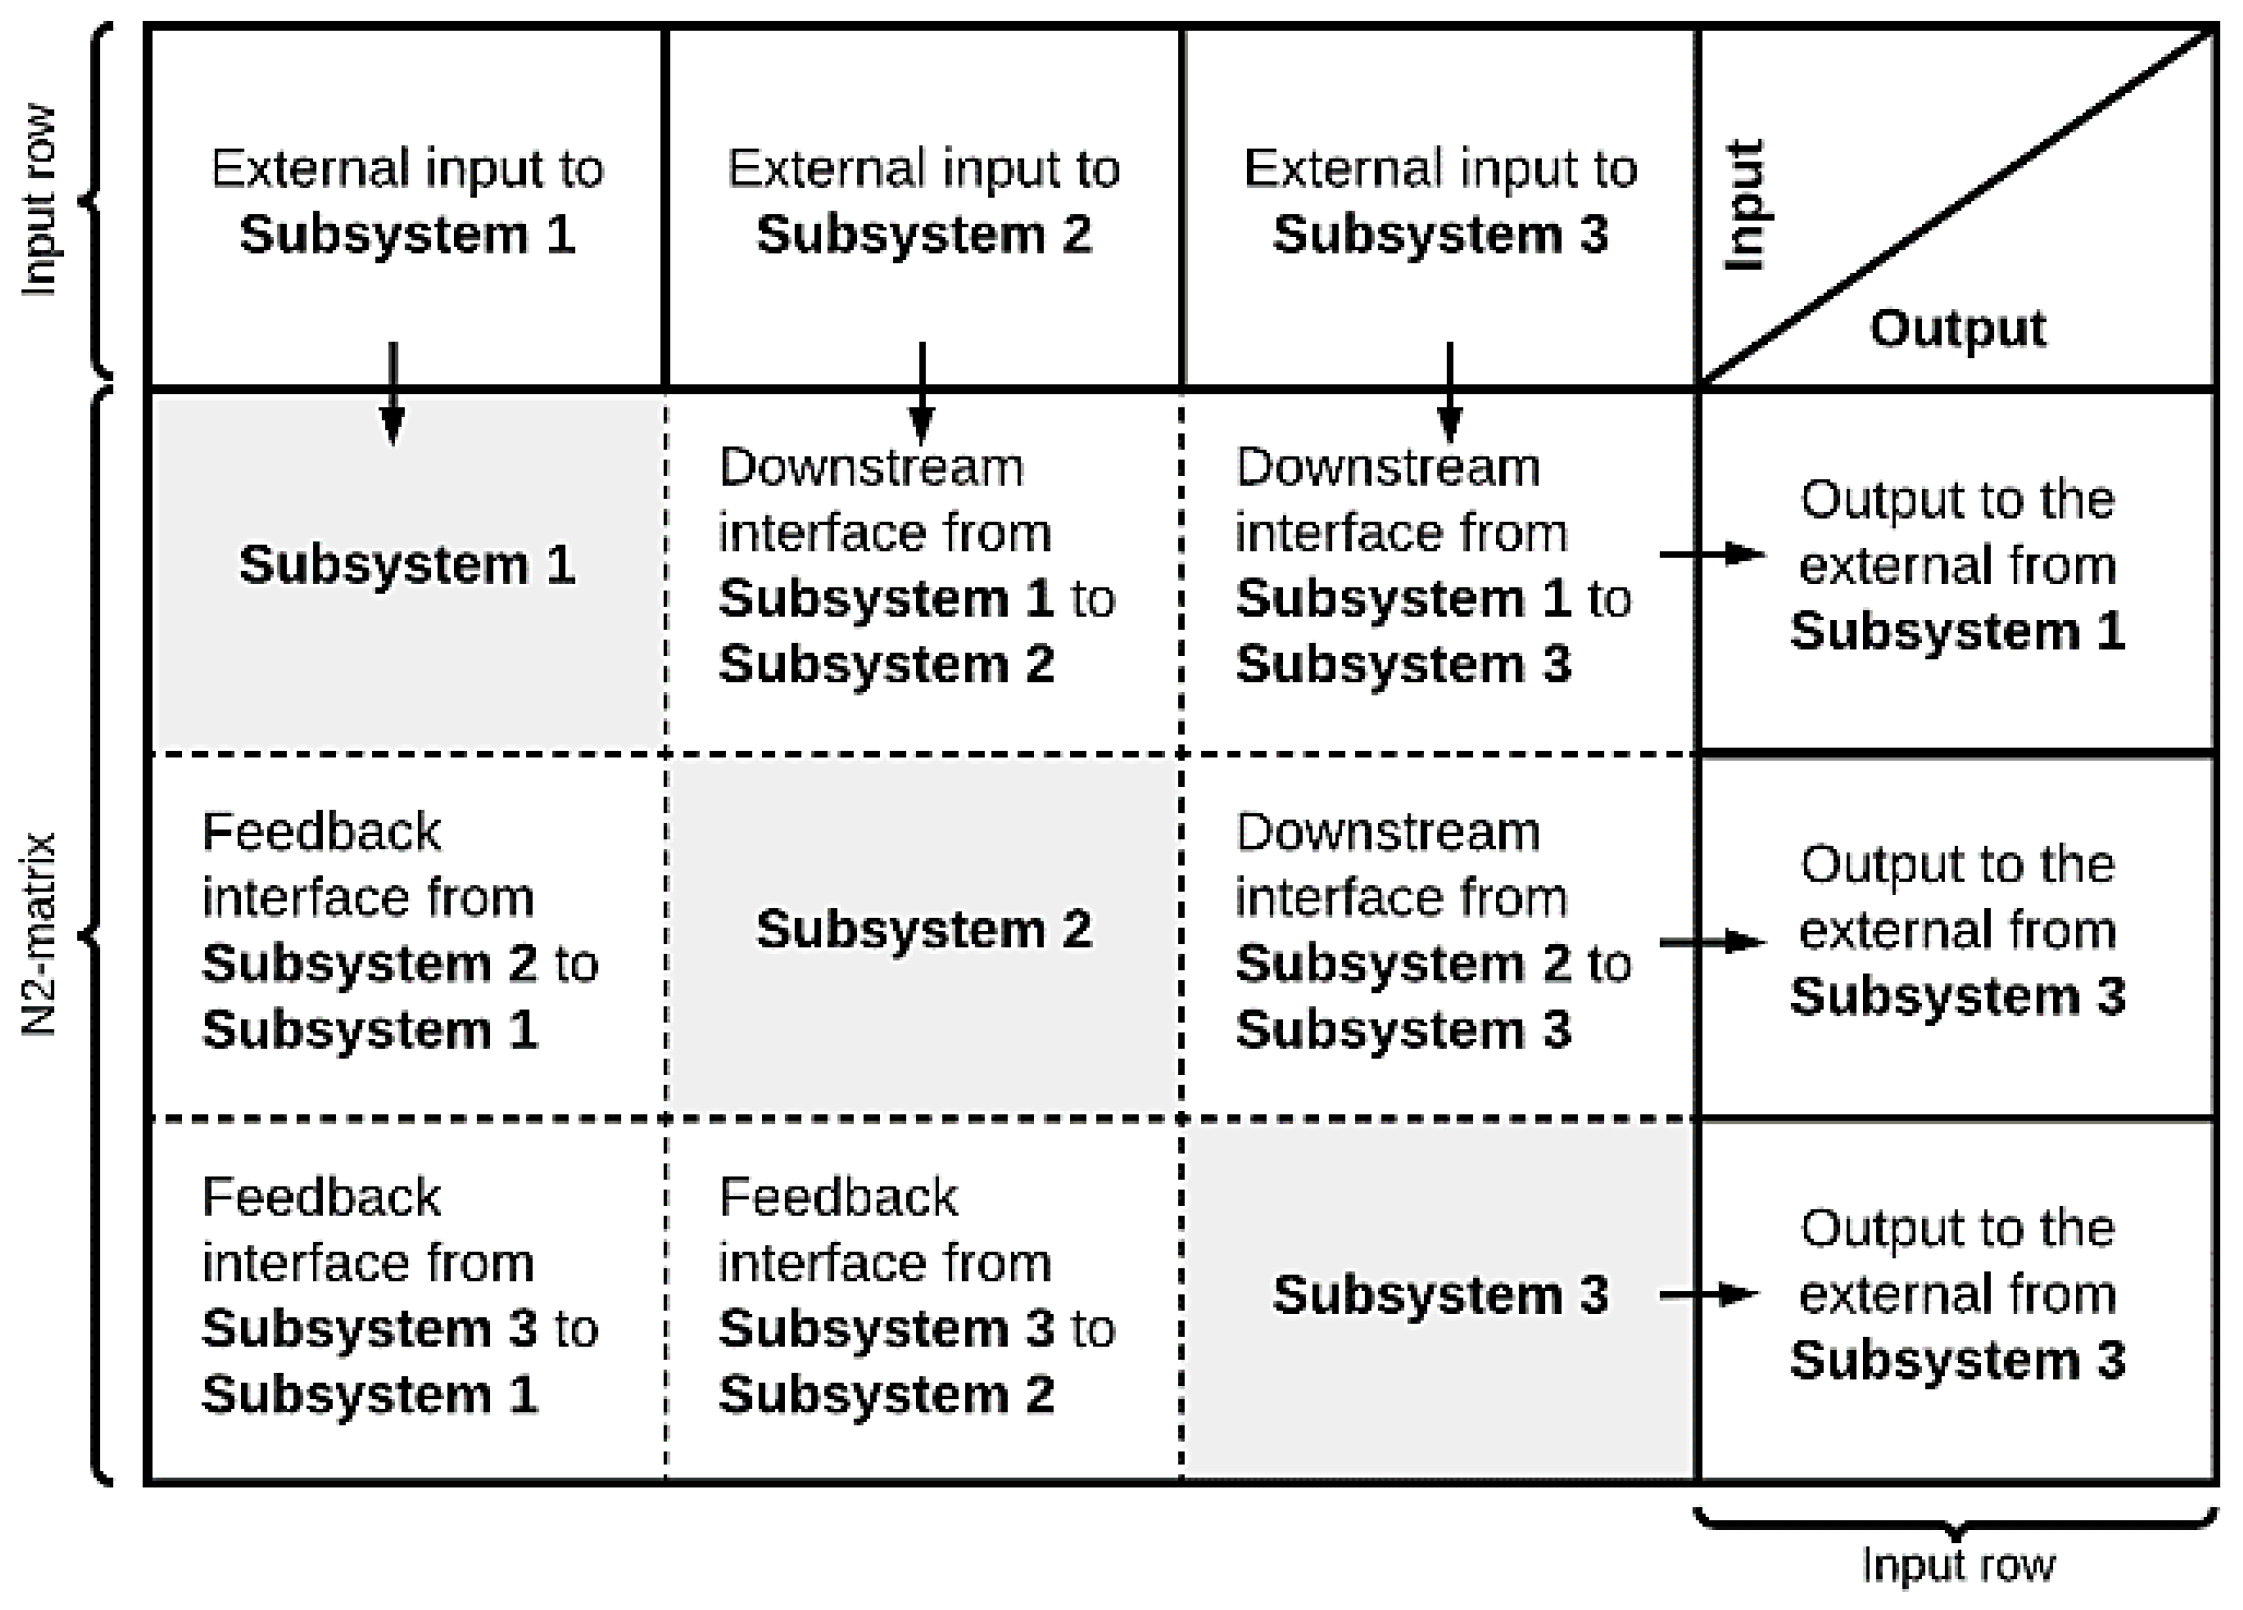
2.1.3. Interface Diagram
2.1.4. Flow Chart
2.1.5. Sequence Diagram
2.2. Computational Modeling–Hybrid Simulation Modeling
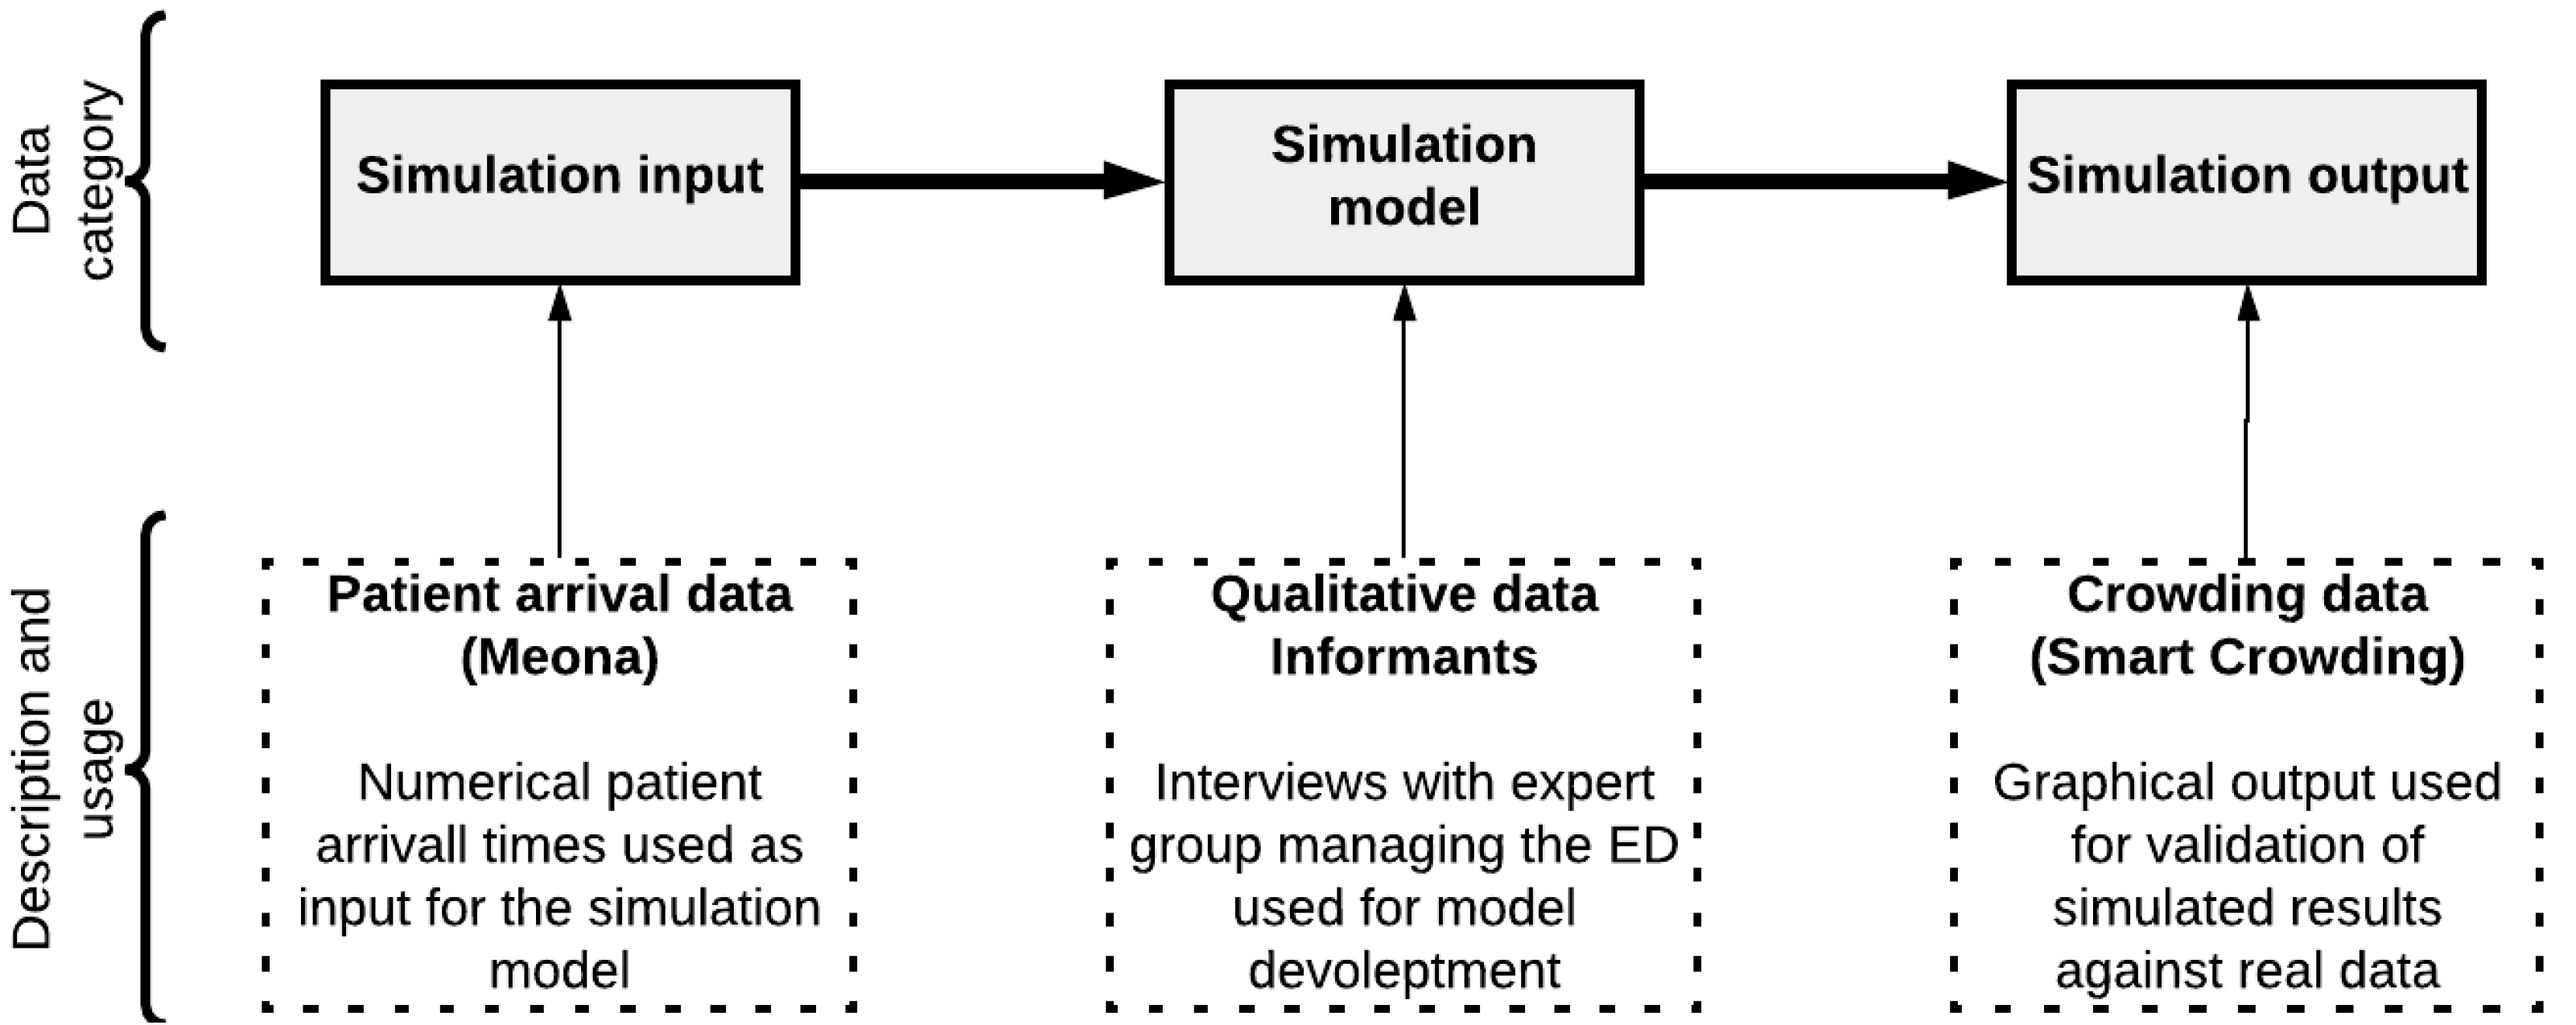
2.3. Case Study: ED of Stavanger University Hospital
- (1).
- The facility and layout to understand the capacity, routes, and waiting zones.
- (2).
- The data management systems that store and visualize the patient arrival and crowding rates, (in this case, two systems called Meona and Smart Crowding, respectively).
- (3).
- The involved experts who provided descriptions of operations, policies, and expected performance measures.
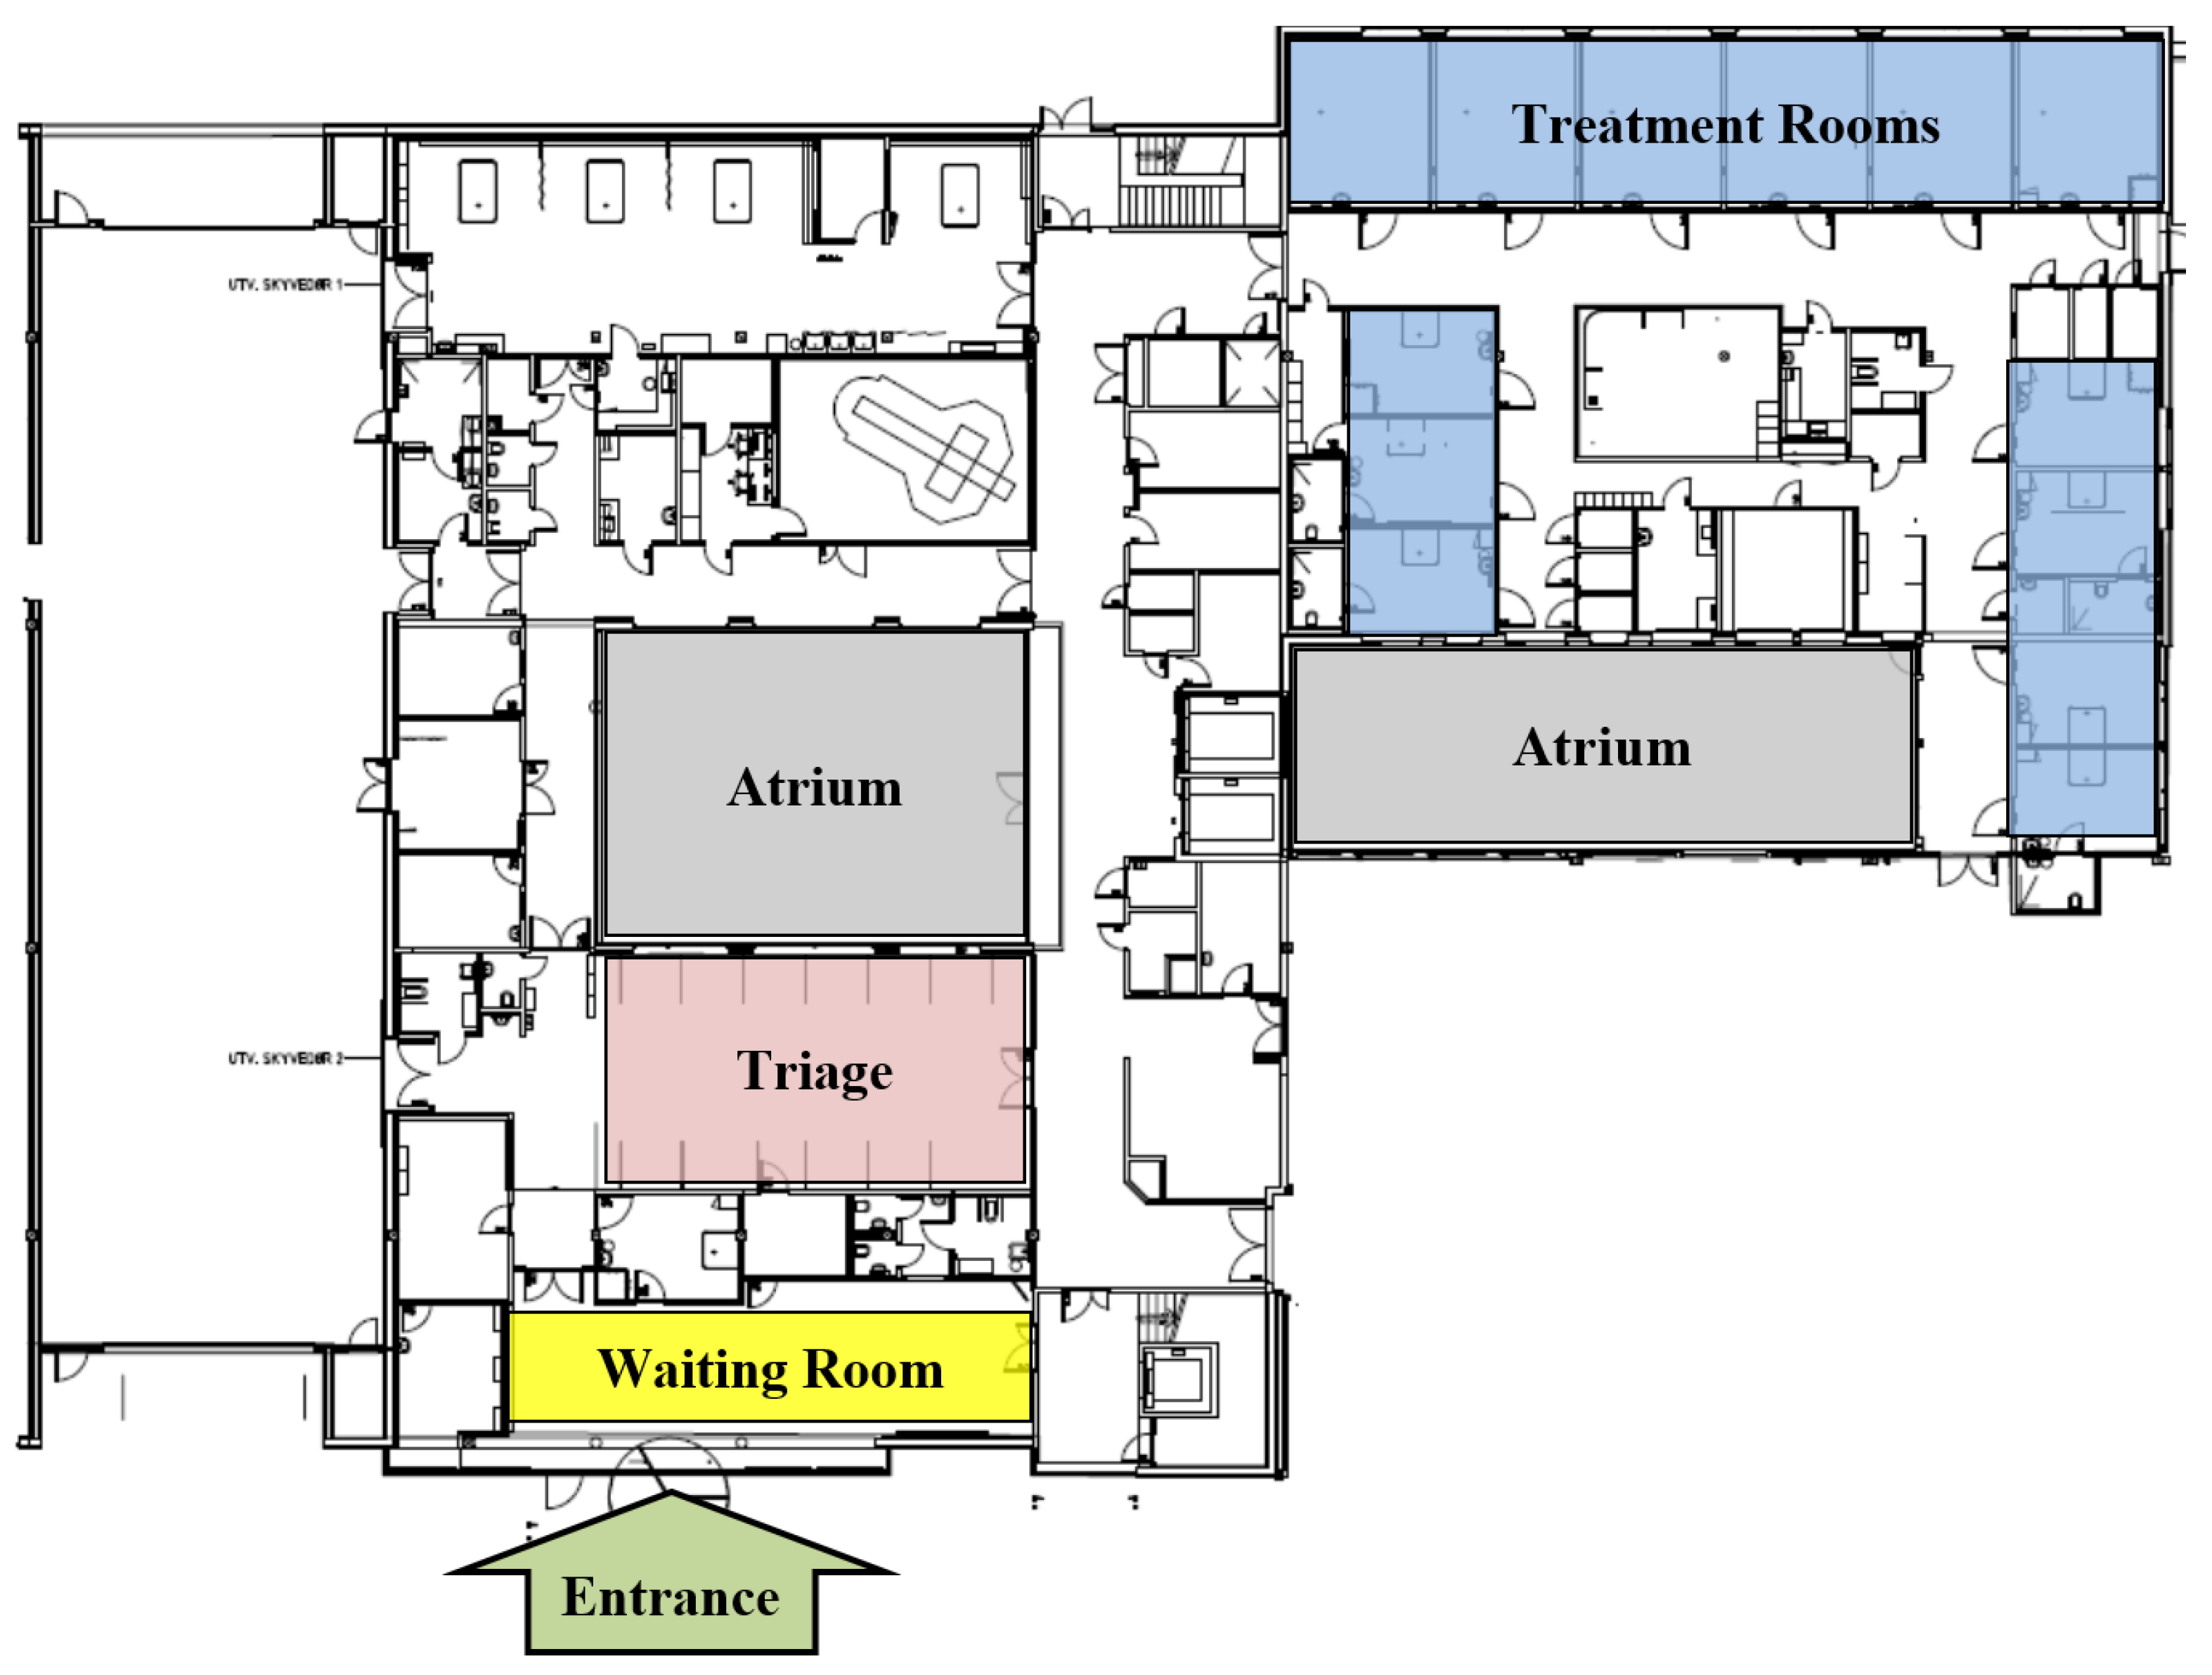
2.3.1. Facility and Layout
2.3.2. Case Data
2.3.3. Arrival and Crowding
2.3.4. Operations and Experts’ Descriptions
3. Results
- (1)
- The conceptual model that represents the real-world structure and context of the ED during both pre-pandemic and peri-pandemic status.
- (2)
- The computational model that mimics the patient flow behavior in the ED during both the pre-pandemic and peri-pandemic situations.
- (3)
- The output (the simulated behaviors) of the computational model, where both real (from the patient crowding data) and simulated behavior are compared.
3.1. Result from Conceptual Modeling of the Case
- (1)
- Definition of the model purpose and twelve performance measures that the simulation model should be able to perform.
- (2)
- Definition of model boundary and key variables, including critical interfaces between the layout agents of the ED (pre-treatment, triage, treatment rooms, waiting-zones, discharge).
- (3)
- Description of the system behavior, including interactions between patient agents (ordinary and contaminated patient) and layout agents to describe the room seizing/releasing process, and
- (4)
- Description of the basic mechanisms of the system.
3.1.1. Step 1—Definition of the Purpose of the Model
Implementation of the Patient Flow Key Performance Indicators
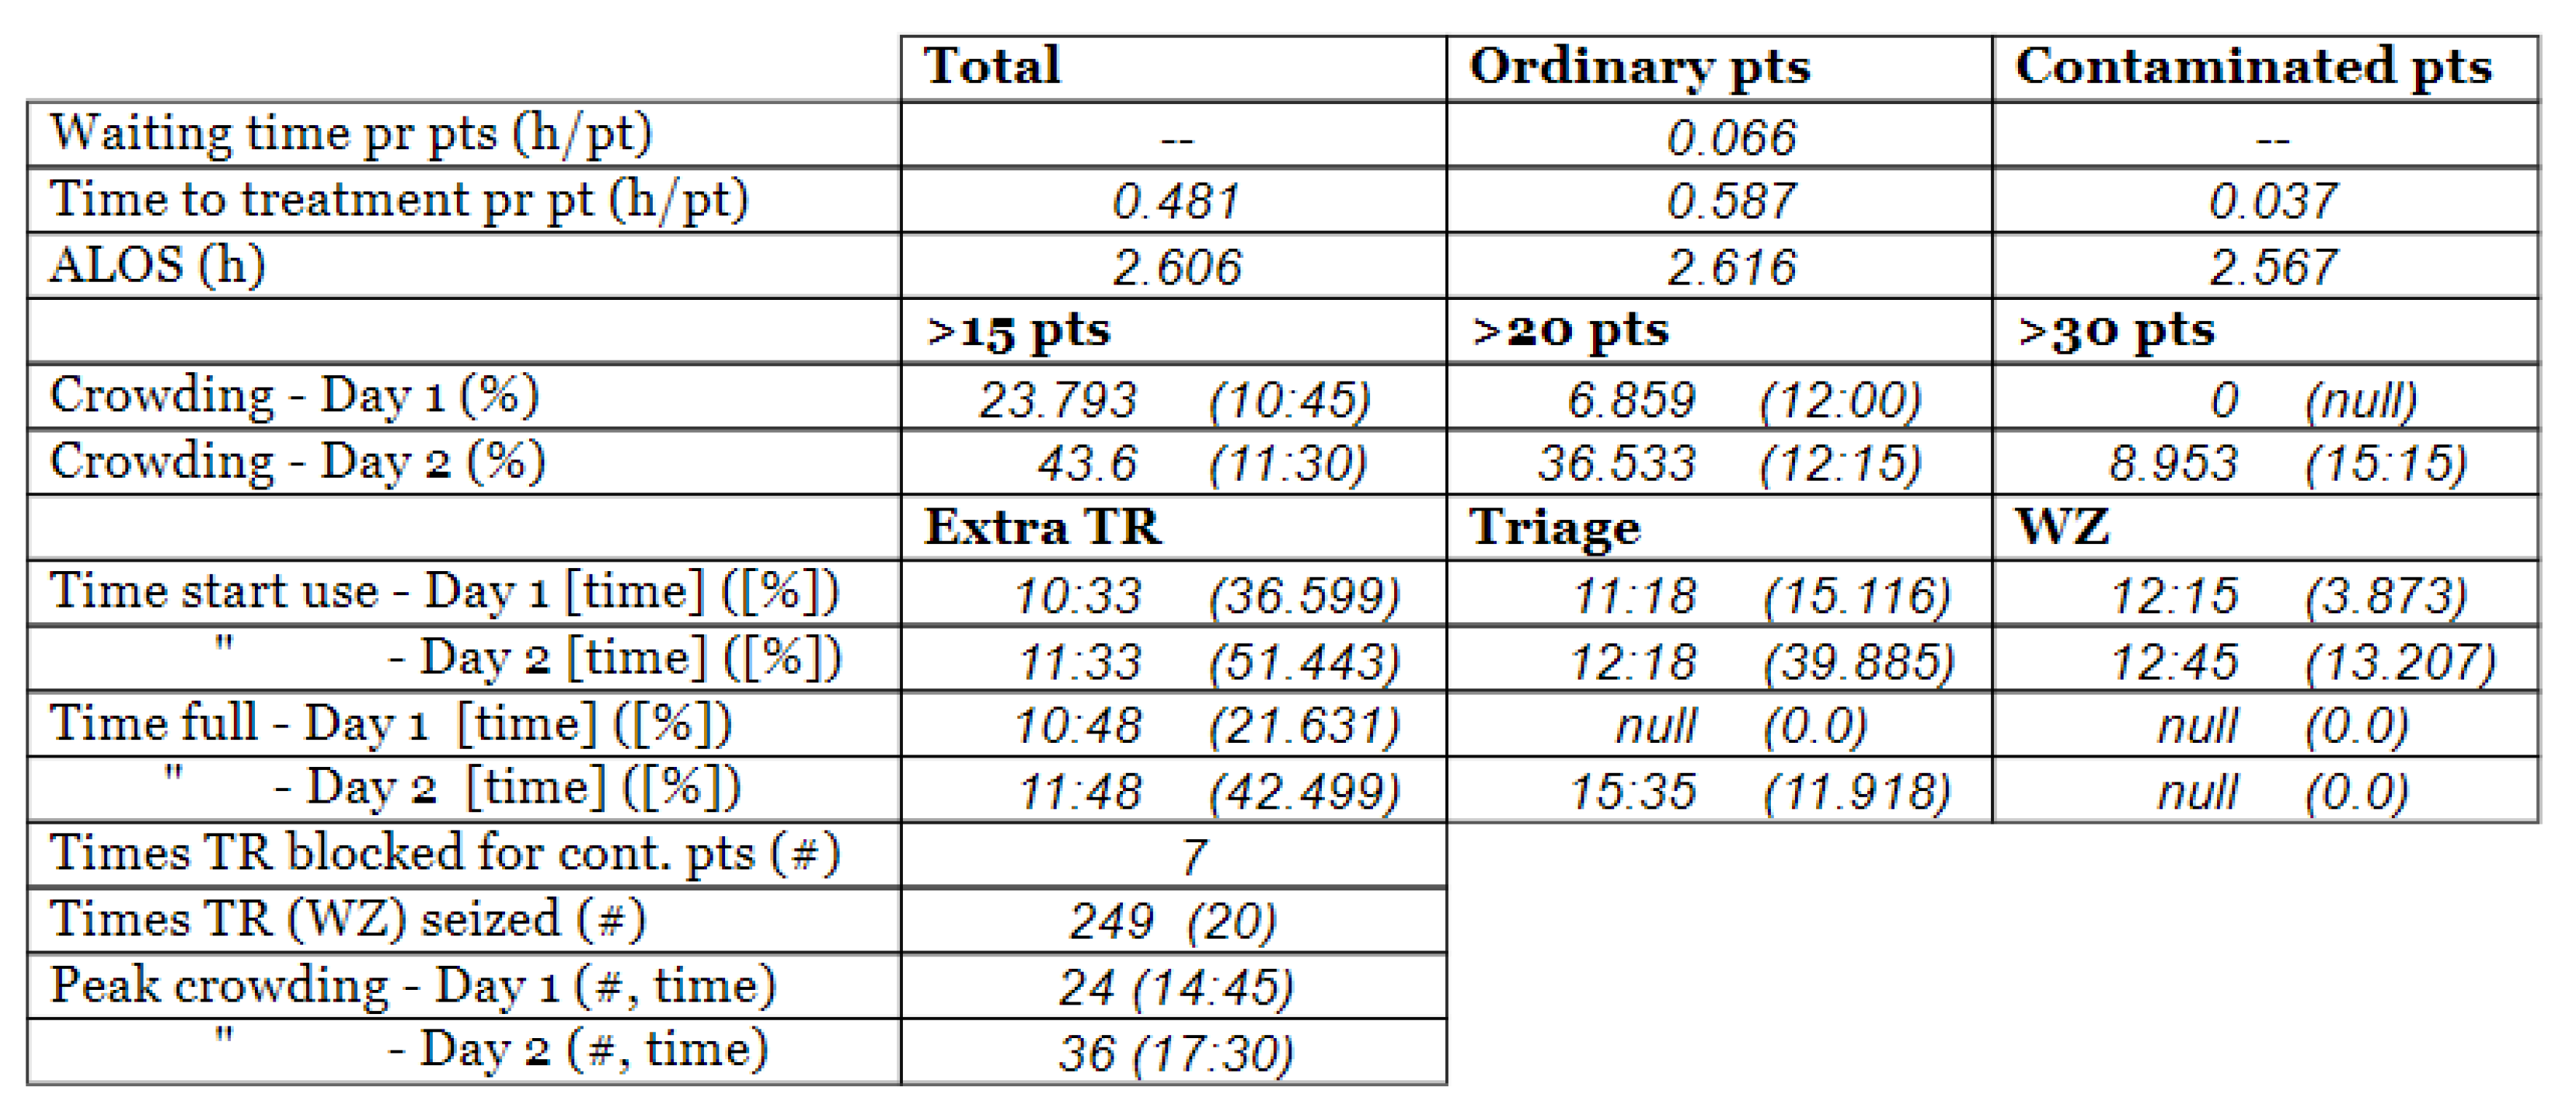
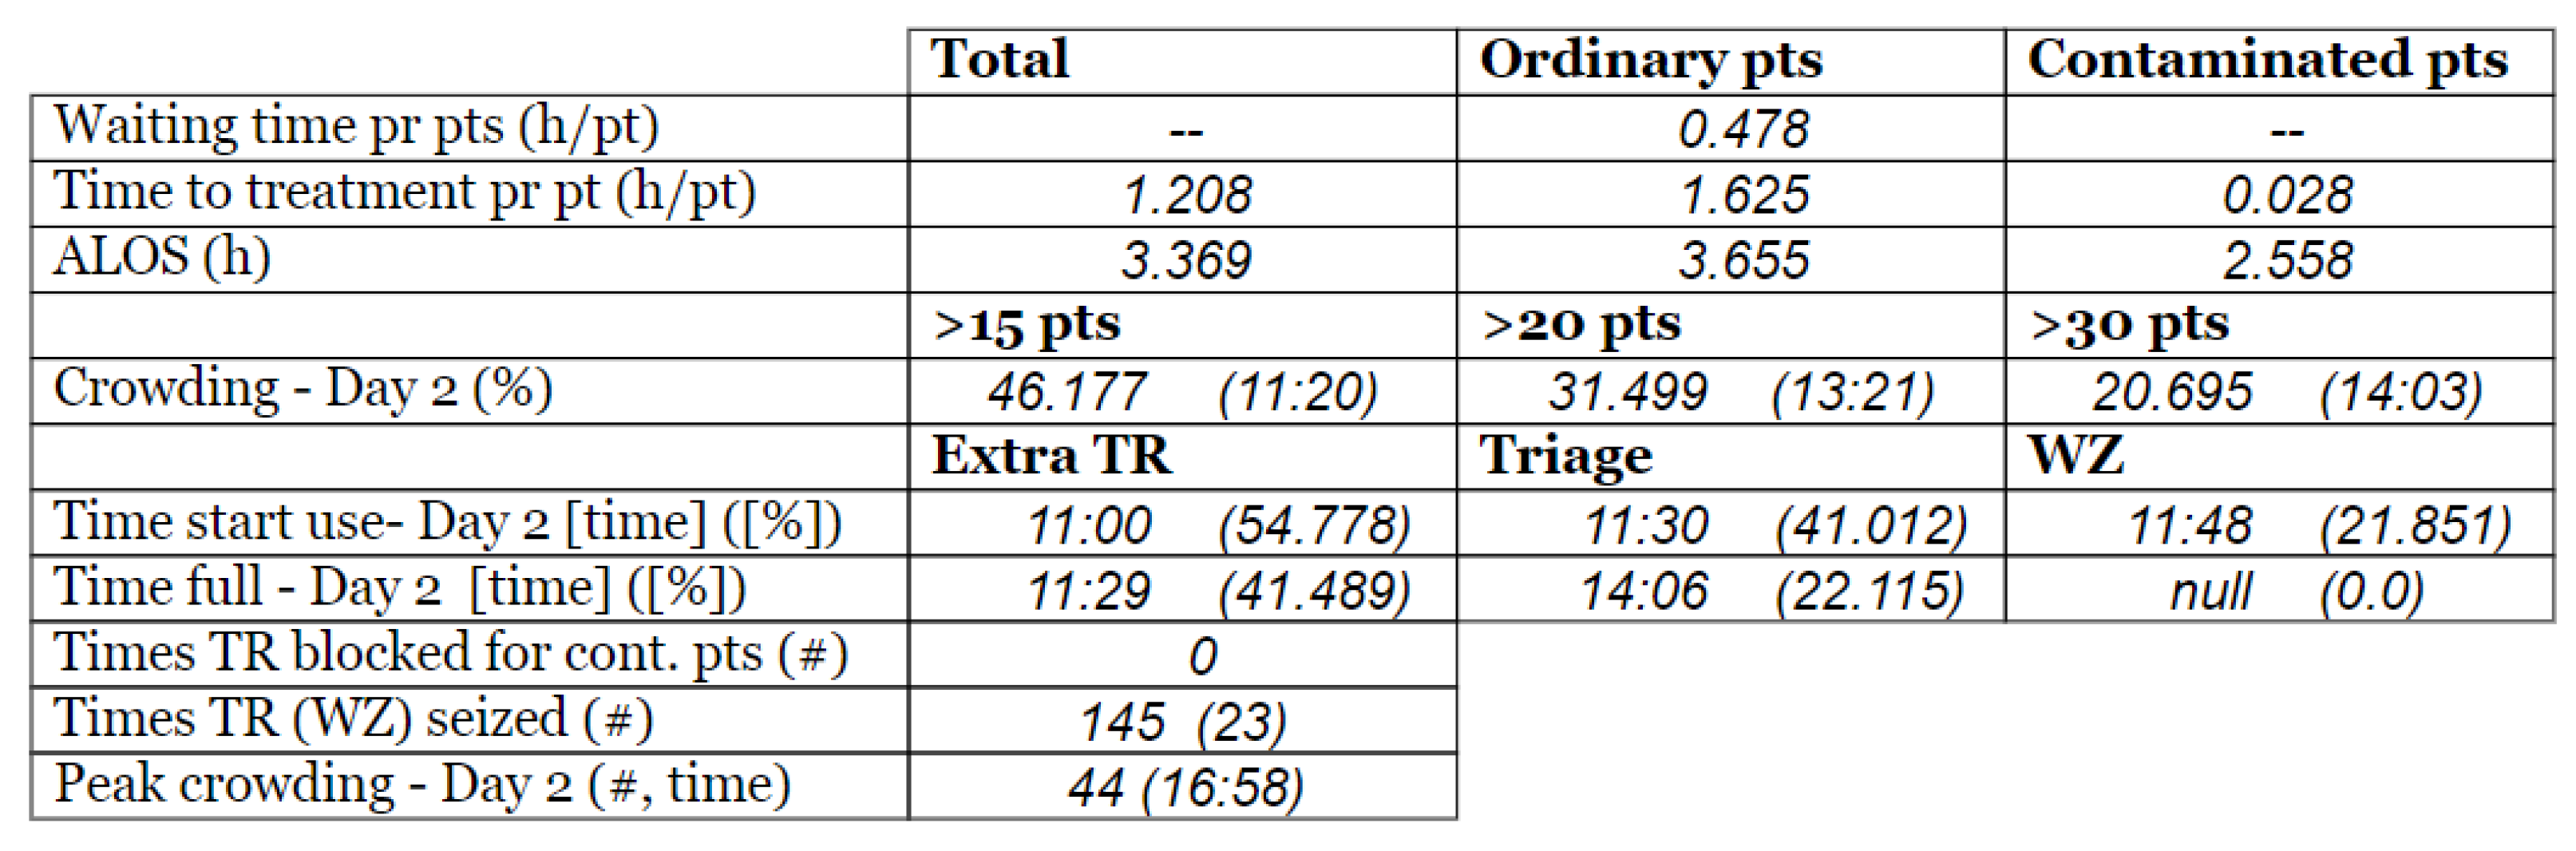
- Time to treatment (TTT) [h/pt]: This KPI tracks the time spent on all the activities prior to the treatment. Then, it is calculated as an average. TTT is calculated for all the patients (Tot.), the patients that are suspected to be pathogen contagious (Cont.), and the patients that are found likely not to be pathogen carrying (Ord.).
- 2.
- The average length of stay (ALOS) [h/pt]: This calculates the average time the patients spend in the ED. This measure can also be calculated individually for the different patient populations.
- 3.
- Crowding [%]: Crowding is defined as the number of patients simultaneously staying within the ED facility, i.e., prevalence. This measure tracks how long the crowding in the ED is above certain predefined levels and divides it by the total amount of time passed. The crowding levels are selected according to the case organization’s plan for high activity, 15, 20, and 30.
- 4.
- Peak crowding: This measure is intended to present information on how many patients are present at the peak of the day.
- 5.
- Time of peak [time]: This measure states records at which the previously mentioned peak of crowding occurs.
- 6.
- Time start use [time]: This measure keeps track of when the different resources start being used within the ED. Measures were chosen to be tracking the use of the extra treatment rooms (E.Tr.), triage (Tri.), and the waiting zone (WZ).
- 7.
- Time in use [%]. This estimates the amount of time the resources are used as a proportion of the total time simulated. Equation (5) shows the calculation for the extra treatment rooms (E.Tr.).
- 8.
- Time full [time]: Similar to the “time start use”, this measure keeps track of when the resource first reached its full capacity (i.e., there was no more left of the resource for a new patient for the first time).
- 9.
- Waiting time pr pts [h/pt]: This measure calculates the average waiting time in WR across the different patient agent groups.
- 10.
- Times TR blocked for contaminated patients [#]: This measure keeps track of the number of times a patient with virus suspicion is blocked from going directly to a treatment room after undergoing the pre-triage screening. Such a blockage occurs under the following conditions: (1) all the ordinary and all the extra treatment rooms are fully utilized, and (2) no ordinary patients can leave their treatment room, either due to the lack of a waiting zone available or because none of the patients currently in the treatment rooms have stayed their minimum amount of time in their treatment rooms. Therefore, this measure is critical, because if this condition occurs, it means that a potentially contaminated patient has to wait, which poses an increased risk of contamination.
- 11.
- Times TR (WZ) seized [#]: Similar to the previous, this one is a pure counter. This measure counts the number of times a treatment room (or waiting zone) is seized by a patient agent. The main reason for keeping track of this is that seizing rooms is work intensive. Rooms need to be set up and sanitized and thus constitute an economic and resource burden both directly and indirectly. Additionally, besides the pure labor aspect, the management of seizing and releasing may cause an error and be costly. In addition, having patients leave their rooms might be a high cost for the individual patients, as this might yield stress and other discomforts for the patient.
3.1.2. Step 2—Definition of Model Boundary and Key Variables
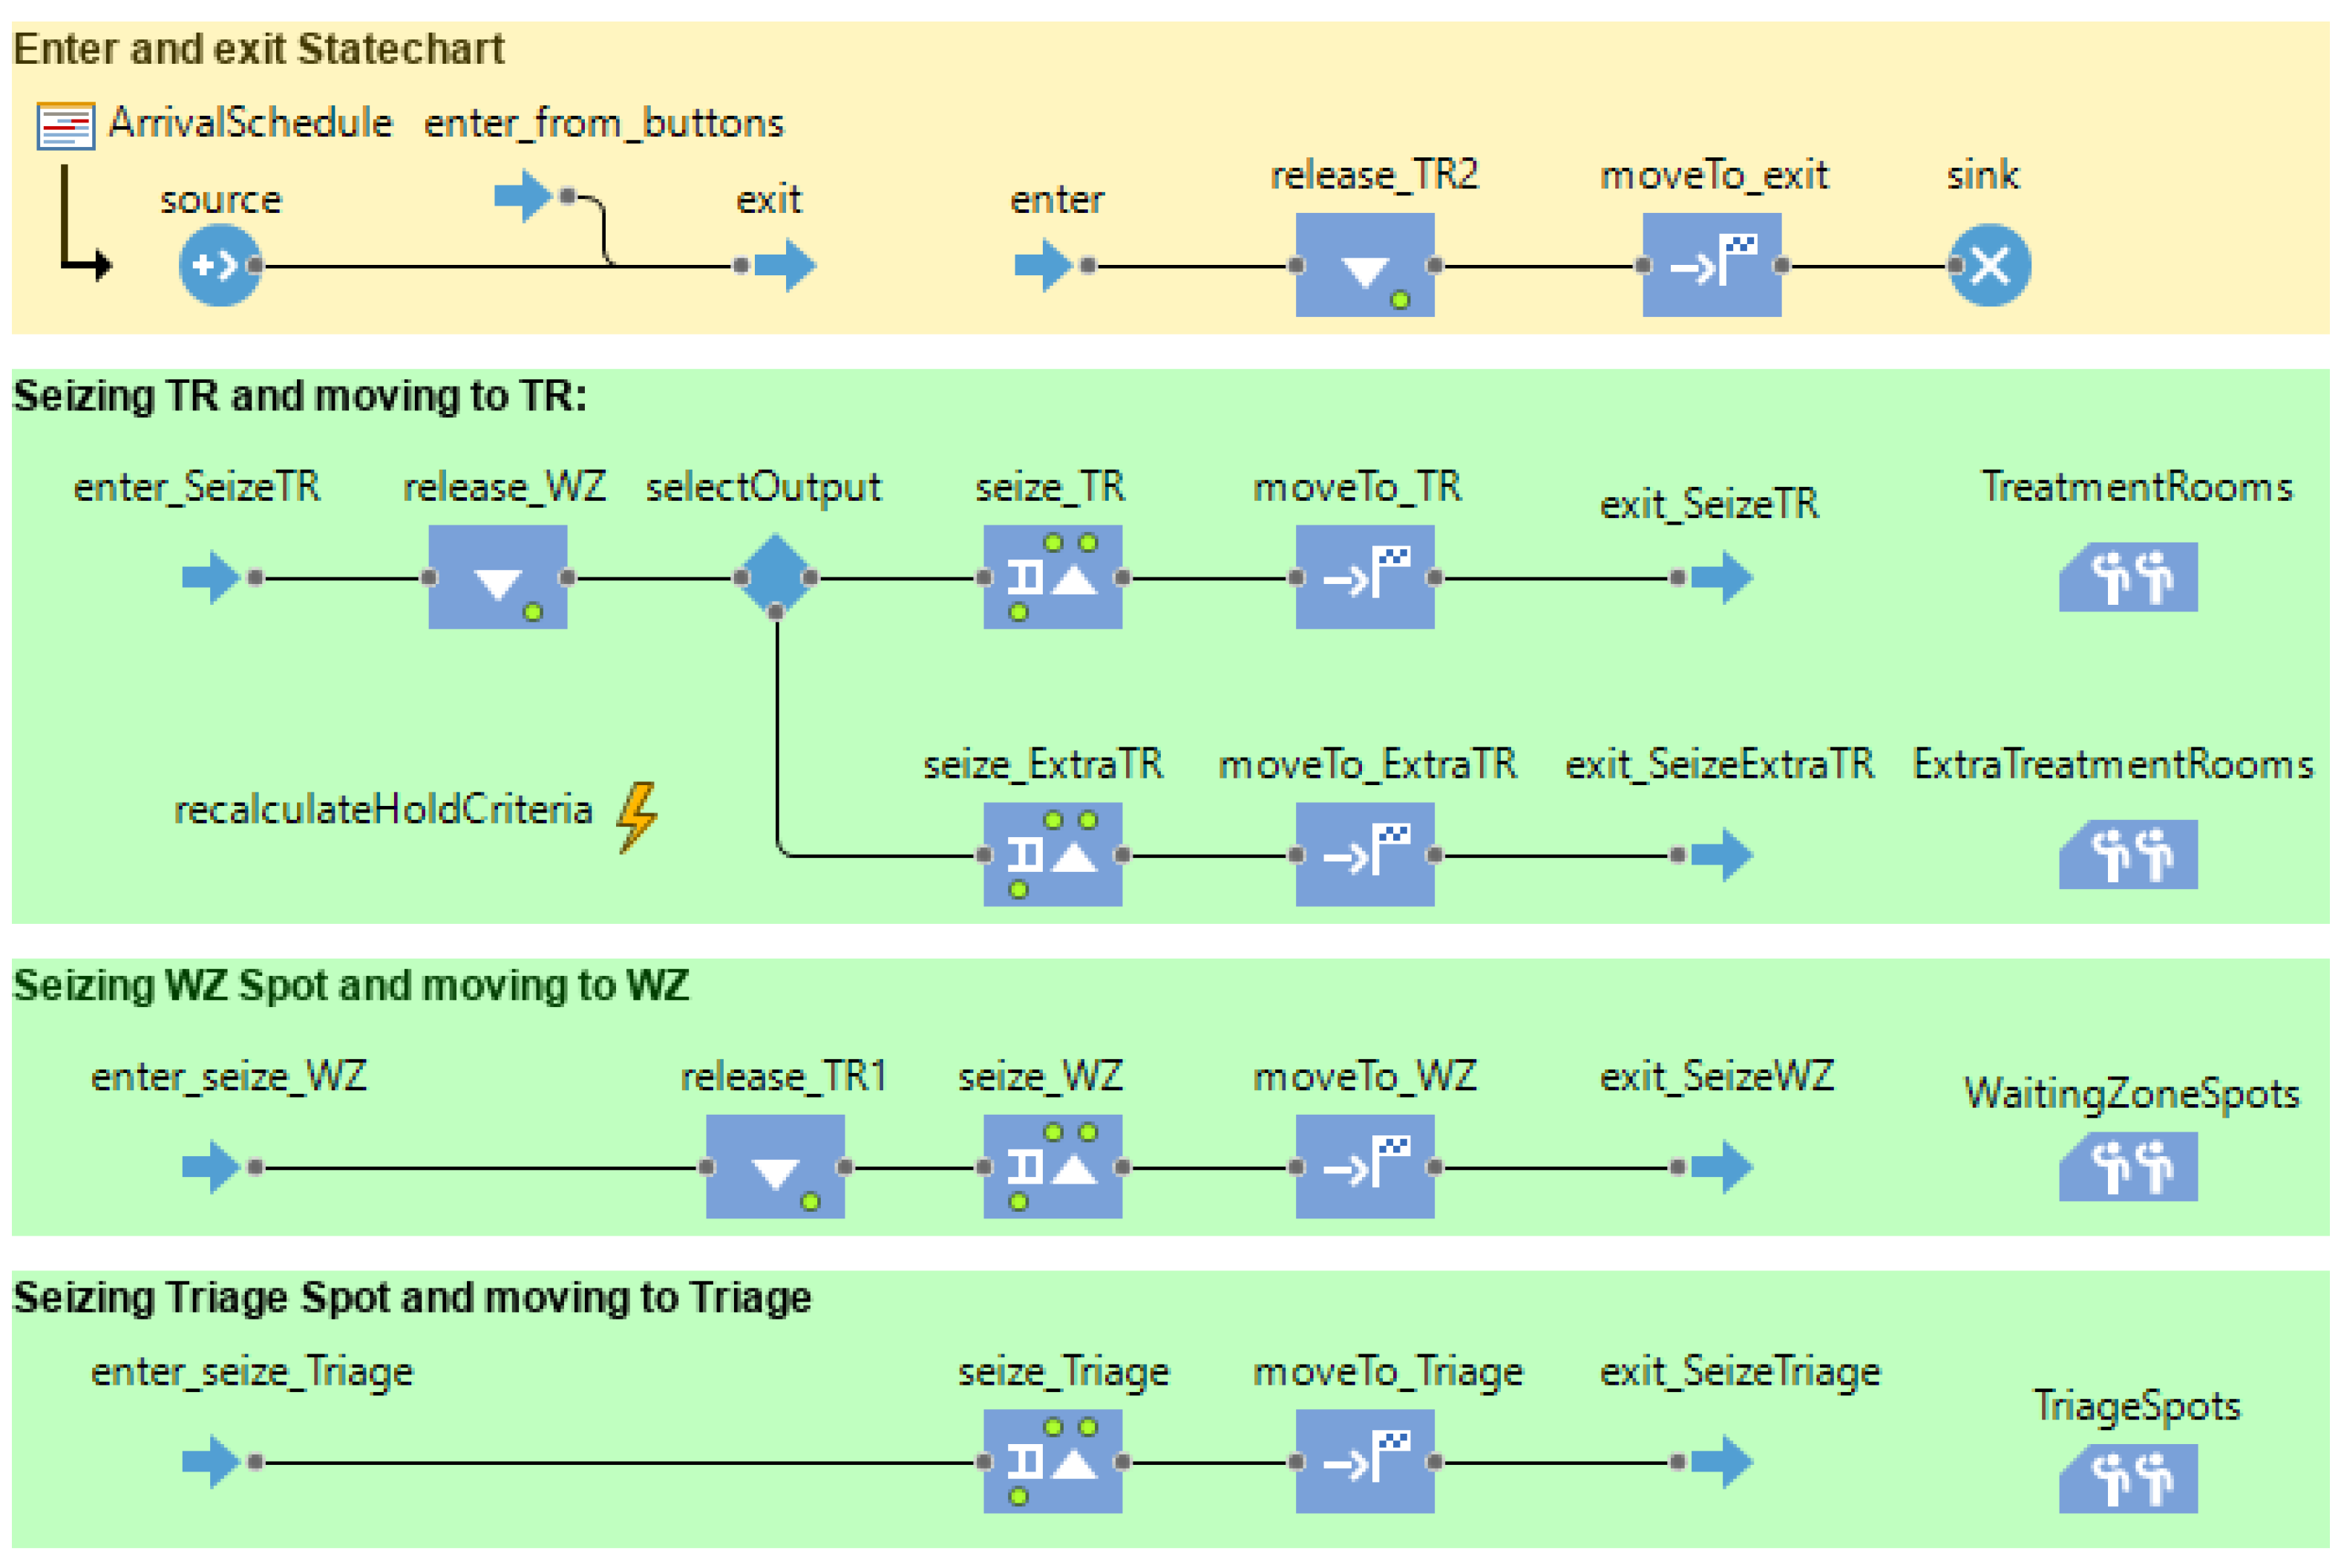
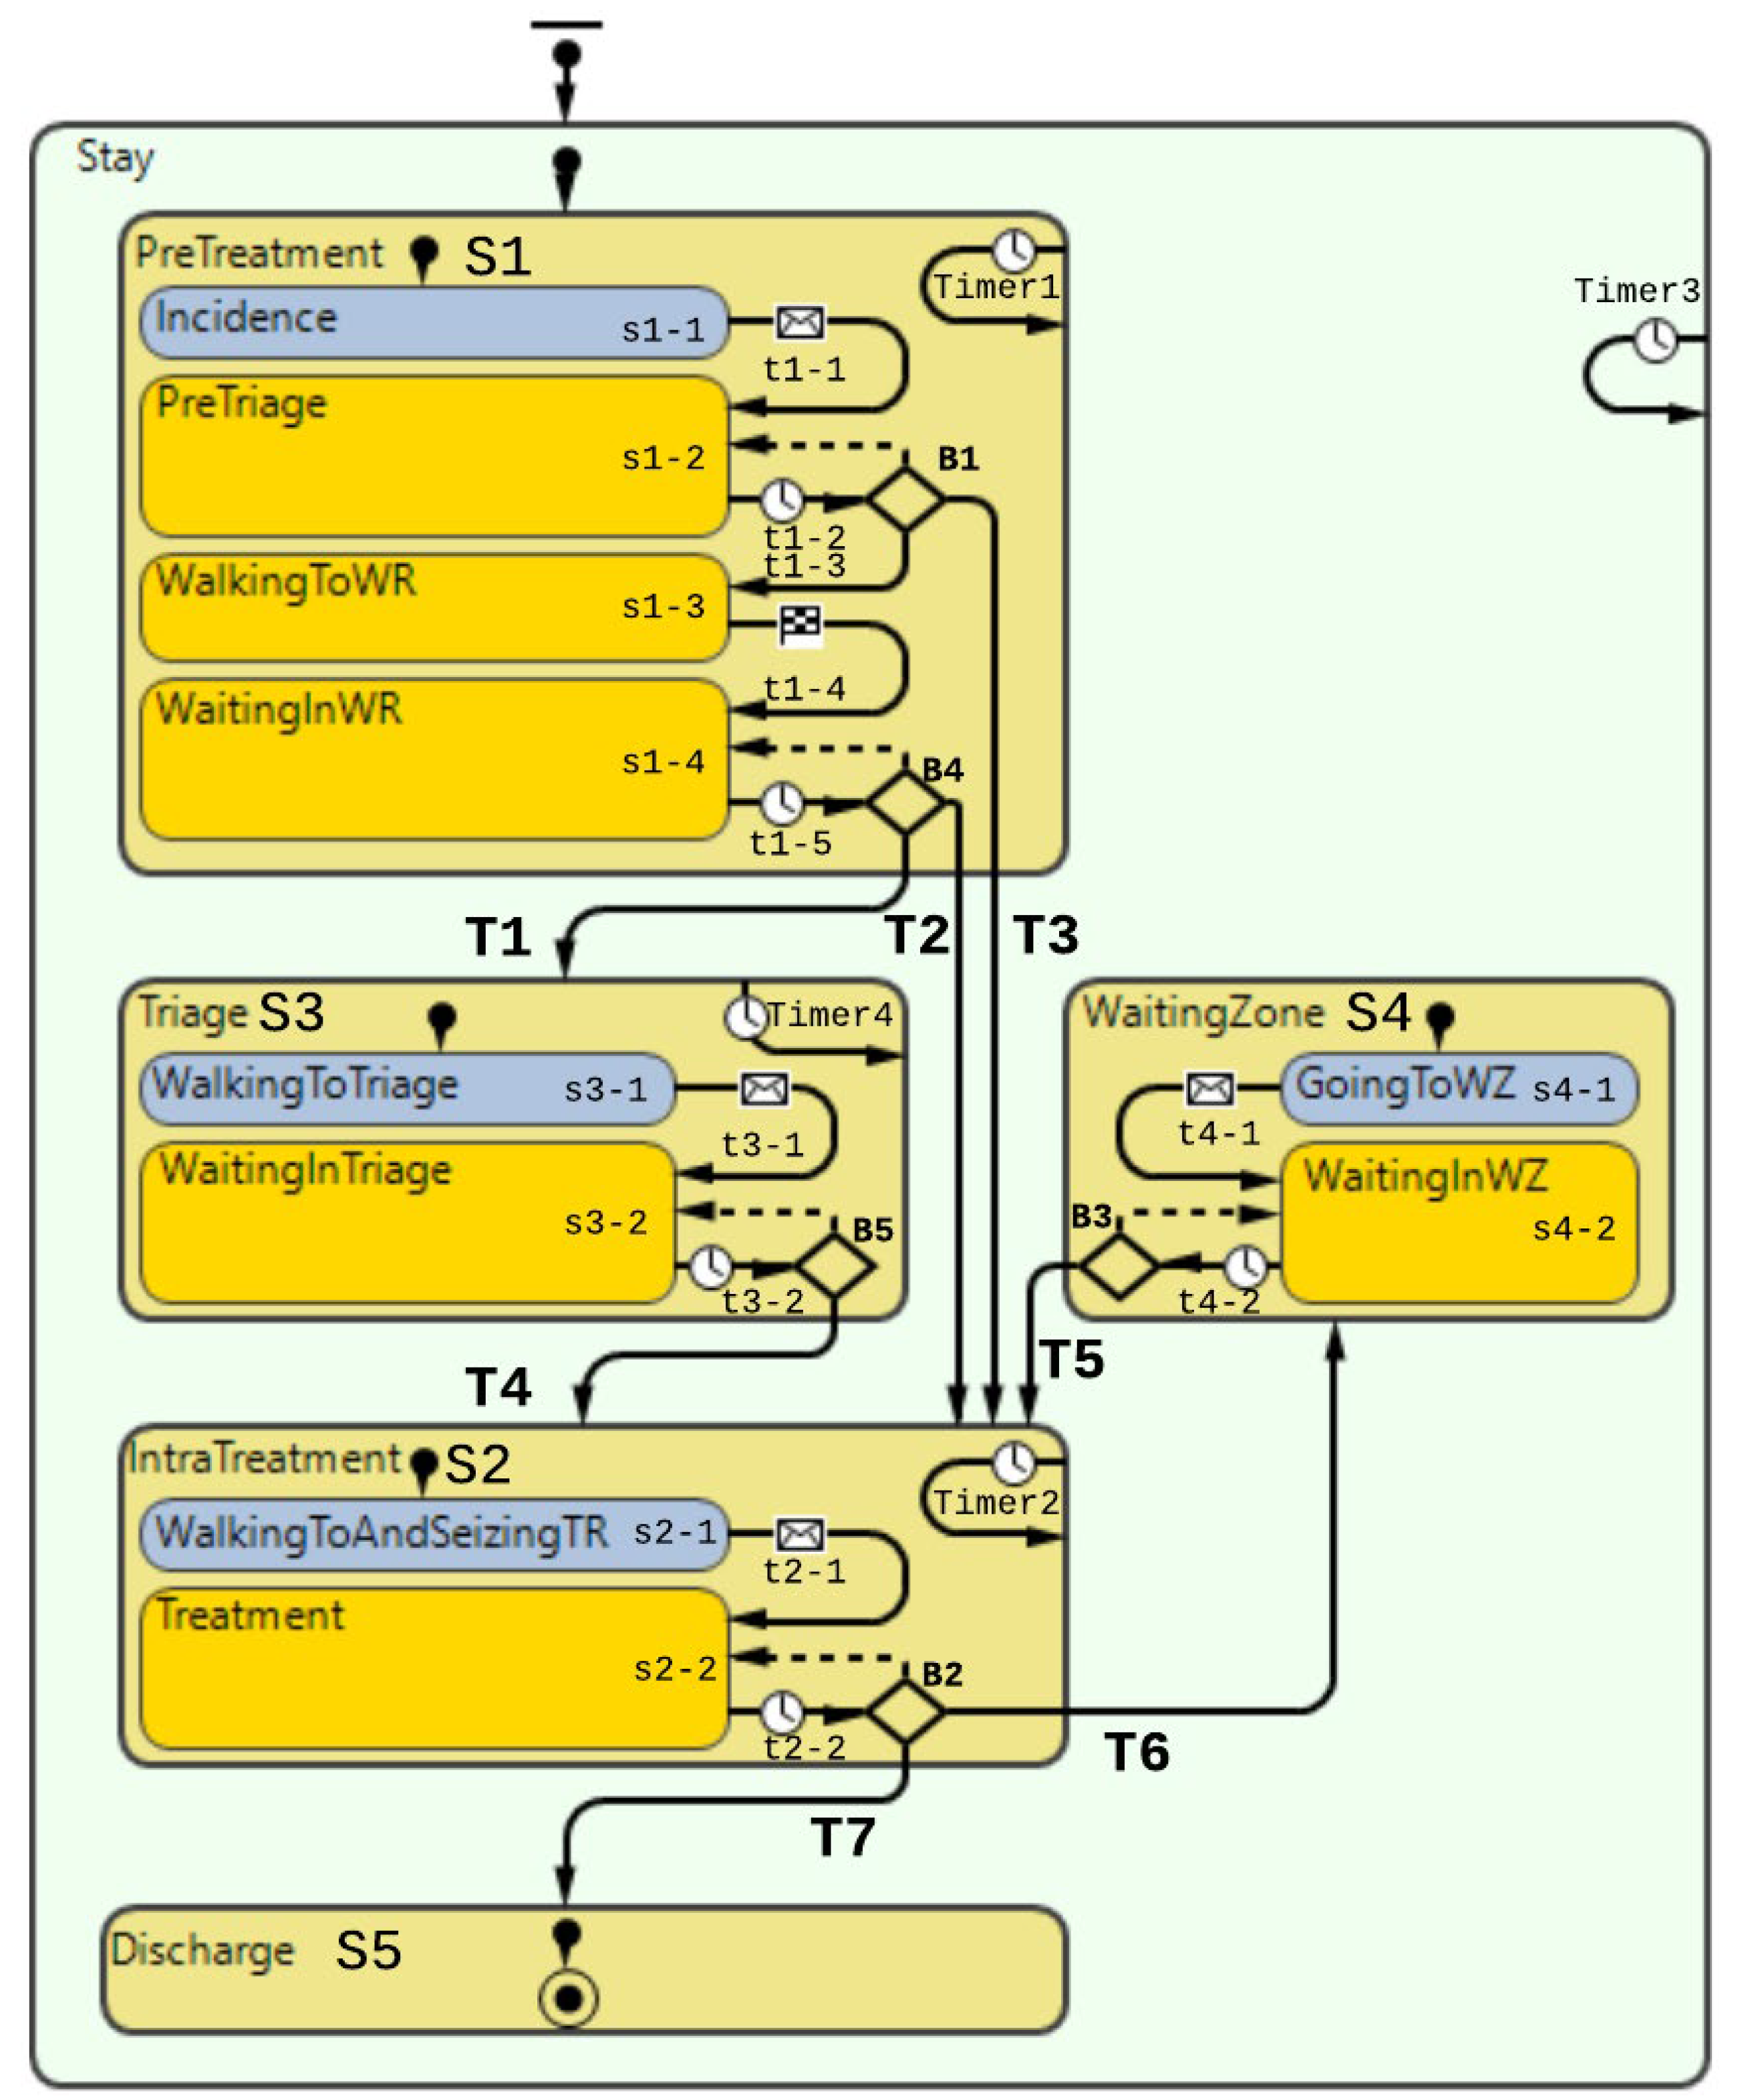
3.1.3. Step 3—Description of the System Behavior
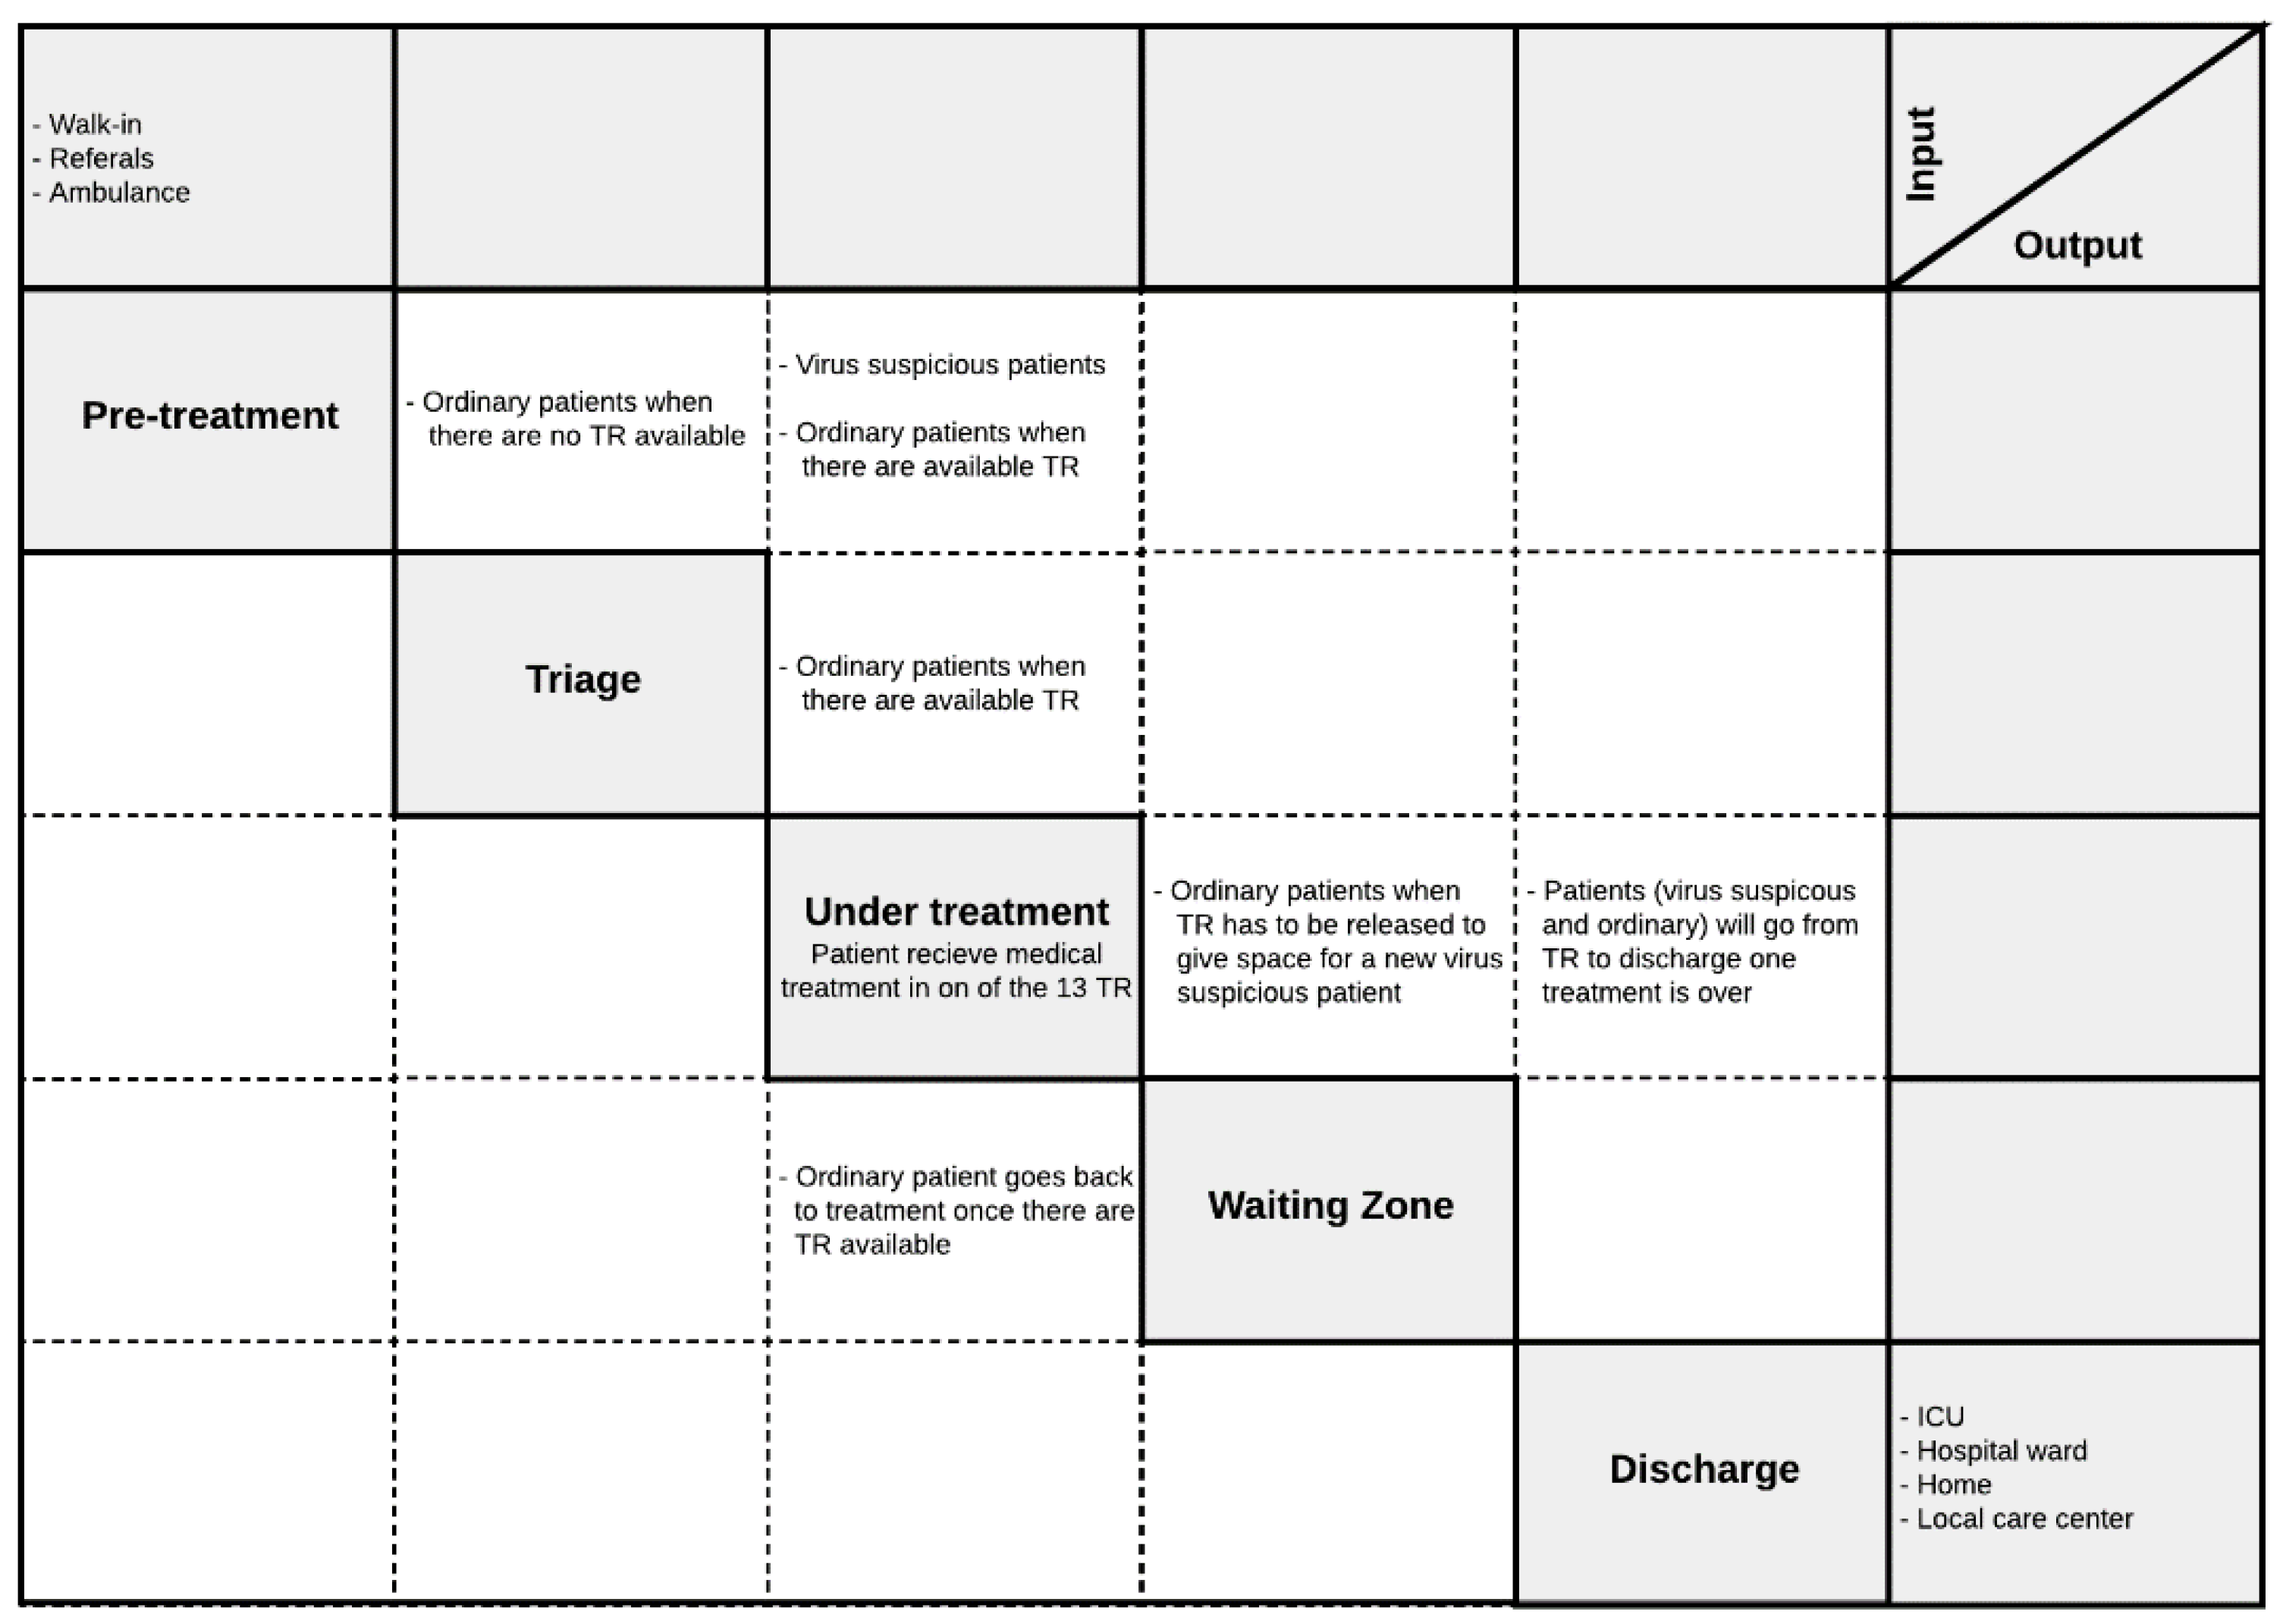
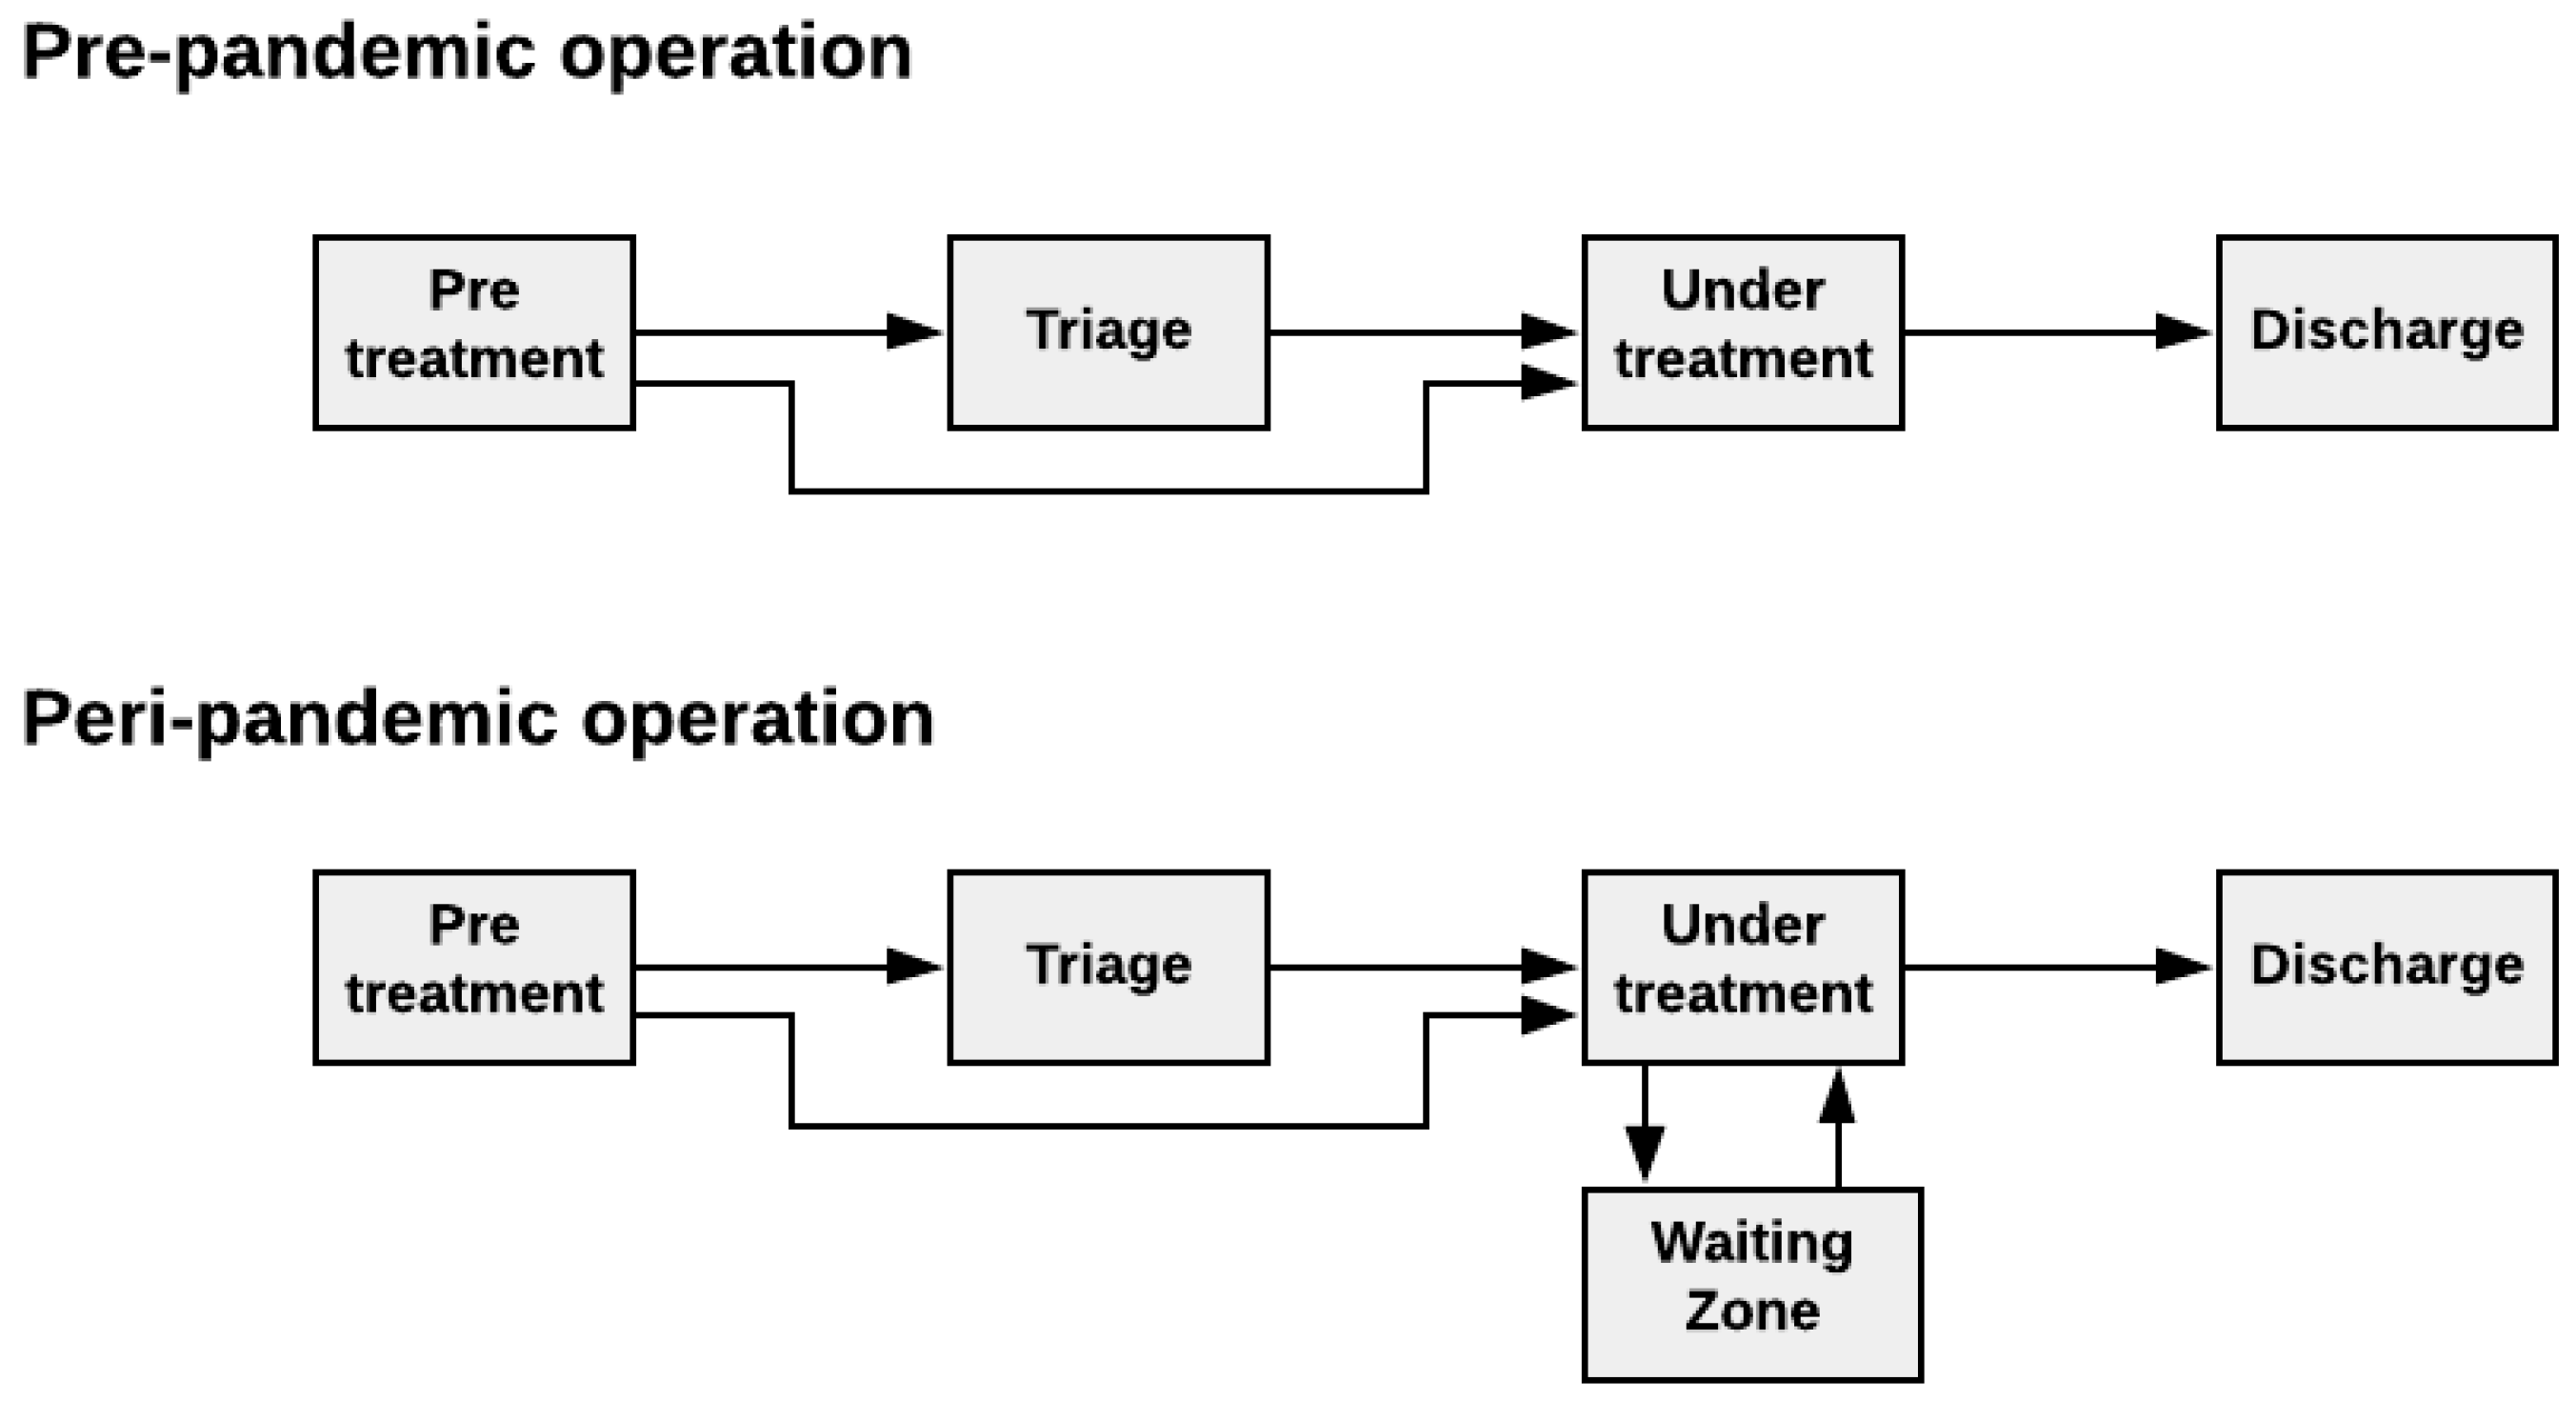
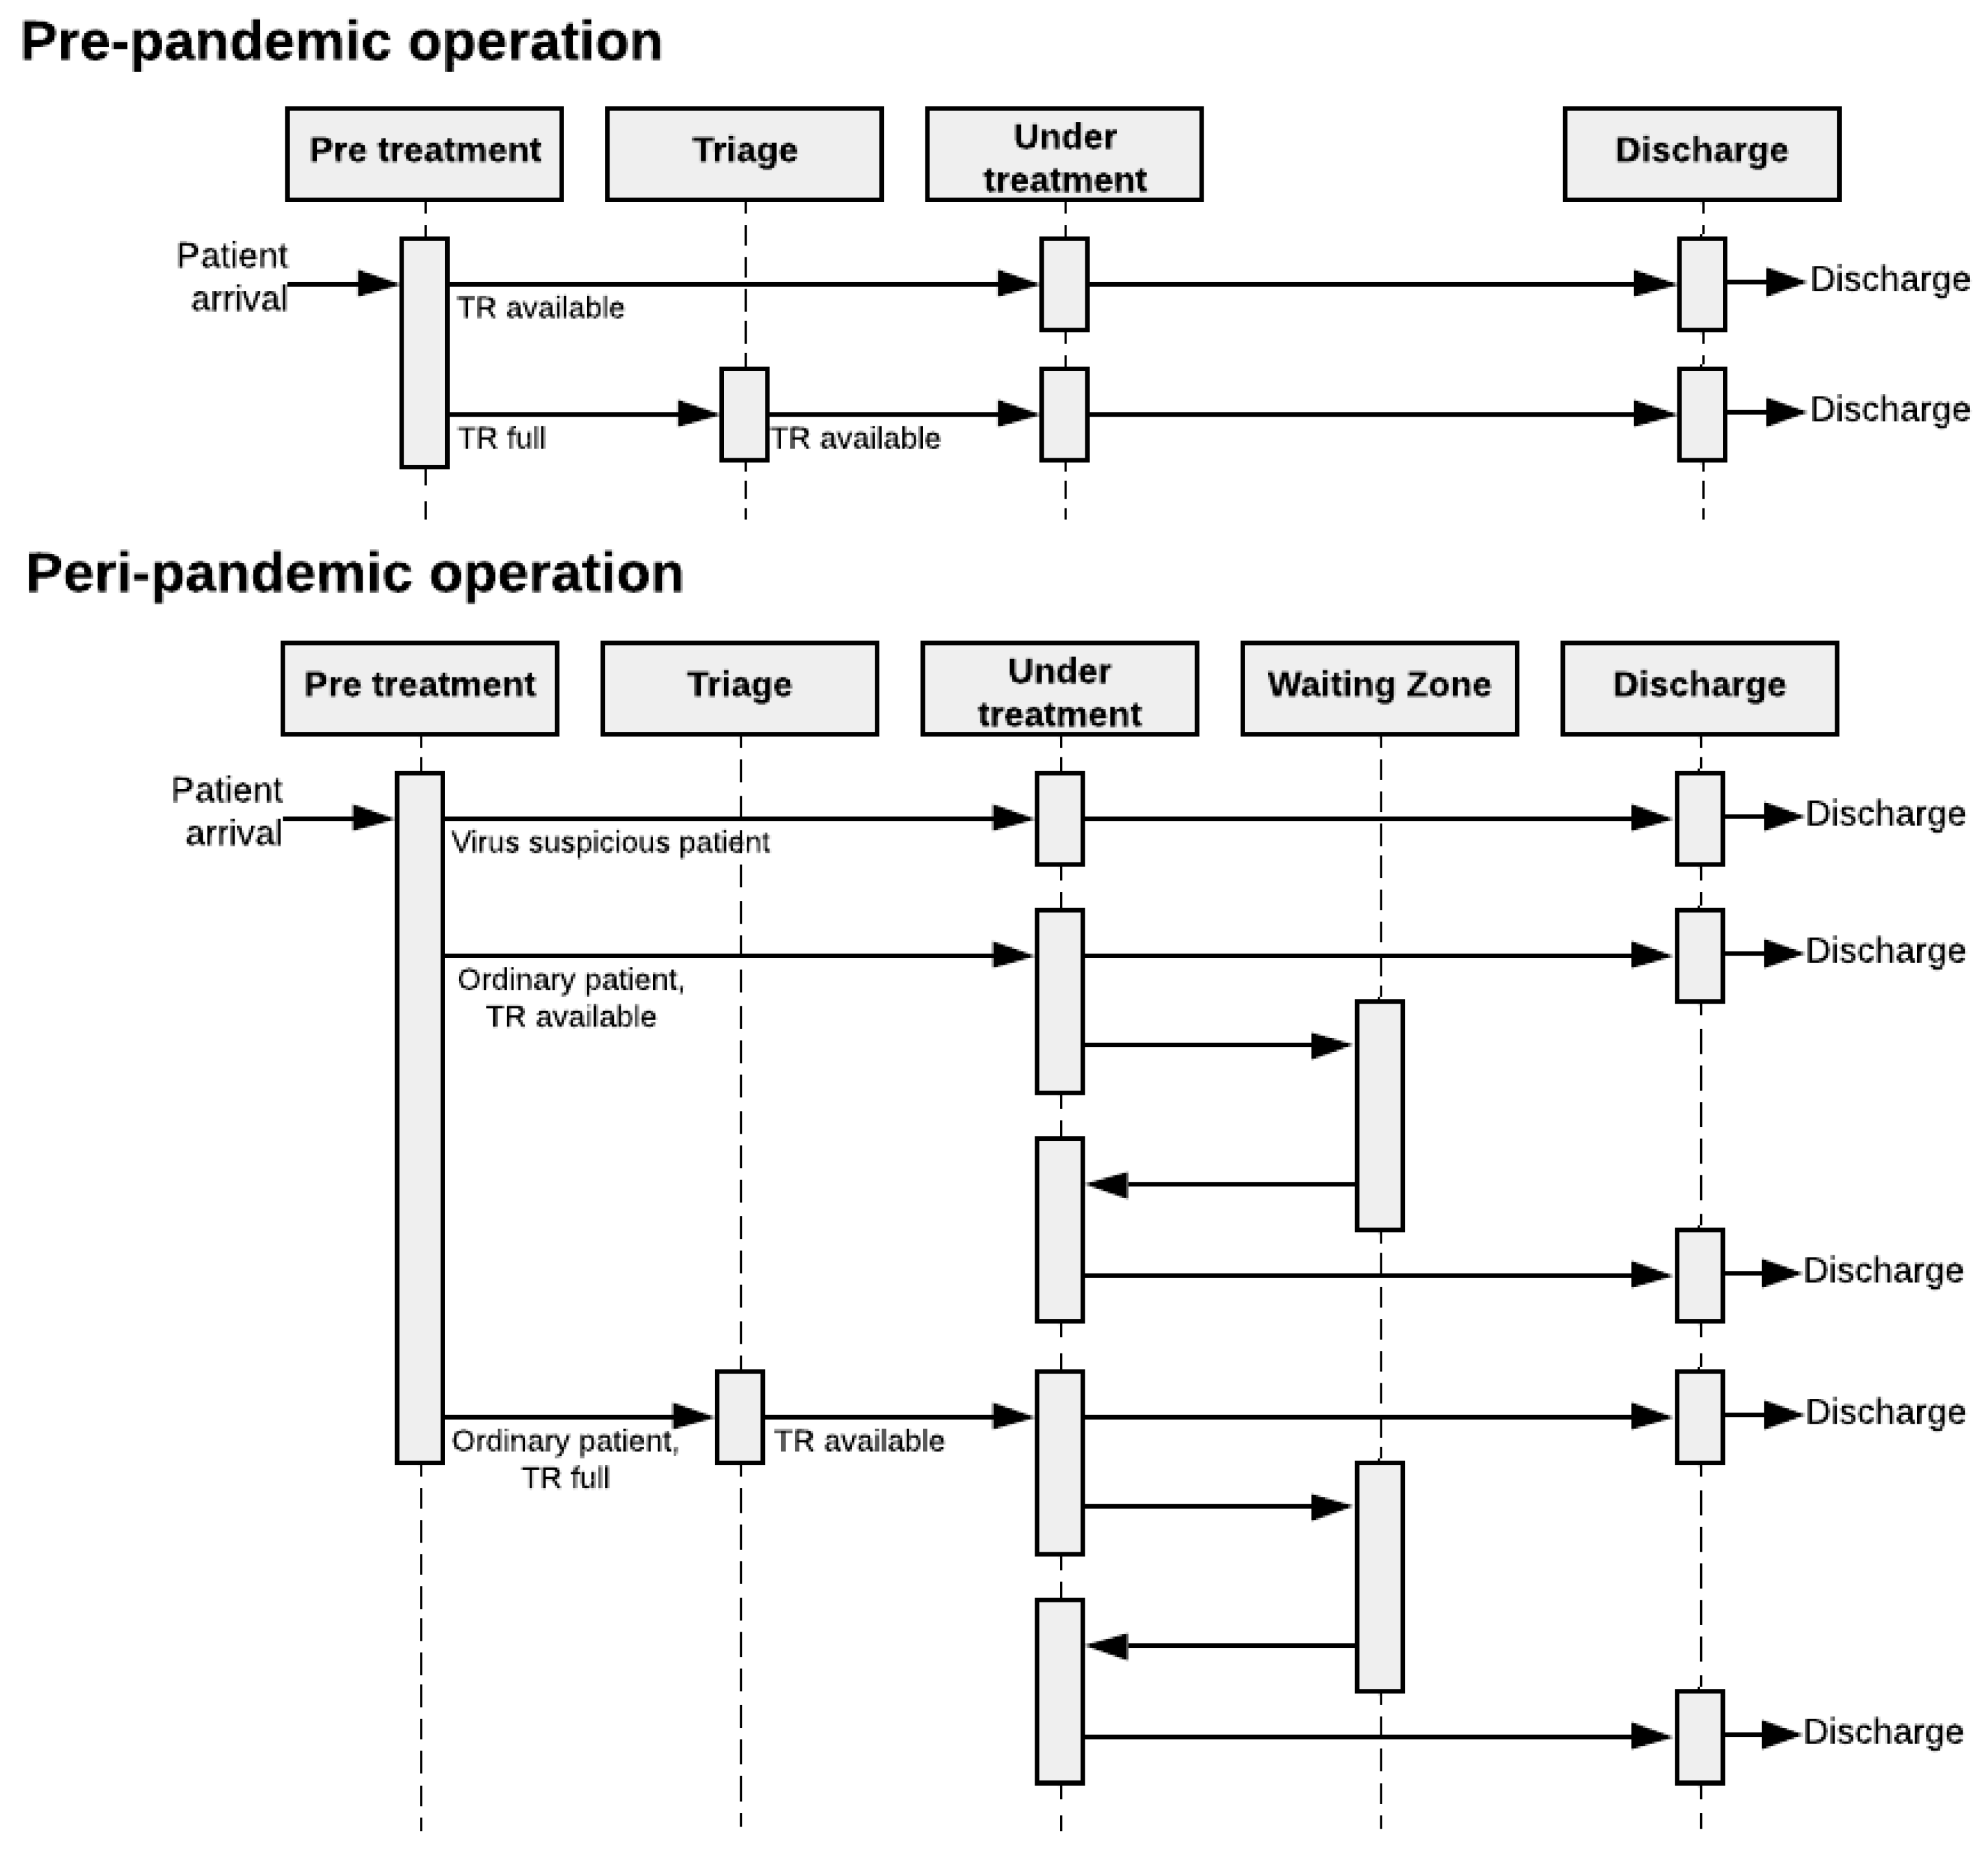
“Pre-Treatment”
“Triage”
“Under Treatment”
“Waiting Zone”
“Discharge”
3.1.4. Step 4—Description of the Basic Mechanisms of the System


| Name | Description | Logic | Code |
|---|---|---|---|
| Patient arrival will be arriving according to the numerical data attained from the case organization. Arrivals can be programmed based on a probability distribution that will make for a stochastical model. Alternatively, arrivals can be programmed according to recorded arrival times; the model will then be deterministic. | |||
| ‘Stay’ | State-Stay: The sole purpose of this state-block is to calculate the length of stay of patients throughout their lifetime, i.e., the entire statechart. Timer3 here does the counting. No other logic is contained within this state block. | Timeout for each second in simulation in order to increment the timer value within Timer3 according to criteria in the code. Variables: (integer) v_LOS | Action: v_LOS += inState(Stay) ? 1: 0; |
| ‘S1’ | State-Pre-treatment: First compound state in the overall patient flow. This state contains all the states for the pre-treatment activities a patient is undergoing. Like the previous state, counting is performed. It is worth noting counter is placed here instead of the ‘Stay’ state block to reduce the calculation power needed for each discrete increment. | Timeout for each second in simulation in order to increment the timer value within Timer1 according to code. Variables: v_time_in_PreTriage, v_time_in_WR | Action: v_time_in_PreTriage += inState(PreTriage)? 1: 0; v_time_in_WR += inState(WaitingInWR) ? 1: 0; |
| ‘s1-1’ | State-Incidence: Patient agent takes place into the statechart after being transferred from the ‘Exit’ block in DES (Figure 14). The sole purpose of this state block is that t serves the programmatic purpose of letting the patient agent enter the statechart. Once the patient agent is instantiated into this state, it is immediately passed onto the transition. | - | - |
| ‘t1-1’ | Transition: Patient agent arrives from the DES. Transition is triggered on the string message “occurrence,” which is sent from the ‘Exit’-block in the DES model. | - | - |
| ‘s1-2’ | State–PreTriage: Patient agent is getting moved from the entry node to the Pre-triage node, i.e., light green field in Figure 14. | The patient agent initiates movement from the Entry node to the te pre triage node. | Action: moveTo(main.PreTriageNode); |
| ‘t1-2’ | Transition: Transition from the state PreTriage to branch B1. | Transition is executed periodically for every fixed time interval in order to ensure. Parameter used: main.p_RegistrationCheckInterval | |
| ‘B1’ | Branch: This branch carries out the selection for what path the patient agent should proceed in. | Three different outgoing transitions: (1) If there is a suspicion that the patient is contaminated, the patient will go to S2. (2) If the patient agent is found not to be contaminated, the patient will go to the waiting room after a specified waiting time, i.e., state s1-3. (3) T3: If the patient agent has virus suspicion and there are no more treatment rooms, the patient must wait in the Pre-triage. | (1) Condition: p_contaminated && !f_is_TR_full() (1) Action: main.enter_SeizeTR.take(this); (2) Condition: !p_contaminated && (v_time_in_PreTriage > main.p_minTimeInPreTriage) (3) Action: if (p_contaminated && f_is_TR_full() && v_BlockFlag == false) { main.v_Virus_Patient_TR_Decline ++; v_BlockFlag = true; } |
| ‘s1-3’ | State–WalkingToWR: Patient agent walking to the waiting room from the pre triage. | The patient agent walks along the path between the pre-triage and waiting room shown in Figure 14. | Action: moveTo(main.waitingRoomNode); |
| ‘t1-3’ | Transition: The patient agent is simply transitioning between walking to the waiting room and waiting in the waiting room. | This transition is triggered once the patient agent stops walking and arrives at its place in the waiting room. | - |
| ‘s1-4’ | State–WaitingInWR: This state for the patient agents when waiting in the waiting room (WR); see the node in Figure 14. | - | - |
| ‘t1-4’ | Transition: Here, the patient agent will attempt to see if it is ready to proceed. | This transition will trigger periodically. It will check if it can fulfill any of the transitions branch B4 for each periodic interval. | - |
| ‘B4’ | Branch: This is the pathway forward after the PreTreatment state. Patient agents from here either have to go to the treatment room, triage or wait further if the above-mentioned is full. | Three outgoing transitions: (1) T1–Going to triage if there are no more treatment rooms left, (2) T2–Going to a treatment room, and (3) Stay in the waiting room if the above-mentioned transitions do not fulfill their execution conditions. None of the transitions have dependencies on the patient virus suspicious status, as these are already sorted in the previous branch B1. | (1) Conditions: f_is_TR_full() && !f_is_Triage_full() && (v_time_in_WR > main.p_minTimeInWR) (1) Action: main.enter_seize_Triage.take(this); (2) Action: main.enter_SeizeTR.take(this); (3) Conditions: !f_is_TR_full() && f_is_WZ_empty() && f_is_Triage_empty() && (v_time_in_WR >main.p_minTimeInWR) |
| ‘S2’ | State–IntraTreatment: This is the second major compound state of the overall patient flow. As the name suggests, this is where the patient finally undergoes treatment. The patient agent is released from the treatment room seizing pathway shown in the DES block diagram (Figure 14) | The treatment is simulated by the patient agent waiting inside the treatment room. The treatment time differs according to whether the patient has suspicion of virus contamination. (1) Timer variable: v_time_in_TR. (2) Counter variable: main.p_number_room_exit | v_time_in_TR += inState(Treatment) ? 1: 0; main.p_number_room_exit++ |
| ‘s2-1’ | State–WalkingToAndSeizingTR: This is the state the patient agent is contained within until it has been transferred from the seize-path, as mentioned earlier. | - | - |
| ‘t2-1’ | Transition–The patient agent is transitioned to the next state once the message is received from the | The patient agent is transitioned to the next state once the message is received from the | - |
| ‘s2-2’ | State–Treatment: This is the state in which the patient agent is under treatment. | The patient agent stays in this state while the counter is increasing. | - |
| ‘t2-2’ | Transition–Transition out of treatment leads to a branch where there are three options possible. | This transition is cyclical and repeats every second during model runtime for patients’ agents that stay within the treatment state. | - |
| ‘B2’ | Branch: This branch leads the patient agent to go to the waiting zone, leave the ED, or stay to continue the treatment. | The branch is leading to three outgoing transitions (1) T6: Patient agents pause the treatment and makes the patient go to the waiting zone. (2) T7: Patient agent has completed treatment and will head to exit the ED. (3) Treatment is not carried out, and it will proceed until it is either completed or has to pause because the treatment room needs to be seized by a patient suspicious of contamination. | (1) Action: main.enter_seize_WZ.take(this); (1) Condition: !p_contaminated && f_is_TR_full() && !f_is_WZ_full() && v_time_in_TR > main.p_minTimeTR && f_is_this_longest_in_TR(this) && f_is_any_contaminated_in_WR() && main.b_is_WZ_in_use (2) Action: main.enter.take(this); (2) Condition: p_contaminated ? v_time_in_TR > main.p_TreatmentTime_VirusSuspicion: v_time_in_TR > main.p_TreatmentTime_OrdinaryPatient |
| ‘S3’ | State–Triage: Compound state element emulating the patient standing by in the triage until there is room for the patient in the treatment rooms. | Time is tracked. Variable: v_time_in_Triage | v_time_in_Triage += inState(Triage) ? 1: 0; |
| ‘s3-1’ | State-WalkingToTriage: The patient agent walks from the waiting room node to the triage node. The patient agent is retrieved from the DES path shown in Figure 14, distributing the triage bed to the patient agent. | - | - |
| ‘t3-1’ | Transition–Transition is executed once the patient agent is transferred from the DES flow chart. | - | - |
| ‘s3-2’ | State–WaitingInTriage: | This state emulates the waiting time in the triage. | - |
| ‘t3-2’ | Transition: Transition for checking if it is time to leave the triage. Decision-making through the branch (B5) in the next row. | Transition executed periodically; every second patient stays state ‘WaitingInTriage.’ | - |
| ‘B5’ | Branch: Checking if the patient agent can leave the triage to go to a treatment room. | The branch is leading to two outgoing transitions. (1) Transition for when there is a treatment room ready. (2) No treatment room is available for the patient agent, returning to the previous state. | (1) Condition: !f_is_TR_full() && f_is_WZ_empty() && !f_is_any_contaminated_in_WR() && (v_time_in_Triage > main.p_minTimeInTriage) (1) Action: main.enter_SeizeTR.take(this); |
| ‘S4’ | State-WaitingZone: This is the compound state encompassing the states that emulate the waiting zone for the patient agents. | This compound statement has no time counters as the time is directly relevant for when a patient agent will leave this state. However, as seen in the outgoing transition (T5), the patient agent can leave once there is room again for the patient agent to return to the treatment room. | - |
| ‘s4-1’ | State–GoingToWZ: The patient is retrieved from the DES chart, it has been allocated to a waiting zone, and walking to the spot it has been granted. | - | main.enter_seize_WZ.take(this); |
| ‘t4-1’ | Transition: Patient agent is finished walking to the waiting zone and will proceed by waiting in the waiting zone. | This transition is carried out once the patient agent has arrived at the granted waiting zone spot. This transition is executed by receiving a message from the DES-chart | - |
| ‘s4-2’ | State-WaitingInWZ: The patient agent is waiting in the waiting zone. | - | - |
| ‘t4-2’ | Transition: Transition going out from waiting in the waiting zone. | This transition is periodically executed every second of runtime. | - |
| ‘B3’ | Branch: Branch for going further to the treatment room or keep on waiting. | This branch does have two outgoing transitions for the patient agents staying in the triage (1) T4–Going to the IntraTreatment state. (2) Keep on waiting in the triage. | (1) Condition: !f_is_TR_full() && f_is_WZ_empty() && !f_is_any_contaminated_in_WR() && (v_time_in_Triage > main.p_minTimeInTriage) (1) Action: main.enter_SeizeTR.take(this); |
| ‘S5’ | State–Discharge: Patient agent is here on its way out of the model. The state does not do anything besides being a mediator between the two states. | - | - |
3.2. Computational Model
- (1)
- Animated layout to visualize the patient flow behavior in a virtual ED environment.
- (2)
- A discrete-event model for facility resources (treatment rooms, waiting zones, triage) and patient arrival rate.
- (3)
- An agent-based model for patient flow (for ordinary and COVID-19 contaminated patients), where the sequence (state and transitions), policies (conditions, triggers), and service time (treatment time, waiting time) are modeled.
3.2.1. Virtual ED Model
3.2.2. Resource Allocation Model
3.2.3. Patient Flow Behavior Model
- Pre-treatment;
- Triage;
- Intra treatment;
- Waiting Zone;
- Discharge.
3.3. Model Outcome and Output Validation
- (1)
- Patient crowding timeline in the ED;
- (2)
- Key performance indicators of patient flow, e.g., waiting time and time to treatment.
4. Discussion
4.1. Discussion of the Conceptual Modeling
4.2. Computational Model
4.2.1. Simulation Model Validity
4.3. Assumptions and Simplifications
- The percentage of COVID-19-contaminated patients out of total patients entering the ED, i.e., the patient contamination rate (PCR), was considered 30% in the peri-pandemic scenarios and 0% in the pre-pandemic scenarios. This percentage was constant throughout the entire day, while it may have varied throughout the day in real life.
- Treatment time for each patient agent was assumed to be constant. However, realistically, the treatment time will most likely vary throughout the day according to what types of patients arrive to the emergency department. In this model, the treatment time was set static to a 2-hour average, based on an assessment by the case stakeholders.
- No intra-hospital contamination was put into the model.
- Therefore, the model implicitly assumes that there is a perfect sorting, i.e., a sorting error is not taken into consideration regarding the patients in the pre-triage.
4.4. Practical Implications
4.5. Further Work
- Replacing our assumption of a constant contamination rate with a dynamically changing rate as a pandemic develops through time throughout a population.
- Replacing our assumption of no intra-hospital contamination with a probability of such contamination.
- Replacing our assumption of perfect sorting of incoming patients with a probability of classification inaccuracies.
5. Conclusions
- A conceptual and a computational model that mimics, explains, and predicts ED behavior under pandemic conditions while considering multiple agent behaviors.
- An account demonstrating the rigorous and transparent implementation of conceptual modeling of patient flow in the ED, to a greater extent than shown in previous research literature. By documenting the entire thought process behind each step of the modeling process and showing the resulting model, we believe that we contribute to modeling practice by making these steps transparent and accessible to others. This will be helpful to other researchers to understand, assess and build trust in such models, and provides an example than can be emulated by others to build their own thoroughly validated models.
- The computational model we have provided includes several performance measures that will be useful for practitioners but have not been previously introduced in simulation studies of patient flow in the ED.
- Furthermore, we have discussed the broader applicability of our models and are currently undertaking further research using the presented model to study patient flow in the ED under pandemic conditions.
Author Contributions
Funding
Institutional Review Board Statement
Informed Consent Statement
Data Availability Statement
Acknowledgments
Conflicts of Interest
Abbreviations
References
- Ahsan, K.B.; Alam, M.R.; Morel, D.G.; Karim, M.A. Emergency department resource optimisation for improved performance: A review. J. Ind. Eng. Int. 2019, 15, 253–266. [Google Scholar] [CrossRef] [Green Version]
- Quah, L.J.J.; Tan, B.K.K.; Fua, T.-P.; Wee, C.P.J.; Lim, C.S.; Nadarajan, G.; Zakaria, N.D.; Chan, S.-E.J.; Wan, P.W.; Teo, L.T.; et al. Reorganising the emergency department to manage the COVID-19 outbreak. Int. J. Emerg. Med. 2020, 13, 32. [Google Scholar] [CrossRef] [PubMed]
- Nadarajan, G.D.; Omar, E.; Abella, B.S.; Hoe, P.S.; Do Shin, S.; Ma, M.H.-M.; Ong, M.E.H. A conceptual framework for Emergency department design in a pandemic. Scand. J. Trauma Resusc. Emerg. Med. 2020, 28, 118. [Google Scholar] [CrossRef] [PubMed]
- Ronen, B.; Pliskin, J.S.; Pass, S. The Hospital and Clinic Improvement Handbook: Using Lean and the Theory of Constraints for Better Healthcare Delivery; Oxford University Press: Oxford, UK; New York, NY, USA, 2018; ISBN 978-0-19-084345-8. [Google Scholar]
- Hoot, N.R.; Aronsky, D. Systematic Review of Emergency Department Crowding: Causes, Effects, and Solutions. Ann. Emerg. Med. 2008, 52, 126–136.e1. [Google Scholar] [CrossRef] [PubMed]
- Hwang, U.; McCarthy, M.L.; Aronsky, D.; Asplin, B.; Crane, P.W.; Craven, C.K.; Epstein, S.K.; Fee, C.; Handel, D.A.; Pines, J.M.; et al. Measures of Crowding in the Emergency Department: A Systematic Review: ED Crowding Measures. Acad. Emerg. Med. 2011, 18, 527–538. [Google Scholar] [CrossRef] [PubMed]
- Moskop, J.C.; Sklar, D.P.; Geiderman, J.M.; Schears, R.M.; Bookman, K.J. Emergency Department Crowding, Part 1—Concept, Causes, and Moral Consequences. Ann. Emerg. Med. 2009, 53, 605–611. [Google Scholar] [CrossRef] [PubMed]
- Pitts, S.R.; Pines, J.M.; Handrigan, M.T.; Kellermann, A.L. National Trends in Emergency Department Occupancy, 2001 to 2008: Effect of Inpatient Admissions Versus Emergency Department Practice Intensity. Ann. Emerg. Med. 2012, 60, 679–686.e3. [Google Scholar] [CrossRef] [PubMed]
- Dooley, K. Simulation Research Methods. In The Blackwell Companion to Organizations; Baum, J.A.C., Ed.; Blackwell Publishing Ltd: Oxford, UK, 2017; pp. 829–848. ISBN 978-1-4051-6406-1. [Google Scholar]
- Currie, C.S.M.; Fowler, J.W.; Kotiadis, K.; Monks, T.; Onggo, B.S.; Robertson, D.A.; Tako, A.A. How simulation modelling can help reduce the impact of COVID-19. J. Simul. 2020, 14, 83–97. [Google Scholar] [CrossRef] [Green Version]
- Gul, M.; Guneri, A.F. A comprehensive review of emergency department simulation applications for normal and disaster conditions. Comput. Ind. Eng. 2015, 83, 327–344. [Google Scholar] [CrossRef]
- Ostermann, T. Agent-based modelling for simulating patients flow in a community hospital. In Proceedings of the International Conference on Health Informatics (HEALTHINF-2015), Lisbon, Portugal, 12–15 January 2015; pp. 14–19. [Google Scholar]
- Bhattacharjee, P.; Ray, P.K. Patient flow modelling and performance analysis of healthcare delivery processes in hospitals: A review and reflections. Comput. Ind. Eng. 2014, 78, 299–312. [Google Scholar] [CrossRef]
- Roberts, S.D. Tutorial on the simulation of healthcare systems. In Proceedings of the 2011 Winter Simulation Conference (WSC), Phoenix, AZ, USA, 11–14 December 2011; pp. 1403–1414. [Google Scholar]
- Asgary, A.; Najafabadi, M.M.; Karsseboom, R.; Wu, J. A Drive-through Simulation Tool for Mass Vaccination during COVID-19 Pandemic. Healthcare 2020, 8, 469. [Google Scholar] [CrossRef] [PubMed]
- Luna, L.F.; Andersen, D.L. Using Qualitative Methods in the Conceptualization and Assessment of System Dynamics Models. In Proceedings of the 20th International System Dynamics Conference, System Dynamics Society, Palermo, Italy, 28 July–1 August 2002. [Google Scholar]
- Randers, J. Elements of the System Dynamics Method; MIT Press: Cambridge, MA, USA, 1980. [Google Scholar]
- Terning, G.; Brun, E. Systemic Conceptual Modeling of Patient Flow in a Hospital Emergency Department: A case example. In Proceedings of the System Dynamics Society Record of the 38th International Conference of the System Dynamics Society 2020, Bergen, Norway, 19–24 July 2020; Volume 38. [Google Scholar]
- Gunal, M.M. A guide for building hospital simulation models. Health Syst. 2012, 1, 17–25. [Google Scholar] [CrossRef]
- Albin, S.; Forrester, J.W.; Breierova, L. Building a System Dynamics Model: Part 1: Conceptualization; MIT: Cambridge, MA, USA, 2001. [Google Scholar]
- Suh, H. Key Figures. 2018. Available online: https://helse-stavanger.no/om-oss/nokkeltall-2018 (accessed on 14 February 2019).
- Suh, H. Om Oss. Available online: https://helse-stavanger.no/om-oss (accessed on 7 February 2019).
- Gallagher Healthcare. What Are the Different Types of Hospitals? Available online: https://www.gallaghermalpractice.com/blog/post/what-are-the-different-types-of-hospitals (accessed on 14 February 2019).
- Minge, A. Hun skal hele tiden være orakelet og ta raske og rette avgjørelse. Denne dagen varte pausen i 30 sekunder. Stavanger Aftenblad 2020. Available online: https://www.aftenbladet.no/magasin/i/EWgGxa/hun-skal-hele-tiden-vaere-orakelet-og-ta-raske-og-rette-avgjoerelse-denne-dagen-varte-pausen-i-30-sekunder (accessed on 14 February 2019).
- Monks, T.; Currie, C.S.M.; Onggo, B.S.; Robinson, S.; Kunc, M.; Taylor, S.J.E. Strengthening the reporting of empirical simulation studies: Introducing the STRESS guidelines. J. Simul. 2019, 13, 55–67. [Google Scholar] [CrossRef]
- Borshchev, A. The Big Book of Simulation Modeling: Multimethod Modeling with AnyLogic 6; AnyLogic North America: Chicago, IL, USA, 2013; ISBN 978-0-9895731-7-7. [Google Scholar]
- Helsedirektoratet—Avdeling sykehustjenester Faglige og organisatoriske kvalitetskrav for somatiske akuttmottak. Nas. Faglige Retningslinjer-2236 2014. Available online: https://www.helsedirektoratet.no/retningslinjer/kvalitetskrav-for-somatiske-akuttmottak/Faglige%20og%20organisatoriske%20kvalitetskrav%20for%20somatiske%20akuttmottak%20%E2%80%93%20Nasjonal%20faglig%20retningslinje.pdf/_/attachment/inline/aea8baff-94d2-44f5-b525-f6c1f518aed5:029310dc7ad46980ba0fe85bdd9887148d4206b1/Faglige%20og%20organisatoriske%20kvalitetskrav%20for%20somatiske%20akuttmottak%20%E2%80%93%20Nasjonal%20faglig%20retningslinje.pdf (accessed on 14 February 2019).
- Senge, P.M.; Forrester, J.W. Tests for building confidence in system dynamics models. Syst. Dyn. TIMS Stud. Manag. Sci. 1980, 14, 209228. [Google Scholar]


| a | ||
|---|---|---|
| Day 1 | Day 2 † | |
| Real data | 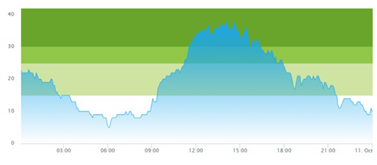 | 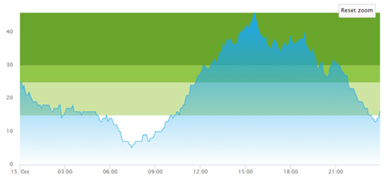 |
| b | ||
| Day 1 | Day 2 † | |
| Real data | 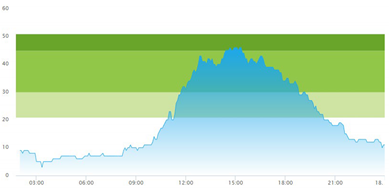 | 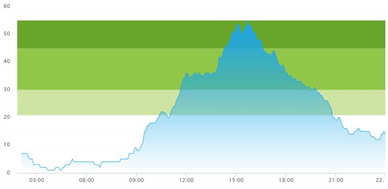 |
| a | ||
|---|---|---|
| Day 1 | Day 2 † | |
| (a) Actual patient crowding | 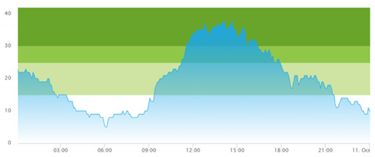 | 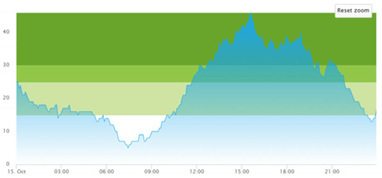 |
| (b) Simulated patient crowding |  | 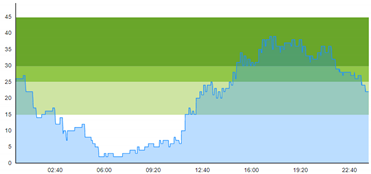 |
| b | ||
| Day 1 | Day 2 † | |
| (a) Actual patient crowding | 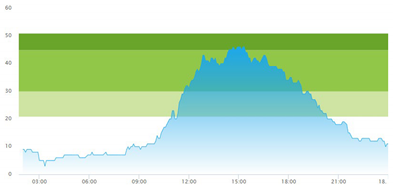 | 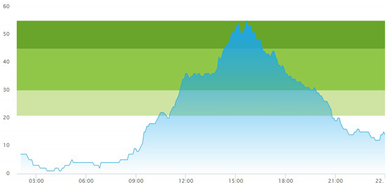 |
| (b) Simulated patient crowding | 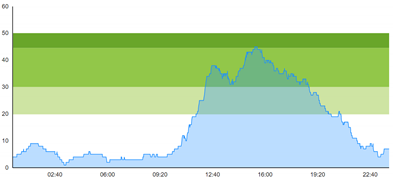 | 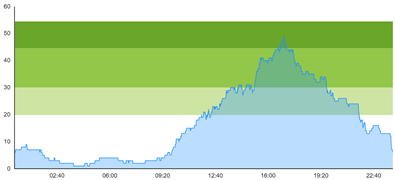 |
Publisher’s Note: MDPI stays neutral with regard to jurisdictional claims in published maps and institutional affiliations. |
© 2022 by the authors. Licensee MDPI, Basel, Switzerland. This article is an open access article distributed under the terms and conditions of the Creative Commons Attribution (CC BY) license (https://creativecommons.org/licenses/by/4.0/).
Share and Cite
Terning, G.; Brun, E.C.; El-Thalji, I. Modeling Patient Flow in an Emergency Department under COVID-19 Pandemic Conditions: A Hybrid Modeling Approach. Healthcare 2022, 10, 840. https://doi.org/10.3390/healthcare10050840
Terning G, Brun EC, El-Thalji I. Modeling Patient Flow in an Emergency Department under COVID-19 Pandemic Conditions: A Hybrid Modeling Approach. Healthcare. 2022; 10(5):840. https://doi.org/10.3390/healthcare10050840
Chicago/Turabian StyleTerning, Gaute, Eric Christian Brun, and Idriss El-Thalji. 2022. "Modeling Patient Flow in an Emergency Department under COVID-19 Pandemic Conditions: A Hybrid Modeling Approach" Healthcare 10, no. 5: 840. https://doi.org/10.3390/healthcare10050840
APA StyleTerning, G., Brun, E. C., & El-Thalji, I. (2022). Modeling Patient Flow in an Emergency Department under COVID-19 Pandemic Conditions: A Hybrid Modeling Approach. Healthcare, 10(5), 840. https://doi.org/10.3390/healthcare10050840