Abstract
Low serum alanine aminotransferase (ALT) activity and high aspartate aminotransferase (AST)/ALT ratio may be associated with high mortality in the elderly. We aimed to confirm this in an 8-year retrospective cohort study. Clinical data for 5958 people living in a city aged 67–104 years were analyzed for their relationships with all-cause mortality using artificial intelligence (AI) and conventional statistical analysis. In total, 1413 (23.7%) participants died during the study. Auto-AI analysis with five rounds of cross-validation showed that AST/ALT ratio was the third-largest contributor to mortality, following age and sex. Serum albumin concentration and body mass index were the fourth- and fifth-largest contributors. However, when serum ALT and AST were individually considered in the same model, the individual serum ALT and AST activities were the seventh- and tenth-largest contributors. Conventional survival analysis showed that ALT, AST, and AST/ALT ratio as continuous variables were all associated with mortality (adjusted hazard ratios (95% confidence intervals): 0.98 (0.97–0.99), 1.02 (1.02–1.03), and 1.46 (1.32–1.62), respectively; all p < 0.0001). In conclusion, both AI and conventional analysis suggest that of the conventional biochemical markers, high AST/ALT ratio is most closely associated with all-cause mortality in the elderly.
1. Introduction
It can be difficult to identify older members of the community who are at a high risk of mortality, particularly using the conventional biochemical parameters measured in clinical practice. During the past two decades, many studies have shown that low serum alanine aminotransferase (ALT) activity and high aspartate transaminase (AST)/ALT ratio are associated with high mortality in the elderly [1,2,3,4,5,6,7,8,9,10,11,12,13]. However, the mechanisms involved remain to be conclusively established [14,15,16,17]. Some previous studies have also shown that high AST activity is associated with mortality [18,19]. In addition, we previously showed that high serum AST activity, accompanied by normal serum ALT activity, is associated with underweight owing to weight loss [20], which are both risks for mortality.
In clinical practice, the circulating activities of ALT and AST are routinely measured to identify hepatic disease [21,22]. Both transaminases have metabolic functions, in particular in amino acid metabolism, and are expressed in multiple organs, including the liver, myocardium, and skeletal muscle [23,24]. Specifically, ALT is primarily expressed in the liver, whereas AST is widely expressed, including in skeletal muscle. Therefore, a high serum ALT activity reflects the destruction of hepatocytes, whereas a high serum AST activity, alongside a normal ALT activity, may reflect muscle damage. In younger and middle-aged people, long-term increases in serum ALT activity are caused, for example, by non-alcoholic fatty liver disease [25,26], but eventually, the hepatic transaminase activities of the patients may become low during the terminal stage of cirrhosis because of lower ALT synthesis in the liver. In contrast, in the elderly, a low serum ALT activity might be caused by age-related atrophy of the liver or other organs, including the muscles and lungs [27,28]. Given these variations in serum ALT and AST activity, the AST/ALT ratio may more accurately reflect the risk of mortality. Therefore, we performed an 8-year, community-based retrospective cohort study, in which we used both artificial intelligence (AI) and conventional statistical analysis to investigate the relationships of this ratio and other biochemical markers with the risk of mortality. AI techniques, such as machine learning and deep learning, have been shown to improve the prediction of diseases, such as cardiovascular disease [29].
2. Materials and Methods
2.1. Study Design
We performed an 8-year cohort study of healthcare data relating to people living in Yamato City, a commuter suburb about 30 km from Tokyo [30], in Kanagawa Prefecture. After the conclusion of a contract between Yamato City and Kanagawa University of Human Services, we received the data, which comprised clinical parameters, nursing care level, and mortality but not the cause of death. The study protocol was approved by the ethics committee of Kanagawa University of Human Services (Approval number 17–26), and the study conformed with the principles of the Declaration of Helsinki. The requirement for informed consent was waived because it was a retrospective study of anonymized data. The study protocol was available on the home page of the university [31] and was published in the public relations magazine of Yamato City [32].
2.2. Participants and Measurements
Existing data, collected for 6068 people living in Yamato City, Kanagawa Prefecture, who were aged ≥64 years and underwent a baseline examination between April 2011 and March 2012, were reviewed. Owing to incomplete or missing data, 110 individuals were excluded, leaving 5958 for the analysis. Specific inclusion and exclusion criteria were not used, but all the participants had undergone an annual check-up with approval and responded to questions prepared by the medical personnel, which implies that they were not at imminent risk of death, nor did they have severe dementia at baseline. Elderly people who lived in a nursing or retirement home were excluded from the study. In addition, inpatients receiving routine treatments at baseline were also excluded. Clinical measurements were made in the morning after an overnight fast. Body mass index (BMI) was calculated as body mass (kg) divided by the square of height (m2). Serum biochemical parameters were measured automatically using standard methods. Estimated glomerular filtration rate (eGFR) was calculated using the equation developed for Japanese populations [33]:
eGFR (mL/min/1.73 m2) = 194 × Cr−1.094 × Age−0.287 (×0.739 if female), where Cr is the serum creatinine concentration (mg/dL).
Questions regarding lifestyle, including smoking habits, alcohol consumption, and pharmacotherapy for hypertension, diabetes, and dyslipidemia, were developed by the municipal officers of Yamato City, referring to the questions prepared by the Japanese Ministry of Health, Labour, and Welfare in 2008 for use in health check-ups in Japan.
2.3. Auto-AI Analysis
We performed a graphical user interface (GUI)-based automatic AI (auto-AI) analysis using Prediction One (Sony Network Communications Inc., Tokyo, Japan) [34] and appropriately prepared datasheets. This auto-AI analysis system does not require specific user skills. Data learning, evaluation, and neural network analysis were automatically performed during the analysis to generate an optimal prediction model, with internal cross-validation. The output was a list of parameters, ranked according to the level of contribution of each. Unfortunately, as previously described [35], the details of the AI, including the types of neural network, are trade secrets and therefore not available for publication.
The contributors to mortality were listed in order according to their contribution. The weight of contributor, which is considered as “feature-importance”, is equivalent to the relative contribution calculated using machine learning algorithms of extreme gradient boosting (XGBoost) [34,36]. Feature-importance is one of methods for explainability, which has been considered in the explainable artificial intelligence (XAI) systems [37,38].
For each parameter, the incidences of positive and negative outcomes are shown. After many trials were conducted using the auto-AI analysis, parameters with feature-importance <0.03 were excluded from the contributors. Ten factors (age; sex; smoking status; frequency of alcohol consumption; pharmacotherapy for hypertension, diabetes, and dyslipidemia (yes or no); BMI; white blood cell count; serum albumin concentration; eGFR; the serum AST, ALT, and gamma-glutamyltransferase [GGT] activities; and the AST/ALT ratio) remained as explanatory factors for all-cause mortality.
In the AI analysis, 259 participants whose survival could not be confirmed after 8 years, because they had moved or for other reasons, were excluded. The area under the curve (AUC) for each predictive model was calculated, with >74% and 63–73% being considered to indicate a good and a standard predictive model, respectively [34].
2.4. Conventional Statistical Analysis
Data are expressed as mean ± standard deviation (SD) or median (interquartile range). We used the SAS Enterprise Guide (SAS-EG 7.1) in SAS software, version 9.4 (SAS Institute, Cary, NC, USA), which has been used for numerous medical studies worldwide for several decades. Although SAS software also involves an AI system, the procedures involved are complex, particularly for non-SAS users, and require some technical skills, unlike in the case of the auto-AI described above.
The Kaplan–Meier method was used for all-cause mortality analysis. The log-rank and Wilcoxon tests were used to compare participants categorized according to the quartiles of baseline AST/ALT ratio and serum ALT activity. A Cox proportional hazard model, in which the time elapsed until death was considered, was used to calculate the adjusted hazard ratios (HRs) associated with clinical parameters (serum ALT, AST, and AST/ALT ratio; continuous variables). Ten confounding factors were the same factors selected by AI analysis. Conventional statistical analyses were performed using SAS Enterprise Guide (SAS-EG 7.1) in the SAS system, version 9.4 (SAS Institute, Cary, NC, USA). p < 0.05 was considered to represent statistical significance
3. Results
The baseline characteristics of the participants are shown in Table 1. Although the mean systolic blood pressure of the participants was higher than that of the general Japanese population, the mean values of the other parameters were almost normal [39]. Death occurred in 1413 (23.7%) participants during the 8 years of the study. In addition, a further 1632 (27.4%) participants developed overt disability (long-term care level ≥ 2) during the same period.

Table 1.
Baseline clinical characteristics of the participants.
Table 2 shows the contributors to all-cause mortality. The AUCs for models 1 and 2 were 73.1% and 72.2%, implying that these were good prediction models.
Table 2.
Parameters contributing to the prediction of all-cause mortality.
The AI analysis ranked high AST/ALT ratio as the third-greatest contributor to mortality, following older age and male sex in Model 1. Serum albumin concentration and BMI were the fourth- and fifth-ranked contributors to mortality. The individual serum ALT and AST activities were the seventh- and tenth-greatest contributors in Model 2.
Figure 1 shows the ranges and levels of feature-importance of the AST/ALT ratio and ALT with respect to mortality. AST/ALT ratio ≥ 1.64 (②, ③, ①) was a positive contributor, and AST/ALT ratio ≤ 1.50 (②, ③, ①) was a negative contributor to mortality.
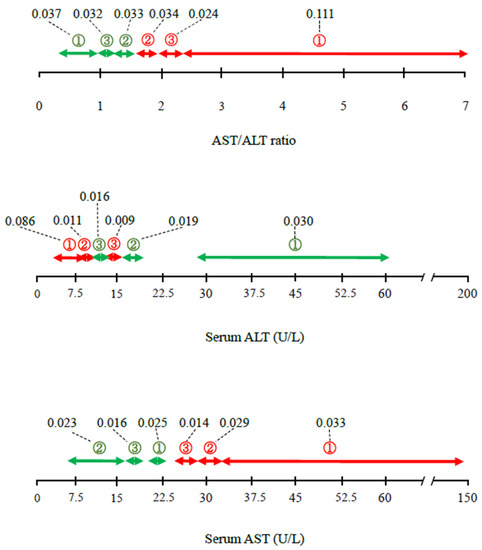
Figure 1.
Detailed contributions (ranges and feature-importance) of AST/ALT ratio, ALT activity, and AST activity to the risk of mortality, according to the AI analysis. Values linking to dashed lines express feature-importance, which reflects the contribution degree as a continuous value. Red and green arrows indicate positive and negative contribution to the risk of mortality. ① First-degree contribution; ② second-degree contribution; ③ third-degree contribution. The space in the bar indicates the categories with lower contributions (≥fourth degree). ALT, alanine aminotransferase; AST, aspartate transaminase.
When ALT and AST were considered individually, serum ALT activity ≤ 16 U/L (③, ②, ①) was a positive contributor, and serum ALT ≥ 12 U/L (③, ②, ①) was a negative contributor to mortality, indicating that the ALT ranges associated with each outcome overlap. Serum AST ≥ 25 U/L (③, ②, ①) was a positive contributor, and serum AST ≤ 23 U/L (①, ③, ②) was a negative contributor. Overall, the contributions of the serum ALT and AST activities were smaller than that of AST/ALT ratio. Of all the ranges calculated, the weighting of 0.111 for an AST/ALT ratio of ≥ 2.30 (①) was the largest, and that of 0.086 for an ALT activity of ≤ 10 (①) was the second largest.
Figure 2 and Figure 3 show the Kaplan–Meier survival curves for the mortality of the participants, which were categorized according to quartiles of AST/ALT ratio and serum ALT activity, respectively. Participants with a high AST/ALT ratio and a low ALT activity at baseline were at significantly higher risk of mortality during the study (log-rank and Wilcoxon tests, both p < 0.0001). However, Figure 3 shows that after the lowest ALT activity (≤16 U/L, Q1), the highest ALT activity (≥22 U/L, Q4) was also associated with high mortality.
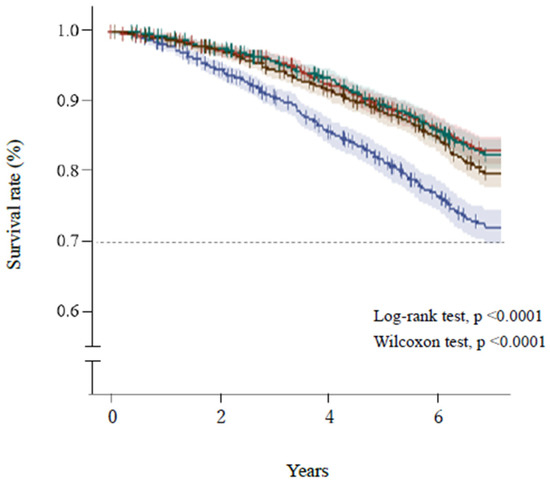
Figure 2.
Survival of the participants, categorized according to quartile of AST/ALT ratio. Blue line, ≥1.64 (Q1); brown line, 1.38–1.63 (Q2); green line, 1.15–1.37 (Q3); red line, ≤1.14 (Q4). Short bars express censored cases. The colored areas surrounding the lines show the 95% confidence intervals. ALT, alanine aminotransferase; AST, aspartate transaminase.
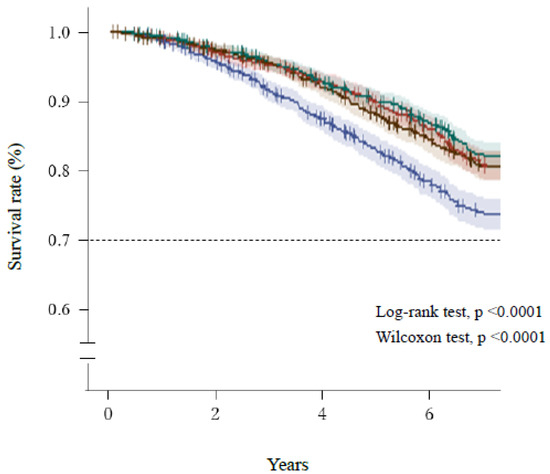
Figure 3.
Survival of the participants, categorized according to quartile of serum ALT activity. Blue line, ≤12 U/L (Q1); red line, 13–16 U/L (Q2); green line, 17–21 U/L (Q3); brown, ≥22 U/L (Q4). Short bars express censored cases. The colored areas surrounding the lines show the 95% confidence intervals. ALT, alanine aminotransferase.
Cox proportional hazard multivariate analysis (Table 3) showed that AST/ALT ratio as a continuous variable was significantly positively associated with all-cause mortality in Model 1. In addition, serum ALT was significantly negatively associated, and AST was significantly positively associated with all-cause mortality in Model 2. Each model was adjusted for the potential confounding factors listed in Table 2. Of note, eGFR was not associated with mortality even though the AI analysis showed eGFR to be the sixth- or seventh-greatest contributor (Table 2).
Table 3.
Adjusted hazard ratios for all-cause mortality associated with each parameter.
4. Discussion
In the present study, we used auto-AI and conventional analyses to show that a high AST/ALT ratio is more closely associated than low serum ALT activity with all-cause mortality in older community-dwelling Japanese people. The AI showed that older age and male sex, which are unmodifiable factors, are the first- and the second-greatest contributors to the risk of mortality (Table 2), as expected. However, in addition, of the biochemical parameters that are conventionally measured in clinical practice, high AST/ALT ratio was the greatest contributor to the risk of mortality, more so than each individual component; and serum albumin concentration, white blood cell count, and BMI, all of which are well-known risk factors for mortality, also contribute [40,41]. These findings were generated in a single AI analysis, which is a novel approach, but are consistent with previous findings of an association between AST/ALT ratio and high mortality [7,8,10].
As also shown in previous studies [1,2,3,4,5,6,9,11,12], we found that people with low serum ALT activity are at a higher risk of mortality. However, the ranges of serum ALT activity that made positive and negative contributions to mortality overlapped (Figure 1 and Figure 3), which may have reduced the overall contribution calculated for serum ALT activity in the present study. However, the contribution of serum AST to mortality was lower (the tenth-greatest contributor) than those of other parameters, including serum ALT activity alone (seventh-greatest contributor) in the present AI analysis (Table 2). Although many studies have shown associations between low serum ALT activity and mortality [1,2,3,4,5,6,9,11,12], few have shown that high serum AST activity is a risk factor for mortality [18,19]. Therefore, the present findings are consistent with those of the majority of the previous studies concerning serum ALT and AST. Thus, the AST/ALT ratio may be a better predictor of all-cause mortality than the ALT and AST activities alone, and this was confirmed in the present study using both auto-AI and conventional statistical analyses.
Frailty and sarcopenia are strongly associated with multiple adverse clinical outcomes, including death [42,43,44]. However, the identification of these conditions, and particularly of frailty, is time-consuming and labor-intensive compared with the use of blood testing [45,46,47]. In addition, a consensus regarding the definitions of frailty and sarcopenia has not yet been reached [44,48]. Therefore, it is possible that the identification of a useful circulating biomarker may help identify the elderly who are at a high risk of death in the near future.
The normal ranges of serum aminotransferase activities are controversial [49,50]. Therefore, preferably, not only the upper but also the lower limits of normal should be determined for each enzyme in each population. Otherwise, the interpretations of similar results will continue to differ between countries and investigators, leading to conflicting conclusions. In addition, age at least should be considered in the evaluation of serum aminotransferase activities because serum ALT activity likely decreases, and serum AST likely increases with age [51,52,53].
In conventional survival analyses, the weightings of the contributions of each parameter to the outcome are not shown (Table 3), whereas the levels of both positive and negative contributions are indicated until third degrees in the auto-AI system used in the present analysis, which represents its most significant advantage over conventional statistical analyses. Therefore, at present, simultaneous analyses using conventional and AI-based methods may be superior to the use of either alone to confirm and interpret data and to facilitate the most appropriate investigation of the underlying mechanisms even if the results of each differ somewhat.
Meanwhile, a major challenge in AI prediction is that the effectiveness in real-world applications is limited by the inability to explain its decisions [37]. In line with this background, XAI has significantly increased over the last decade [38]. In this study, we considered feature-importance, a method of explainability, which indeed helped us to explain the importance and ranges of clinical permeameters for the risk of mortality.
The present study had some limitations. First, the individual causes of death of the participants were not available. Different results may have been obtained if specific causes of death, for instance, cancer and neurodegenerative diseases, such as Parkinson’s disease and Alzheimer’s disease, had been considered. Second, the time elapsed until death was not considered in the AI analysis because the AUC became very high (92%) when the factor of “time elapsed until death” was included in the predictive model; thus, we excluded this factor from the list of potential contributing factors. Third, we only used a single auto-AI, Prediction One, which is now available in Japan [34], with some limited conditions. Additionally, we did not have an external validation data. Therefore, other AIs, XAI, and different conditions, such as with respect to cross-validation, external validation data, and the adjustment for unbalanced data, may have yielded different results. Fourth, hepatitis B and C virus infection was not measured in this study. However, the prevalences of these infections were reported to be very low (0.6–2.3%) in Japan [54,55] and have declined rapidly [56]. Therefore, the effect of hepatitis virus infection on the mortality may be small if any. Finally, our study consisted of a relatively small sample. Given that machine learning is compatible with large amounts of data, such as big data [57], larger studies that include an AI analysis are thus needed to confirm the present findings.
5. Conclusions
In the present study, we used a combination of AI and conventional statistical analysis to show that from among the standard biochemical parameters, high AST/ALT ratio may be best associated with all-cause mortality in older people, following the contributions of age and sex.
Author Contributions
K.N. and T.N. designed the study. M.Y. and K.T. acquired data from Yamato City. T.N. and K.T. established the contract between Yamato City and Kanagawa University of Human Services. K.N. and M.Y. performed the initial analysis and contributed to discussion. K.N. prepared the first draft of the manuscript. All authors have read and agreed to the published version of the manuscript.
Funding
This research received no external funding.
Institutional Review Board Statement
The study was conducted according to the principles of the Declaration of Helsinki and approved by the Institutional Review Board of the Ethics Committee of Kanagawa University of Human Services (17–26).
Informed Consent Statement
Not applicable.
Data Availability Statement
Not applicable.
Acknowledgments
We thank the health promotion department of Yamato city office for collecting data and arrangement. We thank Mark Cleasby from Edanz for editing a draft of this manuscript.
Conflicts of Interest
The authors declare no conflict of interest.
References
- Elinav, E.; Ackerman, Z.; Maaravi, Y.; Ben-Dov, I.Z.; Ein-Mor, E.; Stessman, J. Low Alanine Aminotransferase Activity in Older People Is Associated with Greater Long-Term Mortality. J. Am. Geriatr. Soc. 2006, 54, 1719–1724. [Google Scholar] [CrossRef] [PubMed]
- Ruhl, C.E.; Everhart, J.E. The Association of Low Serum Alanine Aminotransferase Activity with Mortality in the US Population. Am. J. Epidemiol. 2013, 178, 1702–1711. [Google Scholar] [CrossRef] [PubMed]
- Liu, Z.; Ning, H.; Que, S.; Wang, L.; Qin, X.; Peng, T. Complex Association between Alanine Aminotransferase Activity and Mortality in General Population: A Systematic Review and Meta-Analysis of Prospective Studies. PLoS ONE 2014, 9, e91410. [Google Scholar] [CrossRef] [PubMed]
- Oh, C.M.; Won, Y.J.; Cho, H.; Lee, J.K.; Park, B.Y.; Jun, J.K.; Koh, D.H.; Ki, M.; Jung, K.W.; Oh, I.H. Alanine aminotransferase and gam-ma-glutamyl transferase have different dose-response relationships with risk of mortality by age. Liver Int. 2016, 36, 126–135. [Google Scholar] [CrossRef] [PubMed]
- Deetman, P.E.; Alkhalaf, A.; Landman, G.W.; Groenier, K.H.; Kootstra-Ros, J.E.; Navis, G.; Bilo, H.J.; Kleefstra, N.; Bakker, S.J. Alanine aminotransferase and mortality in patients with type 2 diabetes (ZODIAC-38). Eur. J. Clin. Investig. 2015, 45, 807–814. [Google Scholar] [CrossRef] [PubMed]
- Karaphillis, E.; Goldstein, R.; Murphy, S.; Qayyum, R. Serum alanine aminotransferase levels and all-cause mortality. Eur. J. Gastroenterol. Hepatol. 2017, 29, 284–288. [Google Scholar] [CrossRef]
- Zoppini, G.; Cacciatori, V.; Negri, C.; Stoico, V.; Lippi, G.; Targher, G.; Bonora, E. The aspartate aminotransferase-to-alanine ami-notransferase ratio predicts all-cause and cardiovascular mortality in patients with type 2 diabetes. Medicine 2016, 95, e4821. [Google Scholar] [CrossRef] [PubMed]
- Yokoyama, M.; Watanabe, T.; Otaki, Y.; Takahashi, H.; Arimoto, T.; Shishido, T.; Miyamoto, T.; Konta, T.; Shibata, Y.; Daimon, M.; et al. Association of the Aspartate Aminotransferase to Alanine Aminotransferase Ratio with BNP Level and Cardiovascular Mortality in the General Population: The Yamagata Study 10-Year Follow-Up. Dis. Markers 2016, 2016, 4857917. [Google Scholar] [CrossRef]
- Schmilovitz-Weiss, H.; Gingold-Belfer, R.; Boltin, D.; Beloosesky, Y.; Meyerovitch, J.; Tor, R.; Issa, N.; Grossman, A.; Koren-Morag, N.; Weiss, A. Risk of mortality and level of serum alanine aminotransferase among community-dwelling elderly in Israel. Eur. J. Gastroenterol. Hepatol. 2018, 30, 1428–1433. [Google Scholar] [CrossRef] [PubMed]
- Feng, X.; Wen, Y.; Peng, F.F.; Wang, N.; Zhan, X.; Wu, X. Association between aminotransferase/alanine aminotransferase ratio and cardiovascular disease mortality in patients on peritoneal dialysis: A multi-center retrospective study. BMC Nephrol. 2020, 21, 209. [Google Scholar] [CrossRef] [PubMed]
- Visaria, A.; Pai, S.; Fayngersh, A.; Kothari, N. Association between alanine aminotransferase within the normal range and all-cause and cause-specific mortality: A nationwide cohort study. PLoS ONE 2020, 15, e0242431. [Google Scholar] [CrossRef]
- An, S.; Yang, Y.-J.; Jeon, N.-M.; Hong, Y.-P.; Kim, Y.; Kim, D.-Y. Significantly Reduced Alanine Aminotransferase Level Increases All-Cause Mortality Rate in the Elderly after Ischemic Stroke. Int. J. Environ. Res. Public Health 2021, 18, 4915. [Google Scholar] [CrossRef] [PubMed]
- Maeda, D.; Kagiyama, N.; Jujo, K.; Saito, K.; Kamiya, K.; Saito, H.; Ogasahara, Y.; Maekawa, E.; Konishi, M.; Kitai, T.; et al. Aspartate aminotransferase to alanine aminotransferase ratio is associated with frailty and mortali-ty in older patients with heart failure. Sci. Rep. 2021, 11, 11957. [Google Scholar] [CrossRef] [PubMed]
- Nakamura, K.; Okamura, T.; Kanda, H.; Hayakawa, T.; Okayama, A.; Ueshima, H.; Health Promotion Research Committee of the Shiga National Health Insurance Organizations. The Value of Combining Serum Alanine Aminotransferase Levels and Body Mass Index to Predict Mortality and Medical Costs: A 10-year Follow-up Study of National Health Insurance in Shiga, Japan. J. Epidemiol. 2006, 16, 15–20. [Google Scholar] [CrossRef][Green Version]
- Yun, K.E.; Shin, C.Y.; Yoon, Y.S.; Park, H.S. Elevated alanine aminotransferase levels predict mortality from cardiovascular disease and diabetes in Koreans. Atherosclerosis 2009, 205, 533–537. [Google Scholar] [CrossRef]
- Shim, J.-J.; Kim, J.W.; Oh, C.H.; Lee, Y.-R.; Lee, J.S.; Park, S.-Y.; Kim, B.-H.; Oh, I.-H. Serum alanine aminotransferase level and liver-related mortality in patients with chronic hepatitis B: A large national cohort study. Liver Int. 2018, 38, 1751–1759. [Google Scholar] [CrossRef] [PubMed]
- Li, J.; Zhao, Z.; Jiang, H.; Jiang, M.; Yu, G.; Li, X. Predictive value of elevated alanine aminotransferase for in-hospital mortality in patients with acute myocardial infarction. BMC Cardiovasc. Disord. 2021, 21, 82. [Google Scholar] [CrossRef]
- Ravel, V.; Streja, E.; Molnar, M.Z.; Rezakhani, S.; Soohoo, M.; Kovesdy, C.P.; Kalantar-Zadeh, K.; Moradi, H. Association of aspartate aminotransferase with mortality in hemodialysis patients. Nephrol. Dial. Transplant. 2016, 31, 814–822. [Google Scholar] [CrossRef] [PubMed]
- Xie, K.; Chen, C.-H.; Tsai, S.-P.; Lu, P.-J.; Wu, H.; Zeng, Y.; Ye, Y.; Tu, H.; Wen, C.; Huang, M.; et al. Loss of Life Expectancy by 10 Years or More From Elevated Aspartate Aminotransferase: Finding Aspartate Aminotransferase a Better Mortality Predictor for All-Cause and Liver-Related than Alanine Aminotransferase. Am. J. Gastroenterol. 2019, 114, 1478–1487. [Google Scholar] [CrossRef]
- Shibata, M.; Nakajima, K. High Serum Aspartate Aminotransferase, Underweight, and Weight Loss in Older People: Results of the KITCHEN-4. Healthcare 2020, 8, 69. [Google Scholar] [CrossRef]
- Panteghini, M. Aspartate aminotransferase isoenzymes. Clin. Biochem. 1990, 23, 311–319. [Google Scholar] [CrossRef]
- Lala, V.; Minter, D.A. Liver Function Tests; Stat Pearls Publishing: Treasure Island, FL, USA, 2019. [Google Scholar]
- Nathwani, R.A.; Pais, S.; Reynolds, T.B.; Kaplowitz, N. Serum alanine aminotransferase in skeletal muscle diseases. Hepatology 2005, 41, 380–382. [Google Scholar] [CrossRef]
- Malakouti, M.; Kataria, A.; Ali, S.K.; Schenker, S. Elevated Liver Enzymes in Asymptomatic Patients—What Should I Do? J. Clin. Transl. Hepatol. 2017, 5, 394–403. [Google Scholar] [CrossRef]
- Tomizawa, M.; Kawanabe, Y.; Shinozaki, F.; Sato, S.; Motoyoshi, Y.; Sugiyama, T.; Yamamoto, S.; Sueishi, M. Elevated levels of alanine transaminase and triglycerides within normal limits are associated with fatty liver. Exp. Ther. Med. 2014, 8, 759–762. [Google Scholar] [CrossRef]
- Martin-Rodriguez, J.L.; Gonzalez-Cantero, J.; Gonzalez-Cantero, A.; Arrebola, J.P.; Gonzalez-Calvin, J.L. Diagnostic accuracy of serum alanine aminotransferase as biomarker for nonalcoholic fatty liver disease and insulin resistance in healthy subjects, using 3T MR spectroscopy. Medicine 2017, 96, e6770. [Google Scholar] [CrossRef]
- Liu, Z.; Que, S.; Xu, J.; Peng, T. Alanine Aminotransferase-Old Biomarker and New Concept: A Review. Int. J. Med. Sci. 2014, 11, 925–935. [Google Scholar] [CrossRef]
- Choi, Y.J.; Kwon, D.S.; Kim, T.; Cho, J.H.; Kim, H.J.; Byun, M.K.; Park, H.J. Low alanine aminotransferase as a risk factor for chronic ob-structive pulmonary disease in males. Sci. Rep. 2021, 11, 14829. [Google Scholar] [CrossRef]
- Romiti, S.; Vinciguerra, M.; Saade, W.; Cortajarena, I.A.; Greco, E. Artificial Intelligence (AI) and Cardiovascular Diseases: An Unexpected Alliance. Cardiol. Res. Pr. 2020, 2020, 4972346. [Google Scholar] [CrossRef]
- Yamato, Kanagawa. Available online: https://en.wikipedia.org/wiki/Yamato,_Kanagawa (accessed on 31 March 2022).
- Available online: https://www.kuhs.ac.jp/research/news/details_00248.html (accessed on 31 March 2022).
- Available online: http://www.city.yamato.lg.jp/web/kouhou/n20181218-2.html (accessed on 31 March 2022).
- Matsuo, S.; Imai, E.; Horio, M.; Yasuda, Y.; Tomita, K.; Nitta, K.; Yamagata, K.; Tomino, Y.; Yokoyama, H.; Hishida, A. Collaborators developing the Japanese equation for estimated GFR. Revised equations for estimated GFR from serum creatinine in Japan. Am. J. Kidney Dis. 2009, 53, 982–992. [Google Scholar] [CrossRef]
- Sony Network Communications, Prediction One. 2020. Available online: https://www.predictionone.sony.biz (accessed on 29 July 2021).
- Katsuki, M.; Kawamura, S.; Koh, A. Easily Created Prediction Model Using Automated Artificial Intelligence Framework (Predic-tion One, Sony Network Communications Inc., Tokyo, Japan) for Subarachnoid Hemorrhage Outcomes Treated by Coiling and Delayed Cerebral Ischemia. Cureus 2021, 13, e15695. [Google Scholar]
- Available online: https://towardsdatascience.com/be-careful-when-interpreting-your-features-importance-in-xgboost-6e16132588e7 (accessed on 31 March 2022).
- Casola, S. What is Explainable Artificial Intelligence, and Why Is It Important for Predictive Models? 28 September 2021. Available online: https://www.explorium.ai/blog/what-is-explainable-artificial-intelligence-and-why-is-it-important-for-predictive-models/ (accessed on 31 March 2022).
- Vilone, G.; Longo, L. Explainable Artificial Intelligence: A Systematic Review. arXiv 2006, arXiv:2006.00093. [Google Scholar]
- Available online: https://www.mhlw.go.jp/file/06-Seisakujouhou-10900000-Kenkoukyoku/00_3.pdf (accessed on 31 March 2022).
- Agarwal, N.; Acevedo, F.; Leighton, L.S.; Cayten, C.G.; Pitchumoni, C.S. Predictive ability of various nutritional variables for mortal-ity in elderly people. Am. J. Clin. Nutr. 1988, 48, 1173–1178. [Google Scholar] [CrossRef]
- Hirani, V.; Naganathan, V.; Blyth, F.; Le Couteur, D.G.; Gnjidic, D.; Stanaway, F.F.; Seibel, M.J.; Waite, L.M.; Handelsman, D.J.; Cumming, R.G. Multiple, but not traditional risk factors predict mortality in older people: The concord health and ageing in men project. AGE 2014, 36, 9732. [Google Scholar] [CrossRef] [PubMed]
- Landi, F.; Cruz-Jentoft, A.J.; Liperoti, R.; Russo, A.; Giovannini, S.; Tosato, M.; Capoluongo, E.D.; Bernabei, R.; Onder, G. Sarcopenia and mortality risk in frail older persons aged 80 years and older: Results from ilSIRENTE study. Age Ageing 2013, 42, 203–209. [Google Scholar] [CrossRef]
- Chang, S.; Lin, P. Systematic Literature Review and Meta-Analysis of the Association of Sarcopenia with Mortality. Worldviews Evid.-Based Nurs. 2016, 13, 153–162. [Google Scholar] [CrossRef]
- Landi, F.; Calvani, R.; Cesari, M.; Tosato, M.; Martone, A.M.; Ortolani, E.; Savera, G.; Salini, S.; Sisto, A.; Picca, A.; et al. Sarcopenia: An Overview on Current Definitions, Diagnosis and Treatment. Curr. Protein Pept. Sci. 2018, 19, 633–638. [Google Scholar] [CrossRef] [PubMed]
- Rustani, K.; Kundisova, L.; Capecchi, P.L.; Nante, N.; Bicchi, M. Ultrasound measurement of rectus femoris muscle thickness as a quick screening test for sarcopenia assessment. Arch. Gerontol. Geriatr. 2019, 83, 151–154. [Google Scholar] [CrossRef] [PubMed]
- Berg, H.E.; Truong, D.; Skoglund, E.; Gustafsson, T.; Lundberg, T.R. Threshold-automated CT measurements of muscle size and radiological attenuation in multiple lower-extremity muscles of older individuals. Clin. Physiol. Funct. Imaging 2020, 40, 165–172. [Google Scholar] [CrossRef]
- Meerkerk, C.D.A.; Chargi, N.; de Jong, P.A.; Bos, F.V.D.; de Bree, R. Low skeletal muscle mass predicts frailty in elderly head and neck cancer patients. Eur. Arch. Oto-Rhino-Laryngol. 2021, 279, 967–977. [Google Scholar] [CrossRef]
- Cederholm, T. Overlaps between Frailty and Sarcopenia Definitions. Nutr. Support Infants Child. Risk 2015, 83, 65–70. [Google Scholar] [CrossRef]
- Wu, W.C.; Wu, C.Y.; Wang, Y.J.; Hung, H.H.; Yang, H.I.; Kao, W.Y.; Su, C.W.; Wu, J.C.; Chan, W.L.; Lin, H.C.; et al. Updated thresh-olds for serum alanine aminotransferase level in a large-scale population study composed of 34 346 subjects. Aliment. Pharmacol. Ther. 2012, 36, 560–568. [Google Scholar] [CrossRef]
- Kolahdoozan, S.; Mirminachi, B.; Sepanlou, S.G.; Malekzadeh, R.; Merat, S.; Poustchi, H. Upper Normal Limits of Serum Alanine Aminotransferase in Healthy Population: A Systematic Review. Middle East J. Dig. Dis. 2020, 12, 194–205. [Google Scholar] [CrossRef] [PubMed]
- Dong, M.H.; Bettencourt, R.; Barrett-Connor, E.; Loomba, R. Alanine Aminotransferase Decreases with Age: The Rancho Bernardo Study. PLoS ONE 2010, 5, e14254. [Google Scholar] [CrossRef] [PubMed]
- Vespasiani-Gentilucci, U.; Gallo, P.; Piccinocchi, G.; Piccinocchi, R.; Schena, E.; Galati, G.; De Vincentis, A.; Dell’Unto, C.; Picardi, A. De-terminants of alanine aminotransferase levels in a large population from Southern Italy: Relationship between alanine ami-notransferase and age. Dig. Liver Dis. 2014, 46, 909–915. [Google Scholar] [CrossRef] [PubMed]
- Shibata, M.; Nakajima, K.; Higuchi, R.; Iwane, T.; Sugiyama, M.; Nakamura, T. High Concentration of Serum Aspartate Ami-notransferase in Older Underweight People: Results of the Kanagawa Investigation of the Total Check-Up Data from the Na-tional Database-2 (KITCHEN-2). J. Clin. Med. 2019, 8, 1282. [Google Scholar] [CrossRef] [PubMed]
- Shepard, C.W.; Finelli, L.; Alter, M.J. Global epidemiology of hepatitis C virus infection. Lancet Infect. Dis. 2005, 5, 558–567. [Google Scholar] [CrossRef]
- Tanaka, J.; Koyama, T.; Mizui, M.; Uchida, S.; Katayama, K.; Matsuo, J.; Akita, T.; Nakashima, A.; Miyakawa, Y.; Yoshizawa, H. Total Numbers of Undiagnosed Carriers of Hepatitis C and B Viruses in Japan Estimated by Age- and Area-Specific Prevalence on the National Scale. Intervirology 2011, 54, 185–195. [Google Scholar] [CrossRef]
- Hagiya, H.; Koyama, T.; Deguchi, M.; Minato, Y.; Miura, S.; Funahashi, T.; Teratani, Y.; Zamami, Y.; Shinomiya, K.; Kitamura, Y.; et al. Trends in hepatitis C virus-associated mortality rates in Japan, 1998–2017. J. Gastroenterol. Hepatol. 2021, 36, 2486–2492. [Google Scholar] [CrossRef] [PubMed]
- Ngiam, K.Y.; Khor, I.W. Big data and machine learning algorithms for health-care delivery. Lancet Oncol. 2019, 20, e262–e273. [Google Scholar] [CrossRef]
Publisher’s Note: MDPI stays neutral with regard to jurisdictional claims in published maps and institutional affiliations. |
© 2022 by the authors. Licensee MDPI, Basel, Switzerland. This article is an open access article distributed under the terms and conditions of the Creative Commons Attribution (CC BY) license (https://creativecommons.org/licenses/by/4.0/).