
Are Subjective Intensities Indicators of Player Load and Heart Rate in Physical Education?


Abstract
:1. Introduction
2. Materials and Methods
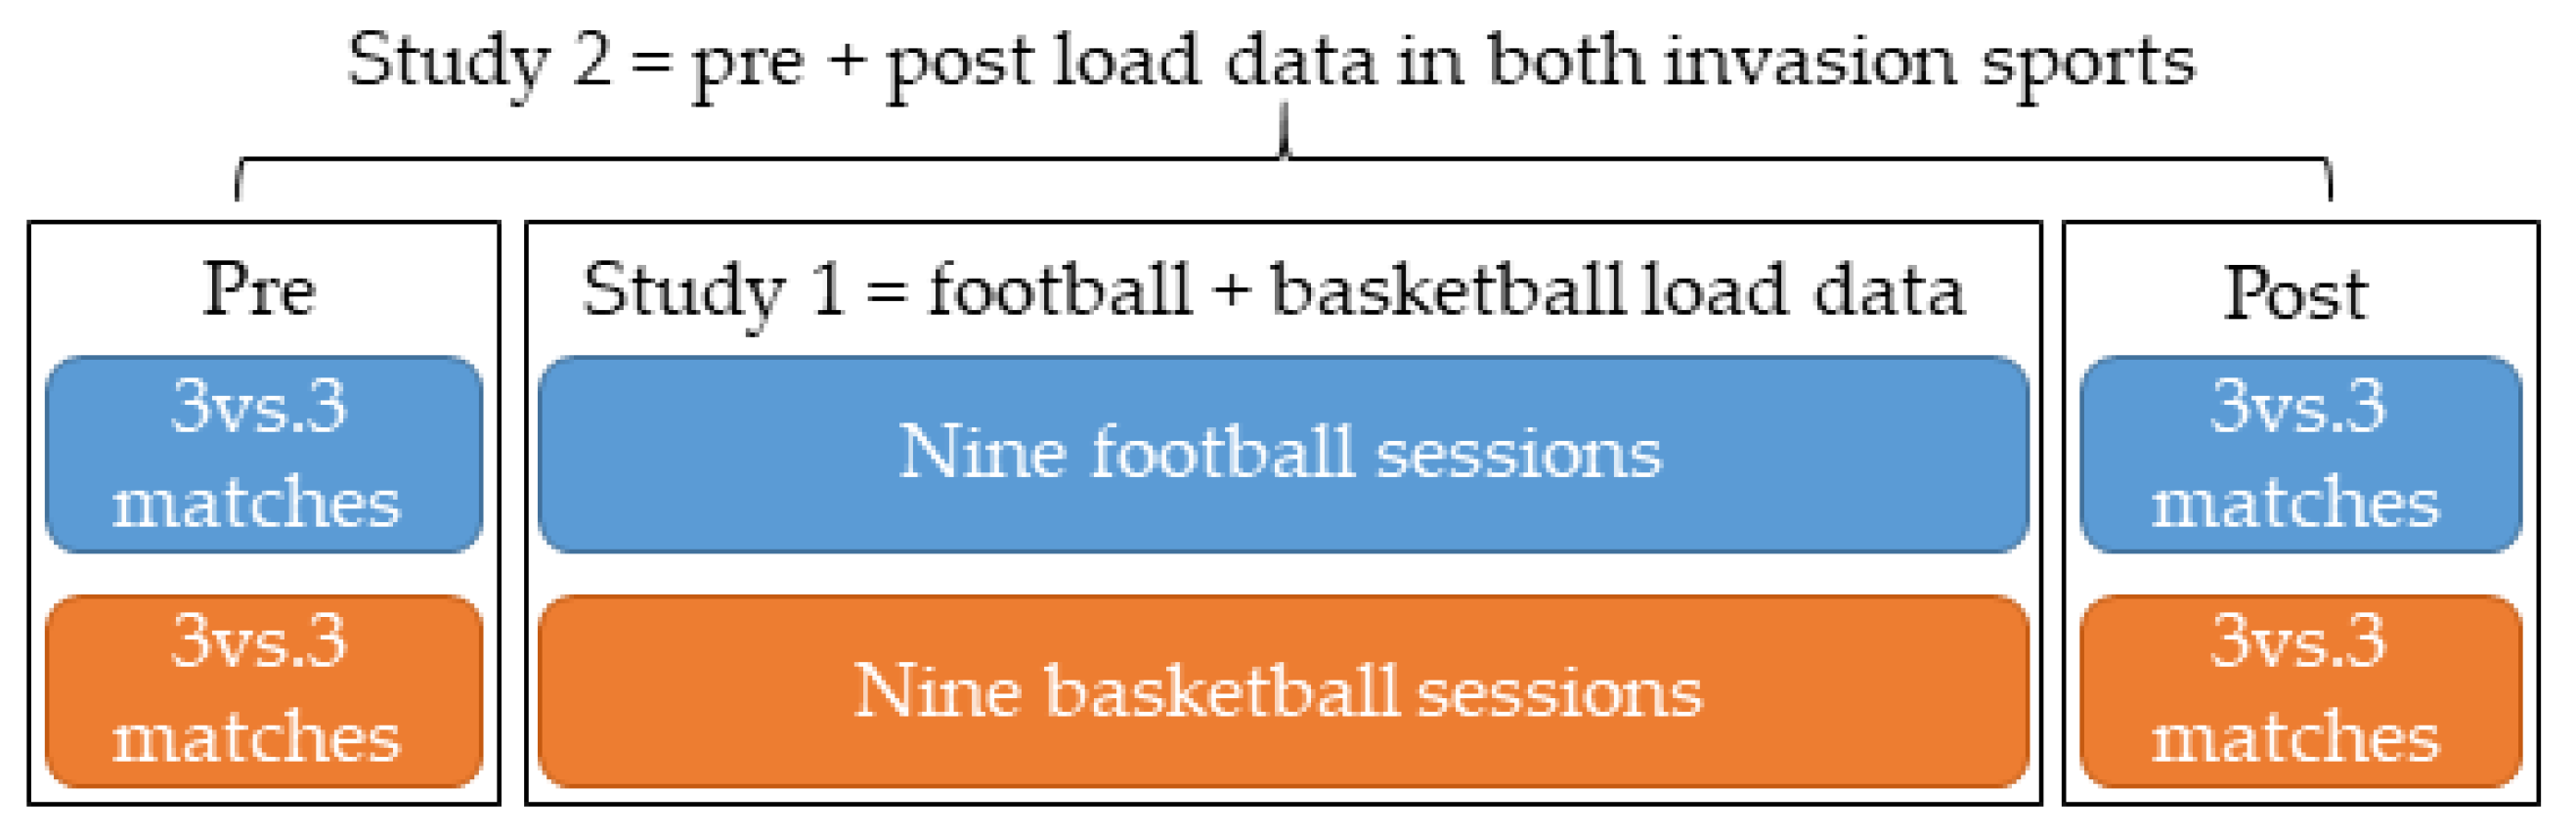
2.1. Study Design
2.2. Sample
2.3. Variables and Instruments
- -
- Objective eTL variables: (1) PL; and (2) PL per minute (PL/min). These neuromuscular eTL variables were measured using WIMU ProTM inertial devices (RealTrack System, Almería, Spain). PL was measured only during the time of motor commitment in order to eliminate distorting values, such as PL during rest periods.
- -
- Subjective eTL variables: (1) density of task, categorical–ordinal variable with five levels: 1-walking; 2-gentle pace; 3-intensity with rest; 4-intensity without rest; and 5-high intensity without rest. In Study 1, the variability of the learning tasks applied involved a different level for each task type. In contrast, the 3 vs. 3 game situations involved only one level in Study 2. (2) eTL, obtained by the sum of the values (1 to 5) given to six categorical–ordinal variables when categorizing tasks: degree of opposition, task density, percentage of simultaneous performers, competitive load, game space, and cognitive involvement. Thus, the eTL value for each learning task ranges from 6 to 30. (3) eTL*minute (eTL*min): these variables were measured through the SIATE observation sheet [21].
- -
- Objective iTL variables: (1) average HR (HRavg); and (2) maximum HR (HRmax). These were measured with GARMINTM HR monitors (Garmin Ltd., Olathe, KS, USA), synchronized with the above-mentioned inertial devices through Ant+ technology [31]. HR was also measured only during the time of motor commitment.
- -
- Only in study 2 was subjective iTL (psycho-physiological demands) measured using the curvilinear pictorial scale with graphic illustrations [23], which represents the RPE.
2.4. Procedure
2.5. Statistical Analyses
3. Results
4. Discussion
5. Limitations and Practical Applications
6. Conclusions
Author Contributions
Funding
Institutional Review Board Statement
Informed Consent Statement
Data Availability Statement
Acknowledgments
Conflicts of Interest
References
- García-Ceberino, J.M.; Antúnez, A.; Feu, S.; Ibáñez, S.J. Quantification of Internal and External Load in School Football According to Gender and Teaching Methodology. Int. J. Environ. Res. Public Health 2020, 17, 344. [Google Scholar] [CrossRef] [PubMed] [Green Version]
- González-Espinosa, S.; Antúnez, A.; Feu, S.; Ibáñez, S.J. Monitoring the External and Internal Load under 2 Teaching Methodologies. J. Strength Cond. Res. 2020, 34, 2920–2928. [Google Scholar] [CrossRef] [PubMed]
- García-Ceberino, J.M.; Gamero, M.G.; González-Espinosa, S.; García-Rubio, J.; Feu, S. Study of the external training load of tasks for the teaching of handball in pre-service teachers according to their genre. E-Balonamo Com 2018, 14, 45–54. [Google Scholar]
- Sierra, R. Formación docente para el control de la carga en la clase de educación física. Rev. Investig. Educ. 2005, 2, 33–48. [Google Scholar]
- García-Ceberino, J.M.; Feu, S.; Gamero, M.G.; Ibáñez, S.J. Pedagogical Variables and Motor Commitment in the Planning of Invasion Sports in Primary Education. Sustainability 2021, 13, 4529. [Google Scholar] [CrossRef]
- Aznar, S.; Webster, T. Actividad Física y Salud en la Infancia y la Adolescencia. Guía para Todas las Personas que Participan en su Educación; Ministerio de Educacion y Cultura, Centro de Investigación y Documentación Educativa: Madrid, Spain, 2009. [Google Scholar]
- García-Ceberino, J.M.; Feu, S.; Antúnez, A.; Ibáñez, S. Organization of Students and Total Task Time: External and Internal Load Recorded during Motor Activity. Appl. Sci. 2021, 11, 10940. [Google Scholar] [CrossRef]
- World Organization Health. Physical Activity. Available online: https://www.who.int/news-room/fact-sheets/detail/physical-activity (accessed on 20 January 2022).
- Oliveira, R.; Brito, J.P.; Moreno-Villanueva, A.; Nalha, M.; Rico-González, M.; Clemente, F.M. Reference Values for External and Internal Training Intensity Monitoring in Young Male Soccer Players: A Systematic Review. Healthcare 2021, 9, 1567. [Google Scholar] [CrossRef]
- Nobari, H.; Brito, J.P.; Pérez-Gómez, J.; Oliveira, R. Variability of External Intensity Comparisons between Official and Friendly Soccer Matches in Professional Male Players. Healthcare 2021, 9, 1708. [Google Scholar] [CrossRef]
- Staunton, C.A.; Abt, G.; Weaving, D.; Wundersitz, D.W.T. Misuse of the term ‘load’ in sport and exercise science. J. Sci. Med. Sport 2021, in press. [CrossRef]
- Reina, M.; Mancha-Triguero, D.; García-Santos, D.; García-Rubio, J.; Ibáñez, S.J. Comparación de tres métodos de cuantificación de la carga de entrenamiento en baloncesto. RICYDE Rev. Int. Cienc. Deporte 2019, 15, 368–382. [Google Scholar] [CrossRef]
- Gómez-Carmona, C.D.; Gamonales, J.M.; Feu, S.; Ibáñez, S.J. Estudio de la carga interna y externa a través de diferentes instrumentos. Un estudio de casos en fútbol formativo. Sport. Sci. J. 2019, 5, 444–468. [Google Scholar] [CrossRef] [Green Version]
- Gómez-Carmona, C.D.; Bastida-Castillo, A.; Ibáñez, S.J.; Pino-Ortega, J. Accelerometry as a method for external workload monitoring in invasion team sports. A systematic review. PLoS ONE 2020, 15, e0236643. [Google Scholar] [CrossRef] [PubMed]
- Buchheit, M.; Lacome, M.; Cholley, Y.; Simpson, B. Neuromuscular Responses to Conditioned Soccer Sessions Assessed via GPS-Embedded Accelerometers: Insights into Tactical Periodization. Int. J. Sports Physiol. Perform. 2018, 13, 577–583. [Google Scholar] [CrossRef] [PubMed]
- Fox, J.L.; Stanton, R.; Sargent, C.; Wintour, S.A.; Scanlan, A.T. The Association between Training Load and Performance in Team Sports: A Systematic Review. Sports Med. 2018, 48, 2743–2774. [Google Scholar] [CrossRef]
- Silva, P.; Dos Santos, E.; Grishin, M.; Rocha, J.M. Validity of Heart Rate-Based Indices to Measure Training Load and Intensity in Elite Football Players. J. Strength Cond. Res. 2018, 32, 2340–2347. [Google Scholar] [CrossRef]
- Gabbett, T.J. The training—Injury prevention paradox: Should athletes be training smarter and harder? Br. J. Sports Med. 2016, 50, 273–280. [Google Scholar] [CrossRef] [Green Version]
- Schelling, X.; Torres-Ronda, L. An Integrative Approach to Strength and Neuromuscular Power Training for Basketball. Strength Cond. J. 2016, 38, 72–80. [Google Scholar] [CrossRef]
- Reche-Soto, P.; Cardona, D.; Díaz, A.; Gómez-Carmona, C.D.; Pino-Ortega, J. Acelt y player load: Dos Variables para la Cuantificación de la Carga Neuromuscular/acelt and player load: Two Variables to Quanty Neuromuscular Load. Rev. Int. Med. Cienc. Act. Fís. Deporte 2020, 20, 167–183. [Google Scholar]
- Ibáñez, S.J.; Feu, S.; Cañadas, M. Sistema integral para el análisis de las tareas de entrenamiento, SIATE, en deportes de invasión. E-Balonamo Com 2016, 12, 3–30. [Google Scholar]
- Borg, G. Borg’s Perceived Exertion and Pain Scales; Human Kinetics: Champaign, IL, USA, 1998. [Google Scholar]
- Eston, R.G.; Parfitt, C.G. Effort Perception. In Paediatric Exercise Physiology; Armstrong, N., Ed.; Elsevier: London, UK, 2007; pp. 275–297. [Google Scholar]
- López, A.T. Propuesta de control de la carga de entrenamiento y la fatiga en equipos sin medios económicos. Rev. Esp. Educ. Fís. Deportes 2017, 417, 55–69. [Google Scholar]
- Lovell, T.W.J.; Sirotic, A.C.; Impellizzeri, F.M.; Coutts, A.J. Factors Affecting Perception of Effort (Session Rating of Perceived Exertion) during Rugby League Training. Int. J. Sports Physiol. Perform. 2013, 8, 62–69. [Google Scholar] [CrossRef] [Green Version]
- Thomas, J.R.; Nelson, J.K.; Silverman, S.J. Research Methods in Physical Activity, 7th ed.; Human Kinetics: Champaign, IL, USA, 2015. [Google Scholar]
- García-Ceberino, J.M.; Feu, S.; Ibáñez, S.J. Comparative Study of Two Intervention Programmes for Teaching Soccer to School-Age Students. Sports 2019, 7, 74. [Google Scholar] [CrossRef] [PubMed] [Green Version]
- García-Ceberino, J.M.; Antúnez, A.; Feu, S.; Ibáñez, S.J. Validación de dos programas de intervención para la enseñanza del fútbol escolar/Validation of Two Intervention Programs for Teaching School Soccer. Rev. Int. Med. Cienc. Act. Fís. Deporte 2020, 20, 257–274. [Google Scholar]
- González-Espinosa, S.; Ibáñez, S.J.; Feu, S. Design of two basketball teaching programs in two different teaching methods. E-Balonamo Com 2017, 13, 131–152. [Google Scholar]
- González-Espinosa, S.; Ibáñez, S.J.; Feu, S.; Galatti, L.R. Programas de intervención para la enseñanza deportiva en el contexto escolar, PETB y PEAB: Estudio preliminar. Retos-Nuevas Tend. Educ. Fís. Deporte Recreación 2017, 31, 107–113. [Google Scholar]
- Molina-Carmona, I.; Gomez-Carmona, C.D.; Bastida-Castillo, A.; Pino-Ortega, J. Validez del dispositivo inercial WIMU PROTM para el registro de la frecuencia cardíaca en un test de campo. Sport-TK Rev. Euroam. Cienc. Deporte 2018, 7, 81–86. [Google Scholar] [CrossRef]
- White, A.; Hills, S.P.; Cooke, C.B.; Batten, T.; Kilduff, L.P.; Cook, C.J.; Roberts, C.; Russell, M. Match-Play and Performance Test Responses of Soccer Goalkeepers: A Review of Current Literature. Sports Med. 2018, 48, 2497–2516. [Google Scholar] [CrossRef] [Green Version]
- Murillo-Lorente, V.; Álvarez-Medina, J.; Manomelles-Marqueta, P. Control training loads through perceived exertion. Prediction of heart rate. Retos-Nuevas Tend. Educ. Fís. Deporte Recreación 2016, 30, 82–86. [Google Scholar]
- Field, A. Discovering Statistics Using SPSS Statistics, 4th ed.; Sage Publications Ltd.: London, UK, 2013. [Google Scholar]
- Martínez, R.M.; Tuya, L.C.; Martínez, M.; Pérez, A.; Cánovas, A.M. El coeficiente de correlación de los rangos de Spearman caracterizacion. Rev. Habanera Cienc. Méd. 2009, 8, 1–19. [Google Scholar]
- Buceta, J.M. Psicología del Entrenamiento Deportivo; Dykinson: Madrid, Spain, 1998. [Google Scholar]
- Gamero, M.G.; García-Ceberino, J.M.; Feu, S.; Antúnez, A. Estudio de las variables pedagógicas en tareas de enseñanza del fútbol en función de la parte de sesión. Sport-TK Rev. Euroam. Cienc. Deporte 2019, 8, 39–46. [Google Scholar] [CrossRef]
- Gamero, M.G.; García-Ceberino, J.M.; Reina, M.; Feu, S.; Antúnez, A. Study of the pedagogical variables of basketball tasks by game phase. Retos-Nuevas Tend. Educ. Fís. Deporte Recreación 2020, 37, 552–558. [Google Scholar]
- García-Ceberino, J.M.; Gamero, M.G.; Gómez-Carmona, C.D.; Antúnez, A.; Feu, S. Incidence of organizational parameters in the quantification of the external training load of the tasks designed for teaching of the school basketball. Rev. Psicol. Deporte 2019, 28, 35–41. [Google Scholar]
- García-Ceberino, J.M.; Gamero, M.G.; Reina, M.; Feu, S.; Ibáñez, S.J. Study of external load in basketball tasks based on game phases. Retos-Nuevas Tend. Educ. Fís. Deporte Recreación 2020, 37, 536–541. [Google Scholar]
- Borresen, J.; Ian Lambert, M. The Quantification of Training Load, the Training Response and the Effect on Performance. Sports Med. 2009, 39, 779–795. [Google Scholar] [CrossRef]
- Fanchini, M.; Azzalin, A.; Castagna, C.; Schena, F.; Impellizzeri, F. Effect of bout duration on exercise intensity and technical performance of small-sided games in soccer. J. Strength Cond. Res. 2011, 25, 453–458. [Google Scholar] [CrossRef]
- Alexiou, H.; Coutts, A.J. A comparison of methods used for quantifying internal training load in women soccer players. Int. J. Sports Physiol. Perform. 2008, 3, 320–330. [Google Scholar] [CrossRef] [Green Version]
- McLaren, S.J.; Macpherson, T.W.; Coutts, A.J.; Hurst, C.; Spears, I.R.; Weston, M. The Relationships between Internal and External Measures of Training Load and Intensity in Team Sports: A Meta-Analysis. Sports Med. 2018, 48, 641–658. [Google Scholar] [CrossRef] [Green Version]
- Abbott, W.; Brickley, G.; Smeeton, N.J. Positional Differences in GPS Outputs and Perceived Exertion during Soccer Training Games and Competition. J. Strength Cond. Res. 2018, 32, 3222–3231. [Google Scholar] [CrossRef]
- Akenhead, R.; Hayes, P.R.; Thompson, K.G.; French, D. Diminutions of acceleration and deceleration output during professional football match play. J. Sci. Med. Sport 2013, 16, 556–561. [Google Scholar] [CrossRef]
- Sampaio, J.; McGarry, T.; Calleja-González, J.; Sáiz, S.J.; Schelling, X.; Balciunas, M. Exploring game performance in the National Basketball Association using player tracking data. PLoS ONE 2015, 10, e0132894. [Google Scholar] [CrossRef] [Green Version]
- Ballesta, A.S.; Abrunedo, J.; Caparros, T. Accelerometry in Basketball. Study of External Load during Training. Apunts Educ. Fís. Deportes 2019, 135, 100–117. [Google Scholar]


| Study | Task Type | Example | Soccer | Basketball | ||
|---|---|---|---|---|---|---|
| % | eTLavg | % | eTLavg | |||
| Study 1 Tasks with different subjective eTL | Without Opposition | 1 vs. 0… | 39.90 | 10.85 | 56.50 | 12.03 |
| Individual Game | 1 vs. 1 | 28.30 | 17.83 | 15.70 | 19.52 | |
| Inequality SSG | 2 vs. 1… | 25.10 | 20.84 | 17.80 | 19.17 | |
| Equality SSG | 2 vs. 2… | 1.80 | 17.00 | 5.70 | 21.48 | |
| Full Game | 5 vs. 5 | 4.90 | 28.64 | 4.30 | 24.66 | |
| Study 2 3 vs. 3 with same subjective eTL | Equality SSG | 3 vs. 3 | 100.00 | 28 | 100.00 | 28.00 |
| Demographic Data | Study 1 Tasks with Different Subjective eTL | Study 2 3 vs. 3 with Same Subjective eTL | ||
|---|---|---|---|---|
| School, grade | School 1, 5th PE | School 2, 6th PE | School 1, 5th PE | School 2, 6th PE |
| Students, girls | 40, 18 girls | 55, 32 girls | 33, 16 girls | 48, 25 girls |
| Years (M ± SD) | 10.65 ± 0.48 | 11.09 ± 0.29 | 10.67 ± 0.48 | 11.10 ± 0.31 |
| Intensity | Variable | Unit | Description | Instrument |
|---|---|---|---|---|
| eTL (objective) | PL | Arbitrary units (per min) | Neuromuscular eTL resulting from accelerations | WIMU ProTM |
| PL/min | ||||
| eTL (subjective) | Task density | Scale 1 to 5 | Intensity of the learning task | SIATE observation sheet |
| Task eTL | Number 6 to 30 (per min) | Intensity resulting from the sum of six categorical variables | ||
| eTL*min | ||||
| iTL (objective) | HRavg | Beats per minute | Number (average/maximum) of beats per minute | GARMINTM monitors |
| HRmax | ||||
| iTL (subjective) | RPE | Scale 1 to 10 | Perception of one’s own effort | CPS (graphics) |
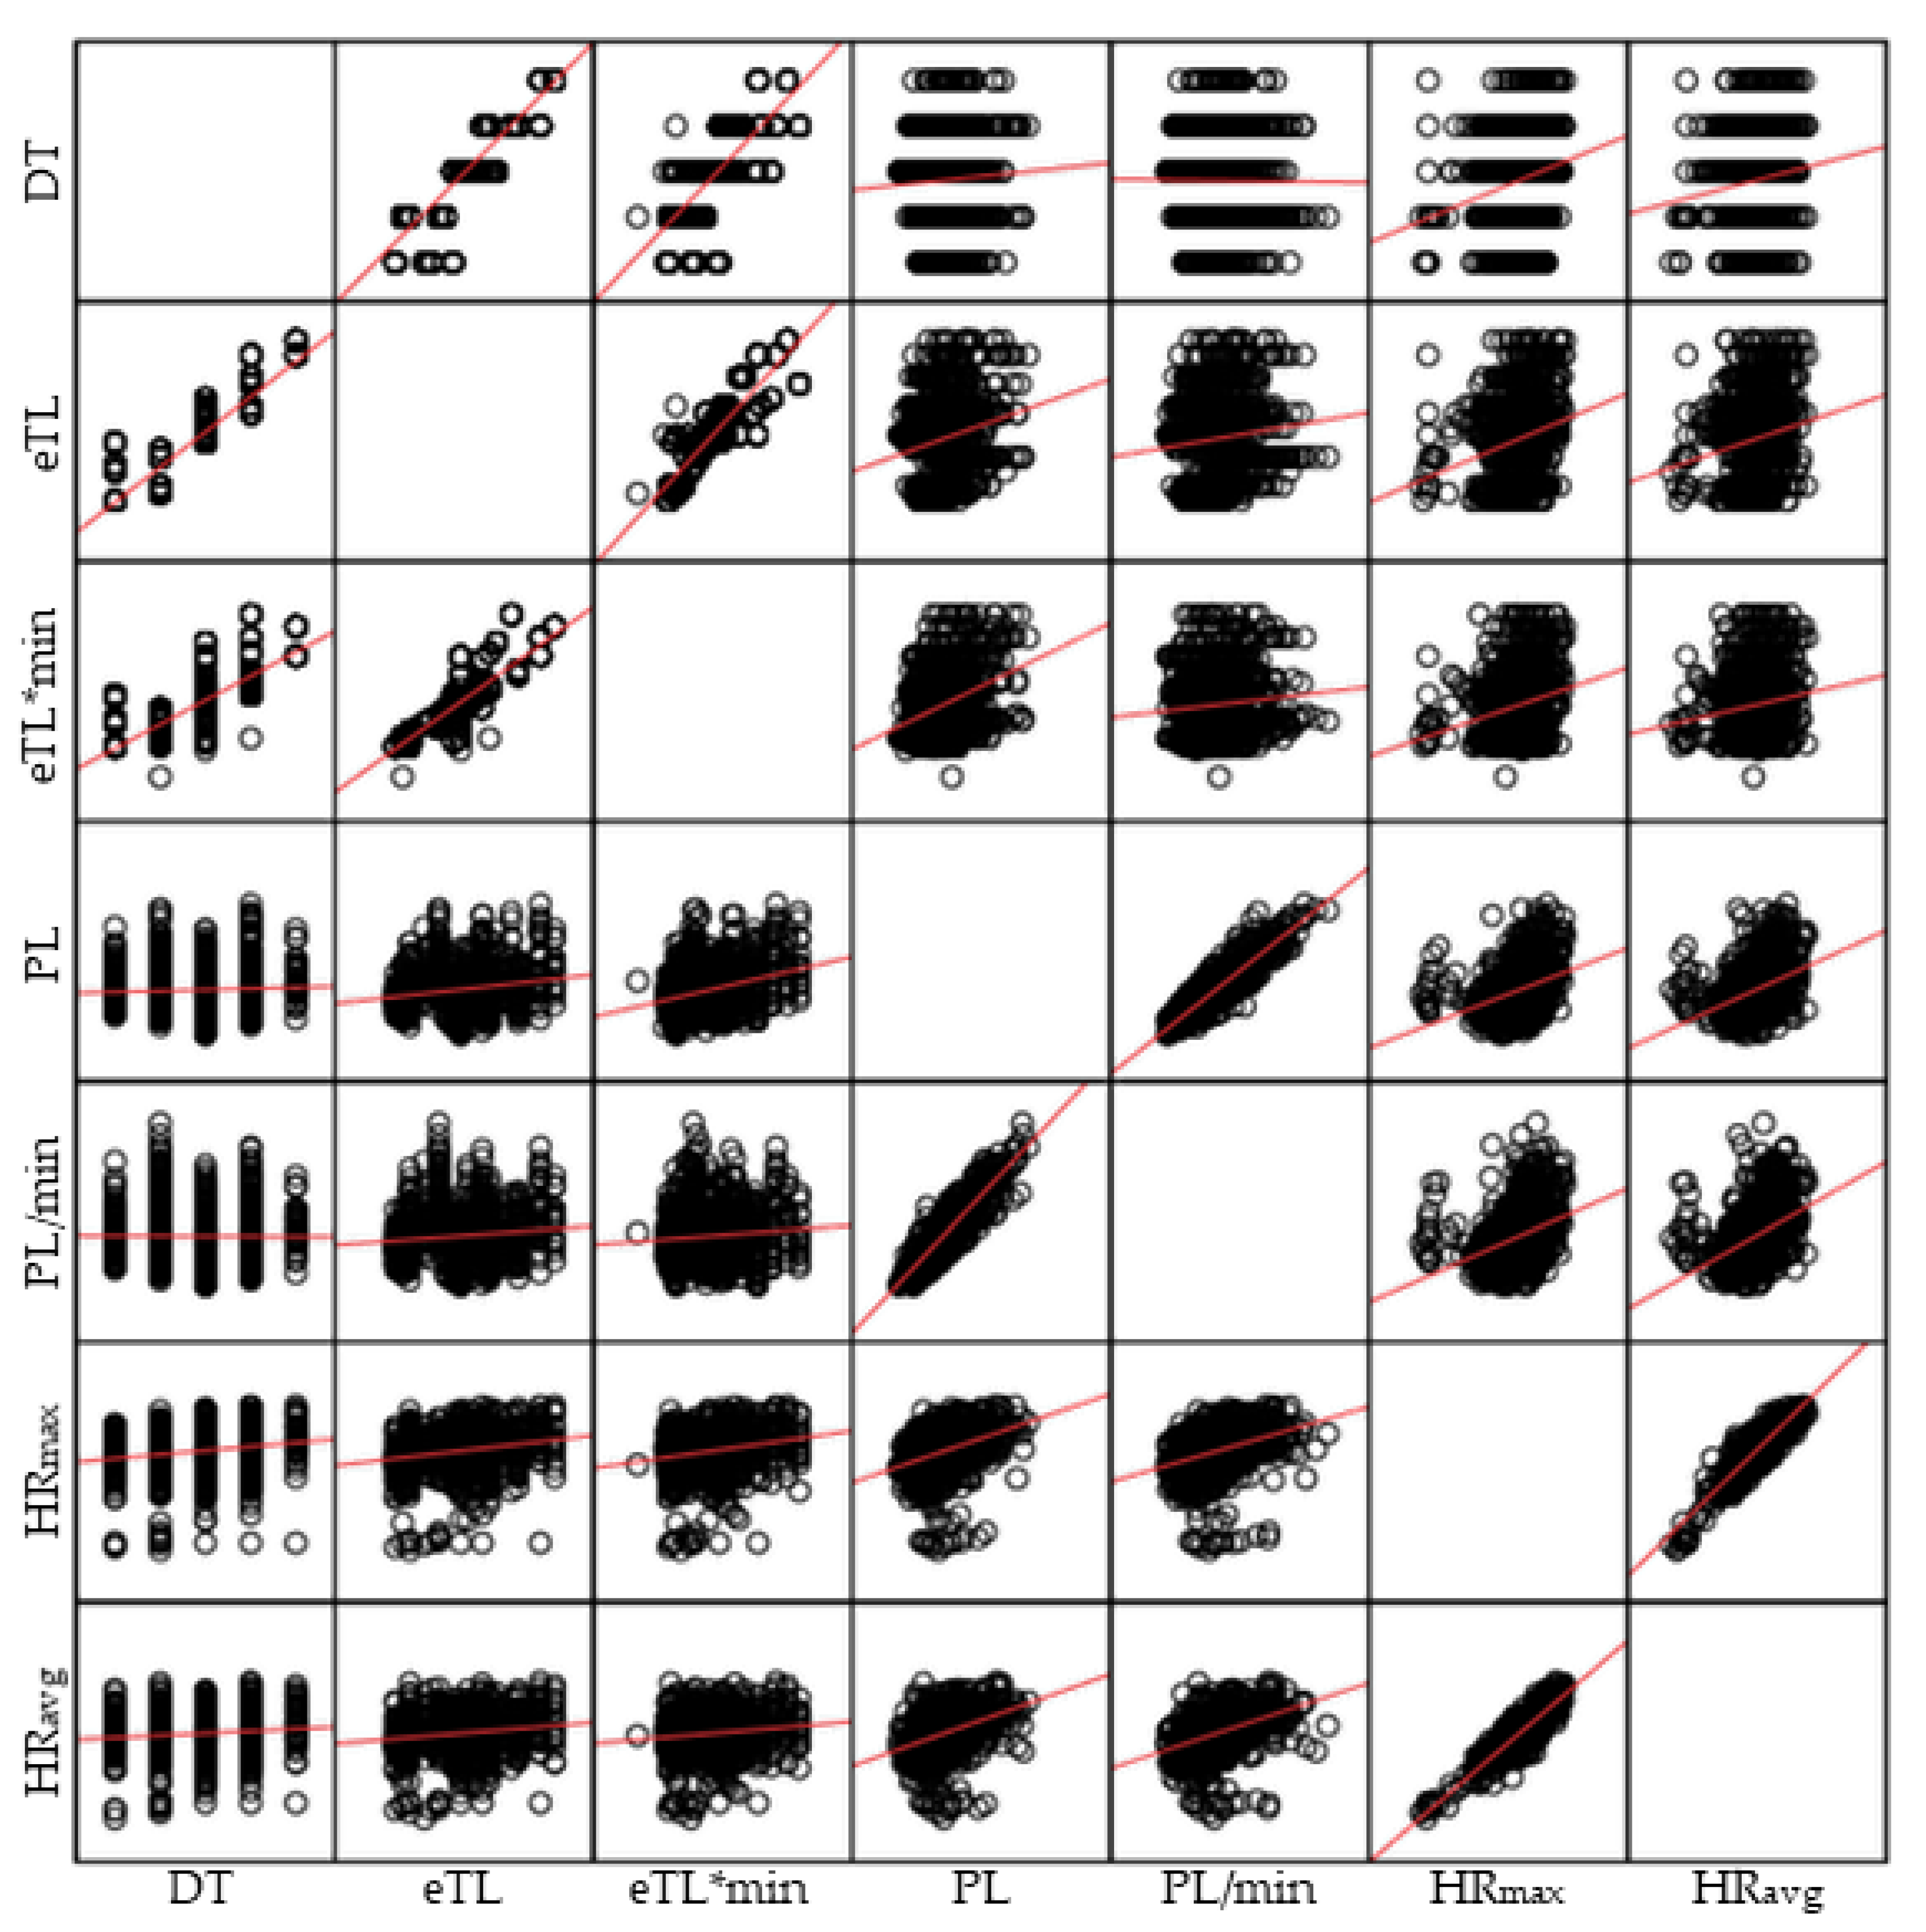
| Intensity | Spearman’s Rho | Objective iTL | Objective eTL | Subjective eTL | |||
|---|---|---|---|---|---|---|---|
| HRavg | HRmax | PL/min | PL | eTL*min | eTL | ||
| TD | r | 0.26 ** | 0.31 ** | 0.23 ** | 0.30 ** | 0.78 ** | 0.87 ** |
| p | 0.00 | 0.00 | 0.00 | 0.00 | 0.00 | 0.00 | |
| n | 3205 | 3175 | 3273 | 3273 | 1088 | 1480 | |
| eTL | r | 0.26 ** | 0.33 ** | 0.24 ** | 0.36 ** | 0.89 ** | |
| p | 0.00 | 0.00 | 0.00 | 0.00 | 0.00 | ||
| n | 3205 | 3175 | 3273 | 3273 | 1088 | ||
| eTL*min | r | 0.12 ** | 0.22 ** | 0.09 * | 0.27 ** | ||
| p | 0.00 | 0.00 | 0.02 | 0.00 | |||
| n | 1031 | 1031 | 1088 | 1088 | |||
| PL | r | 0.47 ** | 0.53 ** | 0.66 ** | |||
| p | 0.00 | 0.00 | 0.00 | ||||
| n | 3175 | 3175 | 3273 | ||||
| PL/min | r | 0.57 ** | 0.51 ** | ||||
| p | 0.00 | 0.00 | |||||
| n | 3175 | 3175 | |||||
| HRmax | r | 0.88 ** | |||||
| p | 0.00 | ||||||
| n | 3175 | ||||||
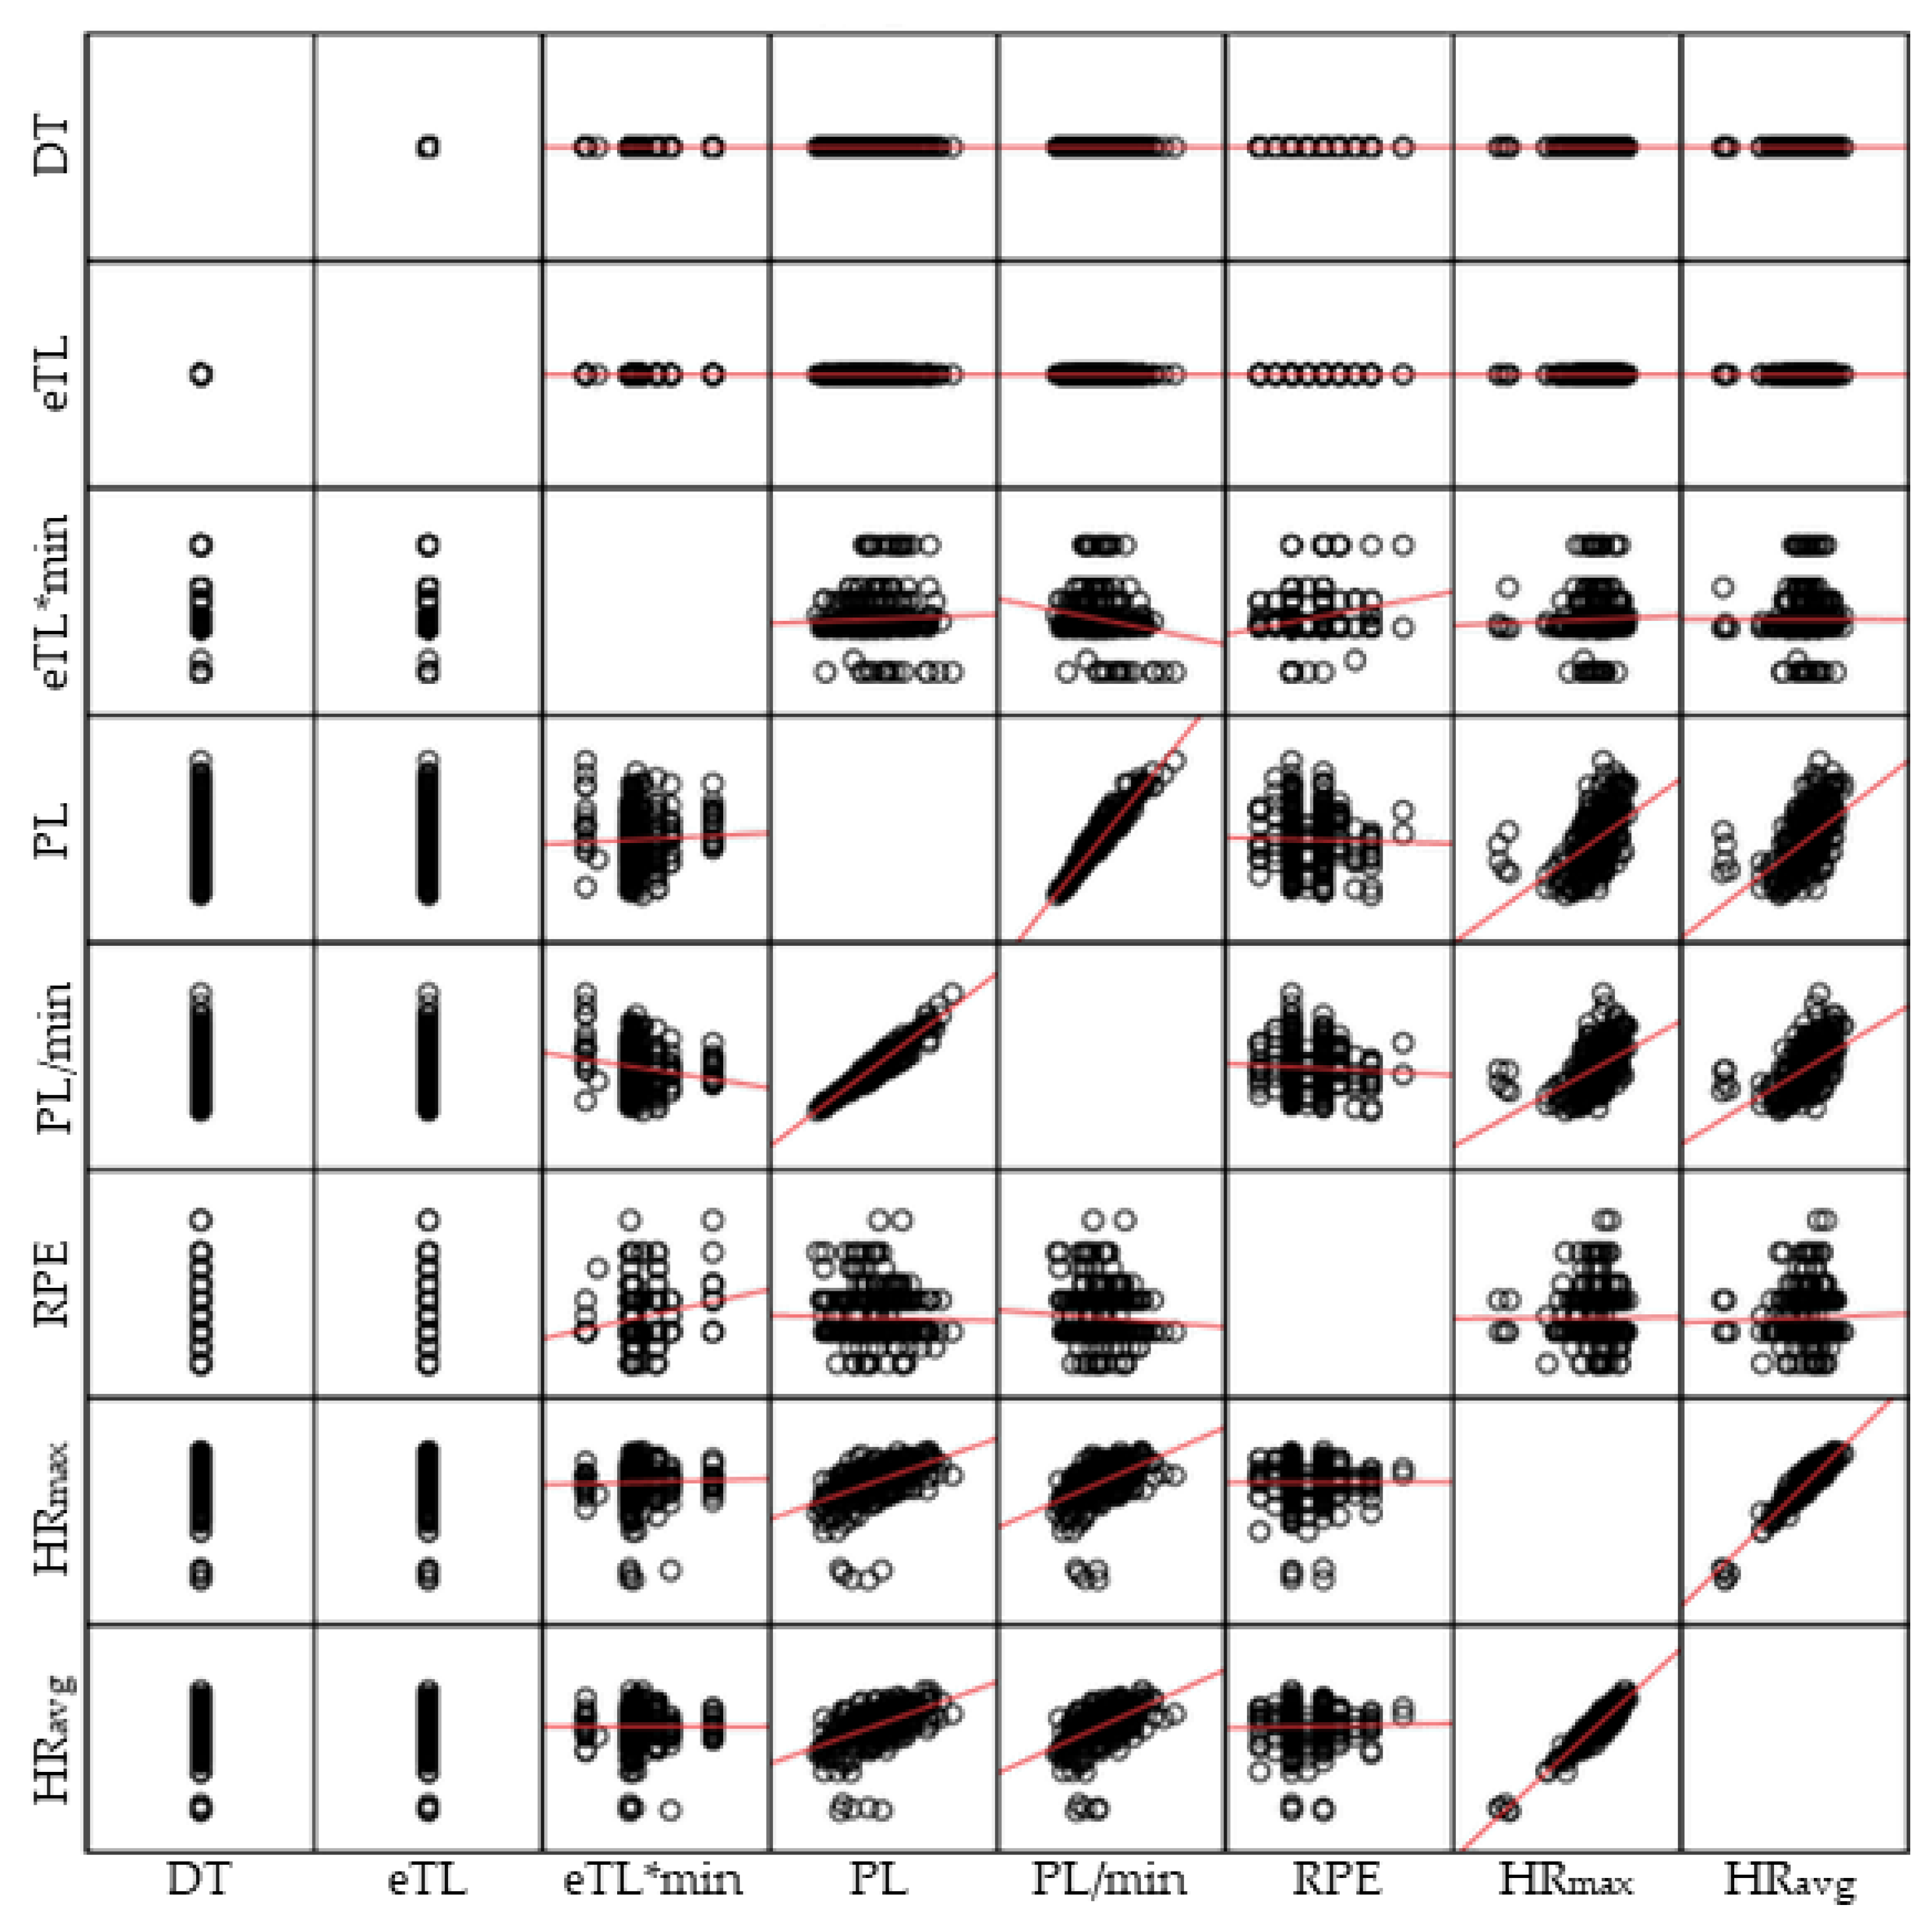
| Intensity | Spearman’s Rho | Ob. iTL | Sub. iTL | Ob. eTL | Sub. eTL | |||
|---|---|---|---|---|---|---|---|---|
| HRavg | HRmax | RPE | PL/min | PL | eTL/min | eTL | ||
| TD | r | 0.15 ** | 0.11 ** | - | 0.04 | 0.06 | 0.60 ** | 1.0 ** |
| p | 0.00 | 0.00 | - | 0.27 | 0.09 | 0.00 | - | |
| n | 711 | 711 | 674 | 722 | 722 | 400 | 728 | |
| eTL | r | 0.15 ** | 0.11 ** | - | 0.04 | 0.06 | 0.60 ** | |
| p | 0.00 | 0.00 | - | 0.27 | 0.09 | 0.00 | ||
| n | 711 | 711 | 674 | 722 | 722 | 400 | ||
| eTL*min | r | 0.12 * | 0.13 ** | 0.08 | −0.19 ** | −0.08 | ||
| p | 0.02 | 0.01 | 0.15 | 0.00 | 0.13 | |||
| n | 390 | 390 | 346 | 400 | 400 | |||
| PL | r | 0.61 ** | 0.54 ** | 0.21 ** | 0.94 ** | |||
| p | 0.00 | 0.00 | 0.00 | 0.00 | ||||
| n | 805 | 805 | 668 | 817 | ||||
| PL/min | r | 0.57 ** | 0.53 ** | 0.15 ** | ||||
| p | 0.00 | 0.00 | 0.00 | |||||
| n | 805 | 805 | 668 | |||||
| RPE | r | 0.14 ** | 0.08 | |||||
| p | 0.00 | 0.05 | ||||||
| n | 658 | 658 | ||||||
| HRmax | r | 0.91 ** | ||||||
| p | 0.00 | |||||||
| n | 805 | |||||||
| HRavg | HRmax M(SD) | RPE | Borg Scale Equivalence | Approximate in bpm | Degree of Stress Intensity (% of max. Capacity) |
|---|---|---|---|---|---|
| 170.51 (22.18) | 188.33 (21.37) | 3.40 (1.86) | Fairly light | 110–130 | 30 |
Publisher’s Note: MDPI stays neutral with regard to jurisdictional claims in published maps and institutional affiliations. |
© 2022 by the authors. Licensee MDPI, Basel, Switzerland. This article is an open access article distributed under the terms and conditions of the Creative Commons Attribution (CC BY) license (https://creativecommons.org/licenses/by/4.0/).
Share and Cite
García-Ceberino, J.M.; Gamero, M.G.; Ibáñez, S.J.; Feu, S. Are Subjective Intensities Indicators of Player Load and Heart Rate in Physical Education? Healthcare 2022, 10, 428. https://doi.org/10.3390/healthcare10030428
García-Ceberino JM, Gamero MG, Ibáñez SJ, Feu S. Are Subjective Intensities Indicators of Player Load and Heart Rate in Physical Education? Healthcare. 2022; 10(3):428. https://doi.org/10.3390/healthcare10030428
Chicago/Turabian StyleGarcía-Ceberino, Juan M., María G. Gamero, Sergio J. Ibáñez, and Sebastián Feu. 2022. "Are Subjective Intensities Indicators of Player Load and Heart Rate in Physical Education?" Healthcare 10, no. 3: 428. https://doi.org/10.3390/healthcare10030428
APA StyleGarcía-Ceberino, J. M., Gamero, M. G., Ibáñez, S. J., & Feu, S. (2022). Are Subjective Intensities Indicators of Player Load and Heart Rate in Physical Education? Healthcare, 10(3), 428. https://doi.org/10.3390/healthcare10030428