
Detection of COVID-19 Based on Chest X-rays Using Deep Learning


Abstract
:1. Introduction
- 1.
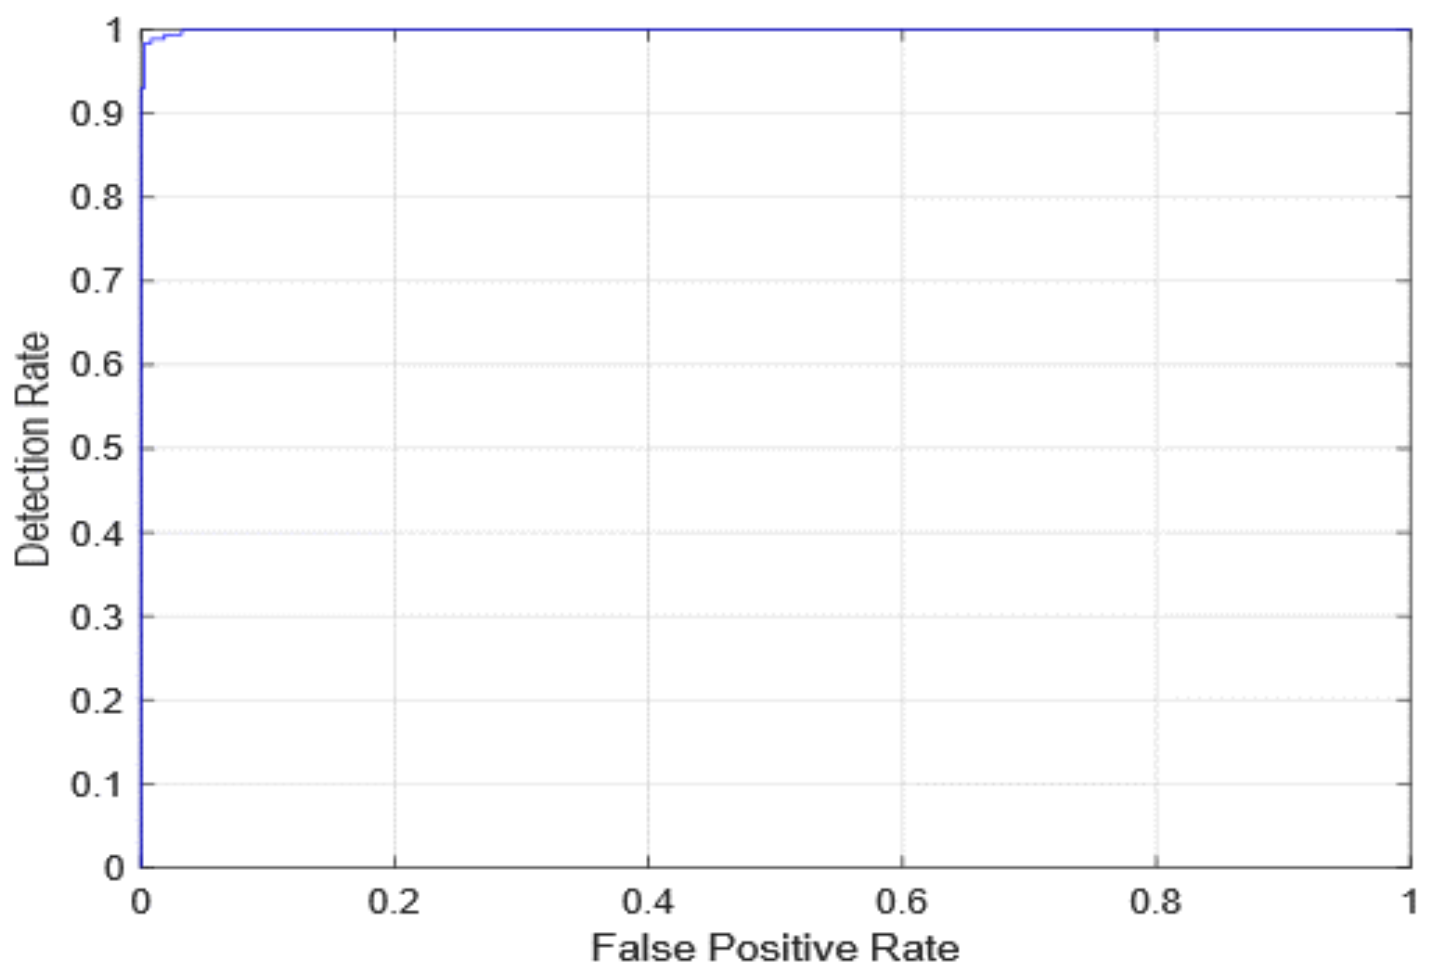
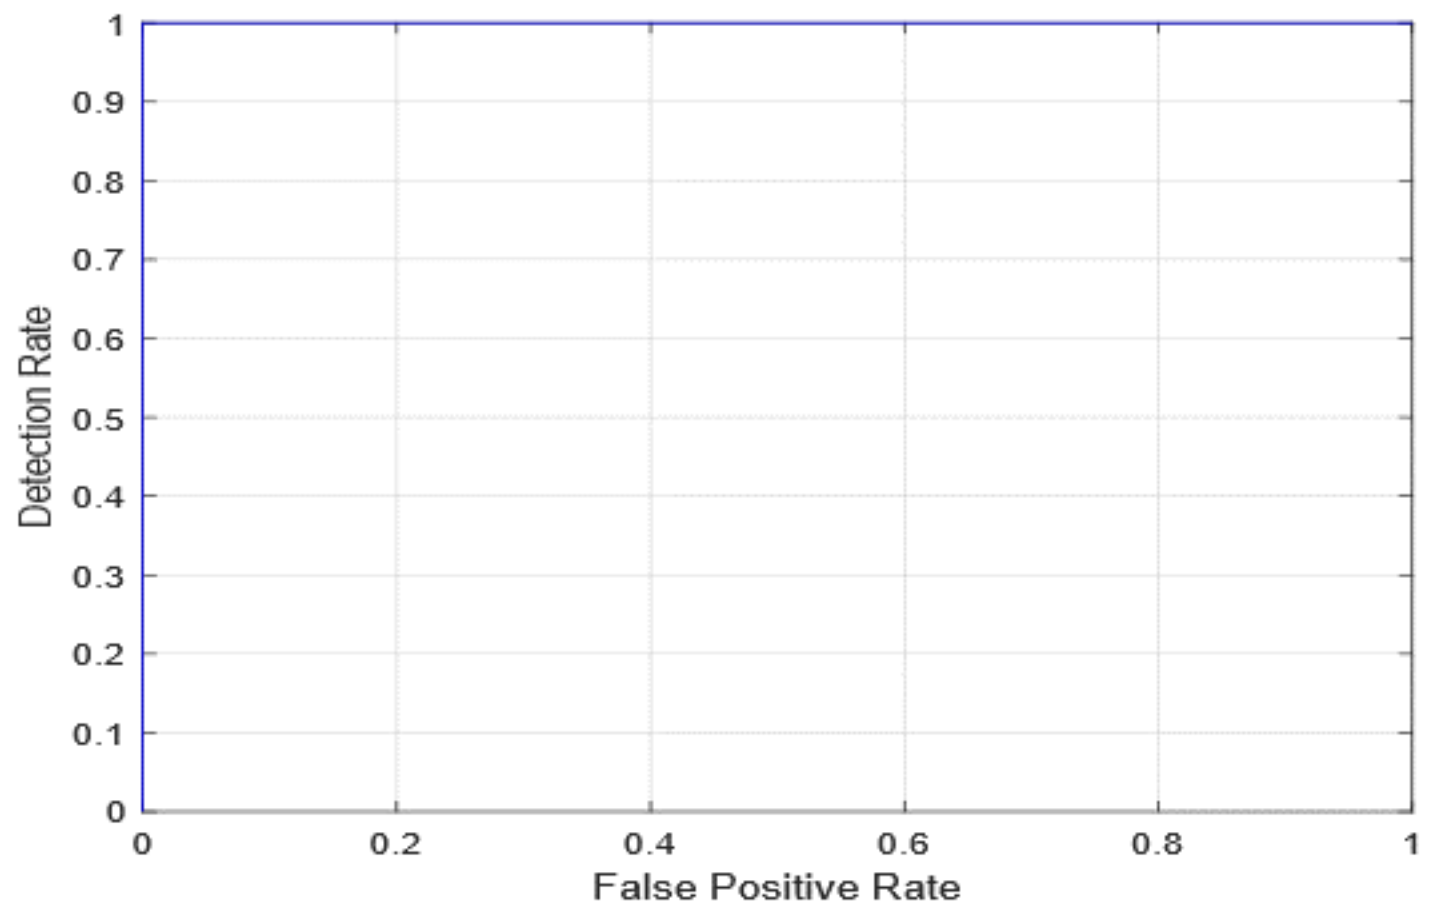
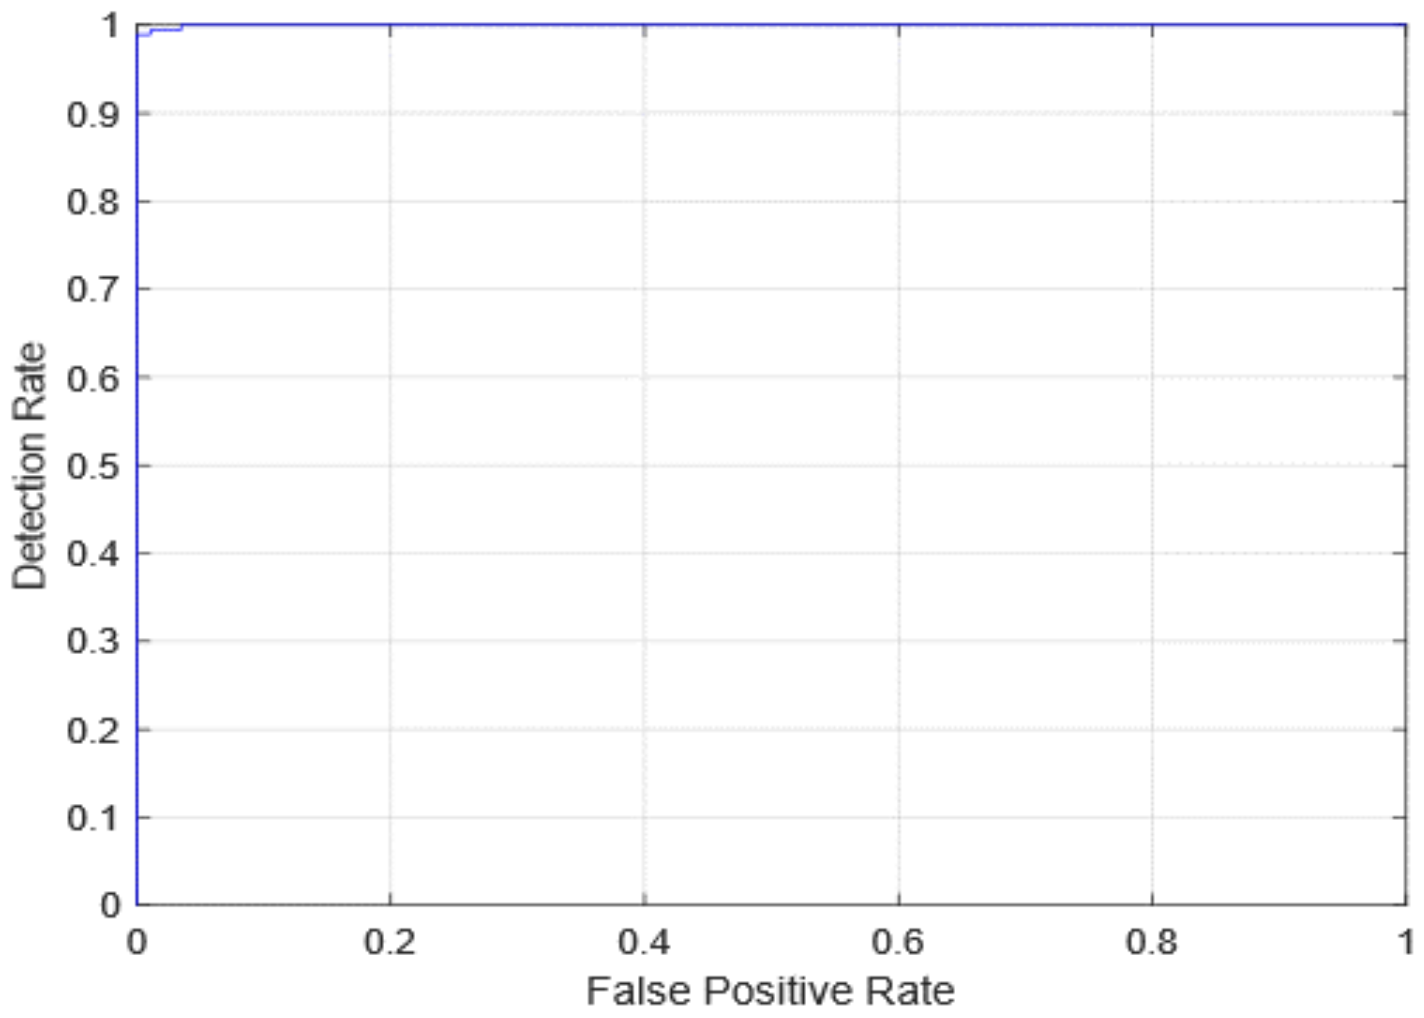
- To determine the feasibility of the proposed scheme, detailed comparative analyses are conducted using various measurement criteria such as accuracy, precision, recall, specificity, F1-score, and AUC.
- 2.
- COVID-19 shows radiological indications that are readily detectable on CXR. As a result, DL-based methods can be used to automatically analyze CXR, significantly reducing the analysis time.
- 3.
- The COV-PEN dataset is developed, which is a large-scale CXR image dataset. Among those currently publicly available, it includes a large number of CXR images with reported COVID-19 disease.
- 4.
- To fine-tune the weights of pre-trained networks on small datasets as well as to train the weights of networks on large datasets, a modified version of Resnet-50 is used.
- 5.
- To improve the generalized effectiveness of the suggested method and to prevent over-fitting, a different training protocol assisted by different combinations of training policies (e.g., validation patience and data augmentation) is used.
2. Related Works
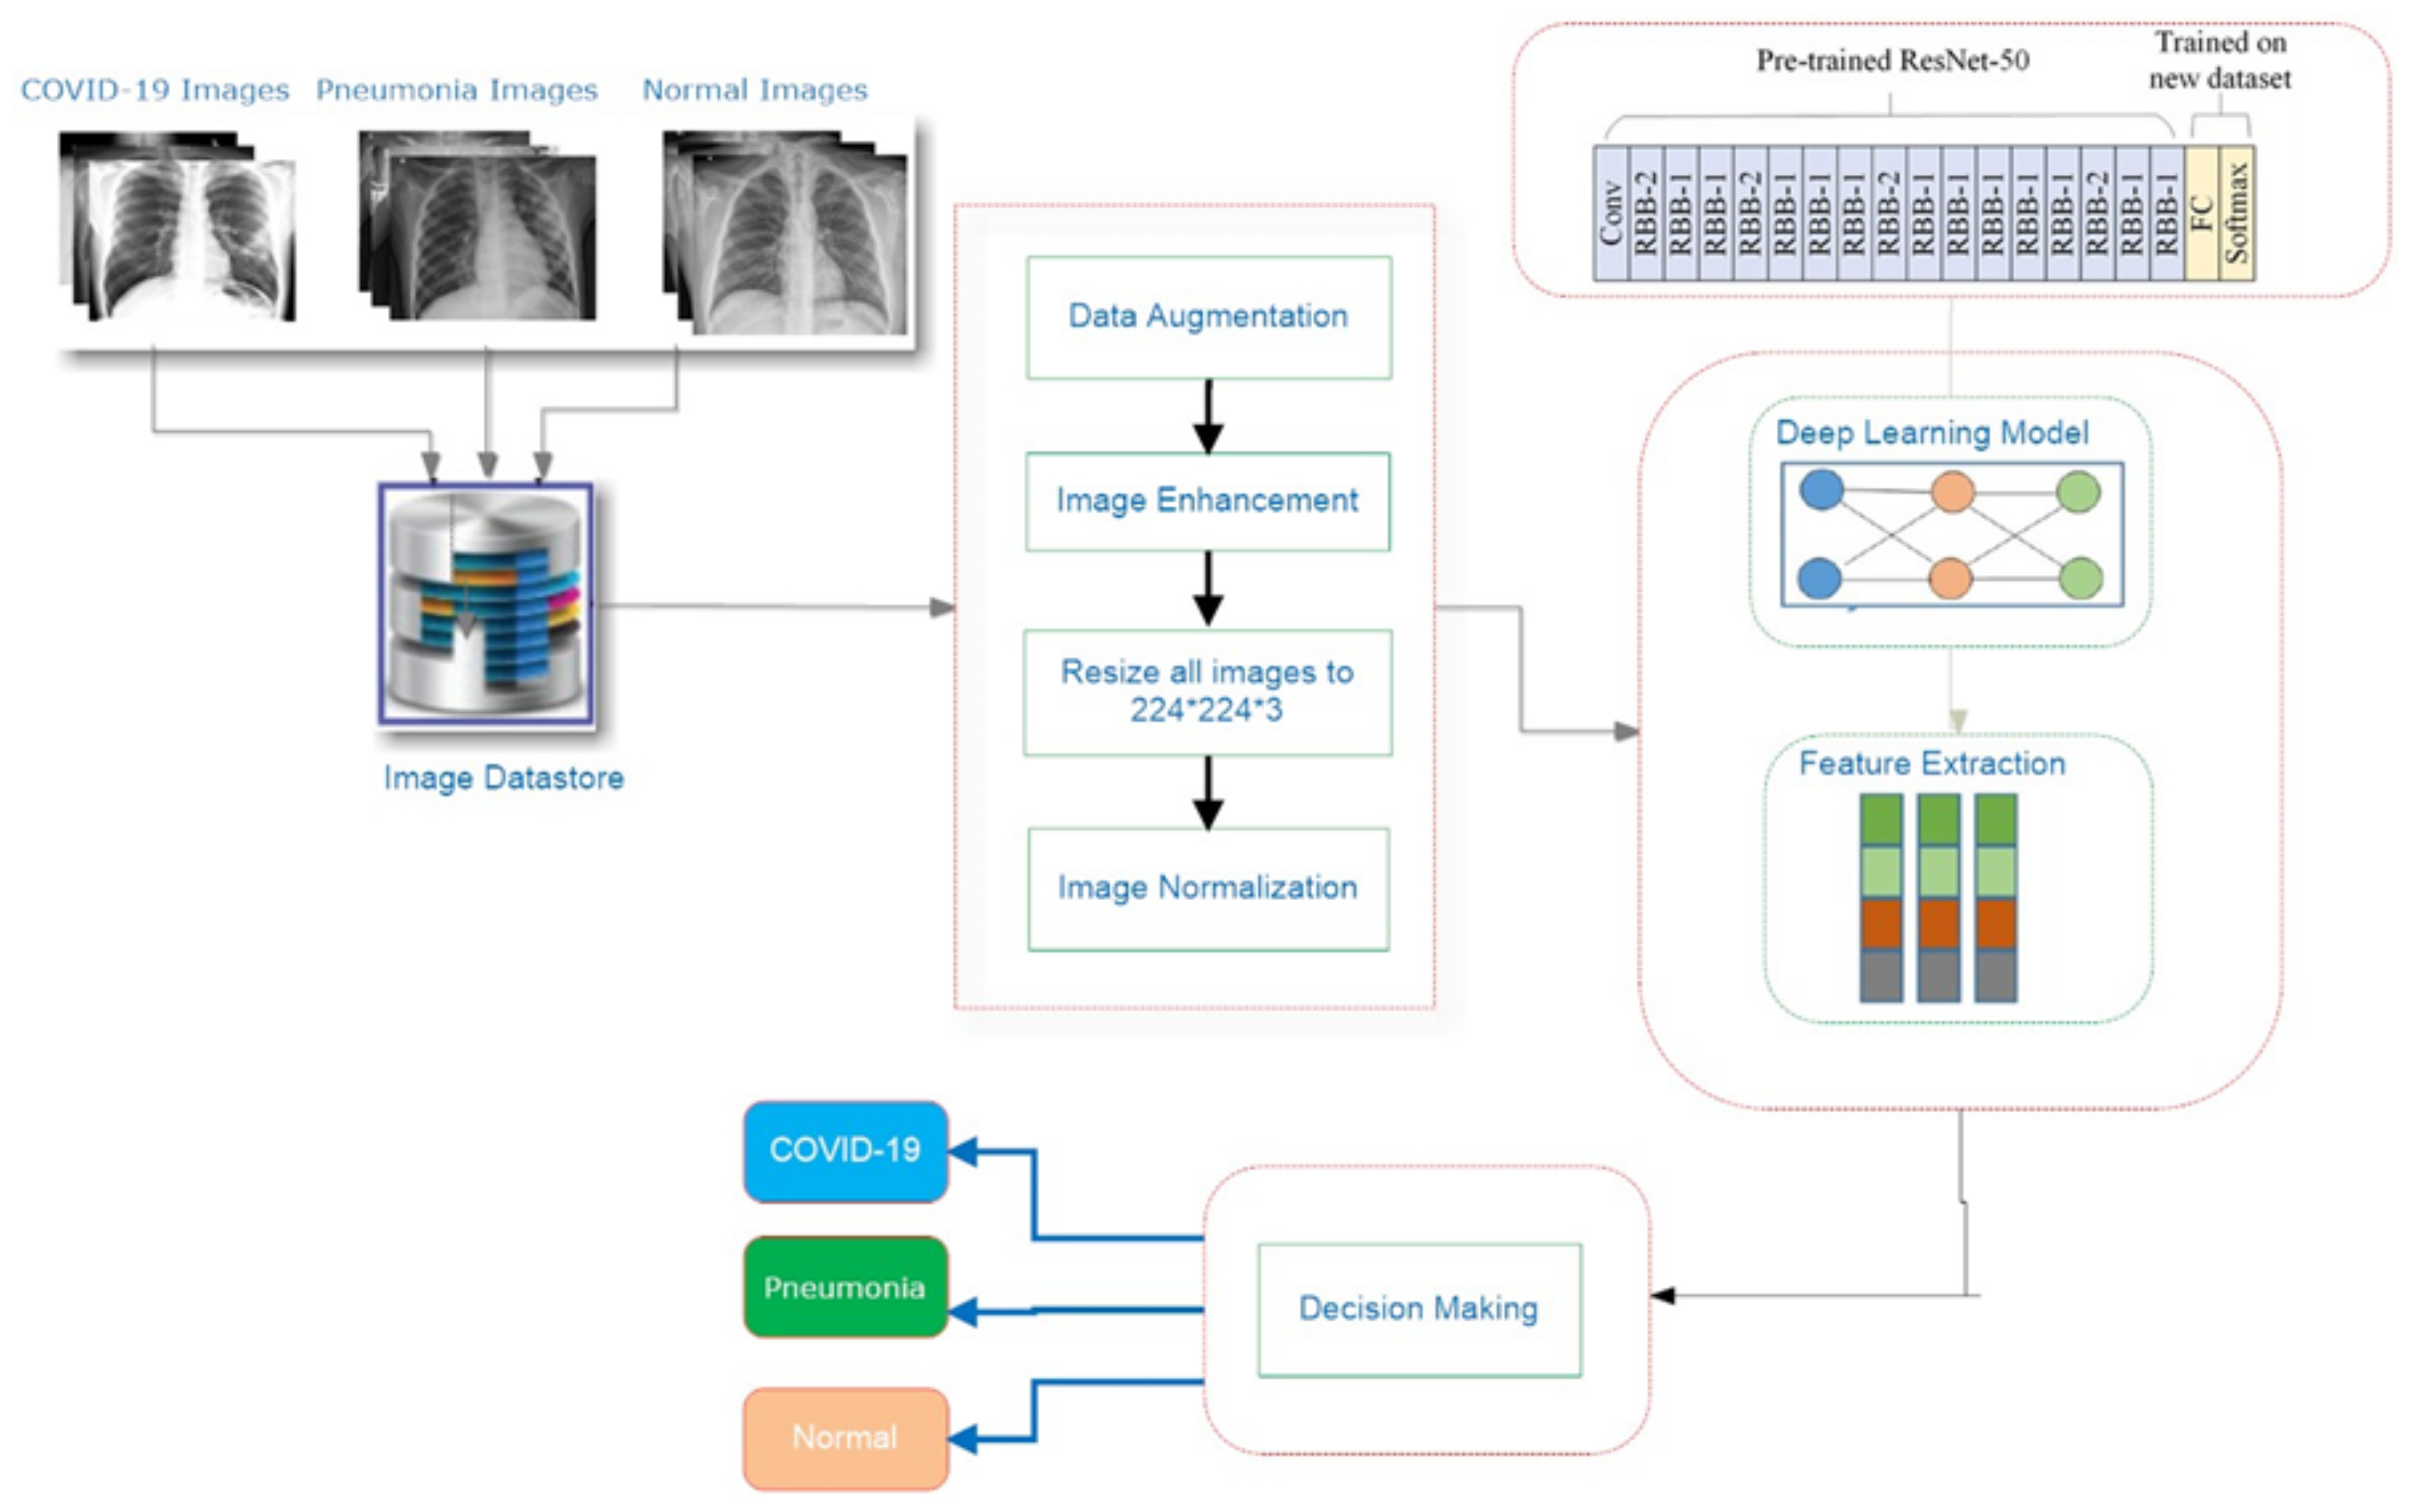
3. Proposed System
| Algorithm 1 Proposed System steps |
|
3.1. COV-PEN Image Datasets
3.2. Image Preprocessing Step
3.3. Proposed Transfer Learning for COV-PEN Detection
4. Experimental Results
4.1. Assessment Methods
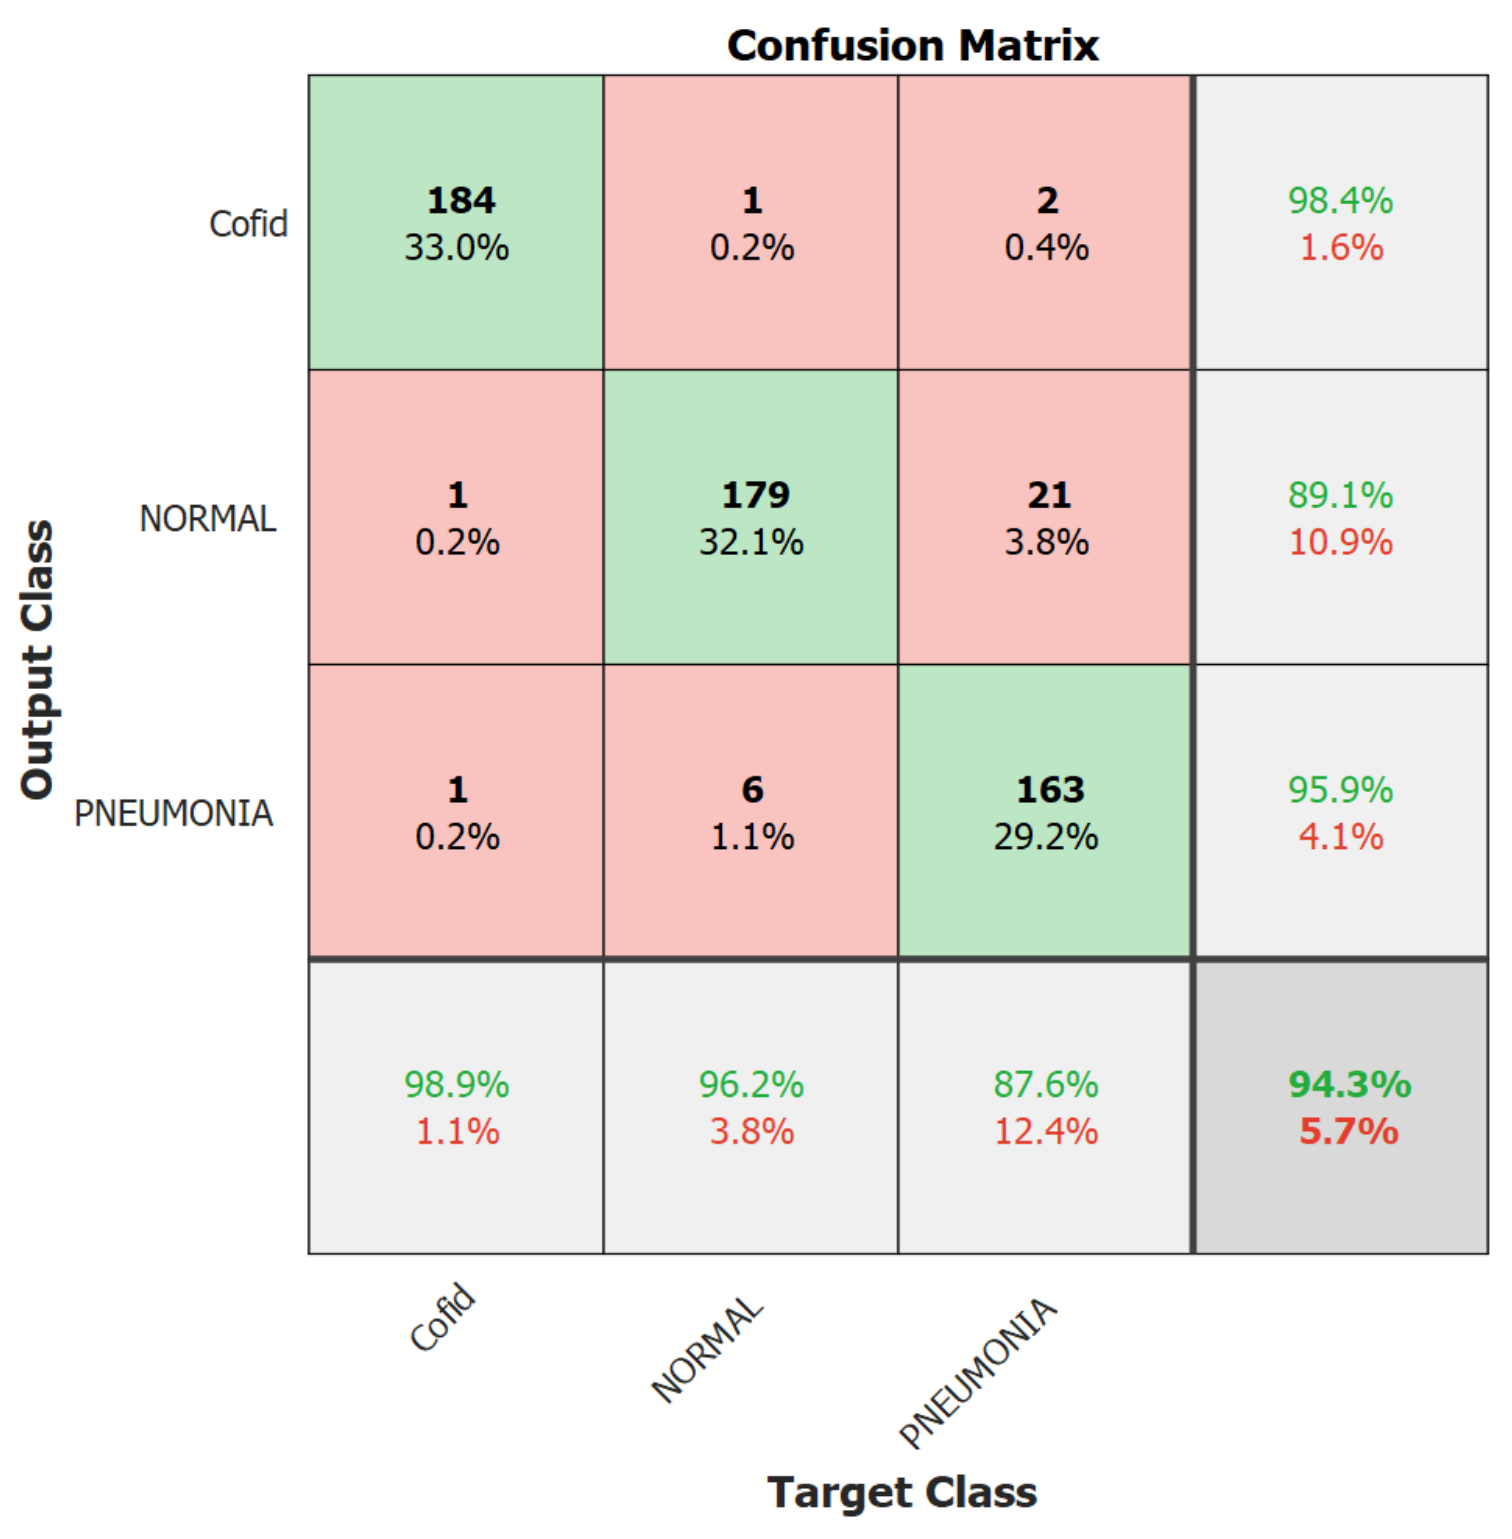
4.2. Results of the Proposed Systems
4.3. Comparison with State-of-the-Art Methods
5. Conclusions and Future Work
Author Contributions
Funding
Institutional Review Board Statement
Informed Consent Statement
Data Availability Statement
Acknowledgments
Conflicts of Interest
References
- Humayun, M.; Alsayat, A. Prediction Model for Coronavirus Pandemic Using Deep Learning. Comput. Syst. Sci. Eng. 2022, 40, 947–961. [Google Scholar] [CrossRef]
- Gorbalenya, A.E.; Baker, S.C.; Baric, R.; Groot, R.J.d.; Drosten, C.; Gulyaeva, A.A.; Haagmans, B.L.; Lauber, C.; Leontovich, A.M.; Neuman, B.W.; et al. Severe acute respiratory syndrome-related coronavirus: The species and its viruses—A statement of the Coronavirus Study Group. bioRxiv 2020. [Google Scholar]
- Stoecklin, S.B.; Rolland, P.; Silue, Y.; Mailles, A.; Campese, C.; Simondon, A.; Mechain, M.; Meurice, L.; Nguyen, M.; Bassi, C.; et al. First cases of coronavirus disease 2019 (COVID-19) in France: Surveillance, investigations and control measures, January 2020. Eurosurveillance 2020, 25, 2000094. [Google Scholar]
- Khalil, M.I.; Tehsin, S.; Humayun, M.; Jhanjhi, N.; Zain, M.A. Multi-Scale Network for Thoracic Organs Segmentation. Comput. Mater. Contin. 2022, 70, 3251–3265. [Google Scholar] [CrossRef]
- Chavez, S.; Long, B.; Koyfman, A.; Liang, S.Y. Coronavirus Disease (COVID-19): A primer for emergency physicians. Am. J. Emerg. Med. 2021, 44, 220–229. [Google Scholar] [CrossRef] [PubMed]
- Al-Waisy, A.; Mohammed, M.A.; Al-Fahdawi, S.; Maashi, M.; Garcia-Zapirain, B.; Abdulkareem, K.H.; Mostafa, S.; Kumar, N.M.; Le, D.N. Covid-deepnet: Hybrid multimodal deep learning system for improving covid-19 pneumonia detection in chest X-ray images. Comput. Mater. Contin. 2021, 67, 2409–2429. [Google Scholar] [CrossRef]
- Elghamrawy, S.M.; Hassnien, A.E.; Snasel, V. Optimized Deep Learning-Inspired Model for the Diagnosis and Prediction of COVID-19. Comput. Mater. Contin. 2021, 67, 2353–2371. [Google Scholar] [CrossRef]
- Armstrong, M. The Countries with the Most COVID-19 Cases. 2021. Available online: https://www.statista.com/chart/21467/coutries-most-covid-19-cases/ (accessed on 13 December 2021).
- Asai, T. COVID-19: Accurate Interpretation of Diagnostic Tests—A Statistical Point of View. 2021. Available online: https://www.ncbi.nlm.nih.gov/pmc/articles/PMC7729143/ (accessed on 13 December 2021).
- Gaál, G.; Maga, B.; Lukács, A. Attention u-net based adversarial architectures for chest X-ray lung segmentation. arXiv 2020, arXiv:2003.10304. [Google Scholar]
- Narin, A.; Kaya, C.; Pamuk, Z. Automatic detection of coronavirus disease (Covid-19) using X-ray images and deep convolutional neural networks. Pattern Anal. Appl. 2021, 24, 1207–1220. [Google Scholar] [CrossRef] [PubMed]
- Das, N.N.; Kumar, N.; Kaur, M.; Kumar, V.; Singh, D. Automated deep transfer learning-based approach for detection of COVID-19 infection in chest X-rays. Irbm 2020, in press. [Google Scholar]
- Chatfield, K.; Simonyan, K.; Vedaldi, A.; Zisserman, A. Return of the devil in the details: Delving deep into convolutional nets. arXiv 2014, arXiv:1405.3531. [Google Scholar]
- Simonyan, K.; Zisserman, A. Very deep convolutional networks for large-scale image recognition. arXiv 2014, arXiv:1409.1556. [Google Scholar]
- Shen, D.; Wu, G.; Suk, H.I. Deep learning in medical image analysis. Annu. Rev. Biomed. Eng. 2017, 19, 221–248. [Google Scholar] [CrossRef] [PubMed] [Green Version]
- Litjens, G.; Kooi, T.; Bejnordi, B.E.; Setio, A.A.A.; Ciompi, F.; Ghafoorian, M.; Van Der Laak, J.A.; Van Ginneken, B.; Sánchez, C.I. A survey on deep learning in medical image analysis. Med. Image Anal. 2017, 42, 60–88. [Google Scholar] [CrossRef] [PubMed] [Green Version]
- Wang, L.; Lin, Z.Q.; Wong, A. Covid-net: A tailored deep convolutional neural network design for detection of covid-19 cases from chest X-ray images. Sci. Rep. 2020, 10, 1–12. [Google Scholar] [CrossRef]
- Hemdan, E.E.-D.; Shouman, M.A.; Karar, M.E. COVIDXnet: A framework of deep learning classifiers to diagnose COVID-19 in X-ray images. arXiv 2020, arXiv:2003.11055. [Google Scholar]
- Zhang, J.; Xie, Y.; Li, Y.; Shen, C.; Xia, Y. Covid-19 screening on chest X-ray images using deep learning based anomaly detection. arXiv 2020, arXiv:2003.12338. [Google Scholar]
- Ozturk, T.; Talo, M.; Yildirim, E.A.; Baloglu, U.B.; Yildirim, O.; Acharya, U.R. Automated detection of COVID-19 cases using deep neural networks with X-ray images. Comput. Biol. Med. 2020, 121, 103792. [Google Scholar] [CrossRef]
- Khan, A.I.; Shah, J.L.; Bhat, M.M. CoroNet: A deep neural network for detection and diagnosis of COVID-19 from chest X-ray images. Comput. Methods Programs Biomed. 2020, 196, 105581. [Google Scholar] [CrossRef]
- Ucar, F.; Korkmaz, D. COVIDiagnosis-Net: Deep Bayes-SqueezeNet based diagnosis of the coronavirus disease 2019 (COVID-19) from X-ray images. Med Hypotheses 2020, 140, 109761. [Google Scholar] [CrossRef]
- Apostolopoulos, I.D.; Aznaouridis, S.I.; Tzani, M.A. Extracting possibly representative COVID-19 biomarkers from X-ray images with deep learning approach and image data related to pulmonary diseases. J. Med Biol. Eng. 2020, 40, 462–469. [Google Scholar] [CrossRef] [PubMed]
- Sahinbas, K.; Catak, F.O. Transfer learning-based convolutional neural network for COVID-19 detection with X-ray images. In Data Science for COVID-19; Elsevier: Amsterdam, The Netherlands, 2021; pp. 451–466. [Google Scholar]
- Jamil, M.; Hussain, I. Automatic detection of COVID-19 infection from chest X-ray using deep learning. medRxiv 2020. [Google Scholar] [CrossRef]
- Alazab, M.; Awajan, A.; Mesleh, A.; Abraham, A.; Jatana, V.; Alhyari, S. COVID-19 prediction and detection using deep learning. Int. J. Comput. Inf. Syst. Ind. Manag. Appl. 2020, 12, 168–181. [Google Scholar]
- Joaquin, A. Using Deep Learning to Detect Pneumonia Caused by NCOV-19 from X-ray Images. Available online: https://towardsdatascience.com/using-deep-learning-to-detect-ncov-19-from-X-ray-images-1a89701d1acd (accessed on 13 December 2021).
- Sethy, P.K.; Behera, S.K. Detection of Coronavirus Disease (COVID-19) Based on Deep Features. 2020. Available online: https://www.preprints.org/manuscript/202003.0300/v1 (accessed on 13 December 2021).
- Houssein, E.H.; Abohashima, Z.; Elhoseny, M.; Mohamed, W.M. Hybrid quantum convolutional neural networks model for COVID-19 prediction using chest X-ray images. arXiv 2021, arXiv:2102.06535. [Google Scholar]
- Saad, W.; Shalaby, W.A.; Shokair, M.; Abd El-Samie, F.; Dessouky, M.; Abdellatef, E. COVID-19 classification using deep feature concatenation technique. J. Ambient. Intell. Humaniz. Comput. 2021, 1–19. [Google Scholar] [CrossRef] [PubMed]
- Apostolopoulos, I.D.; Mpesiana, T.A. Covid-19: Automatic detection from X-ray images utilizing transfer learning with convolutional neural networks. Phys. Eng. Sci. Med. 2020, 43, 635–640. [Google Scholar] [CrossRef] [Green Version]
- Oh, Y.; Park, S.; Ye, J.C. Deep learning COVID-19 features on cxr using limited training data sets. IEEE Trans. Med Imaging 2020, 39, 2688–2700. [Google Scholar] [CrossRef]
- Brunese, L.; Mercaldo, F.; Reginelli, A.; Santone, A. Explainable deep learning for pulmonary disease and coronavirus COVID-19 detection from X-rays. Comput. Methods Programs Biomed. 2020, 196, 105608. [Google Scholar] [CrossRef]
- Islam, M.Z.; Islam, M.M.; Asraf, A. A combined deep CNN-LSTM network for the detection of novel coronavirus (COVID-19) using X-ray images. Inform. Med. Unlocked 2020, 20, 100412. [Google Scholar] [CrossRef]
- Ezzat, D.; Hassanien, A.E.; Ella, H.A. An optimized deep learning architecture for the diagnosis of COVID-19 disease based on gravitational search optimization. Appl. Soft Comput. 2020, 98, 106742. [Google Scholar] [CrossRef] [PubMed]
- Sahlol, A.T.; Yousri, D.; Ewees, A.A.; Al-Qaness, M.A.; Damasevicius, R.; Abd Elaziz, M. COVID-19 image classification using deep features and fractional-order marine predators algorithm. Sci. Rep. 2020, 10, 15364. [Google Scholar] [CrossRef]
- Toraman, S.; Alakus, T.B.; Turkoglu, I. Convolutional capsnet: A novel artificial neural network approach to detect COVID-19 disease from X-ray images using capsule networks. Chaos Solitons Fractals 2020, 140, 110122. [Google Scholar] [CrossRef] [PubMed]
- Rajaraman, S.; Antani, S. Training deep learning algorithms with weakly labeled pneumonia chest X-ray data for COVID-19 detection. medRxiv 2020. [Google Scholar] [CrossRef]
- Afshar, P.; Heidarian, S.; Naderkhani, F.; Oikonomou, A.; Plataniotis, K.N.; Mohammadi, A. Covid-caps: A capsule network-based framework for identification of covid-19 cases from X-ray images. Pattern Recognit. Lett. 2020, 138, 638–643. [Google Scholar] [CrossRef] [PubMed]
- Elshennawy, N.M.; Ibrahim, D.M. Deep-pneumonia framework using deep learning models based on chest X-ray images. Diagnostics 2020, 10, 649. [Google Scholar] [CrossRef] [PubMed]
- Cohen, J.P.; Morrison, P.; Dao, L.; Roth, K.; Duong, T.Q.; Ghassemi, M. Covid-19 image data collection: Prospective predictions are the future. arXiv 2020, arXiv:2006.11988. [Google Scholar]
- Mooney, P. Chest X-ray Images (Pneumonia). 2018. Available online: https://www.kaggle.com/paultimothymooney/chest-xray-pneumonia (accessed on 13 December 2021).
- He, K.; Zhang, X.; Ren, S.; Sun, J. Deep residual learning for image recognition. In Proceedings of the IEEE Conference on Computer Vision and Pattern Recognition, Las Vegas, NV, USA, 27–30 June 2016; pp. 770–778. [Google Scholar]
- Russakovsky, O.; Deng, J.; Su, H.; Krause, J.; Satheesh, S.; Ma, S.; Huang, Z.; Karpathy, A.; Khosla, A.; Bernstein, M.; et al. Imagenet large scale visual recognition challenge. Int. J. Comput. Vis. 2015, 115, 211–252. [Google Scholar] [CrossRef] [Green Version]
- Basha, S.S.; Dubey, S.R.; Pulabaigari, V.; Mukherjee, S. Impact of fully connected layers on performance of convolutional neural networks for image classification. Neurocomputing 2020, 378, 112–119. [Google Scholar] [CrossRef] [Green Version]
- Renard, F.; Guedria, S.; De Palma, N.; Vuillerme, N. Variability and reproducibility in deep learning for medical image segmentation. Sci. Rep. 2020, 10, 1–16. [Google Scholar] [CrossRef]


| Recent Work | Techniques Used | Number of Classes | Accuracy |
|---|---|---|---|
| Khan et al. [21] | CoroNet | 4 | 89.6% |
| Ucar and Korkmaz [22] | Bayes-SqueezeNet | 3 | 98.3% |
| Apostopolus et al. [23] | VGG-19 | 3 | 93.48% |
| Sahinbas & Catak [24] | VGG-16, VGG-19, ResNet, DenseNet, InceptionV3 | 2 | 80% |
| Jamil and Hussain [25] | Deep CNN | 2 | 93% |
| Alzab et al. [26] | VGG-16 | 2 | - |
| Joaquin. [27] | ResNet-50 | 2 | 96.2% |
| Sethy et al. [28] | ResNet-50 + SVM | 3 | 95.33% |
| Houssein et al. [29] | hybrid quantum classical CNNs | 3 | 88.6% |
| Saad et al. [30] | CNN, GoogleNet, ResNet-18 | 2 | 99.3% |
| Apostolopoulos, & Mpesiana [31] | MobileNetV2 | 3 | 96.78% |
| Oh et al. [32] | ResNet-18 | 3 | 88.9% |
| Brunese et al. [33] | VGG-16 | 3 | 96% |
| slam et al. [34] | CNN+LSTM | 2 | 99.4% |
| Ezzat et al. [35] | DenseNet121+GSA | 2 | 98.3% |
| Sahlol et al. [36] | Inception + FO-MPA | 2 | 99.6% |
| Toraman et al. [37] | Capsule Network | 2 | 97.24% |
| Rajaraman, S. and Antani, S. [38] | VGG16 | 2 | 93.0% |
| Afshar, P. et al. [39] | capsule network | 2 | 97.2% |
| Elshennawy, N. & Ibrahim, D. [40] | ResNet152V2, MobileNetV2 | 2 | 99.22% |
| Learning Rate | Ensemble Using Several Runs | ||
|---|---|---|---|
| Run 1 | Run 2 | Run 3 | |
| 0.0002 | 0.949820789 | 0.924731183 | 0.955197133 |
| 0.0004 | 0.935483871 | 0.919354839 | 0.928315412 |
| 0.0006 | 0.964157706 | 0.978494624 | 0.935483871 |
| 0.0008 | 0.956989247 | 0.930107527 | 0.944444444 |
| 0.001 | 0.935483871 | 0.919354839 | 0.928315412 |
| Learning Rate | Ensemble Using Several Runs | ||
|---|---|---|---|
| Run 1 | Run 2 | Run 3 | |
| 0.0002 | 0.953405018 | 0.955197133 | 0.962365591 |
| 0.0004 | 0.931899642 | 0.910394265 | 0.949820789 |
| 0.0006 | 0.949820789 | 0.948028674 | 0.931899642 |
| 0.0008 | 0.919354839 | 0.944444444 | 0.9390681 |
| 0.001 | 0.931899642 | 0.910394265 | 0.949820789 |
| Learning Rate | Ensemble Using Several Runs | ||
|---|---|---|---|
| Run 1 | Run 2 | Run 3 | |
| 0.0002 | 0.853046595 | 0.903942652 | 0.808960573 |
| 0.0004 | 0.749820789 | 0.907526882 | 0.892473118 |
| 0.0006 | 0.678136201 | 0.808960573 | 0.747311828 |
| 0.0008 | 0.88781362 | 0.62437276 | 0.716845878 |
| 0.001 | 0.683512545 | 0.679928315 | 0.617845867 |
| Learning Rate | Ensemble Using Several Runs | ||
|---|---|---|---|
| Run 1 | Run 2 | Run 3 | |
| 0.0002 | 0.933691756 | 0.937275986 | 0.933691756 |
| 0.0004 | 0.939068100 | 0.935483871 | 0.903942652 |
| 0.0006 | 0.942652329 | 0.917562724 | 0.907526882 |
| 0.0008 | 0.892473118 | 0.716845878 | 0.808960573 |
| 0.001 | 0.747311828 | 0.921146953 | 0.808960573 |
| Learning Rate | Ensemble Using Several Runs | ||
|---|---|---|---|
| Run 1 | Run 2 | Run 3 | |
| 0.0002 | 0.815412186 | 0.843010753 | 0.842175627 |
| 0.0004 | 0.607526882 | 0.772401434 | 0.607526882 |
| 0.0006 | 0.866308244 | 0.798207885 | 0.81172043 |
| 0.0008 | 0.610394265 | 0.678853047 | 0.607526882 |
| 0.001 | 0.756630824 | 0.733333333 | 0.734050179 |
| Learning Rate | Ensemble Using Several Runs | ||
|---|---|---|---|
| Run 1 | Run 2 | Run 3 | |
| 0.0002 | 0.94265233 | 0.937275986 | 0.933691756 |
| 0.0004 | 0.933691756 | 0.908602151 | 0.919002151 |
| 0.0006 | 0.9390681 | 0.88172043 | 0.843010753 |
| 0.0008 | 0.935483871 | 0.869175627 | 0.81172043 |
| 0.001 | 0.734050179 | 0.790322581 | 0.756630824 |
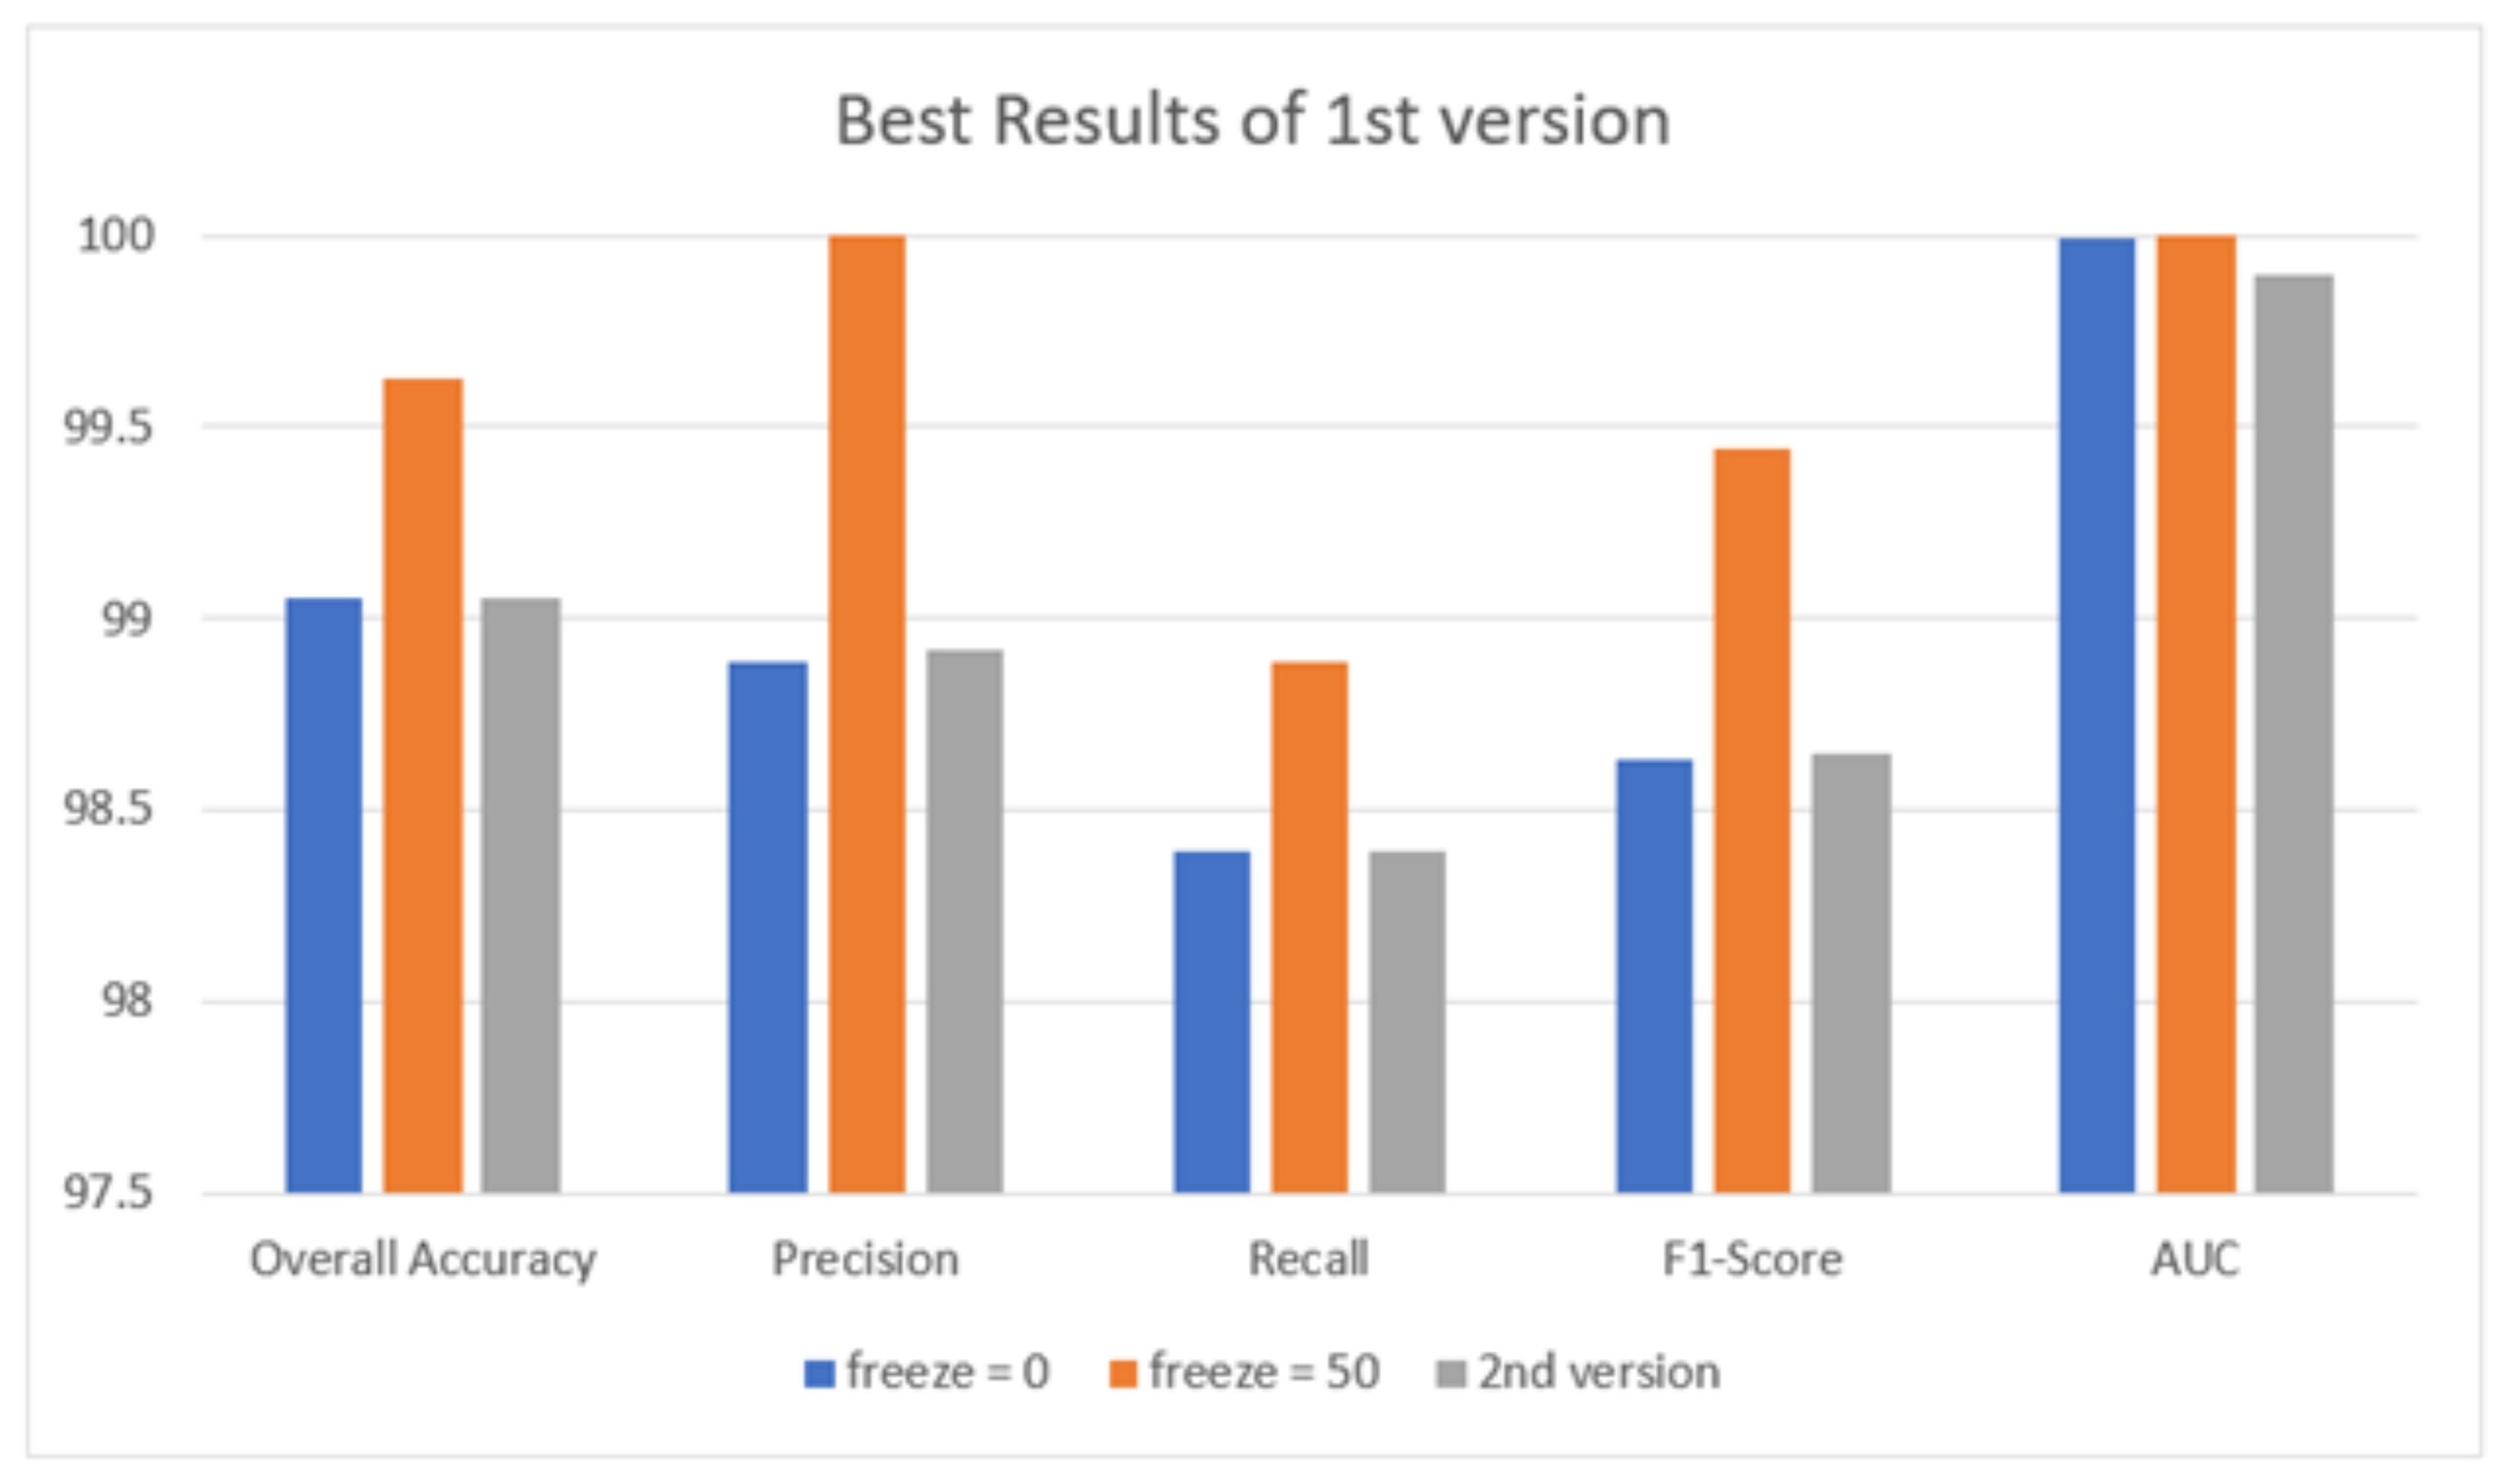
| Quantitative Measures | 1st Version Model (freeze = 0) | 1st Version Model (freeze = 50) | 2nd Version Model |
|---|---|---|---|
| Overall Accuracy | 99.05 | 99.63 | 99.05 |
| Precision | 98.89 | 100 | 98.92 |
| Recall | 98.39 | 98.89 | 98.39 |
| F1-score | 98.63 | 99.44 | 98.65 |
| AUC | 99.99 | 100 | 99.98 |
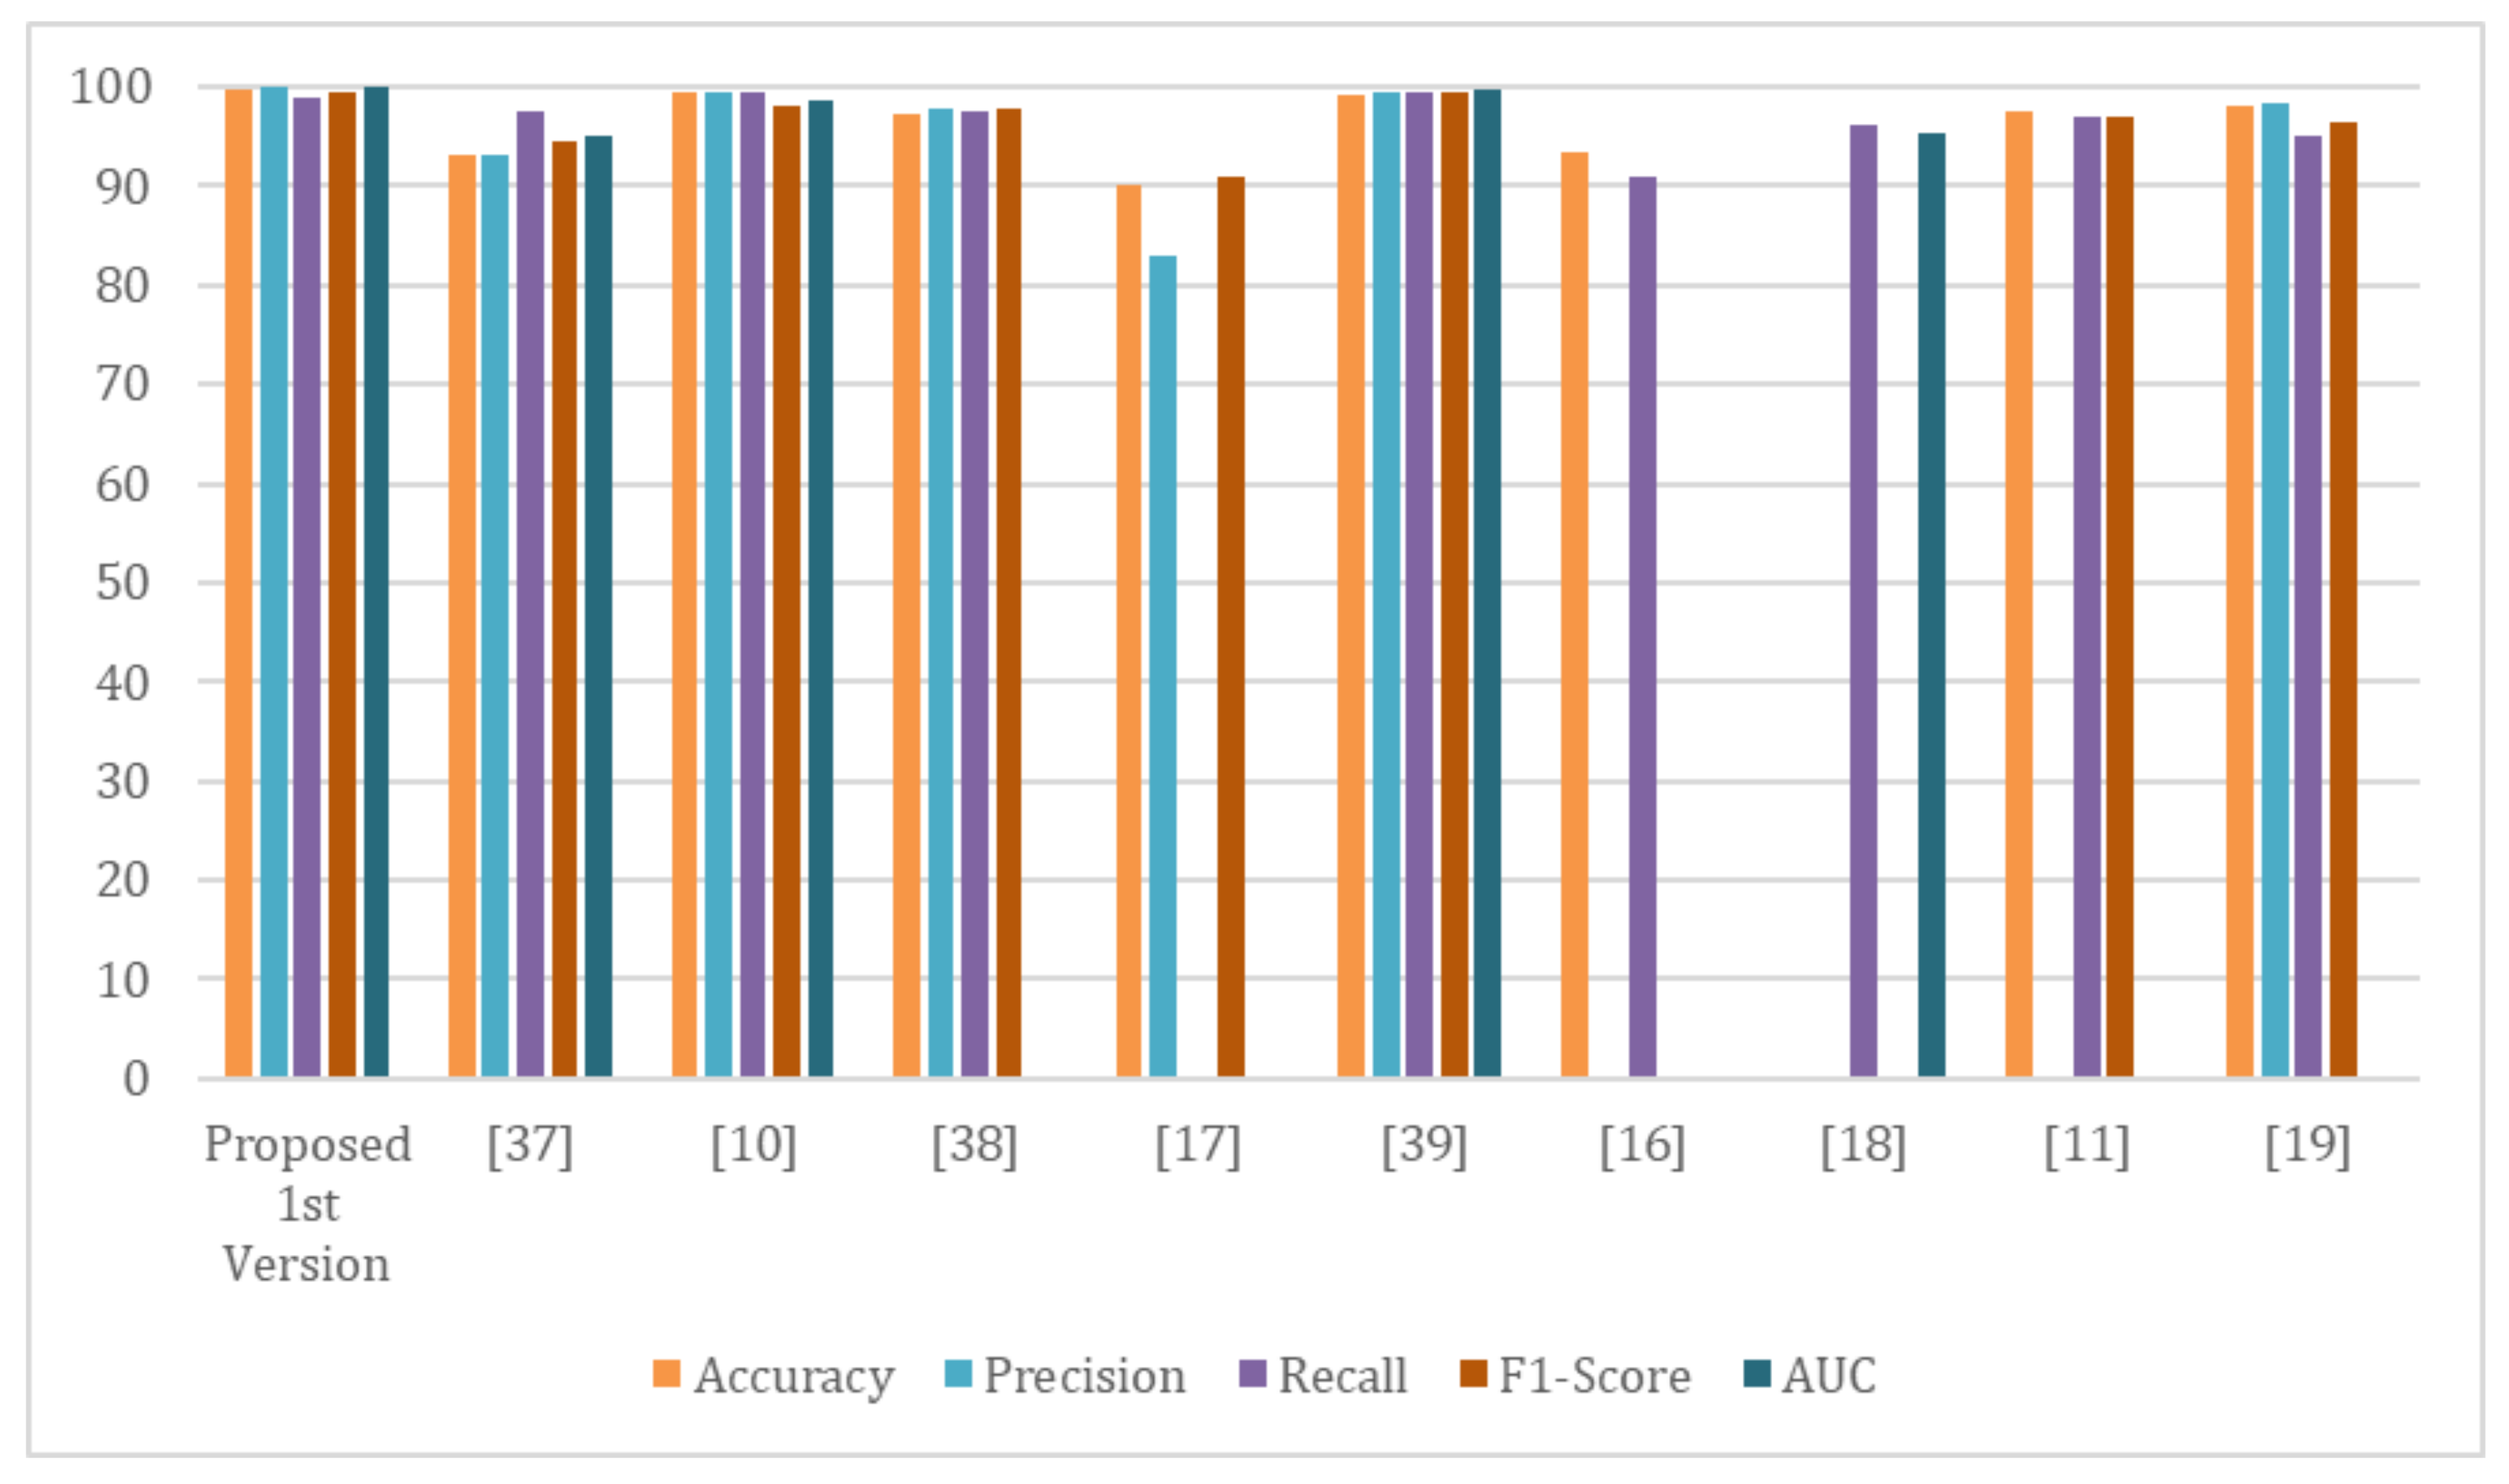
| Reference | Dataset | Classifier | Accuracy | Precision | Recall | F1-Score | AUC |
|---|---|---|---|---|---|---|---|
| Proposed 1st version | COV-PEN | Modified version of Resnet-50 | 99.63 | 100 | 98.89 | 99.44 | 100 |
| Afshar, P. et. al. [39] | - COVID-19 Image Data Collection | — | 97.2 | 97.67 | 97.5 | 97.70 | — |
| - Chest X-ray Images (Pneumonia) | |||||||
| - COVID-19 Image Data Collection | |||||||
| Rajaraman, S. and Antani, S. [38] | - Pediatric CXR dataset | VGG16 | 93.0 | 93.15 | 97.53 | 94.57 | 95.0 |
| - RSNA CXR dataset | InceptionV3 | ||||||
| - CheXpert CXR dataset | Xception | ||||||
| - NIH CXR-14 dataset | Densenet121 | ||||||
| - Twitter COVID-19 CXR dataset | NASNet-Mobile | ||||||
| - COVID-19 Image Data Collection | |||||||
| Narin, A., et. al. [11] | - Chest X-ray Images (Pneumonia) | ResNet-50 | 99.5 | 99.4 | 99.5 | 98.0 | 98.7 |
| - COVID-19 Image Data Collection | ResNet-101 | ||||||
| ResNet-152 | |||||||
| InceptionV3 | |||||||
| InceptionRes | |||||||
| net-V2 | |||||||
| - Chest X-ray Images (Pneumonia) | |||||||
| Hemdan, E. et. al. [18] | COVID-19 Image Data Collection | DenseNet201 | 90 | 83 | — | 91.00 | — |
| Elshennawy, N. & Ibrahim, D. [40] | Chest X-ray Images (Pneumonia) | ResNet152V2 | 99.22 | 99.43 | 99.44 | 99.44 | 99.77 |
| MobileNetV2 | |||||||
| Wang et al. [17] | - COVID-19 Image Data Collection | VGG-19 | 93.3 | — | 91 | — | — |
| - COVID-19 Chest X-ray Dataset | Resnet-50 | ||||||
| - ActualMed COVID-19 Chest X-ray Dataset | COVID-Net | ||||||
| - RSNA Pneumonia Detection Challenge dataset | |||||||
| - COVID-19 radiography database | |||||||
| Zhang et al. [19] | - COVID-19 Image Data Collection | ResNet-18 | — | — | 96 | — | 95.18 |
| - Chest X-ray Images (Pneumonia) | |||||||
| Das et al. [12] | - COVID-19 Image Data Collection | extreme version of the Inception (Xception) model | 97.40 | — | 97.09 | 96.96 | — |
| - ChestX-ray8 database (Pneumonia | Normal) | ||||||
| Ozturk et. al. [20] | - COVID-19 Image Data Collection | DarkNet | 98.08 | 98.3 | 95.1 | 96.5 | — |
| - ChestX-ray8 database (Pneumonia | Normal) |
Publisher’s Note: MDPI stays neutral with regard to jurisdictional claims in published maps and institutional affiliations. |
© 2022 by the authors. Licensee MDPI, Basel, Switzerland. This article is an open access article distributed under the terms and conditions of the Creative Commons Attribution (CC BY) license (https://creativecommons.org/licenses/by/4.0/).
Share and Cite
Gouda, W.; Almurafeh, M.; Humayun, M.; Jhanjhi, N.Z. Detection of COVID-19 Based on Chest X-rays Using Deep Learning. Healthcare 2022, 10, 343. https://doi.org/10.3390/healthcare10020343
Gouda W, Almurafeh M, Humayun M, Jhanjhi NZ. Detection of COVID-19 Based on Chest X-rays Using Deep Learning. Healthcare. 2022; 10(2):343. https://doi.org/10.3390/healthcare10020343
Chicago/Turabian StyleGouda, Walaa, Maram Almurafeh, Mamoona Humayun, and Noor Zaman Jhanjhi. 2022. "Detection of COVID-19 Based on Chest X-rays Using Deep Learning" Healthcare 10, no. 2: 343. https://doi.org/10.3390/healthcare10020343
APA StyleGouda, W., Almurafeh, M., Humayun, M., & Jhanjhi, N. Z. (2022). Detection of COVID-19 Based on Chest X-rays Using Deep Learning. Healthcare, 10(2), 343. https://doi.org/10.3390/healthcare10020343