Abstract
Little attention has been paid by employers to reduced productivity at work due to illness (presenteeism) because valid instruments to measure presenteeism are lacking. We assessed psychometric properties of the traditional Chinese version of the six-item Stanford Presenteeism Scale (CSPS-6) among Taiwanese employees in technology companies. We carried out a cross-cultural adaptation study on 196 employees. Factor analyses were used to evaluate the construct validity of the CSPS-6. Cronbach’s alpha was 0.74. The content validity of the CSPS-6 was good. Results of factor analyses confirmed the two-factor model of the CSPS-6. CSPS-6 scores were correlated with job stress (rs = −0.22, p = 0.002), the health status SF-36 (rs = 0.28 to 0.52, p < 0.0001), job satisfaction (rs = 0.41, p < 0.0001), and the presenteeism score of the Work Productivity and Activity Impairment Questionnaire: General Health (rs = −0.46, p < 0.0001). No correlations were found between presenteeism and the disability status (p = 0.19, F-value = 1.67, degrees of freedom = 2). The CSPS-6 was found to be reliable and valid in evaluating presenteeism of Taiwanese employees. Further studies should be undertaken to validate the CSPS-6 in other working populations and assess long-term effects of health problems associated with presenteeism.
1. Introduction
Presenteeism is reduced productivity due to illness in employees who go to work but exhibit inadequate or unsatisfactory work performance [1,2]. Many employees still go to work when they are sick. This might affect their productivity and health because there is an association between sick leave and presenteeism [3].
Presenteeism is a key public health issue because it reduces work outcomes in employees and causes hidden indirect costs for organizations. In a cross-sectional study to estimate lost productive time caused by employees’ common pain conditions in the United States, presenteeism accounted for the majority (77%) of this lost productive time [4]. A study of all costs of health, absence, disability, and productivity losses for 10 disease conditions in US companies estimated that presenteeism costs accounted for the largest component, averaging 61%, of total costs for these diseases [5]. However, neither managers nor employees could define the extent of employees’ presenteeism. Only a few employers invested in the healthcare of their staff as they did not have information about indirect costs caused by their employees’ productivity loss due to health problems [1].
A comprehensive instrument to assess presenteeism is needed to evaluate the level of health-related productivity and prevent decreased productivity at work among employees. This means that decreased productivity at work might be considered an outcome to assess socioeconomic burdens of any health problems and evaluate impacts of health promoting interventions in the workplace or any healthcare system. These findings might contribute to health policies on whether or not managers and employers should invest in human capital [6].
To date, although many researchers have developed various instruments to measure presenteeism, there has been little consensus on how to measure presenteeism because different authors have different definitions of presenteeism [7]. Among 21 instruments measuring presenteeism in a systematic review in 2015, the Stanford Presenteeism Scale (SPS-6) had more evidence of its measurement properties than other instruments [8]. Until now, according to a systematic review in 2021, researchers have continued using it among 42 instruments of productivity loss in validation studies and economic evaluations [9]. Because the SPS-6 can possibly be used for all working populations and any health problems, it was translated and validated in several languages, such as Portuguese [10,11], Dutch [12], Italian [13], Persian [14], Spanish [15], and Turkish [16]. The developers of SPS-6 defined presenteeism as follows: “employees are physically present at their jobs, but they may experience decreased productivity and below-normal work quality”. Therefore, the SPS-6 has two factors: avoiding distractions and completing work which reflect work processes and work outcomes, respectively [6]. In previous validation studies, the SPS-6 was adapted into Italian [13], Portuguese [10,11,17], Dutch [12], Spanish [15], and Persian [14] with acceptable reliability (Cronbach’s alpha = 0.72~0.89) and construct validity of a two-factor model of the SPS-6. From these results of cross-cultural adaptation, we might generalize presenteeism or health-related productivity across countries.
Nevertheless, there are still limited validation data on this questionnaire. First, in Taiwan, the level of presenteeism or health-related productivity assessments of employees is not clear because valid instruments for its evaluation are still deficient. Hence, the main issue we addressed was to translate the SPS-6 into traditional Chinese (called the CSPS-6 version) and assess its psychometric properties. Second, because health problems are related to loss of productivity at work, SPS-6 scores were correlated with the health status (SF-36), disability status, job stress, and job satisfaction in previous validation studies [6,10]. In this study, we also hypothesized that the health status, disability status, job stress, and job satisfaction would be correlated with presenteeism as measured by the SPS-6 questionnaire among Taiwanese employees in technology companies.
2. Materials and Methods
Our methods included psychometric properties (or measurement properties), the process of translation, samples, measures, and data analysis.
2.1. Psychometric Properties
According to the classification of reliability and validity of health outcomes instruments in the COSMIN study [18], we evaluated the internal consistency, content validity, construct validity, and criterion validity.
The test–retest reliability is not presented because the SPS-6 reflects the effects of health problems, such as flu and headaches, on the productivity in the previous month, and both health problems and productivity might change over time [6]. The content validity and translation equivalence were assessed by expert panels, the original developer of this scale, and two independent native English-speaking researchers.
The construct validity includes the structural validity and hypothesis testing [18]. To evaluate the structural validity of the CSPS-6, we performed an exploratory factorial analysis and a confirmatory factor analysis. For hypothesis testing, we hypothesized that the health status, disability status, job stress, and job satisfaction would be correlated with presenteeism on the basis of a literature review [6,10], because health problems are related to productivity losses at work.
Due to there being no gold standard instrument for assessing productivity loss [19], we evaluated the concurrent validity (a type of criterion validity) by comparing CSPS-6 scores with scores of a similar measure (the Work Productivity and Activity Instrument Questionnaire: General Health (WPAI:GH) presenteeism).
2.2. The Process of Translation
After gaining permission to validate the questionnaire from one of the original developers of the SPS-6, we followed Sousa and Rojjanasrirat’s guidelines of forward–backward translation [20]. Briefly, forward–backward translation was performed by two independent translators and synthesized by a third translator. Second, the original developer of this scale and two native English-speaking researchers worked independently to assess the content equivalence between the original version and the backward translation with four responses from 1 indicating “strongly disagree” to 4 indicating “strongly agree”.
After that, we arranged two expert panels: one expert panel via email to evaluate the content validity and another face-to-face expert panel to finalize the translated version of the CSPS-6 (see Supplementary Materials). We conducted a pilot study with 12 employees to check the wording, and no changes were made to the final translated version.
2.3. Samples
According to Jackson [21] and Kline [22], the minimum sample size for a structural equation model for a confirmatory factor analysis (CFA) should be determined by the N:q ratio, with q being the number of parameters and N being the number of cases. Since the recommended N:q ratio is 20:1 and the SPS-6 has six parameters, the minimum sample size would be 20q or N = 120.
A cross-sectional design was used at 10 technology companies in the north of Taiwan. Inclusion criteria were Taiwanese employees, age of at least 20 years old, and ability to answer all questions of the CSPS-6. We recruited 196 employees by random sampling and interviewed them after obtaining informed consent.
2.4. Measures
Demographic data included age, gender, education, marital status, and occupational categories.
The RAND 36-item 1.0 questionnaire (also known as the SF-36 1.0) was utilized for measuring the health status. Eight subscales of the SF-36 are general health, physical functioning, pain, social functioning, vitality, role—emotional, role—physical, and mental health. Responses were recoded from 0 to 100 and averaged into scores of each subscale. Higher scores indicate better health [23].
Employees were asked about job satisfaction and job stress. Each response for job satisfaction or job stress was scored as follows: 1 = “completely dissatisfied” or “extremely low”, 2 = “moderately dissatisfied” or “low”, 3 = “neither satisfied nor dissatisfied” or “moderate”, 4 = “moderately satisfied” or “high”, and 5 = “completely satisfied” or “extremely high”.
The disability status was assessed by one question (“What kinds of limitations or participation restrictions in daily life or during work, due to your health problem, do you have?”) with three responses: no disability, a non-work-related disability, or a work-related disability [6,12].
The presenteeism score of the Work Productivity and Activity Impairment Questionnaire: General Health (WPAI:GH) [24,25] was calculated by dividing the degree of sickness-influenced productivity when employees were working by 10 and then multiplying that by 100.
The SPS-6 has six items. Item numbers 2, 5, and 6 are positively worded items: 1 = “strongly disagree”, 2 = “somewhat disagree”, 3 = “uncertain”, 4 = “somewhat agree”, and 5 = “strongly agree”. Three other items have reversed scores. The total score for the SPS-6 ranges from 6 to 30. A higher score indicates greater productivity [6].
2.5. Data Analysis
Data were analyzed using R software version 4.2.0 (Vienna, Austria) [26], with the psych, semPaths and lavaan packages. Significance levels were set to 0.05.
The internal consistency was analyzed by computing Cronbach’s alpha. The value of Cronbach’s alpha had to be at least 0.70 to have acceptable internal consistency reliability [27]. There was a presence of a ceiling or floor effect if >15% of participants received the highest or lowest total SPS-6 scores, respectively [28].
The content validity was evaluated by content validity indices at the item level (I-CVI) and the scale level (S-CVI) [20], the modified Kappa (k*) statistic [29], and the expert panel as follows:
- The I-CVI was computed by dividing the number of experts who evaluated an item as three (quite relevant or minor revisions to be clear) and four (highly relevant or clear) by the total number of evaluators [30]. Because there were fewer than six experts, the I-CVI in our study was 1.00 [31].
- The S-CVI was calculated by averaging I-CVI values [29].
- To adjust for the chance agreement of experts [29], the modified Kappa (k*) statistic was calculated following a formula recommended by Polit et al. [31,32] and interpreted as recommended by Fleiss et al.: excellent (>0.74), good (0.60–0.74), and fair (0.40–0.59) [31,33].
- Through email, we asked the first expert panel whether the translated version was easy to comprehend and would it be clear for all Taiwanese populations with five responses from 1 (“strongly disagree”) to 5 (“strongly agree”).
The structural validity was examined by an exploratory factorial analysis (EFA) and confirmatory factor analysis (CFA).
- Before conducting the EFA, we used the Kaiser–Mayer–Olkin (KMO) test to assess the sampling adequacy. A KMO index ≥0.50 is an acceptable value [34], and Bartlett’s test of sphericity with a significant statistical test (p < 0.05) [35] is desirable. The EFA with principal component analysis extraction and Varimax rotation methods was applied to test the dimensions of the CSPS-6. Items with a factor loading of >0.40 were set. Two methods we used to define the number of factors retained were the Kaiser criterion of eigenvalues (eigenvalue >1 rule) [36,37] and a scree plot. Factors to be retained were determined by the eigenvalues above and to the left of the straight line through the smallest eigenvalues on the scree plot [38,39].
- A CFA was performed to confirm the structural validity of the CSPS-6. With a sample size N of ≤250, Hu and Bender (1999) recommended a two-index presentation strategy using the combination rule of fit indexes to conclude the model fit [40]. Therefore, we reported a combination of the comparative fit index (CFI) (or Tucker–Lewis Index (TLI)) with the standardized root-mean-squared residual (SRMR) for model evaluation. Cutoff values for these indices to determine a good model fit were a CFI of ≥0.95 (or a TLI of ≥0.95) and an SRMR of ≤0.08 [40]. The factor loading of an item was interpreted as excellent, very good, good, fair, and poor with loadings exceeding 0.71, 0.63, 0.55, 0.45, and 0.32, respectively [41,42].
Due to skewed data of productivity, Spearman correlation coefficients (rs) were used to test the correlation between the SF-36 and the CSPS-6 (Bonferroni adjusted p-value < 0.006), the WPAI:GH, job stress, and job satisfaction. According to Cohen’s classification, we interpreted Spearman’s coefficient values of >0.5, 0.3–0.5, and <0.3 as being strong, moderate, and weak, respectively [43]. An analysis of variance (ANOVA) was used to test the relationship between disability status and the CSPS-6.
3. Results
Demographic characteristics are described in Table 1. The mean CSPS-6 score (standard deviation) was 24.11 (5.42). A ceiling effect (maximum score of 30) was present (29%, n = 57) for CSPS-6. Only two employees (1%) got the minimum score of 6; therefore, there was no floor effect. The mean job stress score (standard deviation) was 2.55 (1.02). The mean job satisfaction score (standard deviation) was 3.24 (0.92). The mean WPAI:GH presenteeism score (standard deviation) was 24.85 (28.72).

Table 1.
Demographic characteristics (N = 196).
3.1. Internal Consistency
Cronbach’s alpha values were 0.98 (for factor 1), 0.83 (for factor 2), and 0.74 (for the whole scale).
3.2. Content Validity
In terms of clarity and relevance as evaluated by four experts, all the I-CVI, S-CVI, and Kappa k* values that were equal to 1 presented total agreement of all experts with the probability of a chance occurrence among experts of 0.0625. These results proved that the content validity of the CSPS-6 was excellent.
The original developer of this scale and two native English-speaking researchers strongly agreed that the backward translation had the same content equivalence as the original version. Most experts agreed that the CSPS-6 had translation equivalence with the original English version, and that it was easy to comprehend and would be clear for all Taiwanese populations (one-fourth of experts strongly agreed, two-fourths of experts agreed, and one-fourth had a neutral opinion).
3.3. Structural Validity (Construct Validity)
Because the KMO value was 0.65 and Bartlett’s test of sphericity was significant (χ2 = 1287.3, p < 0.001, degrees of freedom = 15), it was appropriate to use the EFA. Results of the EFA in Table 2 and Figure 1 suggest that the CSPS-6 had two factors, labeled “completing work” and “avoiding distraction” in the original English version, with eigenvalues >1 that explained 87.4% of the total variance of the responses.
Table 2.
Factor loadings of the CSPS-6 (principal components analysis extraction and Varimax rotation methods).
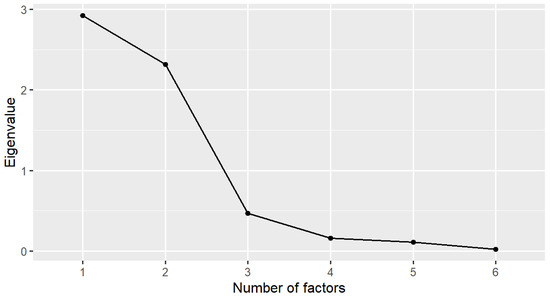
Figure 1.
Scree plot of the Chinese version of the Stanford Presenteeism Scale (CSPS-6) in the exploratory factor analysis (EFA).
Figure 2 presents the CFA of the CSPS-6 with two factors. The fit indices of the model evaluation were CFI = 0.976, TLI = 0.956, and SRMR = 0.075, indicating model fit. The association between the two factors was −0.05. The standardized factor loadings were in the range of 0.69–1.08 (p < 0.05), indicating that the magnitude of the relationships of items to the factor was good, and the CSPS-6 had good construct validity.
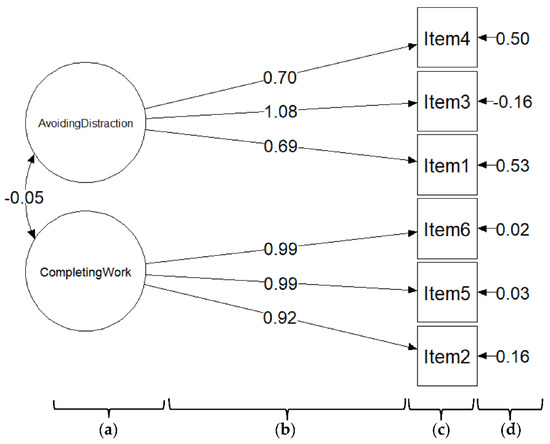
Figure 2.
The two-factor model of the CSPS-6 according to a confirmatory factor analysis. (a) CSPS-6 factors; (b) standardized factor loading; (c) CSPS-6 items; (d) error variance.
3.4. Hypothesis Testing (Construct Validity)
The CSPS-6 score was positively correlated with eight outcomes of health status (SF-36) (rs = 0.28–0.52, p < 0.0001) (Table 3). Correlations were found between job satisfaction (rs = 0.41, p < 0.0001) and job stress (rs = −0.22, p = 0.002) with presenteeism. No correlations were found between mean CSPS-6 scores among the three disability groups (p = 0.19, F-value = 1.67, degrees of freedom = 2).
Table 3.
Correlations between the CSPS-6 and the health status.
3.5. Concurrent Validity (Criterion Validity)
The CSPS-6 score was moderately associated with the WPAI:GH presenteeism score (rs = −0.46, p < 0.0001).
4. Discussion
Our findings show that the CSPS-6 is a valid and reliable questionnaire that might be useful to assess employee health and productivity. Overall, this instrument showed an acceptable internal consistency. Results of the expert panels indicated that the CSPS-6 was clear and relevant to the concept of presenteeism (reduced productivity at work due to illness), and that the meanings of the CSPS-6 and the original English version were similar. This provides proof of the good content validity of the CSPS-6. CSPS-6 was associated with eight dimensions of the health status (SF-36), job stress, and job satisfaction (except the disability status), suggesting that the CSPS-6 had acceptable construct validity. The CSPS-6 score was associated with the WPAI:GH presenteeism score, indicating the acceptable concurrent validity of this scale.
The CSPS-6 showed acceptable internal consistency. This result seems to be consistent with other research which found translated versions of the SPS-6 had good internal consistency (Cronbach’s alpha ≥ 0.8) [6,10,11,12] or acceptable internal consistency [13,14]. The EFA and CFA findings support the structural validity of the CSPS-6, which reflects two dimensions: avoiding distractions (work processes) and completing work (work outcomes). A comparison of the findings with those of other studies [10,11,12,13,14,15,17] confirms that the CSPS-6 has two underlying dimensions, in line with the original English version [6]. Koopman et al. [6] and Hutting et al. [12] proved that SPS-6 scores were associated with the disability status. This differs from findings presented here because the mean age of our respondents (34.08 years old) was less than that of Koopman et al.’s participants (46.5 years old) and Hutting et al.’s participants (46.2 years old).
Our study confirmed the association between health status outcomes (SF-36) and CSPS-6 scores. This finding was also reported by Frauendorf et al. [10]. The reason for this might be that health problems, especially pain, discourage employees from concentrating on their work, which causes presenteeism [44]. In accordance with previous validation studies [6,12], this study also demonstrated that CSPS-6 scores were associated with job satisfaction and job stress. This finding is in agreement with Keramat’s longitudinal study findings which showed that job satisfaction was correlated with presenteeism [45]. The relationship between job stress and presenteeism may partly be explained by job stress, yielding negative emotions and go-slow behaviors that contribute to presenteeism [46]. In addition, when employees are sick but still go to work, stressors might make them have a higher likelihood of errors which affect their work performance [47]. Several limitations might have influenced the results we obtained. First, our participants were employees in technology companies, which might not be generalizable to all Taiwanese employees. Second, this study was cross-sectional research; thus, we were unable to conclude causal relationships between the health status and reduced productivity at work due to illness. Further research is required to assess measurement properties of the CSPS-6 in other working populations and the long-term effects of health problems on presenteeism.
Presenteeism is a key public health problem because it reduces the quality of work output in employees and causes hidden indirect costs for organizations. Our study proved that the CSPS-6 has acceptable reliability and validity to measure productivity loss with less bias because of the lack of valid instruments. Our research can be a basis for future studies on assessing of treatment interventions on employee productivity and health in clinical settings or the effectiveness of health-promotion programs in the workplace to reduce productivity losses among employees.
5. Conclusions
In conclusion, the CSPS-6 has acceptable reliability and validity to measure reduced productivity at work due to illness of Taiwanese employees at technology companies. Further research should be undertaken to validate the CSPS-6 in other working populations and assess the long-term effects of health problems on reduced productivity.
Supplementary Materials
The following supporting information can be downloaded at www.mdpi.com/article/10.3390/healthcare10112202/s1: The original English version and the traditional Chinese version of the Stanford Presenteeism Scale [6].
Author Contributions
Conceptualization, K.-N.T.-T.; methodology, K.-N.T.-T. and K.-J.C.; software, K.-N.T.-T.; validation, K.-J.C.; formal analysis, K.-N.T.-T.; investigation, K.-J.C.; resources, K.-J.C.; data curation, K.-N.T.-T. and K.-J.C.; writing—original draft preparation, K.-N.T.-T.; writing—review and editing, K.-J.C.; visualization, K.-N.T.-T.; supervision, K.-J.C.; project administration, K.-J.C.; funding acquisition, K.-J.C. All authors read and agreed to the published version of the manuscript.
Funding
This research was funded by the Institute of Labor, Occupational Safety and Health, Ministry of Labor, Taiwan, grant number ILOSH110-A701. The APC was funded by the Institute of Labor, Occupational Safety and Health, Ministry of Labor, Taiwan.
Institutional Review Board Statement
The study was conducted in accordance with the Declaration of Helsinki and approved by the Joint Institutional Review Board of Taipei Medical University (TMU-JIRB no.: N202105092 on 23 June 2021).
Informed Consent Statement
Informed consent was obtained from all subjects involved in the study.
Data Availability Statement
Not applicable.
Acknowledgments
The authors truly appreciate the professors and experts for their support in developing the translated version. The authors are grateful to the Institute of Labor, Occupational Safety and Health, Ministry of Labor, Taiwan for the funding.
Conflicts of Interest
The authors declare no conflict of interest. The funders had no role in the design of the study; in the collection, analyses, or interpretation of data; in the writing of the manuscript; or in the decision to publish the results.
References
- Kessler, R.C.; Barber, C.; Beck, A.; Berglund, P.; Cleary, P.D.; McKenas, D.; Pronk, N.; Simon, G.; Stang, P.; Ustun, T.B.; et al. The World Health Organization Health and Work Performance Questionnaire (HPQ). J. Occup. Environ. Med. 2003, 45, 156–174. [Google Scholar] [CrossRef] [PubMed]
- Kessler, R.C.; Ames, M.; Hymel, P.A.; Loeppke, R.; McKenas, D.K.; Richling, D.E.; Stang, P.E.; Ustun, T.B. Using the World Health Organization Health and Work Performance Questionnaire (HPQ) to Evaluate the Indirect Workplace Costs of Illness. J. Occup. Environ. Med. 2004, 46, S23–S37. [Google Scholar] [CrossRef] [PubMed]
- Bergström, G.; Bodin, L.; Hagberg, J.; Lindh, T.; Aronsson, G.; Josephson, M. Does Sickness Presenteeism Have an Impact on Future General Health? Int. Arch. Occup. Environ. Health 2009, 82, 1179–1190. [Google Scholar] [CrossRef] [PubMed]
- Stewart, W.F.; Ricci, J.A.; Chee, E.; Morganstein, D.; Lipton, R. Lost Productive Time and Cost Due to Common Pain Conditions in the US Workforce. JAMA 2003, 290, 2443–2454. [Google Scholar] [CrossRef]
- Goetzel, R.Z.; Long, S.R.; Ozminkowski, R.J.; Hawkins, K.; Wang, S.; Lynch, W. Health, Absence, Disability, and Presenteeism Cost Estimates of Certain Physical and Mental Health Conditions Affecting U.S. Employers. J. Occup. Environ. Med. 2004, 46, 398–412. [Google Scholar] [CrossRef]
- Koopman, C.; Pelletier, K.R.; Murray, J.F.; Sharda, C.E.; Berger, M.L.; Turpin, R.S.; Hackleman, P.; Gibson, P.; Holmes, D.M.; Bendel, T. Stanford Presenteeism Scale: Health Status and Employee Productivity. J. Occup. Environ. Med. 2002, 44, 14–20. [Google Scholar] [CrossRef]
- Johns, G. Presenteeism in the Workplace: A Review and Research Agenda: Presenteeism in the workplace. J. Organ. Behav. 2010, 31, 519–542. [Google Scholar] [CrossRef]
- Ospina, M.B.; Dennett, L.; Waye, A.; Jacobs, P.; Thompson, A.H. A Systematic Review of Measurement Properties of Instruments Assessing Presenteeism. Am. J. Manag. CARE 2015, 21, 15. [Google Scholar]
- Hubens, K.; Krol, M.; Coast, J.; Drummond, M.F.; Brouwer, W.B.F.; Uyl-de Groot, C.A.; Hakkaart-van Roijen, L. Measurement Instruments of Productivity Loss of Paid and Unpaid Work: A Systematic Review and Assessment of Suitability for Health Economic Evaluations From a Societal Perspective. Value Health 2021, 24, 1686–1699. [Google Scholar] [CrossRef]
- Frauendorf, R.; de Medeiros Pinheiro, M.; Ciconelli, R.M. Translation into Brazilian Portuguese, Cross-Cultural Adaptation and Validation of the Stanford Presenteeism Scale-6 and Work Instability Scale for Ankylosing Spondylitis. Clin. Rheumatol. 2014, 33, 1751–1757. [Google Scholar] [CrossRef]
- Laranjeira, C.A. Validation of the Portuguese Version of the Stanford Presenteeism Scale in Nurses: Portuguese Stanford Presenteeism Scale. Int. J. Nurs. Pract. 2013, 19, 644–650. [Google Scholar] [CrossRef] [PubMed]
- Hutting, N.; Engels, J.A.; Heerkens, Y.F.; Staal, J.B.; Nijhuis-van der Sanden, M.W.G. Development and Measurement Properties of the Dutch Version of the Stanford Presenteeism Scale (SPS-6). J. Occup. Rehabil. 2014, 24, 268–277. [Google Scholar] [CrossRef]
- Cicolini, G.; Della Pelle, C.; Cerratti, F.; Franza, M.; Flacco, M.E. Validation of the Italian Version of the Stanford Presenteeism Scale in Nurses. J. Nurs. Manag. 2016, 24, 598–604. [Google Scholar] [CrossRef]
- Abdi, F.; Jahangiri, M.; Kamalinia, M.; Cousins, R.; Mokarami, H. Presenteeism and Work Ability: Development of the Persian Version of the Stanford Presenteeism Scale (P-SPS-6) and Measurement of Its Psychometric Properties. BMC Psychol. 2021, 9, 120. [Google Scholar] [CrossRef] [PubMed]
- Baldonedo-Mosteiro, M.; Sánchez-Zaballos, M.; Rodríguez-Díaz, F.J.; Herrero, J.; Mosteiro-Díaz, M.P. Adaptation and Validation of the Stanford Presenteeism Scale-6 in Healthcare Professionals. Int. Nurs. Rev. 2020, 67, 109–117. [Google Scholar] [CrossRef] [PubMed]
- Intensive Care Unit Nurse, Sisli Hamidiye Etfal Training and Research Hospital, University of Health Sciences Turkey, Istanbul, Turkey; Teoman, E.; Seren, A.K.H.; Department of Nursing, Fenerbahce University, Faculty of Health Sciences, Istanbul, Turkey. Psychometrics of Stanford Presenteeism Scale-Short Form in Turkish. Florence Nightingale J. Nurs. 2022, 30, 190–195. [Google Scholar] [CrossRef]
- Paschoalin, H.C.; Griep, R.H.; Lisboa, M.T.L.; de Mello, D.C.B. Transcultural Adaptation and Validation of the Stanford Presenteeism Scale for the Evaluation of Presenteeism for Brazilian Portuguese. Rev. Lat. Am. Enfermagem 2013, 21, 388–395. [Google Scholar] [CrossRef]
- Mokkink, L.B.; Terwee, C.B.; Patrick, D.L.; Alonso, J.; Stratford, P.W.; Knol, D.L.; Bouter, L.M.; de Vet, H.C.W. The COSMIN Study Reached International Consensus on Taxonomy, Terminology, and Definitions of Measurement Properties for Health-Related Patient-Reported Outcomes. J. Clin. Epidemiol. 2010, 63, 737–745. [Google Scholar] [CrossRef]
- Braakman-Jansen, L.M.A.; Taal, E.; Kuper, I.H.; van de Laar, M.A.F.J. Productivity Loss Due to Absenteeism and Presenteeism by Different Instruments in Patients with RA and Subjects without RA. Rheumatology 2012, 51, 354–361. [Google Scholar] [CrossRef]
- Sousa, V.D.; Rojjanasrirat, W. Translation, Adaptation and Validation of Instruments or Scales for Use in Cross-Cultural Health Care Research: A Clear and User-Friendly Guideline: Validation of Instruments or Scales. J. Eval. Clin. Pract. 2011, 17, 268–274. [Google Scholar] [CrossRef]
- Jackson, D.L. Revisiting Sample Size and Number of Parameter Estimates: Some Support for the N:Q Hypothesis. Struct. Equ. Model. Multidiscip. J. 2003, 10, 128–141. [Google Scholar] [CrossRef]
- Kline, R.B. Principles and Practice of Structural Equation Modeling, 4th ed.; Guilford Press: New York, NY, USA, 2016. [Google Scholar]
- Hays, R.D.; Sherbourne, C.D.; Mazel, R.M. The Rand 36-Item Health Survey 1.0. Health Econ. 1993, 2, 217–227. [Google Scholar] [CrossRef] [PubMed]
- Reilly, M.C.; Zbrozek, A.S.; Dukes, E.M. The Validity and Reproducibility of a Work Productivity and Activity Impairment Instrument. PharmacoEconomics 1993, 4, 353–365. [Google Scholar] [CrossRef] [PubMed]
- Ta-Thi, K.-N.; Chuang, K.-J. A Comparison of the Validities of Traditional Chinese Versions of the Work Productivity and Activity Impairment Questionnaire: General Health and the World Health Organization’s Health and Work Performance Questionnaire. Int. J. Environ. Res. Public Health 2022, 19, 4417. [Google Scholar] [CrossRef] [PubMed]
- R Core Team. R: A Language and Environment for Statistical Computing; R Foundation for Statistical Computing: Vienna, Austria, 2022. [Google Scholar]
- Taber, K.S. The Use of Cronbach’s Alpha When Developing and Reporting Research Instruments in Science Education. Res. Sci. Educ. 2018, 48, 1273–1296. [Google Scholar] [CrossRef]
- McHorney, C.A.; Tarlov, A.R. Individual-Patient Monitoring in Clinical Practice: Are Available Health Status Surveys Adequate? Qual. Life Res. 1995, 4, 293–307. [Google Scholar] [CrossRef]
- Polit, D.F.; Beck, C.T. The Content Validity Index: Are You Sure You Know What’s Being Reported? Critique and Recommendations. Res. Nurs. Health 2006, 29, 489–497. [Google Scholar] [CrossRef]
- Rubio, D.M.; Berg-Weger, M.; Tebb, S.S.; Lee, E.S.; Rauch, S. Objectifying Content Validity: Conducting a Content Validity Study in Social Work Research. Soc. Work Res. 2003, 27, 94–104. [Google Scholar] [CrossRef]
- Polit, D.F.; Beck, C.T.; Owen, S.V. Is the CVI an Acceptable Indicator of Content Validity? Appraisal and Recommendations. Res. Nurs. Health 2007, 30, 459–467. [Google Scholar] [CrossRef]
- Halek, M.; Holle, D.; Bartholomeyczik, S. Development and Evaluation of the Content Validity, Practicability and Feasibility of the Innovative Dementia-Oriented Assessment System for Challenging Behaviour in Residents with Dementia. BMC Health Serv. Res. 2017, 17, 554. [Google Scholar] [CrossRef]
- Fleiss, J.L.; Levin, B.; Paik, M.C. Statistical Methods for Rates and Proportions, 3rd ed.; John Wiley: Hoboken, NJ, USA, 2003; ISBN 978-0-471-52629-2. [Google Scholar]
- Kaiser, H.F. An Index of Factorial Simplicity. Psychometrika 1974, 39, 31–36. [Google Scholar] [CrossRef]
- Williams, B.; Onsman, A.; Brown, T. Exploratory Factor Analysis: A Five-Step Guide for Novices. Australas. J. Paramed. 2010, 8, 3. [Google Scholar] [CrossRef]
- Kaiser, H.F. The Application of Electronic Computers to Factor Analysis. Educ. Psychol. Meas. 1960, 20, 141–151. [Google Scholar] [CrossRef]
- Norris, M.; Lecavalier, L. Evaluating the Use of Exploratory Factor Analysis in Developmental Disability Psychological Research. J. Autism Dev. Disord. 2010, 40, 8–20. [Google Scholar] [CrossRef] [PubMed]
- Pett, M.A.; Lackey, N.R.; Sullivan, J.J. Making Sense of Factor Analysis: The Use of Factor Analysis for Instrument Development in Health Care Research; SAGE Publications: Thousand Oaks, CA, USA, 2003; ISBN 978-0-7619-1949-0. [Google Scholar]
- Cattell, R.B. The Scree Test For The Number Of Factors. Multivar. Behav. Res. 1966, 1, 245–276. [Google Scholar] [CrossRef] [PubMed]
- Hu, L.; Bentler, P.M. Cutoff Criteria for Fit Indexes in Covariance Structure Analysis: Conventional Criteria versus New Alternatives. Struct. Equ. Model. Multidiscip. J. 1999, 6, 1–55. [Google Scholar] [CrossRef]
- Tabachnick, B.G.; Fidell, L.S. Using Multivariate Statistics, 6th ed.; Pearson Education Inc.: New York City, NY, USA, 2013. [Google Scholar]
- Comrey, A.L.; Lee, H.B. A First Course in Factor Analysis, 2nd ed.; L. Erlbaum Associates: Hillsdale, NJ, USA, 1992; ISBN 978-0-8058-1062-2. [Google Scholar]
- Cohen, J. Statistical Power Analysis for the Behavioral Sciences, 2nd ed.; L. Erlbaum Associates: Hillsdale, NJ, USA, 1988; ISBN 978-0-8058-0283-2. [Google Scholar]
- Kawai, K.; Kawai, A.T.; Wollan, P.; Yawn, B.P. Adverse Impacts of Chronic Pain on Health-Related Quality of Life, Work Productivity, Depression and Anxiety in a Community-Based Study. Fam. Pract. 2017, 34, 656–661. [Google Scholar] [CrossRef]
- Keramat, S.A.; Alam, K.; Gow, J.; Biddle, S.J.H. A Longitudinal Exploration of the Relationship between Obesity, and Long Term Health Condition with Presenteeism in Australian Workplaces, 2006–2018. PLoS ONE 2020, 15, e0238260. [Google Scholar] [CrossRef]
- Yang, T.; Guo, Y.; Ma, M.; Li, Y.; Tian, H.; Deng, J. Job Stress and Presenteeism among Chinese Healthcare Workers: The Mediating Effects of Affective Commitment. Int. J. Environ. Res. Public. Health 2017, 14, 978. [Google Scholar] [CrossRef]
- Niven, K.; Ciborowska, N. The Hidden Dangers of Attending Work While Unwell: A Survey Study of Presenteeism Among Pharmacists. Int. J. Stress Manag. 2015, 22, 207–221. [Google Scholar] [CrossRef]
Publisher’s Note: MDPI stays neutral with regard to jurisdictional claims in published maps and institutional affiliations. |
© 2022 by the authors. Licensee MDPI, Basel, Switzerland. This article is an open access article distributed under the terms and conditions of the Creative Commons Attribution (CC BY) license (https://creativecommons.org/licenses/by/4.0/).