Review

Reliability Generalization Meta-Analysis of Internet Gaming Disorder Scale

by
Júlia Gisbert-Pérez
1,
Manuel Martí-Vilar
1,*,
César Merino-Soto
2,* and
Miguel Vallejos-Flores
3
1
Departamento de Psicología Básica, Facultad de Psicología y Logopedia, Universitat de València, 46010 Valencia, Spain
2
Instituto de Investigación de Psicología, Universidad de San Martín de Porres, 15026 Lima, Peru
3
Facultad de Psicología, Universidad Nacional Federico Villareal, 15088 Lima, Peru
*
Authors to whom correspondence should be addressed.
Healthcare 2022, 10(10), 1992; https://doi.org/10.3390/healthcare10101992
Submission received: 18 August 2022 / Revised: 28 September 2022 / Accepted: 30 September 2022 / Published: 11 October 2022

Abstract

:
The objective of this study was to carry out a reliability generalization meta-analysis of the Internet Gaming Disorder Scale (IGDS) to find out if it presents adequate values that justify its application in its four versions: original and abbreviated with dichotomous or ordinal response. A systematic review including 26 studies that apply this instrument from 2015 to June 2022 was conducted. For each version, a reliability generalization meta-analysis was performed with the random coefficients (RC) and varying coefficients (VC) model. Results showed reliability levels > 0.80 in the ordinal versions (IGDS9P and IGDS27P) and in the dichotomous 27-item version (IGDS27D), while the dichotomous 9-item version (IGDS9D) produced levels > 0.70. High heterogeneity was found in all versions (I2 > 95%; Rb > 90%). Cronbach’s α means with both models (RC-VC) did not differ significantly except for the IGDS9D version. It is concluded that, considering the dependence of the results on sample size, abbreviated versions do not guarantee that reliability remains acceptable, and dichotomous versions may provide limited but acceptable reliability. Finally, IGDS27P version is recommended in contexts where high precision is required.

1. Introduction

1.1. Literature Review

Since the inclusion of Internet gaming disorder (IGD) in the DSM-5 [1], a set of controversies and opportunities arose for mental health professionals regarding the evaluation and intervention of IGD [2,3]. This incorporation reinforced the development and adaptations of psychometric instruments that evaluate the IGD, presenting a set of proposals based on DSM-5 diagnostic criteria [4].
According to DSM-5, IGD is characterized by a pattern of persistent and recurrent gaming behavior that leads to clinically significant impairment or discomfort over 12 months, in which five or more symptoms are present such as preoccupation with gaming, withdrawal symptoms when not gaming (sadness, anxiety, and irritability), tolerance, inability to reduce or stop gaming, giving up other pleasurable activities, continuing to game despite problems, misleading family or others about the amount gaming time, using gaming to relieve negative moods, and risking or losing a job or relationship over gaming [1]. Although this disorder is labeled “online” due to its association with specific online games, it can also develop with offline games [1] (p. 796). It is also included in the ICD-11 as a “video game disorder” [5].
In a systematic review and meta-analysis of IGD prevalence in 17 countries [6], the worldwide prevalence was estimated to be 3.05%. These rates exceed the prevalence of problem gaming, and are similar to those of some substance use disorders and obsessive-compulsive disorder [6].
IGD usually begins in early adolescence [7,8]. During adolescence, there are higher rates of gaming-related problems compared to older age groups [6,9,10,11]. Thus, the pooled prevalence of IGD is 4.6% in adolescent samples [12], with higher rates in men (6.8%) than in women (1.3%). Regarding the geographical context, Asia and North America report a higher prevalence of IGD in adolescents (9.9% and 9.4%, respectively), who also present the highest rates of video game use [13].
However, the prevalence of problematic video game use among adults should be considered. In an intergenerational prevalence study [11], IGD rates were compared among 847 Millennials, Generation X’ers, and Baby Boomers from Hong Kong. The prevalence of IGD increased in the younger generations, being a worrying phenomenon both in Millennials (7.4% of the general sample) and in Generation X (1.3% of the general sample).
With the COVID-19 pandemic, there has been an increase in the number of video game users and related phenomena, such as video game streaming [14]. However, cases of Internet gaming disorders have also increased by between 1–2.5% [15]. This highlights the current importance of the comprehensive and intergenerational study of this phenomenon and the development of reliable diagnostic instruments for IGD.
Since the introduction of IGD in the DSM-5, different instruments have been developed for its diagnosis, such as the Internet Gaming Disorder Test-IGD-20 [16], the Questionnaire of Experiences Related to Video Games (CERV) [17], or the Internet Gaming Disorder Scale (IGDS) [9], among others. This study focuses on the IGDS of Lemmens et al. [9] as it provides greater possibilities in terms of response format (dichotomous and polytomous version), extension (27 or 9 items), and multiple adaptations to other languages [18,19,20].
The IGDS is an instrument based on the nine DSM-5 IGD diagnostic criteria: preoccupation, tolerance, withdrawal, persistence, escape, problems, deception, displacement, and conflict [1]. Since the initial proposal, four variants have been presented: a 27-item scale with a polytomous response or IGDS27P (Likert 0–6), a 27-item scale with dichotomous responses or IGDS27D, a 9-item scale with a polytomous response or IGDS9P (Likert 0–6) and a 9-item scale with a dichotomous response or IGDS9D [9]. The psychometric properties found for all the scales were evaluated in samples of adolescents and young adults, finding high internal consistency in all of them (coefficient α): IGDS27P (>0.94), IGDS27D (>0.93), IGDS9P (>0.95), and IGDS9D (>0.83) [9]. The evidence for validity was acceptable, as well as evidence for content validity [18], internal structure [9,18,19,21], and validity in relation to other variables [9,18,19,22].
Regarding its structure, the unidimensionality of the scale has been reported in some studies [9,18,21] and multidimensional in others [19]. For the diagnosis of gaming disorder, the cut-off point recommended and established by researchers is to present five or more criteria during 12 months, based on the recommendation of the DSM-5 [9]. This criterion, assumed from the DSM-5 (>5), showed high specificity and adequate sensitivity [23]. These authors, assuming this cut-off point, identified three types of players: normal, risk, and disordered [9,21].
However, despite its frequent use, no study reports its average reliability across multiple application studies. The need for a study of these characteristics adds to the fact that some studies report low-reliability values [20,23,24], and therefore, the reliability scores of the instrument may not justify its use. Reliability generalization meta-analyses are used to statistically integrate reliability estimates calculated in different applications of an instrument. In addition, they provide information on how different sample characteristics affect the variation in an instrument’s reliability indices [25]. It should be considered that some aspects can increase the variance error, affecting reliability. Some authors highlight the fatigue in the participants [26], the lack of monitoring in massive applications, or the induction of the validity of the instrument [27,28], among others. Quality controls and specifying the conditions of application contribute to the reliability of the instrument scores [29].
Having a meta-analysis of an instrument that presents good reliability is useful both for a good diagnosis and for providing adequate care to users who require it [30]. After a previous search, no examples of this type of meta-analysis have been found for the IGDS. However, while it was being carried out, a study was detected that included a reliability generalization meta-analysis of the IGDS [31], with which there are substantial differences in the included versions of the IGDS, the meta-analytic models employed, the sample size, and the sample size, and the assessment of heterogeneity. Therefore, this study includes the four main versions of the IGDS, as well as more models and reliability and heterogeneity estimators, and discusses which of the four versions may be more reliable. A more comprehensive differentiation between the two studies is included in Appendix A.
Given that IGD usually begins and develops during adolescence, such a study could benefit clinical practice by providing evidence of the reliability of a diagnostic tool for IGD, as well as promoting the prevention and early treatment of IGD.

1.2. Goal Setting

To carry out this study, a main research question was posed: does the IGDS in its four versions present adequate reliability values to justify its application? Consequently, the main objective of this study is to carry out a reliability generalization meta-analysis to estimate the internal consistency of the IGDS in order to know whether it presents adequate values that justify its application in all its versions. Likewise, it is intended to analyze whether the reliability indices are affected by the characteristics of the studies. It was hypothesized that the IGDS, in its four versions, would continue to be an instrument with good internal consistency reliability.

2. Materials and Methods

2.1. Information Sources

After not identifying a systematic review or meta-analysis similar to the one proposed, a systematic review was carried out following the PRISMA 2020 method [32] in the Web of Science (WoS, Main Collection), PsycInfo, Scopus, and Dialnet databases.

2.2. Eligibility Criteria

A protocol was registered in PROSPERO, with the identification code CRD42022330840. For screening, the following inclusion criteria were proposed: (a) original empirical studies that apply the IGDS, (b) include the IGDS in the original or translated language, (c) include the IGDS in the original or reduced version, (d) validations and adaptations of the IGDS, and (e) report the reliability of the instrument using Cronbach’s α or another indicator. It was not considered to limit the search to the type of sample, since the instrument has been adapted to different populations. Likewise, those studies that met any of the following exclusion criteria were discarded: (a) not using the IGDS and (b) book chapters or books.

2.3. Search Strategy

First, manuscripts using IGDS instrument [9] were identified in three iterations. The search was carried out in July 2021 and was updated in June 2022. This process was carried out by one of the authors and corroborated by another through the Covidence tool.

2.3.1. First Iteration

The first search was performed on the Web of Science (WoS Main Collection), PsycInfo, Scopus, and Dialnet databases. On all bases, the term “Internet Gaming Disorder Scale” was introduced to include all those works that contained said instrument. Given the generality of the search profile, the results were refined by including only the works between 2015 and June 2022, both inclusive, and written in English and Spanish.
The search was limited to the field of psychology. In the WoS database, the search was limited to the categories “social sciences”, “psychology”, “applied psychology”, “clinical psychology”, “developmental psychology”, “experimental psychology”, “multidisciplinary psychology”, and “psychology Social”. In Scopus, the fields of study “psychology” and “social sciences” were selected. In Dialnet, it was not limited by the field of study. At PsycInfo, the field of study was also not limited by being a psychology database.

2.3.2. Second Iteration

The second search was manual, reviewing the references of the studies found in the first search.

2.3.3. Third Iteration

A second manual search was performed in Google Scholar to expand the sample.

2.4. Selection of Studies

Once duplicates were eliminated with RefWorks bibliographic manager, the Covidence Software was used to carry out a blind peer review by title and abstract, and full text, following the eligibility criteria. In longitudinal studies or those that included more than one measurement performed on the same subjects, the first study was selected, or in its exception, the first that reported a reliability coefficient. In contrast, studies using more than one sample and their reliability values were considered independent samples.

2.5. Data Extraction

The reliability coefficient of the selected studies (α, McDonald’s omega (ω), or test-retest) was manually extracted. Both reported (i.e., the study’s coefficient) and induced reliability values were considered. In this scale, the use of the single score or total α (although there are several specific dimensions) is indicated and was used for the correlations of the original study. Therefore, no study reports the reliability of the 9 dimensions of the scale.
Regarding the induced reliability, it was subdivided into three categories: omitted, vague, and precise [33]. It was considered omitted when no reliability coefficient was reported in the study, vague when “good” reliability was expressed by citing other previous studies, and precise when the exact value of a previous study was reported.
From the studies with reported reliability values, information was extracted regarding the year of publication, version of the IGDS, the language of the IGDS, country of application, application method, sample size, general characteristics of the sample, and classification of the gamers in the sample (include only players or players and non-players), mean age, mean IGDS scores and standard deviation, percentage of women in the sample, mean weekly gaming hours, data collection method, adjustment indices, use of test-retest, presence of statistical validation of the IGDS, and percentage IGD+ in the sample. Data extraction was performed with Covidence and Microsoft Excel.

2.6. Analysis

After obtaining the sample, a reliability generalization meta-analysis was performed for each version of the IGDS following the recommendations of the REGEMA checklist (Appendix B).

2.6.1. Description and Evaluation of α Coefficients

The adequacy of the reliability in each study, and the mean α coefficient, were evaluated by comparing their confidence intervals (95%) obtained against a null value [34]. This null value was established in two values of the coefficient α: 0.70 and 0.80. These values were chosen because they are usually minimum criteria to generically determine the appropriateness of a reliability coefficient [35].

2.6.2. Modeling

Due to the characteristics of the study that could influence the conclusions (i.e., inter-study and intra-study heterogeneity, and the size of the selected studies), the modeling decision was oriented towards two approaches: random coefficients (RC model) [36] and variant coefficients (VC model) [37].
Random coefficients model. There are several contextual factors (e.g., a large number of measures applied to an examinee, evaluation monitored by an examiner or without monitoring, etc.), individual variables (e.g., mood, motivation, effort, personality attributes, etc.), data quality (e.g., multivariate outliers, response trends, etc.), and the interaction between them, which can produce variability in the estimation of the reliability of the obtained score [38,39]. Thus, the first model for meta-analyzing the α coefficients of the IGDS was random effects (RC) [36]. RC has several underlying assumptions: first, the estimates obtained vary from study to study, due to actual differences between studies, and due to sampling variation. Second, the study sample came from a random selection from a normally distributed population of α coefficients, which implies that this is an overpopulation. Third, to generalize the results to future studies not similar to this study, the RC model is generally accepted as the recommended option, and is one of the preferred goals of research [40].
For the estimation of the amount of variance between studies (τ2) [41], the restricted maximum likelihood (REML) method [42] was implemented, with the Knapp–Hartung modification [43] was applied to the statistical test of variability (Q) [44], τ2, and confidence intervals. This method is based on the Student’s t-distribution and tends to provide more robust estimates under various data conditions [45]. The measures of heterogeneity of the selected studies were: (a) the statistical test Q [44], with the significance level set at 0.10 [46], and (b) estimators of the size of heterogeneity: I2 [47], Rb [48], and CVb and CVw [48] as measures of between-study and intra-study variability, respectively [48].
Due to the potential bias produced in the estimation of I2 in meta-analyses with a small number of studies [49], its interpretation mainly used its confidence intervals. Two qualitative criteria used to interpret I2 were: The first, by Deeks et al. [50] and Higgins et al. [47]: <I2 = 40% (“could be small”), I2 = 30–60% (“could be moderate”), I2 = 50–90% (“could be moderate”), and I2 = 75–100% (“could be substantial”). The second, by Higgins et al. [51]: I2 < 25% (trivial), I2 ≥ 25% (minor), I2 ≥ 50% (moderate), and I2 ≥ 75% (substantial).
According to the recommendation of Sánchez-Meca et al. [52] and Romano et al. [53], under the RC model, the α coefficients were transformed with the Bonett method [54], L i = L n 1 α , and their sampling variance [54] was obtained with: V i = 2 J J 1 n i 2 , in which J: number of items and ni: sample size of the study. On the other hand, the weighting of the studies to obtain the αmean was conducted with the general approach of creating weights based on the inverse of the variance [55]. To assess the independence between the size (i.e., number of participants) and the α coefficient of the studies [37,56], both parameters were correlated. Respectively, for IGDS9D, IGDS9P, IGDS27D, and IGDS27P, the following was obtained: r = 0.149 (p = 0.53), r = −0.213 (p = 0.78), r = 0.382 (p = 0.61), and r = −0.793 (p = 0.108). According to the lack of statistical significance, the weights could be applied with little apparent risk of bias in the estimation of the αmean in the IGDS9D, IGDS9P, and IGDS27D, but the interpretation of the results requires caution in IGDS27P due to the size of the correlation.
Varying coefficients model. Although meta-analytic research usually uses the RC model, the analysis was also conducted with the varying coefficients (VC) model [37]. This model was chosen due to: (a) the unlikely fulfillment of the assumption of normality of the hypothetical population of α coefficients, (b) the actual absence of random selection of manuscripts, and (c) the small number of selected studies (i.e., less than 6 in IGDS9P, IGDS27D, and IGDS27P). These are conditions that make it difficult to justify the RC model, particularly when the identification of a well-defined population of studies is problematic [37]. Specifically, in our study, variability is observed in multiple factors of the sample. Firstly, there are differences in gamer conceptualization. On the one hand, some studies define a gamer according to a minimum game frequency (e.g., playing at least once a month [9,21,57,58,59,60,61]), while others only consider as gamers those who currently play [18,19,20,24,62,63,64,65,66,67]. On the other hand, some studies did not specify what they considered as a gamer, since in most of these cases the diagnosis of IGD was not their main objective [15,20,68,69,70,71,72,73,74]. Differences are also observed in terms of the characteristics of the samples, sometimes including players and non-players or exclusively gamers. In some studies, game intensity (hours and days of game), gamer profiles (players for fun, amateur, professionals, etc.), and video game genre (e.g., MMORPG) were considered. Methodological variability was also observed. Finally, both the size and age groups of the study samples are variable, ranging from 204 to 2078 participants, including adolescents, young adults, adults, and the general community. Consequently, heterogeneity is present in different combinations of the aforementioned variables.
VC model is an appropriate approach when the number of meta-analyzed studies is small (<30) [52], when strong heterogeneity is present (in the Results section, this is observed), and when there was no randomized extraction of studies [75]. In contrast to the RC model, the generalizability of the VC results is oriented to a population of studies similar to those that were selected [52]. VC does not assume compliance with the common assumptions of fixed effects and random coefficient methods [76]. In the VC method, the log-transformation is applied to αmean (ln [1 − αmean]) [37] to stabilize the variance [54], and the studies are not weighted to obtain the mean meta-analytics.

2.6.3. Sources of Heterogeneity

Due to the small number of studies analyzed (<25), the identification of sources of heterogeneity in the IGDS with the largest number of meta-analyzed studies (i.e., IGDS9D, n studies = 20) was explored with K-means cluster analysis, within a dependency cluster–covariate analysis [77]. Accordingly, (a) strictly exploratory clusters were identified with the K-means procedure, and (b) these clusters were compared with the existing natural clusters in the studies. This comparison was made using the χ2 independence test, and the Cramer-V effect size estimator. The similarity found in this comparison would suggest the substantive interpretation of these new groupings and avoid random capitalizing. The descriptive variables were: the language of the scale (original and English dichotomous classification), mode of application, age characteristics of the sample (adolescents, young people, adults, or general community), and the condition of gamers in the sample (only gamers or mixed samples with gamers and non-gamers) (Appendix C). Differences in mean alpha estimates for each group of studies were estimated using Bonnet’s method [37], based on the confidence interval of the differences (CI ∆diff).
In the versions with smaller number of meta-analyzed studies (i.e., IGDS9P, IGDS27D, and IGDS27P; in all n ≤ 5), subgroup identification was performed on a quantitative–qualitative basis, and within qualitative evidence synthesis (QES) framework [78]. This was conducted to identify the distinguishing characteristic of the studies that could be associated with the variability of the αmean coefficient. The procedure followed was: (a) quantitative identification of homogeneous groups with K-means cluster analysis, (b) content exploration of the identified groups by K-means analysis (i.e., qualitative examination of the characteristics of their studies from their descriptive variables: instrument language, etc.), (c) assignment of apparent quality that distinguishes these identified groups, and (d) reproducibility evaluation of the three previous steps (independently by one of the authors).

2.6.4. Outliers and Robust Estimation

As part of the heterogeneity assessment, outliers were detected for each study, and the mean α was robustly reestimated excluding them. For each study, its impact on τ2 was also estimated, using the VRATIO and TAURATIO statistics [79]; the cut-off point Q (Qvratio and Qtauratio) to identify the strength of the impact of each study (VRATIO > Qvratio; TAURATIO > Qtauratio) was established with 1000 bootstrap samples [79].
Regarding the software used, the following R programs were used: RC modeling with metafor [80], VC modeling with vcmeta [81], the impact assessment of each study on variability was conducted with boutliers [79], outlier detection and robust estimation were conducted with the dmetar [82], alternative measures of heterogeneity (Rb, CVb, CVw) were obtained with the R hetmeta [48], and K-means cluster analysis with R stats [83].

3. Results

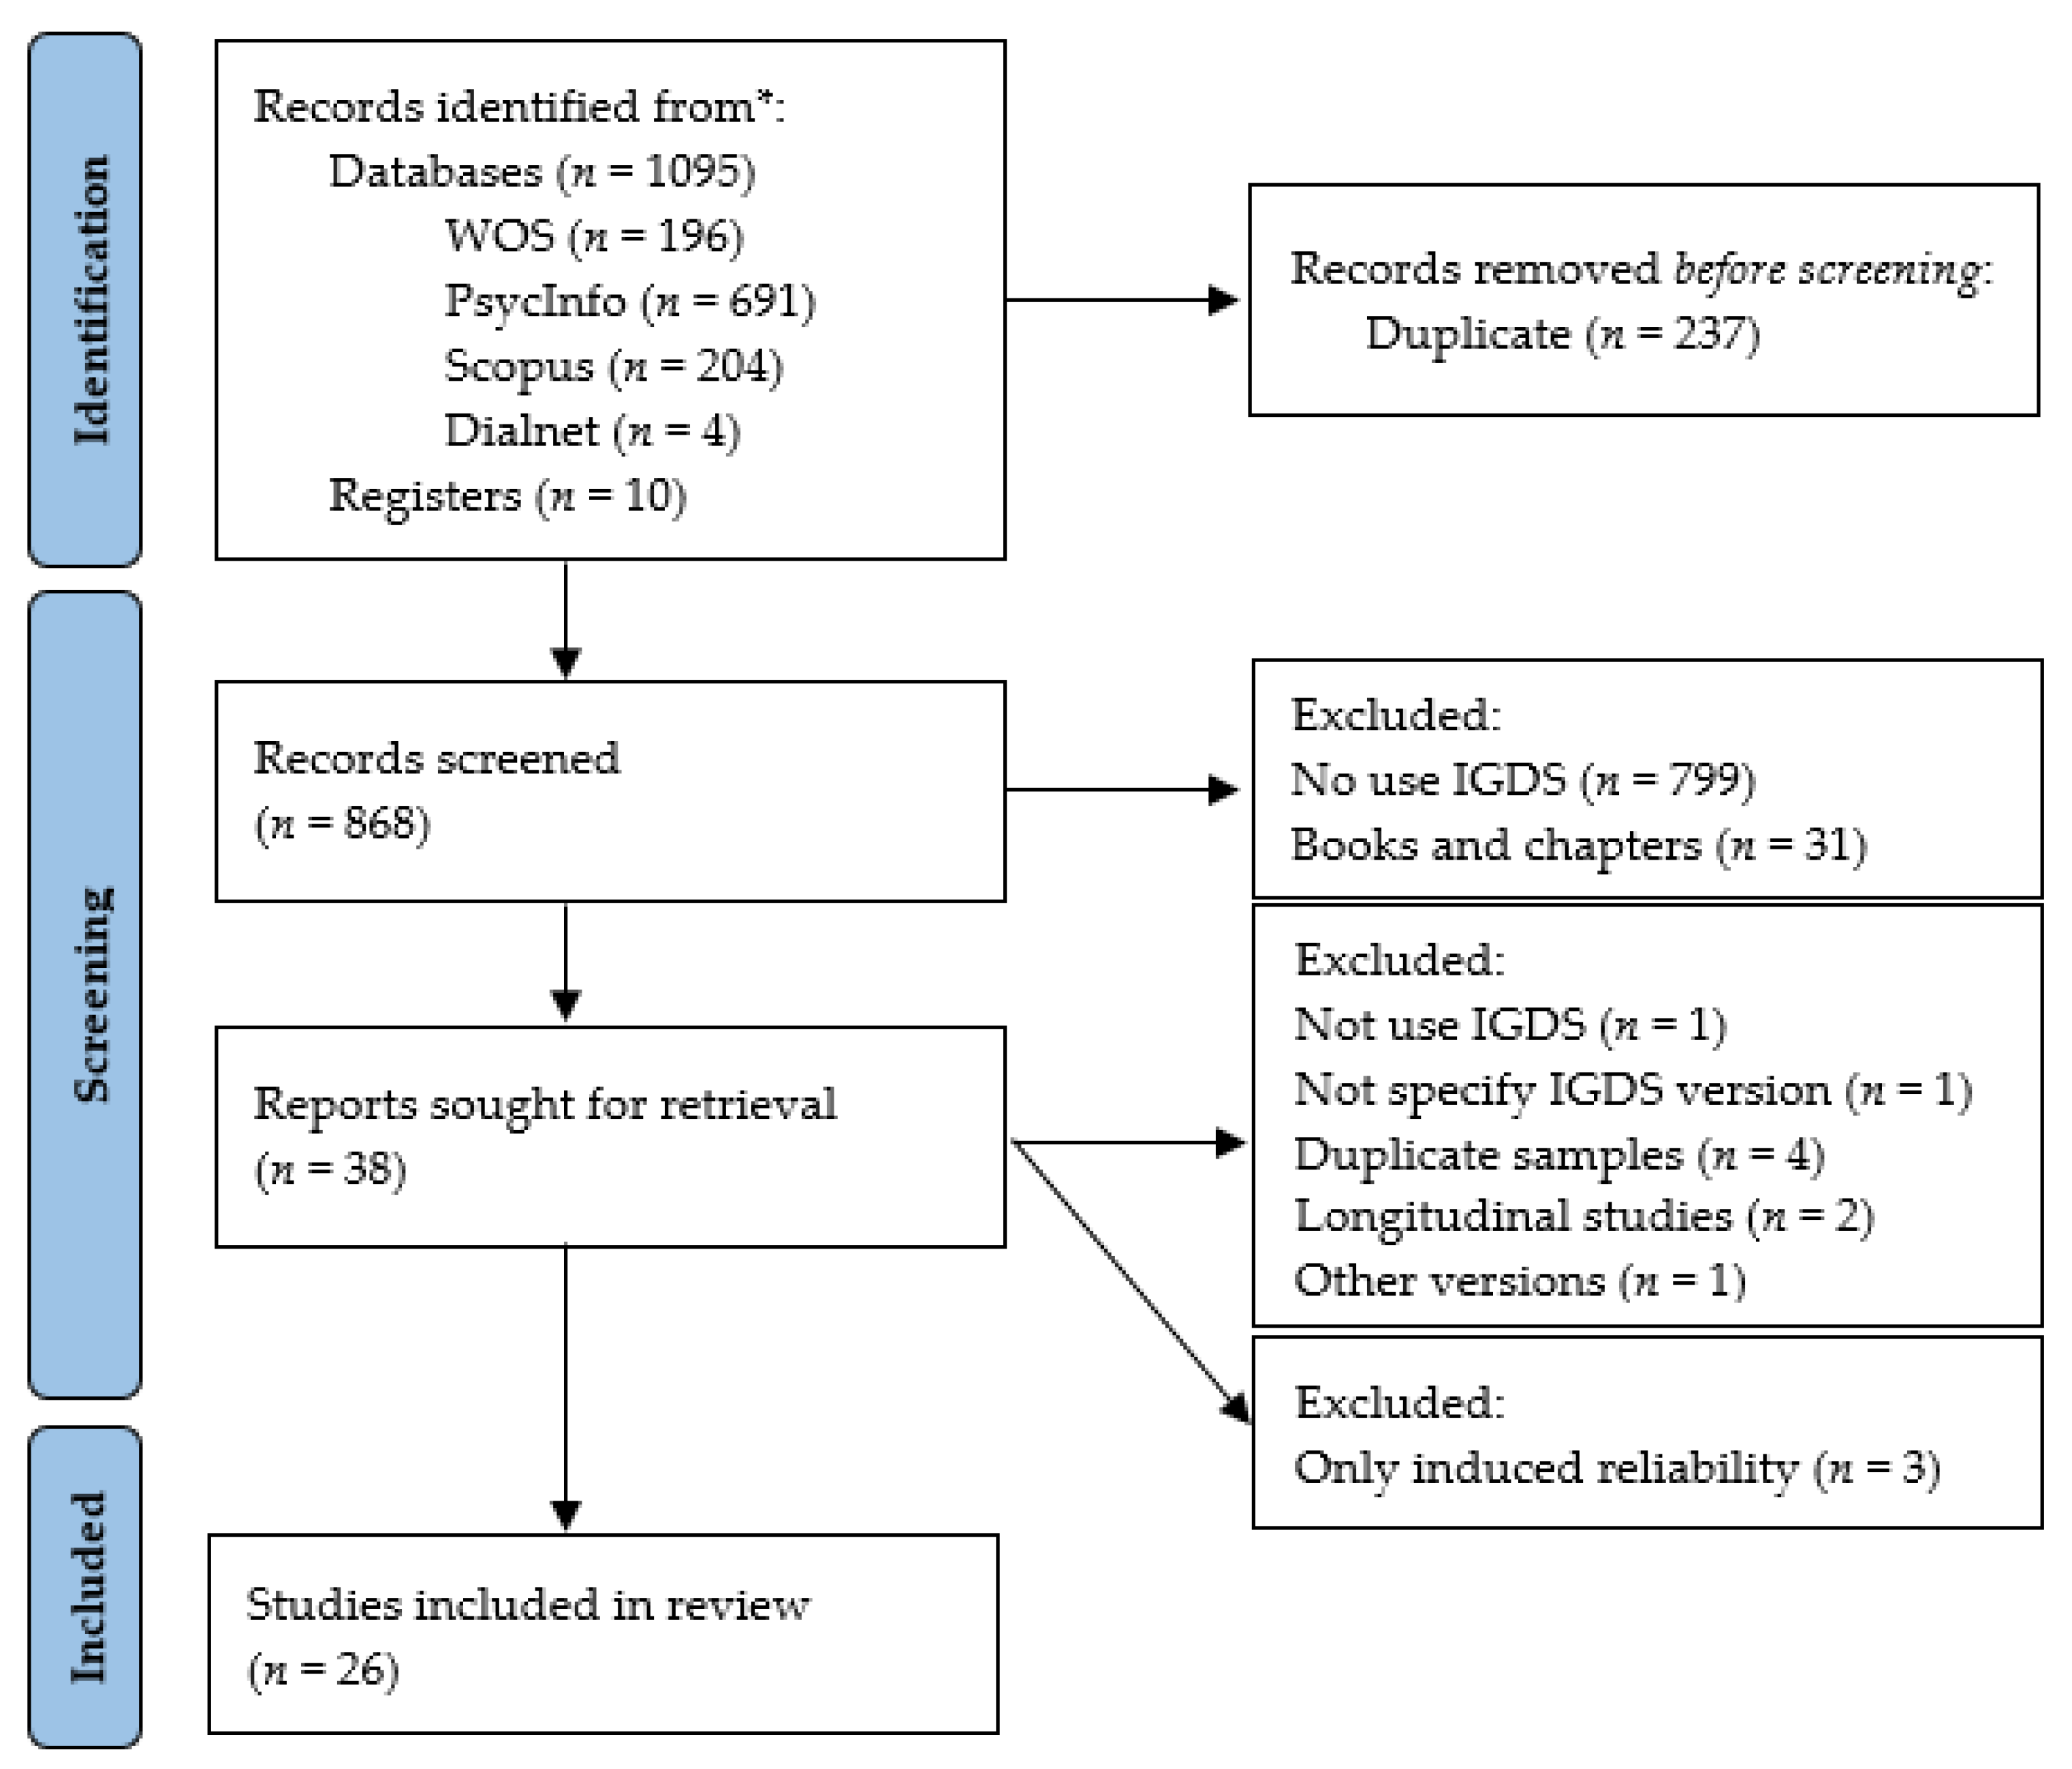
3.1. Results of the Study Selection Process

The identification, screening, and selection process carried out according to PRISMA 2020 [32] is detailed in Figure 1.
First, using the database tools, a total of 1095 articles were identified, including 204 from Scopus, 196 from WoS, 691 from PsycInfo, and 4 from Dialnet. Additionally, 10 articles were identified in a second (n = 3) and third (n = 7) iteration. After removing duplicates (n = 237), the remaining 868 articles were screened for eligibility criteria. In total, 38 articles were selected to read the full text. Nine articles were excluded: for not administering the instrument (n = 1), for not specifying IGDS version (n = 1), for administering a version whose answers are provided by third parties (n = 1), second measures from longitudinal studies (n = 2), and by using repeated samples (n = 4). Of the 29 studies, 3 studies only include induced reliability values (omitted (n = 2) and precise (n = 1)). Only articles that reported reliability (n = 26) were included for the meta-analysis. These studies were divided according to the version of the IGDS administered. As mentioned, the studies that presented several independent samples that reported the reliability values and the N of each one of them were coded as independent samples. The distribution was as follows: IGDS27P (n = 5), IGDS27D (n = 4), IGDS9P (n = 4), and IGDS9D (n = 20) (Appendix C).

3.2. Description and Evaluation of the Level

Results are presented in Table 1. Regarding IGDS9D, 60% (n = 12) of the studies produced an alpha coefficient > 0.70, while the rest were below this level (20%, n = 4) or had an inconclusive result (20%, n = 4), because the confidence interval of the difference includes zero. Meanwhile, less than half of the studies produced coefficients > 0.80. Regarding IGDS9P and IGDS27P, all random-effects coefficients > 0.80. Finally, IGDS27D was predominantly > 0.80.

3.3. Random-Effects Model

3.3.1. Mean Reliability

The size distribution of each study ranged from 204 to 3938 (M = 941.1, Md = 780). Based on 20 studies (ntotal = 20) for IGDS9D, the mean reliability was higher than 0.70. In contrast, the mean point estimates for the remaining versions IGDS9P (ntotal = 4), IGDS27D (ntotal = 4), and IGDS27P (ntotal = 5) were found to be higher than 0.90. In the population variability range (95% CI), the coefficients varied between approximately 0.75 and 0.97, higher than 0.70. The prediction intervals for IGDS9D, IGDS9P, and IGDS27D, placed the mean reliability at low levels, except for the mean reliability of IGDS27P, in which the predictivity of the mean coefficient is above 0.90.

3.3.2. Robust Estimate

Outliers were only detected in the IGDS9D studies, specifically nine studies [9,15,20,23,24,59,64,65,69]. With the remaining 11 studies [18,20,61,62,63,68,71,73,74], the αmean was 0.781 (se = 0.05), 95% CI = 0.758, 0.802 (95% PI: 695, 843). The heterogeneity of this robust estimate was statistically significant (Q = 101.49, df = 11, p < 0.001), and, also, had a high I2 = 89.9% (95% CI = 78.8%, 96.8%), even with high intra-studies (CVW = 0.603) compared with between-study variability (CVb = 0.106, 95% CI = 0.106, 0.108).

3.4. Varying Coefficients Model

3.4.1. Heterogeneity Estimation

The smallest part of the heterogeneity came from random variation (<0.10%), while the strong degree of between-study heterogeneity (I2 > 95%; Rb > 90%) was predominant in the analysis of all IGDS versions. Between-study variability (CVb) was trivial in the IGDS27P studies, and was similar in the rest of the IGDS versions (CVb between 0.189 and 0.206), while the variability from intra-study differences was strong in the IGDS9D, compared to the rest (CVW between 0.383 and 0.473) (Table 2).

3.4.2. Exploratory Analysis

IGDS9D. In the cluster–covariate analysis [77], two exploratory solutions were identified in the IGDS9D (Table 3), one of three groups (three Clusters: group 1 = 6 studies, group 2 = 2 studies, group 3 = 12 studies), and another of two groups (two clusters: group 1 = 12 studies, group 2 = 8 studies). The Χ2 independence test did not reject the null independence hypothesis between these two solutions and the existing groupings in the data (language of the scale, language, mode of application, sample, and gamer condition; see Table 4). These results suggest that the association found (Cramer-V) may be included in the sampling variation. Advancing in a qualitative evidence synthesis (QES) framework [78], regarding the solution of three groups: in cluster 1, 2 articles share samples of young people (under 20 years of age) in which only gamers are included, in cluster 2, all agree on the administration of the IGDS in European languages and online administration, and in cluster 3, no similarities are found. Between clusters, there are no clear differences in the variables studied.
IGDS9P. The minimum interpretable solution was two groups (see Table 3). Qualitative analysis of the similarity between this clustering and the study characteristics suggested that cluster 1 were similar in including general population, with similar mean ages, and gamer-only samples (although the report of the Lei et al. [19] study is missing). The difference in α coefficient between the cluster 1 studies (study 1 and 2; α mean = 0.94), with the cluster 2 (study 9 and 18; α mean= 0.87) can be established as statistically significant, but also as small (∆α = 0.07; 95% CI ∆diff = 0.05, 0.08), because the range of the difference (95% CI ∆diff) was small and close to 0.0.
IGDS27D. The minimum interpretable solution was two unbalanced groups (see Table 3). Qualitative analysis of the similarity between this grouping and the characteristics of the studies suggested that the studies of cluster 1 only include gamers in their samples, compared to the study of cluster 2, which has a mixed sample. However, the difference in α coefficient between the study identified as cluster 2 (study 4, α = 0.81) and the rest of the three studies (αmean = 0.92), can be established as trivial, (∆α = −0.11, 95% CI ∆diff = −0.13, −0.08).
IGDS27P. The minimum interpretable solution was two unbalanced groups (see Table 3). Qualitative analysis suggested that the only difference between both groups was the presence of gamers and non-gamers in the sample of the second study. However, the difference in the α coefficient between the study identified as the only member of its group (study 2, α = 0.97), with the rest of the three studies (αmean = 0.95) can be established as trivial, (∆α = −0.01, 95% CI ∆diff = −0.01, −0.00).

4. Discussion

The objective of this study is to perform a reliability generalization meta-analysis of the IGDS. For this purpose, the internal consistency values of the IGDS in different samples are analyzed, and possible causes of the observed variations are examined [84].
The appropriateness of the alpha coefficients of the retrieved studies depended on instrument length (number of items) and response scaling (i.e., dichotomous and polytomous); both structural characteristics had a clear influence, as all versions of the IGDS using ordinal scaling (IGDS9P and IGDS27P) or the long version with 27 dichotomous items (IGDS27D), almost entirely produced scores with reliabilities >0.80. In contrast, the short version with dichotomous items (IGDS9D) produced levels <0.70.
Two major issues to be elaborated in this discussion can be drawn. Ordinal scales and the larger number of items can be taken into account when choosing the IGDS version. In terms of brevity, the IGDS9P may be the recommended version. In a first look at the influence that each study had on the overall estimation of the degree of heterogeneity of the studies (with VRATIO and TAURATIO) [79], almost all individual studies potentially produced non-negligible changes in the α-mean heterogeneity of each version (Table 1). In the versions with few meta-analyzed studies (IGDS9P, IGDS27D, and IGDS27P), there was an apparent hypersensitivity and consequent Type I error. The studies detected as a source of statistically important impact subsequently showed trivial differences with the rest of the coefficients compared.
Regarding the α coefficient meta-analysis, the point estimates of the mean α produced by the VC and RC model were not substantially different, except for the IGDS9D version (αmean = 0.775; 95% CI = 0.74, 0.80). The rest of versions can achieve a level of accuracy of the scores that is usually considered optimal for group description purposes and basic research [35,85].
In both RC and VC models, IGDS27P was shown to be exceptionally high (lower CI limit > 0.93), while the most widely used version, IGDS9D, remained at an acceptable level (lower CI limit > 0.70), but not optimal compared to the rest of the IGDS versions. One implication of these specific results is that the IGDS27P may be the best option for using highly reliable scores, particularly when the context of IGDS use demands this level of precision, such as the classification of individuals, and the differentiation of individual gamer vs. non-gamer, etc. On the contrary, with both estimated models (i.e., CR and VC), IGDS9D showed acceptable levels of reliability, but they are likely to be unacceptable when high precision in the interpretation of its scores is required, as in clinical practice [25]. Due to the number of meta-analyzed studies (nstudies = 20) in the IGDS9D version, this conclusion is relatively reliable and can be taken as a reference.
The prediction intervals (PI) did not set optimal minimum values in future studies using the IGDS9D, IGDS9P, and IGDS27D. Using the lower limit of the PI as a reference, the lowest estimates obtained (IGDS9D = 0.56, IGDS9P = 0.51, and IGDS27D = 0.48) showed that the scores may contain a high proportion of error variance, even at levels where no instrument would be eligible for research and applied use (<0.60). On the other hand, the upper limit of the PI indicated that the predicted levels can exceed the value 0.85. The best consistently achieved level on this was the IGDS27P, where the error variance was consistently very low. Three implications of these results are that: first, to maintain high and optimal true variance in IGDS scores, the IGDS27P is the best option in the context of high intra-study variability; second, the abbreviated versions of the IGDS (IGDS9D and IGDS9P) do not guarantee that the reliability remains within a range of acceptable use; and third, the dichotomous versions of the IGDS may yield a limited minimum acceptable reliability. Therefore, it is apparent that IGDS27P is the recommended option in a wide range of applications, especially when high precision is required. As a further note here, the confidence intervals generated by RC tended to be wider compared to the Cis generated by VC, a problem intrinsic to the RC model when the number of studies is small [37].
In the robust analysis, the re-estimation of αmean could only be conducted in the IGDS9D, because in the rest of the versions no outliers were detected. The robust αmean obtained was slightly higher (αmean = 781) than the non-robust estimate (αmean = 0.775), as well as the 95% CI was very similar, and therefore both parameters can be considered equivalent. This equivalence may be because the outliers were symmetrically distributed, producing little bias in the estimation [86]. In contrast, the PI was different in the robust analysis (95% PI: 0.695, 843), because the predicted level of the α coefficient indicates an acceptable level of reliability. An implication of this is that the user must consider that the internal consistency of the IGDS9D can be maintained at the level declared in previous paragraphs.
It should be mentioned that the detection of outliers by the method used (i.e., Harrer, et al. [82]) did not have an apparent sensitivity in the studies analyzed for IGDS9P, IGDS27D, and IGDS27P, as no outlier studies were detected. This suggested that the heterogeneity detected could not be explained by the presence of studies with extreme alpha coefficients (i.e., outlier studies). Given the strong heterogeneity found, it is likely that the reason for this lack of sensitivity of the method used [82] was the effect of the small number of these studies in each version (nstudies ≤ 5).
Usual (I2) and new (Rb) indicators of heterogeneity converged in pointing out that the amount of variability was strong (>90%), and that an important source seems to come from the intra-study variability (CVw) compared with the inter-study variability (CVb). The exploration of the heterogeneity between the studies gave an unclear clue as to the sources of the variability of the alpha coefficients. Qualitative inspection suggested that when the size of meta-analyzed studies is small [78] only some studies were an apparent source of differentiation (i.e., the study by Evren et al. [19] on IGDS9P, Zemestani et al. [67] in IGDS27D, and Evren et al. [19] in IGDS27P; Table 3), but this was trivial because the differences produced in their αmean coefficients without these studies were of trivial size.
The exploration of the heterogeneity carried out suggests that there are other possible and realistic explanations for the degree of heterogeneity found. These can be attributed to the characteristics of the individual studies, which may be causally linked to the distance of each alpha coefficient from its αmean. Specifically, methodological or artificial heterogeneity [87] may have played an important and not ignorant role in this heterogeneity. The methodological aspects are specifically focused on the quality of the data, and the calibration of the IGDS in each sample. In the first, possible response biases were not explicitly incorporated into the analytical procedures of the selected studies, which requires a set of a priori decisions about their detection or treatment. These have been termed random responses [88], item content-independent responses [89], insufficient effort response [90], or careless response [91].
There is empirical literature that has shown its effects on a long chain of statistical estimates, such as the spurious variability of responses [38,39], the internal structure of the instrument [39,92], and in general, the prevalence of error Type I and Type II [93]. In the study of behavioral addictions mediated by the web platform, this issue is no less critical compared to other areas of research. There is an explicit call to address it as well [94], more so when a small prevalence of C/IE responses can produce non-ignorable changes in quantitative estimates [95], which are unrealistic for the measurement of the construct of interest [92].
Second, in the selected substantive studies, the internal structure of the IGDS was not explicitly verified, resorting to supporting the validity argument using previous results. This is a problem of inducing the validity of the instrument (specifically, its structure or the interpretation of its scores) from background evidence, but without corroborating it with the available data [27,28,96]. Due to the natural variability of samples and application conditions, it does not seem reasonable to expect that the internal structure of an instrument will remain intact, even more so if the instrument contains several items that capitalize on sampling variability and methodological variability. These changes in the instrument may be expressed in different magnitudes of intra-study or between-study factor loadings on the set of items, the presence of correlated residuals between items, or the emergence of a general method factor. This means that even to obtain a valid measure of the reliability of the scores, this corroboration is required [35,97], and as a general rule, it should be resolved even in non-psychometric studies. As part of good reporting practices, it is proposed to check the internal structure of the IGDS and to report the psychometric adjustment obtained.
Modern reliability estimates aim to calculate other coefficients that tend to better represent the structure of the items of a measure, such as the coefficient ω [98] for congeneric one-dimensional measures [99], that is, with variability in factor loads of the items. This reliability measure was hardly calculated in the selected studies with the IGDS, and it is reasonable to conclude that the reliability estimates obtained with the alpha coefficient are the lower bond of the reliability of the scores obtained by omega [98,99]. A practical implication is that the mean reliabilities of the IGDS versions may be higher than those obtained in the present study. How high? It is not possible to give an approximate or precisely answer, due to the high prevalence of induced validity and the consequent lack of knowledge of factor loads. In practice, it may be advisable to report both coefficients, α and ω.
Finally, in comparison with another meta-analysis analyzing the reliability of various instruments [31], the two polytomous versions of the IGDS (IGDS27P and IGDS9P) show higher reliability scores than those found on other similar instruments. This highlights that these versions may be more suitable for the assessment of the IGD.

4.1. Limitations

Firstly, the present study considered that the minimum reasonable evidence to quantitatively addressed the generalization of reliability was the number of studies included (20 in the IGDS9D; between 4 and 5 in the IGDS9P, IGDS27D, and IGDS27P). Although each contributed a substantial number of participants (nparticipants > 2000), the accumulation of more studies may be required to reach more reliable conclusions about the αmean and sources of heterogeneity. Secondly, the interpretation of the PI can be reliable in the IGDS9D, but with caution in the conclusions of the IGDS9P, IGDS27D, and IGDS27P, due to the small size of the studies included in these three versions. Thirdly, the conclusions about the αmean in each version analyzed must be contextualized by the degree of heterogeneity found, especially in the versions where the number of studies was less than six (i.e., IGDS9P, IGDS27D, and IGDS27P). Adding to this general situation, in our analyzes the number of retrieved studies was small (particularly for the IGDS9P, IGDS27D, and IGDS27P versions), and few studies cannot serve to reliably identify sources of heterogeneity [100]; for this reason, heterogeneity was conducted in an exploratory manner, combining quantitative and qualitative means to maximize the opportunity to recognize these sources. Fourthly, it is possible that, within a general framework of sensitivity, it is necessary to implement new estimators [101], but it is adapted to the study of reliability generalization, or to take advantage of the Bayesian approach [102] in the area of the generalization of the reliability of the IGDS.

4.2. Practical Implications and Future Research

The continuous evolution of video game consumption, the increase in rates of problematic consumption, and the expansion of consumption beyond adolescence highlight the social relevance of the IGD study. Carrying out a reliability generalization meta-analysis of evaluation or diagnostic instruments guides professionals on which scales are more reliable to evaluate a certain construct, as well as in what circumstances [25]. Given that psychological intervention in social settings covers all social sectors (children, adolescents, young adults, etc.), the availability of reliable instruments can be helpful in prevention, diagnosis, evaluation, and psychological intervention, as well as in choosing therapeutic strategies. Therefore, due to the onset and prevalence of IGD in adolescence, the results of this study have implications for clinical practice, confirming the accuracy of the instrument for the early detection and intervention of this disorder. All of this has a direct positive impact on the promotion of well-being in this vital sector and beyond, as well as the promotion of prevention at earlier ages.
On a practical level, after the results are obtained, the IGDS27P is shown to be the most recommendable version for contexts where high reliability is required. However, despite the more frequent use of the IGDS9D, the use of its polytomous version is also recommended when the use of an abbreviated version is required.
For future research, it is proposed to continue with the study of the IGD in different countries with differential video game consumption or to analyze variables that could positively or negatively influence the development of IGD. Moreover, after the sample size is achieved, it would be important to re-perform a meta-analysis to generalize the reliability of the same instrument or even include more instruments measuring this construct, in order to corroborate the results found, as well as to study the psychometric properties of these instruments.

5. Conclusions

The present work carried out a reliability generalization meta-analysis of the IGDS from 2015 to June 2022, considering its four versions, original and abbreviated with dichotomous and polytomous responses. In the meta-analysis, it was observed that a large part of the sample of studies reviewed lacked some data and presented high heterogeneity, which made it difficult to correctly interpret the generalization of its reliability. The results of the study suggested that to achieve high-reliability scores it was advisable to use the IGDS with ordinal response, for both the 9-item and 27-item versions, the latter being the most appropriate when high precision is required. In contrast, the IGDS9D version had the lowest reliability and could compromise the interpretation of its scores, and was, therefore, the least recommended. These conclusions are dependent, however, on the size of the meta-analyzed studies in each version, and considering that the version with nine dichotomous items was the one with the largest meta-analyzed studies, this conclusion may be more generalizable. Regarding the exploration of heterogeneity, high variability was found, and it was not possible to classify the studies based on the characteristics of the registered data (language of the scale, mode of application, age characteristics of the sample, and status of gamers in the sample). For this reason, a qualitative analysis was carried out that highlighted as a possible cause of variability the use of samples of only gamers in the original and abbreviated polytomous and original dichotomous versions, but this apparent source of differentiation was trivial. Regarding other sources of heterogeneity, the studies did not include information to identify methodological variability (e.g., response bias control, outliers, etc.), which could play an important role in the heterogeneity found. Finally, the need to strengthen adequate reliability reporting practices in primary studies to optimize their reporting is highlighted.

Author Contributions

Conceptualization: M.V.-F. and J.G.-P.; methodology, C.M.-S. and J.G.-P.; validation, M.V.-F. and M.M.-V.; formal analysis, C.M.-S.; investigation, C.M.-S. and J.G.-P.; resources, M.M.-V. and M.V.-F.; data curation, J.G.-P. and M.V.-F.; writing—original draft preparation, C.M.-S. and J.G.-P.; writing—review and editing, M.V.-F., C.M.-S., and M.M.-V.; visualization, M.V.-F. and M.M.-V.; supervision, M.M.-V. and C.M.-S.; project administration, M.M.-V. All authors have read and agreed to the published version of the manuscript.

Funding

This research received no external funding.

Institutional Review Board Statement

Not applicable.

Informed Consent Statement

Not applicable.

Data Availability Statement

Analysis script is available on request from the authors.

Acknowledgments

The authors thank the casual helpers in information processing and searches.

Conflicts of Interest

The authors declare no conflict of interest.

Appendix A

The main difference between this study and Yoon et al. study [31] is that Yoon et al. focus only on the nine-item dichotomous response version of the IGDS. In our study, the four original versions [9] are analyzed, including the 9-item and 27-item versions with polytomous and dichotomous response.
The election of this instrument by Yoon et al. [31] is based on the results of the systematic review by King et al. [103], in which only the 9-item dichotomous and 27-item dichotomous and polytomous versions [103] were included (p. 4, Table 1). Therefore, not considering the four versions could mean an error in the search, since our sample (made in 2021 and updated in June 2022, consulting Scopus, WoS, PsycInfo, and Dialnet databases) already contains articles that use the not-included version (when the review was conducted in these and other databases by King et al. [103]).
All four versions of the IGDS report adequate reliability values in all four versions according to our systematic search. Although the nine-item dichotomous version is the most widely used in studies, some of them report inadequate reliability values, being the only version in which this occurs.
It should be noted that in our study, gray literature was included due to the small sample size. This fact can be both a strength, because it allows greater generalization of results by having a larger sample, and a weakness if it implies a reduction in quality. In the study by Yoon et al. [31], the quality criterion used was that the journal of publication had peer review, and therefore, we reviewed our gray literature and concluded that it also met this criterion. All the articles that formed part of the gray literature were published in peer-reviewed journals, thus providing a larger sample and more generalizable results.
Regarding the meta-analytic model used, Yoon et al. [31] used the random effects model while we used two models: the random coefficients model and the varying coefficients model. These two models were employed because the former is the generally accepted and preferred model in research, and the latter was appropriate because of the characteristics of the sample (the unlikely fulfillment of the assumption of normality of the hypothetical population of α coefficients, the actual absence of random selection of the manuscripts, and the small number of the selected studies).
Regarding heterogeneity assessment, in the study by Yoon et al. [31] Tau (τ), Tau-squared (τ2), and I2 were reported, whereas this study reported these measures plus the Q-statistic test and estimators of heterogeneity size Rb and CVb and CVw.
Regarding the sources of heterogeneity analyzed, Yoon et al. [31] focus on sample type, study location, and instruments for measuring video game addiction. In our study, it is considered the language of the instrument, the mode of application, the type of sample, the total number of sample, and the presence of gamers/non-gamers in the sample. We also include a cluster analysis and a qualitative analysis of the significance of these clusters.
All of this highlights a greater rigor in conducting the meta-analysis and in assessing heterogeneity, as well as in exploring all versions of the IGDS. Thus, this study implies greater depth in the meta-analytic study of reliability with more focused generalizability.

Appendix B

Table A1. Checklist for the corroboration of the meta-analytical report according to the REGEMA.
TITLEYesNoNA
1. TitleX
ABSTRACT
2. AbstractX
INTRODUCTION
3. BackgroundX
4. ObjectivesX
METHOD
5. Selection criteriaX
6. Search strategiesX
7. Data extractionX
8. Reported reliabilityX
9. Estimating the reliability induction and other sources of biasX
10. Data extraction of inducing studiesX
11. Reliability of data extractionX
12. Transformation methodX
13. Statistical modelX
14. Weighting methodX
15. Heterogeneity assessmentX
16. Moderator analysesX
17. Additional analysesX
18. SoftwareX
RESULTS
19. Results of the study selection processX
20. Mean reliability and heterogeneityX
21. Moderator analysesX
22. Sensitivity analysesX
23. Comparison of inducing and reporting studies X
24. Data setX
DISCUSSION
25. Summary of resultsX
26. LimitationsX
27. Implications for practiceX
28. Implications for future researchX
FUNDING
29. FundingX
PROTOCOL
30. ProtocolX
NA: not applicable. Source: Adapted and based on the REGEMA checklist of Sanchez-Meca et al. [104].

Appendix C

Table A2. Characteristics of the selected studies.
No.StudyVersionReported ReliabilityStudy ValidityMethodReliabilityRetest
AvailableNot Avail.
1Lemmens et al. (2015) [9]IGDS9DX Empiricalα0.83
2Sioni et al. (2017) [59]IGDS9DX Inducedα0.85
3Wartberg et al. (2017) [61]IGDS9DX Inducedα0.82
4Baiumy et al. (2018) [20]IGDS9DX Inducedα0.61
5Buiza-Aguado et al. (2018) [62]IGDS9DX Inducedω0.81
6Koning et al. (2018) [71]IGDS9DX Inducedα0.74
7Van Den Eijnden et al. (2018) [73]IGDS9DX Inducedα0.73
8Brooks and Clark (2019) [63]IGDS9DX Inducedα0.82
9Dedeaux (2019) [69]IGDS9DX Inducedα0.84
10Stockdale et al. (2019) [60]IGDS9DX Inducedα0.81
11Grajewski et al. (2020) [64]IGDS9DX Inducedα0.69
12Lei et al. (2020) [18]IGDS9DX Empiricalα0.810.83
13Wartberg et al. (2020) [24]IGDS9DX Inducedα0.66
14Zendle (2020) [74]IGDS9DX Inducedα0.79
15Booth et al. (2021) [68]IGDS9DX Inducedα0.74
16Liu et al. (2021) [65]IGDS9DX Inducedα0.83
17Oka et al. (2021) [15]IGDS9DX Inducedα0.84
18Paschke et al. (2021) [21]IGDS9DX Empiricalα0.78
19Paschke et al. (2021) [21]IGDS9DX Empiricalα0.72
20Paschke et al. (2021) [21]IGDS9DX Empiricalα0.56
1Lemmens et al. (2015) [9]IGDS9PX Empiricalα0.95
2Evren et al. (2017) [19]IGDS9PX Empiricalα0.930.756
3Mills et al. (2018)IGDS9PX Inducedα0.85
4Lei et al. (2020) [18]IGDS9PX Empiricalα0.890.84
1Lemmens et al. (2015) [9]IGDS27DX Empiricalα0.93
2Reyes et al. (2019) [72]IGDS27D X Inducedα0.9
3Ait Daoud (2020) [57]IGDS27D X Inducedα0.93
4Zemestani et al. (2021) [67]IGDS27D X Inducedα0.81
1Lemmens et al. (2015) [9]IGDS27PX Empiricalα0.94
2Evren et al. (2017) [19]IGDS27P X Empiricalα0.970.759
3Allen and Anderson (2018) [22]IGDS27P X Inducedα0.96
4Gibbons and Bouldin (2019) [70]IGDS27P X Inducedα0.96
5Mills and Allen (2020) [66]IGDS27P X Inducedα0.96
Table A3. Characteristics of the selected studies (frequency table).
No.StudyVLangEnglish LanguageApplication ModeN SampleSampleGamer Condition
1Lemmens et al. (2015) [9]IGDS9DDutchNSelf-report989Gen. CommGamers
2Sioni et al. (2017) [59]IGDS9DEnglishYSelf-report394Gen. CommGamers
3Wartberg et al. (2017) [61]IGDS9DGermanNInterview1020AdolescentsMixed
4Baiumy et al. (2018) [20]IGDS9DArabicNSelf-report204YoungGamers
5Buiza-Aguado et al. (2018) [62]IGDS9DSpanishNSelf-report708AdolescentsMixed
6Koning et al. (2018) [71]IGDS9DDutchNSelf-report354AdolescentsNR
7Van Den Eijnden et al. (2018) [73]IGDS9DDutchNSelf-report538AdolescentsNR
8Brooks and Clark (2019) [63]IGDS9DEnglishYSelf-report257Gen. CommMixed
9Dedeaux (2019) [69]IGDS9DEnglishYSelf-report310Gen. CommNR
10Stockdale et al. (2019) [60]IGDS9DEnglishNEncuesta855AdultsMixed
11Grajewski et al. (2020) [64]IGDS9DPolishNSelf-report1306Gen. CommGamers
12Lei et al. (2020) [18]IGDS9DChineseNSelf-report351Gen. CommNR
13Wartberg et al. (2020) [24]IGDS9DGermanNInterview1001AdolescentsMixed
14Zendle (2020) [74]IGDS9DEnglishYSelf-report1081Gen. CommMixed
15Booth et al. (2021) [68]IGDS9DEnglishYSelf-report2078AdultsMixed
16Liu et al. (2021) [65]IGDS9DChineseNNR1121AdolescentsMixed
17Oka et al. (2021) [15]IGDS9DJapaneseNSelf-report3938Gen. CommMixed
18Paschke et al. (2021) [21]IGDS9DGermanNInterview762AdolescentsGamers
19Paschke et al. (2021) [21]IGDS9DGermanNInterview777AdolescentsGamers
20Paschke et al. (2021) [21]IGDS9DGermanNInterview784AdolescentsGamers
1Lemmens et al. (2015) [9]IGDS9PDutchNSelf-report923Gen. CommGamers
2Evren et al. (2017) [19]IGDS9PTurkishNSelf-report457YoungMixed
3Mills et al. (2018)IGDS9PEnglishYSelf-report1029Gen. CommGamers
4Lei et al. (2020) [18]IGDS9PChineseNSelf-report378Gen. CommNR
1Lemmens et al. (2015) [9]IGDS27DDutchNSelf-report989Gen. CommGamers
2Reyes et al. (2019) [72]IGDS27DNRNRSelf-report1026Gen. CommGamers
3Ait Daoud (2020) [57]IGDS27DEnglishYSelf-report423Gen. CommGamers
4Zemestani et al. (2021) [67]IGDS27DPersianNSelf-report481Gen. CommMixed
1Lemmens et al. (2015) [9]IGDS27PDutchNSelf-report923Gen. CommGamers
2Evren et al. (2017) [19]IGDS27PTurkishNSelf-report457YoungMixed
3Allen and Anderson (2018) [22]IGDS27PEnglishYSelf-report315YoungGamers
4Gibbons and Bouldin (2019) [70]IGDS27PEnglishYSelf-report272YoungNR
5Mills and Allen (2020) [66]IGDS27PEnglishYSelf-report487Gen. CommGamers
N: no; Y: yes; NR: not reported; V: version; Lang: language; Gen. Comm.: general community.

References

  1. Asociación Estadounidense de Psiquiatría [APA]. Manual Diagnóstico y Estadístico de Trastornos Mentales, 5th ed.; Asociación Estadounidense de Psiquiatría: Arlington, VA, USA, 2013. [Google Scholar]
  2. Montag, C.; Schivinski, B.; Sariyska, R.; Kannen, C.; Demetrovics, Z.; Pontes, H.M. Síntomas psicopatológicos y motivos del juego en los juegos desordenados: Una comparación psicométrica entre los marcos de diagnóstico de la OMS y la APA. J. Clin. Med. 2019, 8, 1691. [Google Scholar] [CrossRef] [PubMed] [Green Version]
  3. Carbonell, X. The diagnosis of video game addiction in the Dsm-5 and the Icd-11: Challenges and opportunities for clinicians. Psychol. Pap. 2020, 41, 211–218. [Google Scholar] [CrossRef]
  4. Beranuy, M.; Machimbarrena, J.; Vega-Osés, M.A.; Carbonell, X.; Griffiths, M.D.; Pontes, H.M.; González-Cabrera, J. Spanish validation of the internet gaming disorder scale—Short form (IGDS9-SF): Prevalence and relationship with online gambling and quality of life. Int. J. Environ. Res. Public Health 2020, 17, 1562. [Google Scholar] [CrossRef] [Green Version]
  5. Organización Mundial de la Salud. 11ª Revisión de la Clasificación Internacional de Enfermedades (CIE-11). Organización Mundial de la Salud (OMS). 2018. Available online: https://icd.who.int (accessed on 11 July 2021).
  6. Stevens, M.W.; Dorstyn, D.; Delfabbro, P.H.; King, D.L. Global prevalence of gaming disorder: A systematic review and meta-analysis. Aust. N. Z. J. Psychiatry 2021, 55, 553–568. [Google Scholar] [CrossRef]
  7. García-García, E.; Martínez-Gimeno, M.-L.; Benítez-Andrades, J.A.; Miranda-Gómez, J.; Zapata-Cornejo, E.d.D.; Escobar-Aguilar, G. Substance use and addictive behavior in spanish adolescents in secondary school. Healthcare 2021, 9, 186. [Google Scholar] [CrossRef]
  8. Wang, R.; Yang, S.; Yan, Y.; Tian, Y.; Wang, P. Internet gaming disorder in early adolescents: Gender and depression differences in a latent growth model. Healthcare 2021, 9, 1188. [Google Scholar] [CrossRef]
  9. Lemmens, J.S.; Valkenburg, P.M.; Gentile, D.A. The internet gaming disorder scale. Assessment 2015, 27, 567–582. [Google Scholar]
  10. Paulus, F.; Ohmann, S.; Von Gontard, A.; Popow, C. Internet gaming disorder in children and adolescents: A systematic review. Dev. Med. Child Neurol. 2018, 60, 645–659. [Google Scholar] [CrossRef]
  11. Wang, H.; Cheng, C. New perspectives on the prevalence and associated factors of gaming disorder in Hong Kong community adults: A generational approach. Comput. Hum. Behav. 2021, 114, 106574. [Google Scholar] [CrossRef]
  12. Fam, J.Y. Prevalence of internet gaming disorder in adolescents: A meta-analysis across three decades. Scand. J. Psychol. 2018, 59, 524–531. [Google Scholar] [CrossRef]
  13. Warman, P. 2018 Global Games Market Report. Recovered from 2018. Available online: https://cdn2.hubspot.net/hubfs/700740/Reports/Newzoo_2018_Global_Games_Market_Report_Light.pdf (accessed on 10 February 2022).
  14. Cabeza-Ramírez, L.J.; Muñoz-Fernández, G.A.; Santos-Roldán, L. Video game streaming in young people and teenagers: Uptake, user groups, dangers, and opportunities. Healthcare 2021, 9, 192. [Google Scholar] [CrossRef] [PubMed]
  15. Oka, T.; Hamamura, T.; Miyake, Y.; Kobayashi, N.; Honjo, M.; Kawato, M.; Kubo, T.; Chiba, T. Prevalence and risk factors of internet gaming disorder and problematic internet use before and during the COVID-19 pandemic: A large online survey of Japanese adults. J. Psychiatr. Res. 2021, 142, 218–225. [Google Scholar] [CrossRef] [PubMed]
  16. Pontes, H.M.; Macur, M.; Griffiths, M.D. Internet gaming disorder among slovenian primary schoolchildren: Findings from a nationally representative sample of adolescents. J. Behav. Addict. 2016, 5, 304–310. [Google Scholar] [CrossRef] [Green Version]
  17. Chamarro, A.; Carbonell, X.; Manresa, J.; Munoz-Miralles, R.; Ortega-González, R.; Lopez-Morron, M.; Batalla-Martinez, C.; Toran-Montserrat, P. El cuestionario de experiencias relacionadas con los videojuegos (CERV): Un instrumento para detectar el uso problemático de videojuegos en adolescentes españoles. Adicciones 2014, 26, 303–311. [Google Scholar] [CrossRef] [Green Version]
  18. Lei, W.; Liu, K.; Zeng, Z.; Liang, X.; Huang, C.; Gong, K.; He, W.; Xiang, B.; Zhang, J.; Zheng, X.; et al. The psychometric properties of the Chinese version Internet gaming disorder scale. Addict. Behav. 2020, 113, 106670. [Google Scholar] [CrossRef]
  19. Evren, C.; Dalbudak, E.; Topçu, M.; Kutlu, N.; Evren, B. The psychometric properties of the Turkish version of the Internet Gaming Disorder Scale. Dusunen. Adam. J. Psychiatry Neurol. Sci. 2017, 4, 316–324. [Google Scholar] [CrossRef] [Green Version]
  20. Baiumy, S.; Elella, E.A.; Hewedi, D.; Elkholy, H. Internet gaming disorder scale. Middle East Curr. Psychiatry 2018, 25, 13–15. [Google Scholar] [CrossRef]
  21. Paschke, K.; Peter-Michael, S.; Thomasius, R. Validity and psychometric properties of the internet gaming disorder scale in three large independent samples of children and adolescents. Int. J. Environ. Health Res. 2021, 18, 1095. [Google Scholar] [CrossRef]
  22. Allen, J.J.; Anderson, C.A. Satisfaction and frustration of basic psychological needs in the real world and in video games predict internet gaming disorder scores and well-being. Comput. Hum. Behav. 2018, 84, 220–229. [Google Scholar] [CrossRef]
  23. Bernaldo-de-Quirós, M.; Labrador-Méndez, M.; Sánchez-Iglesias, I.; Labrador, F.J. Instrumentos de medida del trastorno de juego en internet en adolescentes y jóvenes según criterios DSM-5: Una revisión sistemática. Addiciones 2020, 32, 291–302. [Google Scholar] [CrossRef]
  24. Wartberg, L.; Kriston, L.; Thomasius, R. Internet gaming disorder and problematic social media use in a representative sample of German adolescents: Prevalence estimates, comorbid depressive symptoms and related psychosocial aspects. Comput. Hum. Behav. 2020, 103, 31–36. [Google Scholar] [CrossRef]
  25. Badenes-Ribera, L.; Rubio-Aparicio, M.; Sánchez-Meca, J. Meta-análisis de generalización de la fiabilidad. Inf. Psicológica 2020, 119, 17–32. [Google Scholar] [CrossRef]
  26. Santos, G. Validez y Confiabilidad del Cuestionario de Calidad de Vida SF-36 en Mujeres con LUPUS, Puebla. Bachelor’s Thesis, Universidad Autónoma de Puebla, Puebla, Mexico, 2017. [Google Scholar]
  27. Merino-Soto, C.; Angulo-Ramos, M. Validity induction: Comments on the study of compliance questionnaire for rheumatology. Rev. Colomb. De Reumatol. 2020, 28, 312–313. [Google Scholar] [CrossRef]
  28. Merino-Soto, C.; Angulo-Ramos, M. Metric studies of the compliance questionnaire on rheumatology (CQR): A case of validity induction? Reumatol. Clínica 2021. [Google Scholar] [CrossRef]
  29. Reidl-Martínez, L. Confiabilidad en la medición. Investigación en educación médica. Elsevier 2013, 2, 107–111. [Google Scholar]
  30. Sánchez-Meca, J.; López-Pina, J.A.; López López, J.A. Generalización de la fiabilidad: Un enfoque metaanalítico aplicado a la fiabilidad. Fisioterapia 2009, 31, 262–270. [Google Scholar] [CrossRef]
  31. Yoon, S.; Yang, Y.; Ro, E.; Ahn, W.Y.; Kim, J.; Shin, S.H.; Chey, J.; Choi, K.H. Reliability, and convergent and discriminant validity of gaming disorder scales: A meta-analysis. Front. Psychol. 2021, 7, 764209. [Google Scholar] [CrossRef]
  32. Page, M.J.; McKenzie, J.E.; Bossuyt, P.M.; Boutron, I.; Hoffmann, T.C.; Mulrow, C.D.; Shamseer, L.; Tetzlaff, J.M.; Akl, E.A.; Brennan, S.E.; et al. The PRISMA 2020 statement: An updated guideline for reporting systematic reviews. BMJ 2021, 372, n71. [Google Scholar] [CrossRef]
  33. Rubio-Aparicio, M.; Badenes-Ribera, L.; Sánchez-Meca, J.; Fabris, M.A.; Longobardi, C. A reliability generalization meta-analysis of self-report measures of muscle dysmorphia. Clin. Psychol. Sci. Pract. 2020, 27, e12303. [Google Scholar] [CrossRef]
  34. Bonett, D.G.; Wright, T.A. Cronbach’s alpha reliability: Interval estimation, hypothesis testing, and sample size planning. J. Organ. Behav. 2015, 36, 3–15. [Google Scholar] [CrossRef]
  35. Savalei, V. A comparison of several approaches for controlling measurement error in small samples. Psychol. Methods 2019, 24, 352–370. [Google Scholar] [CrossRef] [PubMed]
  36. Hedges, L.V. A random effects model for effect sizes. Psychol. Bull. 1983, 93, 388–395. [Google Scholar] [CrossRef]
  37. Bonett, D.G. Varying coefficient meta-analytic methods for alpha reliability. Psychol. Methods 2010, 15, 368–385. [Google Scholar] [CrossRef] [PubMed] [Green Version]
  38. Huang, J.L.; Bowling, N.A.; Liu, M.; Li, Y. Detecting insufficient effort responding with an infrequency scale: Evaluating validity and participant reactions. J. Bus. Psychol. 2014, 30, 299–311. [Google Scholar] [CrossRef]
  39. Huang, J.L.; Liu, M.; Bowling, N.A. Insufficient effort responding: Examining an insidious confound in survey data. J. Appl. Psychol. 2015, 100, 828–845. [Google Scholar] [CrossRef] [PubMed] [Green Version]
  40. Schmidt, F.L.; Oh, I.-S.; Hayes, T.L. Fixed- versus random-effects models in meta-analysis: Model properties and an empirical comparison of differences in results. Br. J. Math. Stat. Psychol. 2009, 62, 97–128. [Google Scholar] [CrossRef] [Green Version]
  41. Veroniki, A.A.; Jackson, D.; Bender, R.; Kuss, O.; Langan, D.; Higgins, J.P.; Knapp, G.; Salanti, G. Methods to calculate uncertainty in the estimated overall effect size from a random-effects meta-analysis. Res. Synth. Methods 2019, 10, 23–43. [Google Scholar] [CrossRef] [PubMed] [Green Version]
  42. Raudenbush, S.W. Analyzing effect sizes: Random-effects models. In The Handbook of Research Synthesis and Meta-Analysis, 2nd ed.; Cooper, H., Hedges, L.V., Valentine, J.C., Eds.; Russell Sage Foundation: New York, NY, USA, 2009; pp. 295–316. [Google Scholar]
  43. Knapp, G.; Hartung, J. Improved tests for a random effects meta-regression with a single covariate. Stat. Med. 2003, 22, 2693–2710. [Google Scholar] [CrossRef] [PubMed]
  44. Cochran, W.G. The combination of estimates from different experiments. Biometrics 1954, 10, 101–129. [Google Scholar] [CrossRef]
  45. IntHout, J.; Ioannidis, J.P.; Borm, G.F. The Hartung-Knapp-Sidik-Jonkman method for random effects meta-analysis is straightforward and considerably outperforms the standard DerSimonian-Laird method. BMC Med. Res. Methodol. 2014, 14, 25. [Google Scholar] [CrossRef] [Green Version]
  46. Fletcher, J. What is heterogeneity and is it important? BMJ 2007, 334, 94–96. [Google Scholar] [CrossRef]
  47. Higgins, J.P.T.; Thomas, J.; Chandler, J.; Cumpston, M.; Li, T.; Page, M.J.; Welch, V.A. Cochrane Handbook for Systematic Reviews of Interventions Version 6.3 (Updated February 2022); Cochrane 2022. Available online: www.training.cochrane.org/handbook. (accessed on 11 March 2022).
  48. Crippa, A.; Khudyakov, P.; Wang, M.; Orsini, N.; Spiegelman, D. A new measure of between-studies heterogeneity in meta-analysis. Stat. Med. 2016, 35, 3661–3675. [Google Scholar] [CrossRef]
  49. von Hippel, P.T. The heterogeneity statistic I2 can be biased in small meta-analyses. BMC Med. Res. Methodol. 2015, 15, 35. [Google Scholar] [CrossRef] [Green Version]
  50. Deeks, J.; Higgins, J.; Altman, D. Analyzing data and undertakingmeta-analyses. In Cochrane Handbook for Systematic Reviews of Interventions Version 5.0.0; Higgins, J., Green, S., Eds.; Wiley: Chichester, UK, 2008. [Google Scholar]
  51. Higgins, J.P.T.; Thompson, S.G.; Deeks, J.J.; Altman, D.G. Measuring inconsistency in meta-analyses. BMJ 2003, 327, 557–560. [Google Scholar] [CrossRef] [Green Version]
  52. Sánchez-Meca, J.; López-López, J.A.; López-Pina, J.A. Some recommended statistical analytic practices when reliability generalization studies are conducted. Br. J. Math. Stat. Psychol. 2013, 66, 402–425. [Google Scholar] [CrossRef] [PubMed]
  53. Romano, J.L.; Kromrey, J.D.; Hibbard, S.T. A Monte Carlo study of eight confidence interval methods for coefficient alpha. Educ. Psychol. Meas. 2010, 70, 376–393. [Google Scholar] [CrossRef]
  54. Bonett, D.G. Sample size requirements for testing and estimating coefficient alpha. J. Educ. Behav. Stat. 2002, 27, 335–340. [Google Scholar] [CrossRef]
  55. Whitehead, A.; Whitehead, J. A general parametric approach to the meta-analysis of randomized clinical trials. Stat. Med. 1991, 10, 1665–1677. [Google Scholar] [CrossRef] [PubMed]
  56. Shuster, J.J. Empirical vs. natural weighting in random effects meta-analysis. Stat. Med. 2010, 29, 1259–1265. [Google Scholar]
  57. Ait Daoud, I. The Effect of Stress Susceptibility on the Relationship Between Attachment and Internet Gaming. Master’s Thesis, University of Minessota, Minessota, MN, USA, 2020. [Google Scholar]
  58. Mills, D.J.; Milyavskaya, M.; Heath, N.L.; Derevensky, J.L. Gaming motivation and problematic video gaming: The role of needs frustration. Eur. J. Soc. Psychol. 2018, 48, 551–559. [Google Scholar] [CrossRef] [Green Version]
  59. Sioni, S.R.; Burleson, M.H.; Bekerian, D.A. Internet gaming disorder: Social phobia and identifying with your virtual self. Comput. Hum. Behav. 2017, 71, 11–15. [Google Scholar] [CrossRef]
  60. Stockdale, L.; Coyne, S.M. Parenting paused: Pathological video game use and parenting out-comes. Addict. Behav. Rep. 2019, 11, 100244. [Google Scholar]
  61. Wartberg, L.; Kriston, L.; Kammerl, R. Associations of social support, friends only known through the internet, and health-related quality of life with internet gaming disorder in adolescence. Cyberpsychol. Behav. Soc. Netw. 2017, 20, 436–441. [Google Scholar] [CrossRef] [PubMed]
  62. Buiza-Aguado, C.; Alonso-Canovas, A.; Conde-Mateos, C.; Buiza-Navarrete, J.J.; Gentile, D. Problematic video gaming in a young spanish population: Association with psychosocial health. Cyberpsychol. Behav. Soc. Netw. 2018, 21, 388–394. [Google Scholar] [CrossRef] [PubMed] [Green Version]
  63. Brooks, G.A.; Clark, L. Associations between loot box use, problematic gaming and gambling, and gambling-related cognitions. Addict. Behav. 2019, 96, 26–34. [Google Scholar] [CrossRef] [PubMed]
  64. Grajewski, P.; Dragan, M. Adverse childhood experiences, dissociation, and anxious attachment style as risk factors of gaming disorder. Addict. Behav. Rep. 2020, 11, 100269. [Google Scholar] [CrossRef] [PubMed]
  65. Liu, Y.; Gong, R.; Yu, Y.; Xu, C.; Yu, X.; Chang, R.; Wang, H.; Wang, S.; Wang, Q.; Cai, Y. Longitudinal predictors for incidence of internet gaming disorder among adolescents: The roles of time spent on gaming and depressive symptoms. J. Adolesc. 2021, 92, 1–9. [Google Scholar] [CrossRef] [PubMed]
  66. Mills, D.J.; Allen, J.J. Self-determination theory, internet gaming disorder, and the mediating role of self-control. Comput. Hum. Behav. 2020, 105, 106209. [Google Scholar] [CrossRef]
  67. Zemestani, M.; Niakan, F.; Shafeizadeh, K.; Griffiths, M.D. The relationship between psychobio-logical dimensions of personality and internet gaming disorder: The role of positive and negative affects. Curr. Psychol. 2021, 1–10. [Google Scholar] [CrossRef]
  68. Booth, M.A. Domestic Bliss, or Technological Diss? Problematic Media Use, Attachment, and Relationship Outcomes. Master’s Thesis, Brigham Young University, Provo, UT, USA, 2020. [Google Scholar]
  69. Dedeaux, J.A. Internet Overuse and Its Impact on Deviant Behavior and Attitudes. Ph.D. Thesis, Wichita State University, Wichita, KS, USA, 2019. [Google Scholar]
  70. Gibbons, J.A.; Bouldin, B. Videogame play and events are related to unhealthy emotion regulation in the form of low fading affect bias in autobiographical memory. Conscious. Cogn. 2019, 74, 102778. [Google Scholar] [CrossRef] [PubMed]
  71. Koning, I.M.; Peeters, M.; Finkenauer, C.; Van Den Eijnden, R.J.J.M. Bidirectional effects of Internet-specific parenting practices and compulsive social media and Internet game use. J. Behav. Addict. 2018, 7, 624–632. [Google Scholar] [CrossRef] [PubMed]
  72. Reyes, M.E.S.; Davis, R.D.; Lim, R.A.N.N.; Lim, K.R.S.; Paulino, R.F.; Carandang, A.M.D.; Azarraga, M.G.S. Five-factor model traits as predictors of pathological gaming among selected Filipino gamers. Psychol. Stud. 2019, 64, 213–220. [Google Scholar] [CrossRef]
  73. Van den Eijnden, R.; Koning, I.; Doornwaard, S.; van Gurp, F.; ter Bogt, T. The impact of heavy and disordered use of games and social media on adolescents’ psychological, social, and school functioning. J. Behav. Addict. 2018, 7, 697–706. [Google Scholar] [CrossRef]
  74. Zendle, D. Beyond loot boxes: A variety of gambling-like practices in video games are linked to both problem gambling and disordered gaming. PeerJ 2020, 8, e9466. [Google Scholar] [CrossRef] [PubMed]
  75. Bonett, D.G. Meta-analytic interval estimation for bivariate correlations. Psychol. Methods 2008, 13, 173–181. [Google Scholar] [CrossRef] [Green Version]
  76. Krizan, Z. Synthesizer 1.0: A varying-coefficient meta-analytic tool. Behav. Res. Methods 2010, 42, 863–870. [Google Scholar] [CrossRef]
  77. Mikolajewicz, N.; Komarova, S.V. Meta-analytic methodology for basic research: A practical guide. Front. Physiol. 2019, 10, 203. [Google Scholar] [CrossRef] [Green Version]
  78. Schulz, A.; Schürmann, C.; Skipka, G.; Bender, R. Performing meta-analyses with very few studies. In Meta-Research: Methods and Protocols, Methods in Molecular Biology; Evangelou, E., Veroniki, A.A., Eds.; Springer Science + Business Media: New York, NY, USA, 2021; Volume 2345, pp. 91–102. [Google Scholar]
  79. Noma, H. boutliers: Outlier Detection and Influence Diagnostics for Meta-Analysis. R Package Versión, 1.1-1. 2020. Available online: https://CRAN.R-project.org/package=boutliers (accessed on 9 March 2022).
  80. Viechtbauer, W. Conducting meta-analyses in r with the metafor package. J. Stat. Softw. 2010, 36, 1–48. [Google Scholar] [CrossRef] [Green Version]
  81. Bonett, D.G. vcmeta: Varying Coefficient Meta-Analysis. R package versión, 1.0.0. 2021. Available online: https://CRAN.R-project.org/package=vcmeta (accessed on 9 March 2022).
  82. Harrer, M.; Cuijpers, P.; Furukawa, T.; Ebert, D.D. dmetar: Companion R Package for The Guide ‘Doing Meta-Analysis in R’. R package version 0.0.9000. 2019. Available online: http://dmetar.protectlab.org/ (accessed on 9 March 2022).
  83. R Core Team. R: A language and environment for statistical computing. R Foundation for Statistical Computing, Vienna, Austria. 2021. Available online: https://www.R-project.org/ (accessed on 9 March 2022).
  84. Sánchez-Meca, J.; López-Pina, J.A. The meta-analytic approach of reliability generalization. Rev. Española De Salud Pública 2008, 5, 37–64. [Google Scholar]
  85. Nunnally, J.C. Psychometric Theory, 2nd ed.; McGraw-Hill: New York, NY, USA, 1987. [Google Scholar]
  86. Zimmerman, D.W.; Zumbo, B.D.; Lalonde, C. Coefficient alpha as an estimate of test reliability under violation of two assumptions. Educ. Psychol. Meas. 1993, 53, 33–49. [Google Scholar] [CrossRef]
  87. Langan, D. Assessing heterogeneity in random-effects meta-analysis. In Meta-Research: Methods and Protocols, Methods in Molecular Biology; Evangelou, E., Veroniki, A.A., Eds.; Springer Science + Business Media: New York, NY, USA, 2021; Volume 2345, pp. 67–89. [Google Scholar]
  88. Pinsoneault, T.B. Detecting random, partially random, and nonrandom Minnesota Multiphasic Personality Inventory-2 protocols. Psychol. Assess. 2007, 19, 159–164. [Google Scholar] [CrossRef] [PubMed]
  89. Evans, R.G.; Dinning, W.D. Response consistency among high F scale scorers on the MMPI. J. Clin. Psychol. 1983, 39, 246–248. [Google Scholar] [CrossRef]
  90. Huang, J.L.; Curran, P.G.; Keeney, J.; Poposki, E.M.; DeShon, R.P. Detecting and deterring insufficient effort responding to surveys. J. Bus. Psychol. 2012, 27, 99–114. [Google Scholar] [CrossRef]
  91. Meade, A.W.; Craig, S.B. Identifying careless responses in survey data. Psychol. Methods 2012, 17, 437–455. [Google Scholar] [CrossRef] [Green Version]
  92. Merino-Soto, C.; Martí-Vilar, M.; Serrano-Pastor, L. Careless responses and construct validity of Wong-Law emotional intelligence scale. PsyCh J. 2021, 10, 944–946. [Google Scholar] [CrossRef]
  93. Clark, M.E.; Gironda, R.J.; Young, R.W. Detection of back random responding: Effectiveness of MMPI-2 and personality assessment inventory validity indices. Psychol. Assess. 2003, 15, 223. [Google Scholar] [CrossRef]
  94. Godinho, A.; Kushnir, V.; Cunningham, J.A. Unfaithful findings: Identifying careless responding in addictions research. Addiction 2016, 111, 955–956. [Google Scholar] [CrossRef]
  95. Arias, V.B.; Garrido, L.E.; Jenaro, C.; Martínez-Molina, A.; Arias, B. A little garbage in, lots of garbage out: Assessing the impact of careless responding in personality survey data. Behav. Res. Methods 2020, 52, 2489–2505. [Google Scholar] [CrossRef]
  96. Merino-Soto, C.; Calderón-De la Cruz, G. Validez de estudios peruanos sobre estrés y burnout. Rev. Peru. De Med. Exp. Y Salud Publica 2018, 35, 353–354. [Google Scholar] [CrossRef]
  97. Flora, D.B. Your coefficient alpha is probably wrong, but which coefficient omega is right? A tutorial on using R to obtain better reliability estimates. Adv. Methods Pract. Psychol. Sci. 2020, 3, 484–501. [Google Scholar]
  98. McDonald, R.P. Test theory: A Unified Treatment; Erlbaum: Mahwah, NJ, USA; New York, NY, USA, 1999. [Google Scholar]
  99. McNeish, D. Thanks coefficient alpha, we’ll take it for here. Psychol. Method 2018, 23, 412–433. [Google Scholar] [CrossRef] [PubMed]
  100. Riley, R.D.; Higgins, J.P.T.; Deeks, J.J. Interpretation of random effects meta-analyses. BMJ 2011, 342, 964–967. [Google Scholar] [CrossRef] [Green Version]
  101. Brannick, M.T.; Potter, S.M.; Benitez, B.; Morris, S.B. Bias and precision of alternate estimators in meta-analysis: Benefits of blending schmidt-hunter and hedges approaches. Organ. Res. Methods 2019, 22, 490–514. [Google Scholar] [CrossRef]
  102. Gronau, Q.F.; Heck, D.W.; Berkhout, S.W.; Haaf, J.M.; Wagenmakers, E.-J. A primer on Bayesian model-averaged meta-analysis. Adv. Methods Pract. Psychol. Sci. 2021, 4, 25152459211031256. [Google Scholar] [CrossRef]
  103. King, D.L.; Chamberlain, S.R.; Carragher, N.; Billieux, J.; Stein, D.; Mueller, K.; Potenza, M.N.; Rumpf, H.J.; Saunders, J.; Starcevic, V.; et al. Screening and assessment tools for gaming disorder: A comprehensive systematic review. Clin. Psychol. Rev. 2020, 77, 101831. [Google Scholar] [CrossRef]
  104. Sánchez-Meca, J.; Marín-Martínez, F.; López-López, J.A.; Núñez-Núñez, R.M.; Rubio-Aparicio, M.; López-García, J.J.; López-Pina, J.A.; Blázquez-Rincón, D.M.; López-Ibáñez, C.; López-Nicolás, R. Improving the reporting quality of reliability generalization meta-analyses: The REGEMA checklist. Res. Synth. Methods 2021, 12, 516–536. [Google Scholar] [CrossRef]
Figure 1. Flowchart of the selection and screening process of the systematic review articles according to the PRISMA 2020 statement.
Healthcare 10 01992 g001
Table 1. Characteristics of the reliability levels of the articles included in the meta-analysis.
Nαse95% CI αLevelsImpact on Variability
LlUL>0.70>0.80VRATIOQvratioTAURATIOQtauratio
IGDS9D18,828
Study 19890.8300.000.8140.845YY10.07 *0.8710.02 *0.82
Study 23940.8500.000.8260.871YY10.04 *0.880.99 *0.83
Study 310200.8200.010.8030.836YY10.08 *0.8910.03 *0.84
Study 42040.6100.000.5230.684NN0.920.920.880.88
Study 57080.8100.040.7880.830YNC1.09 *0.881.04 *0.83
Study 63540.7400.010.6970.778NCN1.10 *0.881.05 *0.83
Study 75380.7300.020.6940.763NCN1.09 *0.891.04 *0.84
Study 82570.8200.010.7840.851YNC1.08 *0.881.03 *0.83
Study 93100.8400.010.8110.865YY1.06 *0.891.00 *0.84
Study 108550.8100.010.7900.828YNC1.09 *0.891.04 *0.83
Study 1113060.6900.010.6640.714NCN1.04 *0.890.99 *0.84
Study 123510.8100.010.7780.838YNC1.09 *0.901.04 *0.84
Study 1310010.6600.010.6270.691NN0.98 *0.900.93 *0.84
Study 1410810.7900.010.7710.808YNC1.11 *0.861.05 *0.81
Study 1520780.7400.010.7230.756NN1.10 *0.881.05 *0.83
Study 1611210.8300.000.8150.844YY1.07 *0.861.02 *0.81
Study 1739380.8400.000.8320.847YY1.06 *0.881.00 *0.82
Study 187620.7800.000.7560.803YN1.11 *0.871.06 *0.81
Study 197770.7200.010.6890.748NCN1.09 *0.881.03 *0.83
Study 207840.5600.010.5120.604NN0.680.900.630.85
IGDS9P2787
Study 19230.950.0020.9450.955YY1.09 *0.260.810.26
Study 24570.930.0050.9200.939YY1.73 *0.210.450.21
Study 910290.850.0070.8360.863 *YY0.61 *0.251.300.25
Study 183780.890.0090.8720.906YY1.87 *0.211.420.21
IGDS27D2919
Study 19890.930.0030.92340.936YY1.64 **0.271.23 *0.17
Study 1410260.900.0040.89080.908YY2.02 *0.171.52 *0.11
Study 164230.930.0040.91980.939YY1.64 *0.181.23 *0.10
Study 264810.810.0120.78420.833 *YNC0.120.220.090.15
IGDS27P2454
Study 19230.950.0010.950.96YY0.310.640.200.49
Study 24570.940.0020.930.94YY1.03 *0.640.80 *0.49
Study 53150.970.0020.960.97YY1.63 *0.781.33 *0.60
Study 132720.960.0030.950.96YY1.62 *0.781.32 *0.60
Study 194870.960.0030.950.96YY1.64 *0.641.33 *0.49
α: Cronbach’s α reliability; n: sample size; se: standard error; >.70, >.80: Levels for qualify α (Y = yes; N = no; NC = non conclusive); VRATIO y TAURATIO: impact indexes of each study, on the variability of αmean; Qvratio, Qtauratio: cutoff points for VRATIO y TAURATIO (1000 bootstrap samples). * p < 0.05. ** p < 0.01.
Table 2. Meta-analytical estimates.
Kα+95% CIHeterogeneity
Confidence
LL, UL
Prediction
LL, UL
Q
(df)
τ
2)
I2
(CI 95%)
Rb
(CI 95%)
CVb (CI 95%)CVw
Random coefficients model
IGDS9D200.7750.74, 0.800.56, 0.88726.40 **
(11)
0.307
(0.094)
97.43
(95.5, 98.8)
96.1
(96.2, 96.4)
0.206
(0.20, 0.20)
0.864
IGDS9P40.9120.81, 0.950.51, 0.98279.53 **
(3)
0.488
(0.233)
98.55
(95.4, 99.8)
98.4
(98.3, 98.4)
0.198
(0.19, 0.20)
0.408
IGDS27D40.9080.79, 0.950.48, 0.98174.98 **
(3)
0.465
(0.217)
98.63
(95.7, 99.9)
98.5
(98.3, 98.6)
0.201
(0.19, 0.20)
0.383
IGDS27P50.9580.943, 0.9690.913, 0.98079.41 **
(4)
0.244
(0.05)
92.99
(80.6, 99.1)
92.2
(93.1, 93.5)
0.07
(0.07, 0.07)
0.473
Varying coefficients model
Kα’+Confidence
LL, UL
IGDS9D200.7640.755, 0.775-------
IGDS9P40.9050.889, 0.991-------
IGDS27D40.8920.885, 0.899
IGDS27P50.9580.955, 0.960
k: number of studies; GF: k–1 degrees of freedom; LL, UL: lower and upper limits; α+: mean coefficient α; τ2: between-studies variance estimated using restricted maximum likelihood. ** p < 0.01.
Table 3. Exploratory analysis results.
IGDS9DKmeans 1
(ng = 3)
Kmeans 2
(ng = 2)
Study 131
Study 231
Study 331
Study 412
Study 531
Study 622
Study 722
Study 831
Study 931
Study 1031
Study 1122
Study 1231
Study 1322
Study 1431
Study 1522
Study 1631
Study 1731
Study 1831
Study 1922
Study 2012
Wc SSC91.3%71.8%
IGDS9PKmeans 1
(ng = 2)
Study 11-
Study 22-
Study 31-
Study 41-
83.1%-
IGDS27DKmeans 1
(ng = 2)
Study 12-
Study 22-
Study 32-
Study 41-
93.8%
IGDS27PKmeans 1
(ng = 2)
Study 11-
Study 22-
Study 31-
Study 41-
37.5%-
Table 4. IGDS9D: dependence of cluster–covariable analysis.
2 Clusters3 Clusters
c2 (df)Cramer—Vc2 (df)Cramer—V
Language16.38 NS (19)0.3734.97 NS (19)0.343
English language2.78 NS (19)0.1878.59 NS (19)0.296
Application mode5.87 NS (19)0.3089.28 NS (19)0.341
Sample7.69 NS (19)0.3346.26 NS (19)0.268
Gamer condition4.97 NS (19)0.2548.06 NS (19)0.291
NS: not statistically significant (p > 0.50); Cramer-V: effect size estimate.
Publisher’s Note: MDPI stays neutral with regard to jurisdictional claims in published maps and institutional affiliations.

