1. Introduction
Multihead weighers were first used in the 1970s and, since then, they have been used to improve industrial process performance. Currently, they are used in different packaging processes for several products, regardless of their shape or size, and have become particularly essential in the food industry [
1,
2]. Multihead weighers play a fundamental role in the industrial process given the accuracy and speed they provide to the packaging process. Once programmed, they can automatically package several food industry products, including products with heterogeneous characteristics. This ensures compliance with current regulatory standards while reducing production costs by maintaining an efficient, high-volume product flow and preserving process quality. Still, one of the most prominent process requirements is that package contents must match the weight printed on its label. This becomes one of the main issues that must be addressed to guarantee high-quality standards in the final product, with variability being directly related to the quality of the process [
3]. In this sense, authors such as Taguchi [
4] claim that product quality depends on how close its quality features are to their nominal value, in such a way that everything that deviates from said nominal value is considered as a loss to society. Hence, quality in the packaging process may be achieved by reducing variability around the target weight (
T) [
5]. For these purposes, processes must be streamlined trying to guarantee that package content weights are as close as possible to the weight specified on the label. Optimization techniques, new algorithms, and experiments’ design can be used as quality engineering tools for the improvement and optimization of industrial processes [
6].
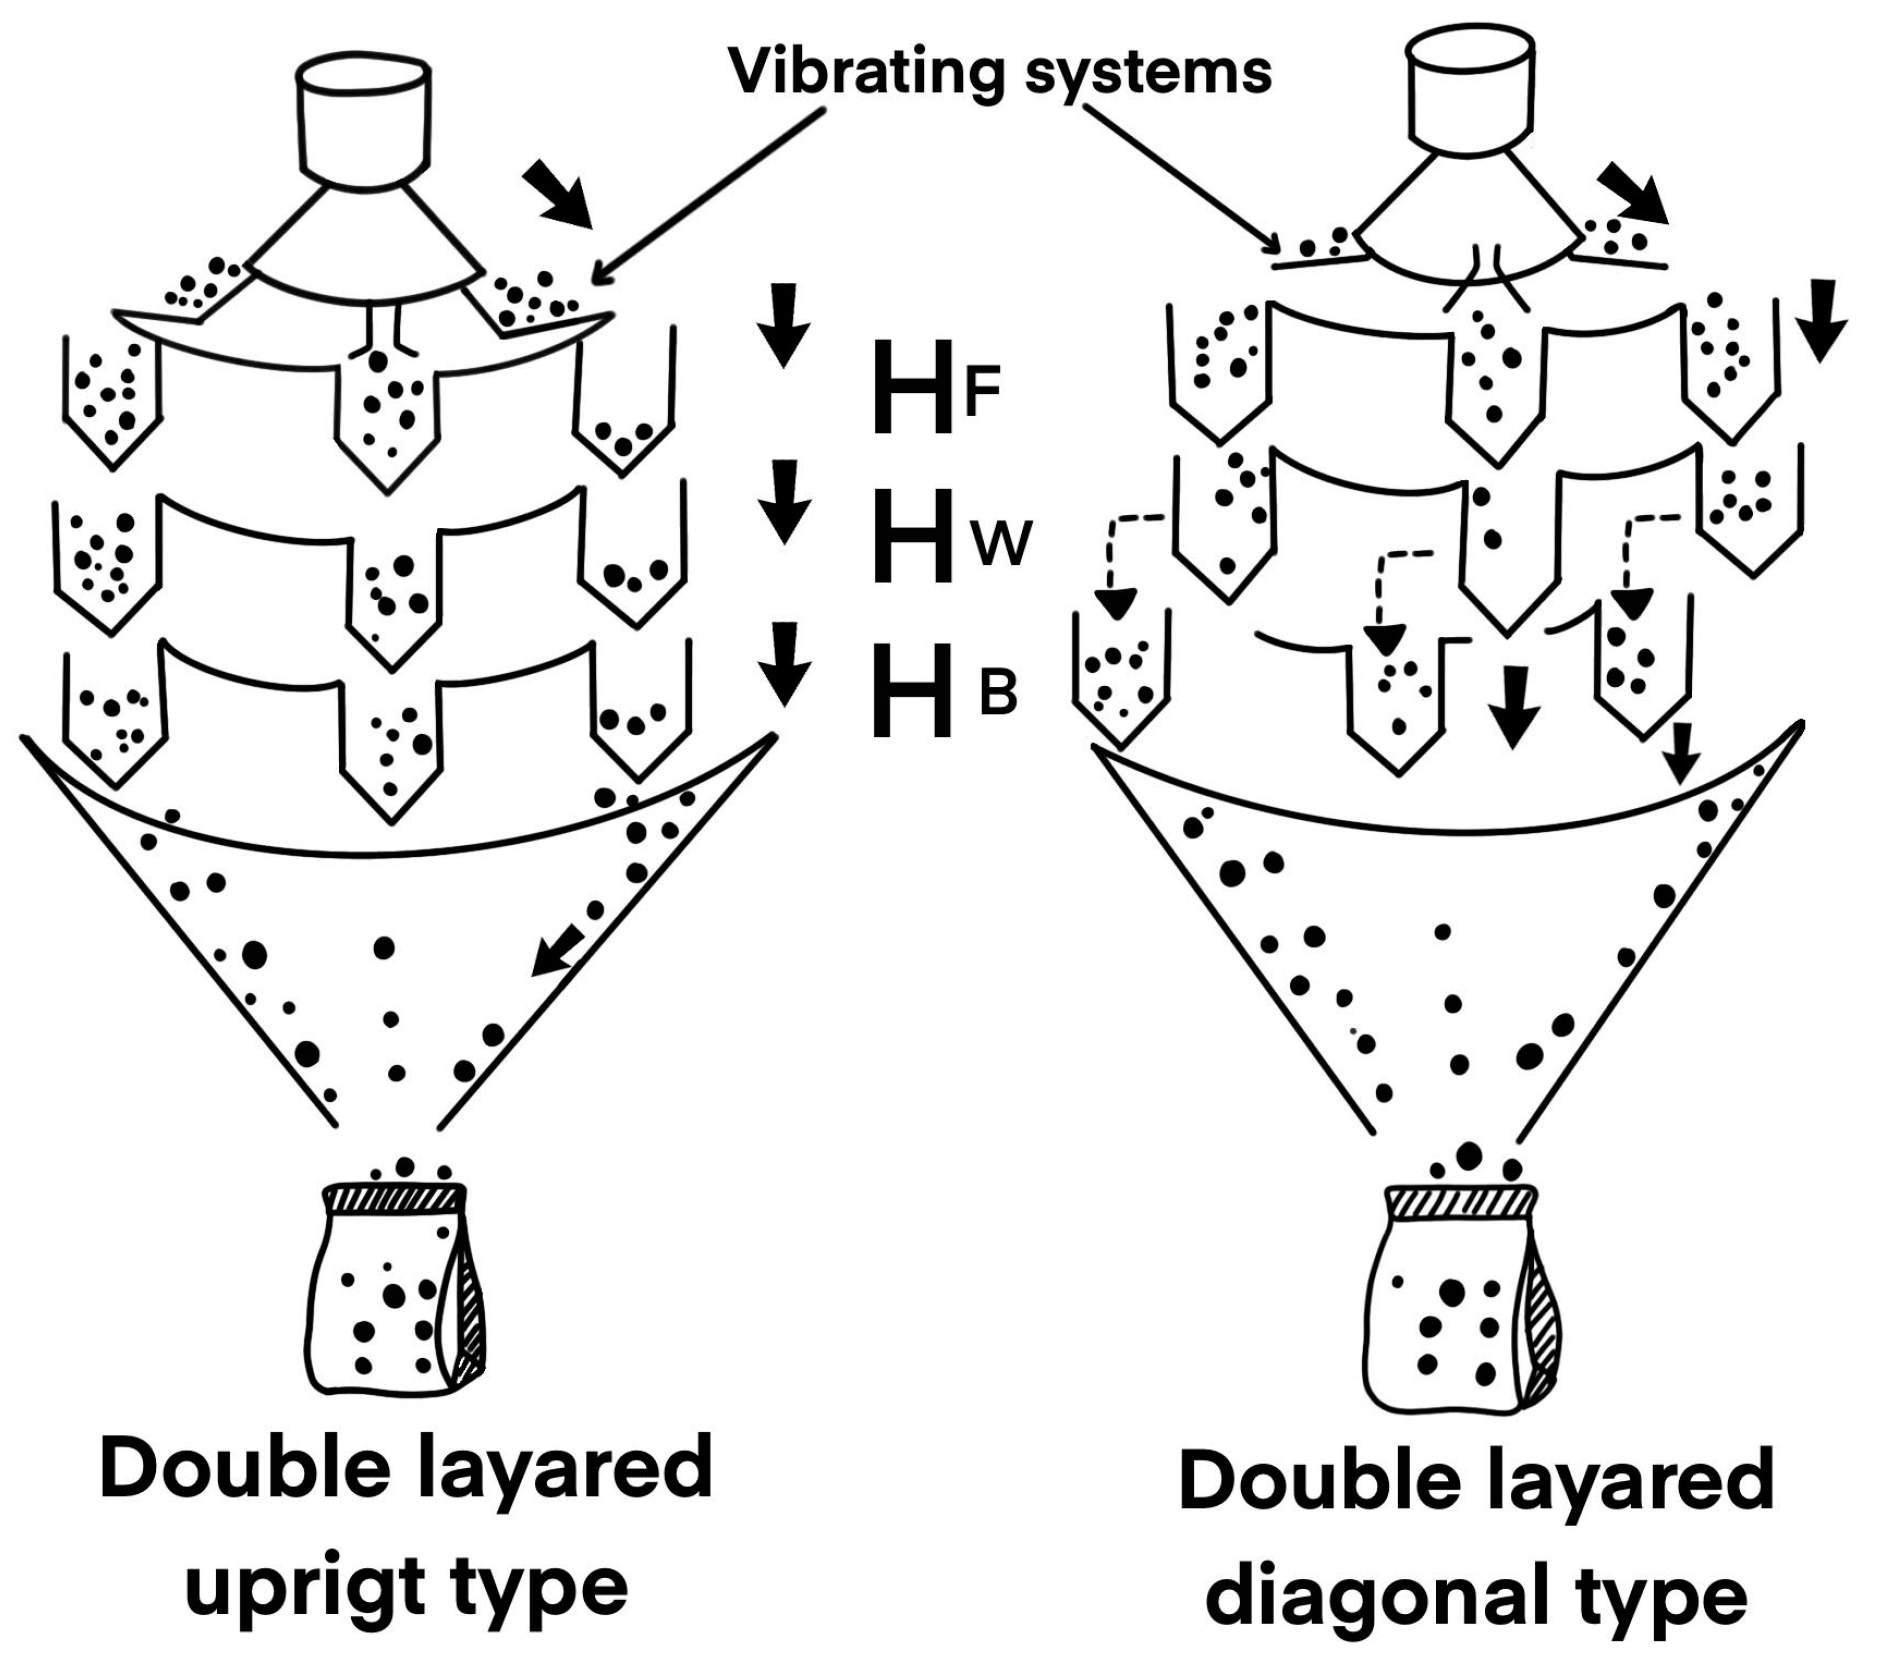
Multihead weighing systems are mainly composed of a vibrating feeder system,
feeding hoppers (
,
weighing hoppers
, and a discharge conduit to a packaging machine. In a traditional single-layer machine (without booster hoppers), the internal algorithm combines all the
n weighing hoppers in the machine to form a subgroup
of
hoppers and then selects a subset
whose sum of weights is the closest to the target weight
of the package. In this sense, package content weights are obtained by combining a subgroup of
hoppers from the
weighing hoppers that the machine contains, with
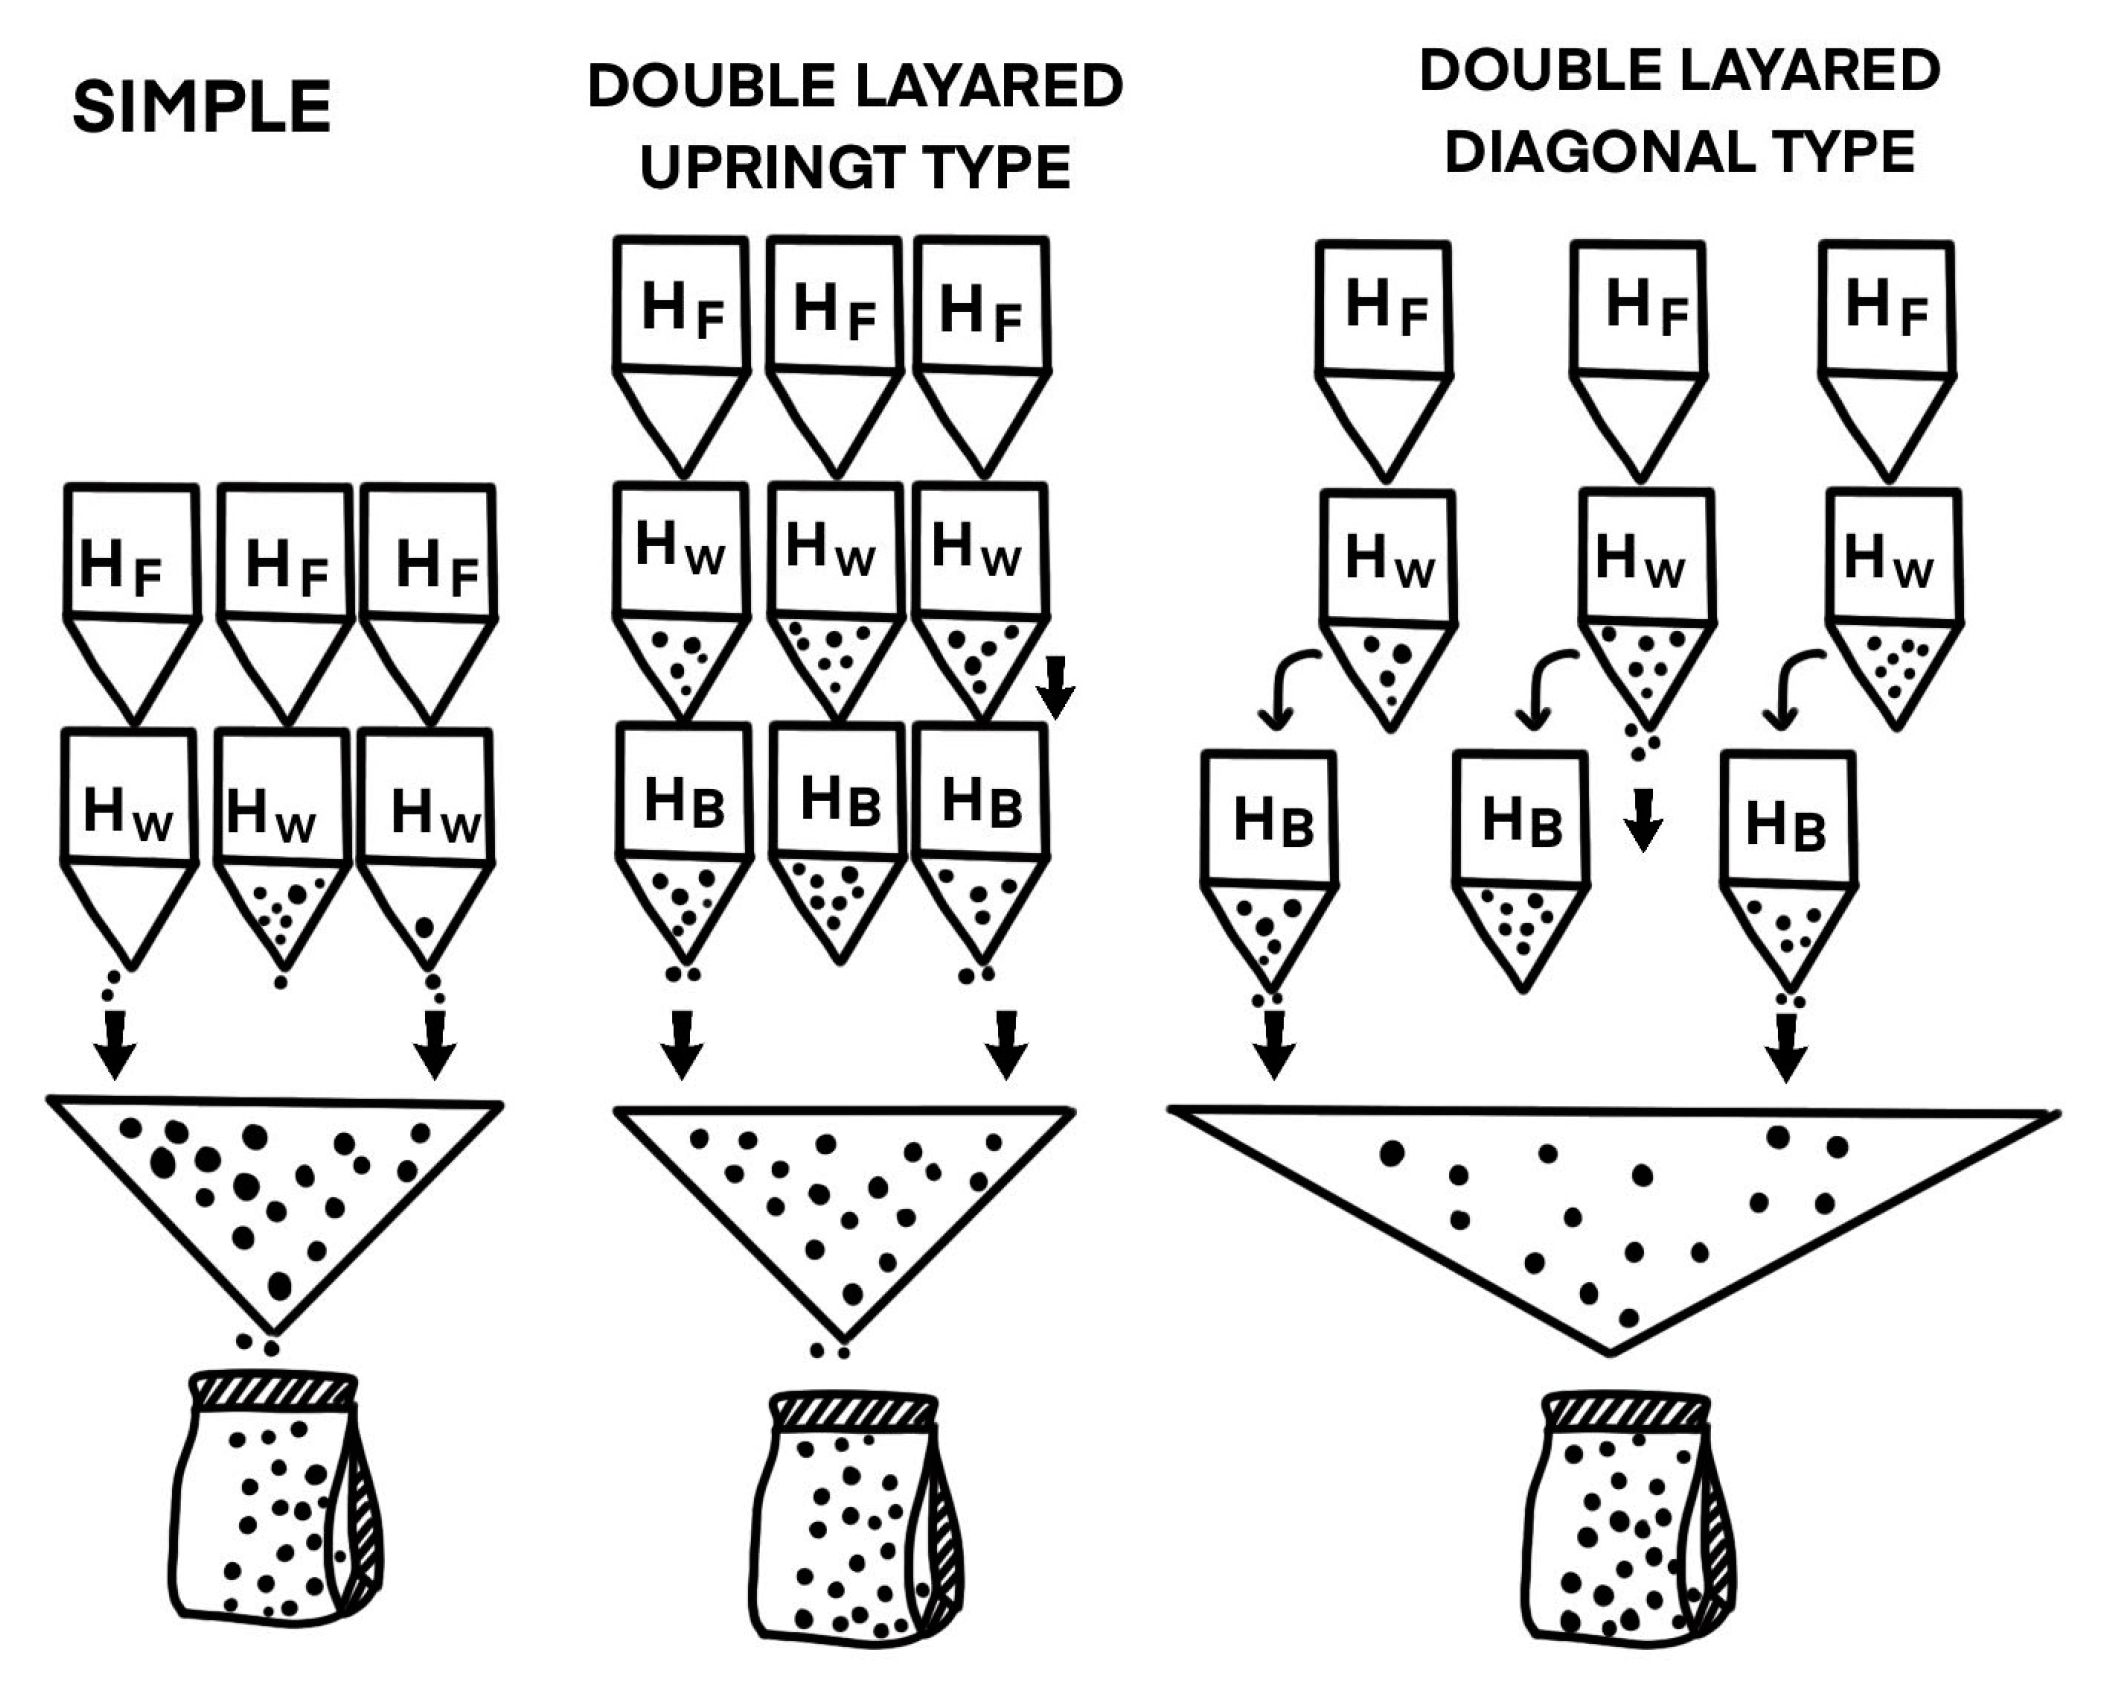
. However, double-layered (upright and diagonal) weighers contain an additional layer of hoppers and use a larger combination of hoppers to reach the target weight. In these double-layered machines, each of the
weighing hoppers (
) has a booster hopper (
) underneath, in which a single product ration can be stored, while the weighing hoppers receive a new product ration from the feeding hoppers (
), as illustrated in
Figure 1. For each package, all the hoppers must contain a certain product quantity, and the machine must combine
hoppers of the
so that the system must form a subset
of
hoppers. For double-layered upright systems, this subset
can be formed with booster hoppers or weighing hoppers as long as its corresponding booster hopper is part of the
hoppers, while, for the double-layered diagonal systems, a weighing and booster hopper cannot be selected simultaneously for the same k-nuple.
This research study proposes a new optimization algorithm for double-layered upright and diagonal machines that seeks to select a subset of hoppers whose total weights are greater and closer to the target weight . The algorithm was validated through a case study for actual products, wherein the performance characteristics of the process were measured in different scenarios. In numerical experiments, filling strategies designed and validated for three weighing hoppers in previous studies were tested. Likewise, different values from previously established combined hoppers were tested in each filling strategy.
This article is structured as follows:
Section 2 presents the state of the art within the multihead machine packaging process field. In
Section 3, the weighing process for double-layered upright and diagonal multihead weighers is described.
Section 4 discusses the different hopper-filling strategies used in the process. Then,
Section 5 explains the optimization model and the packaging algorithm proposed for double-layered weighers.
Section 6 lists the results and provides a preliminary assessment of the numerical experiments. Next,
Section 7 contains the results from the experimental design for the different process scenarios evaluated. Finally,
Section 8 discussion and
Section 9 elucidate our conclusions from this research study.
2. Background
The documented research studies of multihead machines propose diverse solutions for packaging issues. Different algorithms and solution and configuration models have been presented for these processes. For example, some authors propose an optimal scheme for determining ideal operation times for vibrating linear feeders in multihead weighers. In their corresponding studies, they found that the least-squares method can be used to reduce variability against fixed operating times [
7]. A bit-operation-based weighing algorithm succeeded in proving that operation times can be reduced and that the output weight from uneven hoppers is closer to the desired target weight [
8]. In other research studies, the product residence time in hoppers was introduced as a second objective. Hence, the packaging problem was formulated as a bicriteria approximation issue for discrete weights, and a dynamic programming algorithm was proposed for its solution. This algorithm aimed to reduce the maximum duration of the product in the packaging system [
9] while assuring that the total weight of each package was as close as possible to its target weight. Similar work was approached for double-layered upright and diagonal machines for discrete weights in the hoppers, using a bicriteria dynamic programming algorithm for these machines [
10]. Subsequently, the bicriteria model proposed by [
9] was ultimately improved through algorithms designed to reduce execution times, which makes the packaging process more efficient [
11]. Later, these theories were extended to duplex and quasi-duplex machines [
12]. In the same sense, heuristic algorithms have been proposed to find better results in the bicriteria packaging process, targeting label weights, and priority orders [
13,
14]. Likewise, several optimization algorithms have been proposed to determine the optimum product flow rate for radial feeders, seeking to minimize expected production costs per each “compliant” package within a fixed period of time. In this study, the response surface methodology identified conditions of minimal process variability and lower costs, compared to an industrial solution [
15]. A heuristic optimization model based on a detailed characterization of what constitutes a near-optimal solution to the multihead weigher configuration problem has also been proposed. This model reduced hopper combination response times according to each package weight, in addition to finding the right hopper feeding points to minimize the mean square error for package weights [
16]. Statistical control of the packaging process has also been addressed. For example, several modified control charts have been developed and studied to monitor and control the package production process [
17]. Finally, new bio-objective approaches have been developed for the optimization of actual package weights [
18,
19], incorporating package target weights and the priority associated with the product discharge times reported by hoppers into the model. The innovation proposed by these approaches is that the relative importance of the objectives is managed and dynamically adjusted in each packaging operation, thus determining the best operation conditions for each process [
20]. These approaches are extremely useful for packaging fresh or frozen products. As evidenced, hitherto, no scientific content has been disclosed regarding diagonal and upright machines considering actual weights in hoppers with previously established
values. Therefore, this study becomes quite relevant as it proposes a new optimization algorithm for double-layered upright machines that considers actual weights and preestablished
values.
3. Weighing Process on Double-Layered Upright and Diagonal Weighers
The packaging process in double-layered multihead weighers consists of selecting a subset
from the set
of the
machine hoppers to produce each package. Initially, the product is distributed through the vibrating channels to the feeding hoppers, Then, it is discharged to the
weighing hoppers (
, where the product is weighed. In double-layered upright and double-layered diagonal weighers, each of the weighing hoppers has a booster hopper, in which the content of the weighed product can be stored. For this reason, once the product is weighed, it is discharged into the corresponding
booster hoppers (
and the weighing hopper receives a new portion of the product, as denoted in
Figure 2. Once all the hoppers are full (weighing and booster), the machine calculates the combinations of all the weights, selecting a subset
of
hoppers whose sum of the weights is greater and closer to the target weight
. Then, the unloaded hoppers are filled with a new product to repeat the procedure until completing the
number of packages required.
The
weights in the hoppers are arranged in a normal distribution
[
14,
15,
16], where
is the average weight of the product to be provided in each weighing hopper
, and
is the standard deviation. Previous studies have found that
has a direct correlation with the mean quantity
and linearly depends on it, due to vibrating feeding systems, according to
; where
is a proportionality coefficient and varies according to the characteristics of the packaging product [
14,
15,
16,
17,
19].
For each discharge, the single-layer machine performs a number of combinations (NC) determined by Equation (1), where
is the total number of hoppers in the system and
is the hoppers to be combined. By adding the booster layers, the NCs for the double-layered upright and diagonal machines increase, being greater in the latter.
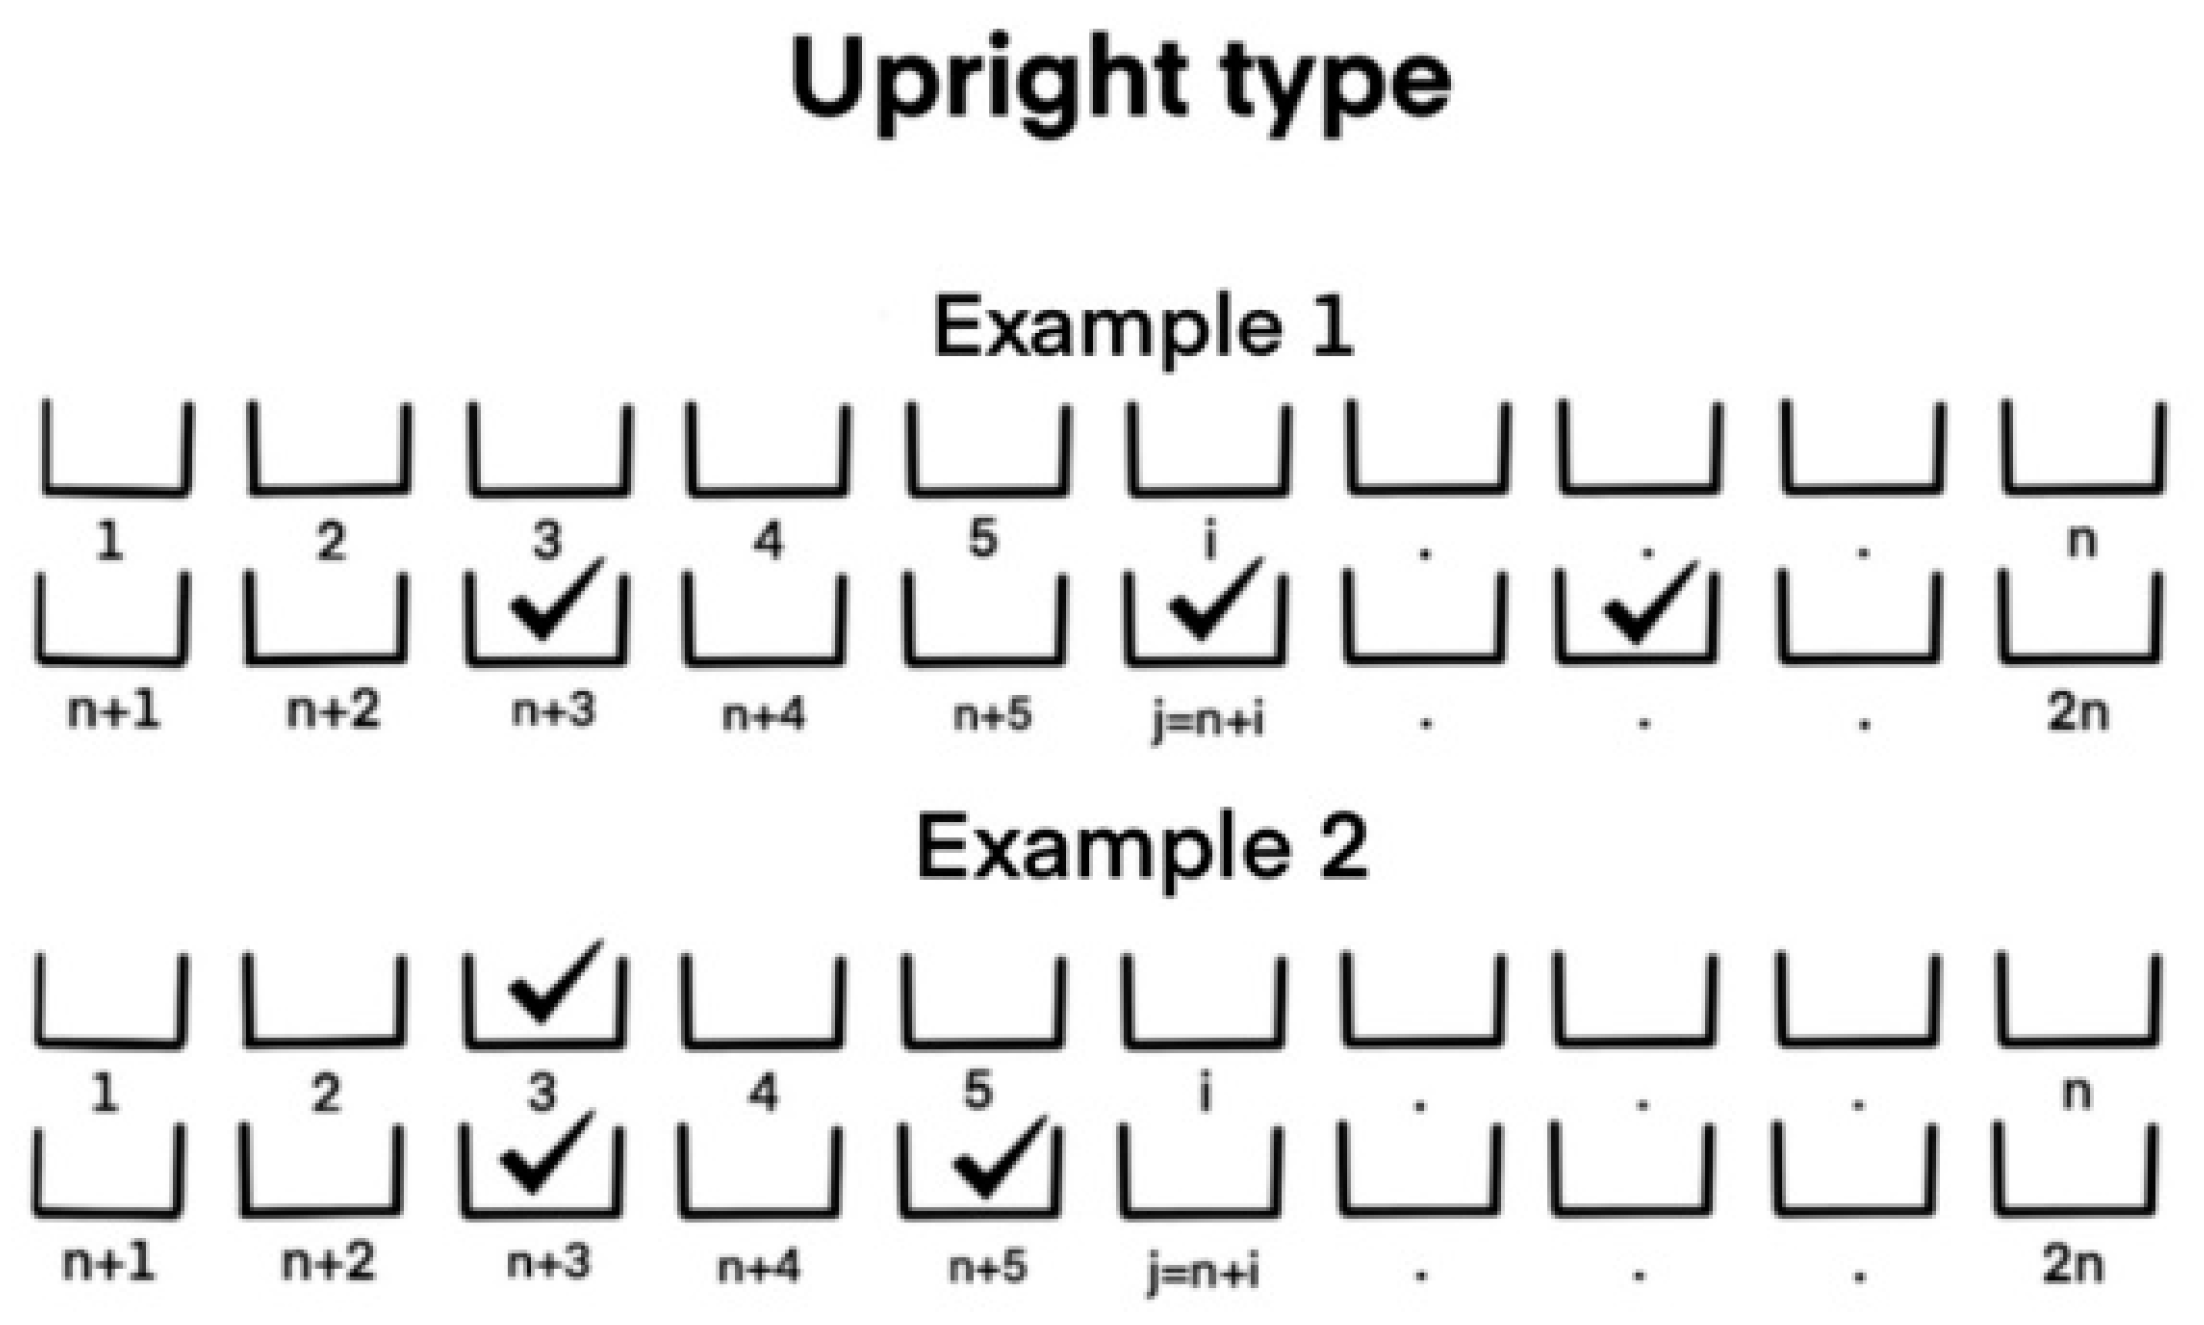
For each package produced, the double-layered upright machine can discharge booster hoppers or simultaneously discharge the weighing hopper and its corresponding booster hopper (
Figure 3), making the NC greater, thus improving the possibility of finding a subset of hoppers that meet the target weight requirement. Depending on the number of weighing hoppers, we have several types of combinations. For example, the system can combine
booster hoppers or
booster hoppers, where
is an integer, with their corresponding weighing hoppers and the other
booster hoppers.
For
, when combining the booster hoppers,
combinations are obtained, but the weighing hopper with its corresponding booster can also be combined; therefore, there are
additional cases (see Equation (2)). In the same sense, for
, first, there are
booster hopper combinations. In addition, the weighing hoppers can be combined with booster hoppers, and each pair can be associated with
hoppers, replicated
times (see Equation (3)). By mathematical induction of Equations (2)–(8), it is deduced that, in general, the total NC of
hoppers is determined by Equation (9), where
represents the integer part of
.
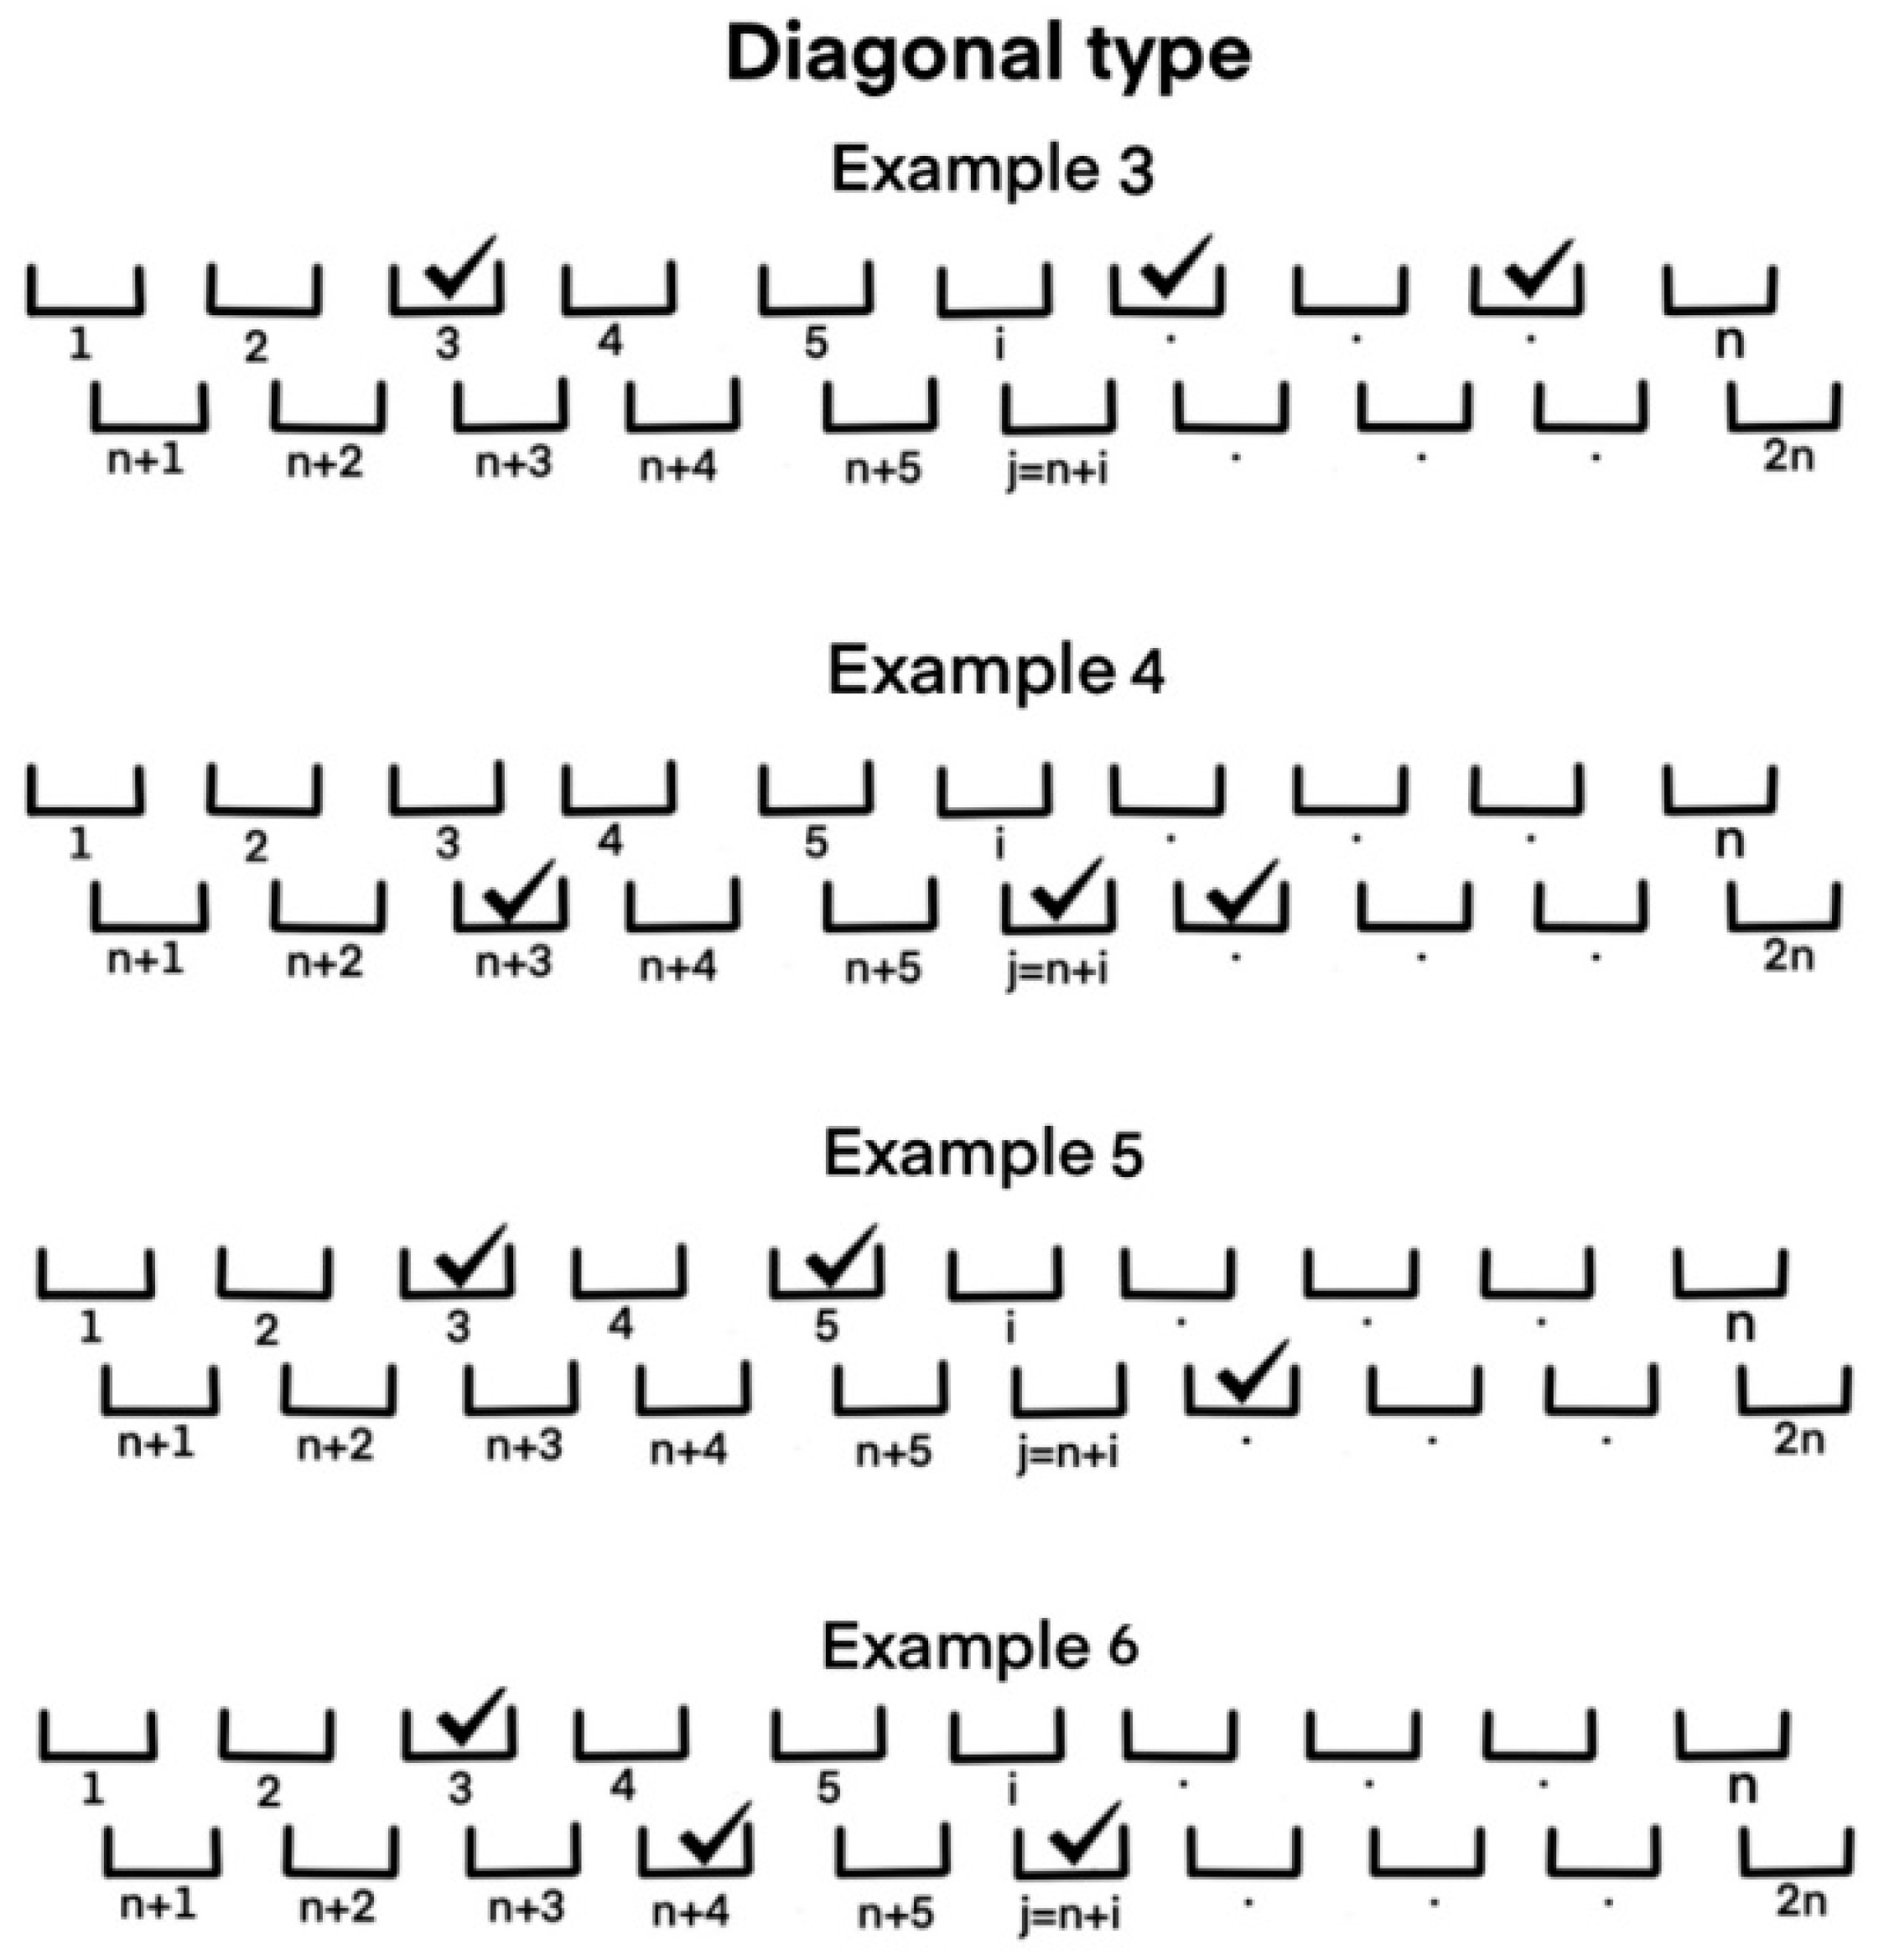
Furthermore, for double-layered diagonal machines, only booster hoppers, only weighing hoppers, or a combination of both levels can be discharged to produce each package, as long as a weighing hopper and its booster are not simultaneously unloaded, as denoted in
Figure 4.
For example, for
,
weighing hopper combinations are generated, each of the weighing hoppers can be associated with
booster hoppers replicated
times and, finally,
booster hopper combinations, the mathematical expression to generate the combinations is shown in Equation (10). For
, only three booster hoppers can be combined, i.e., two booster hoppers with one of the
remaining weighing hoppers, one booster hopper with a combination of two of the
remaining weighing hoppers, or only three weighing hoppers. Equations (10)–(13) denote the calculation of the combinations for
= 2, 3, 4, and 5. In general, by mathematical induction, the total NC of
hoppers with
is determined by Equation (14).
Table 1 below presents an example of the NC that can be generated for each machine type for
with
up to
.
As aforementioned, in its initial configuration, the double-layered upright machine has a restriction in the combination of the
system hoppers
. Specifically, a hopper of
can only be part of a
of hoppers if and only if the set of the
hoppers contains
, with
. However, in the double-layered diagonal machine, all
and
that belong to the
must meet the condition of
.
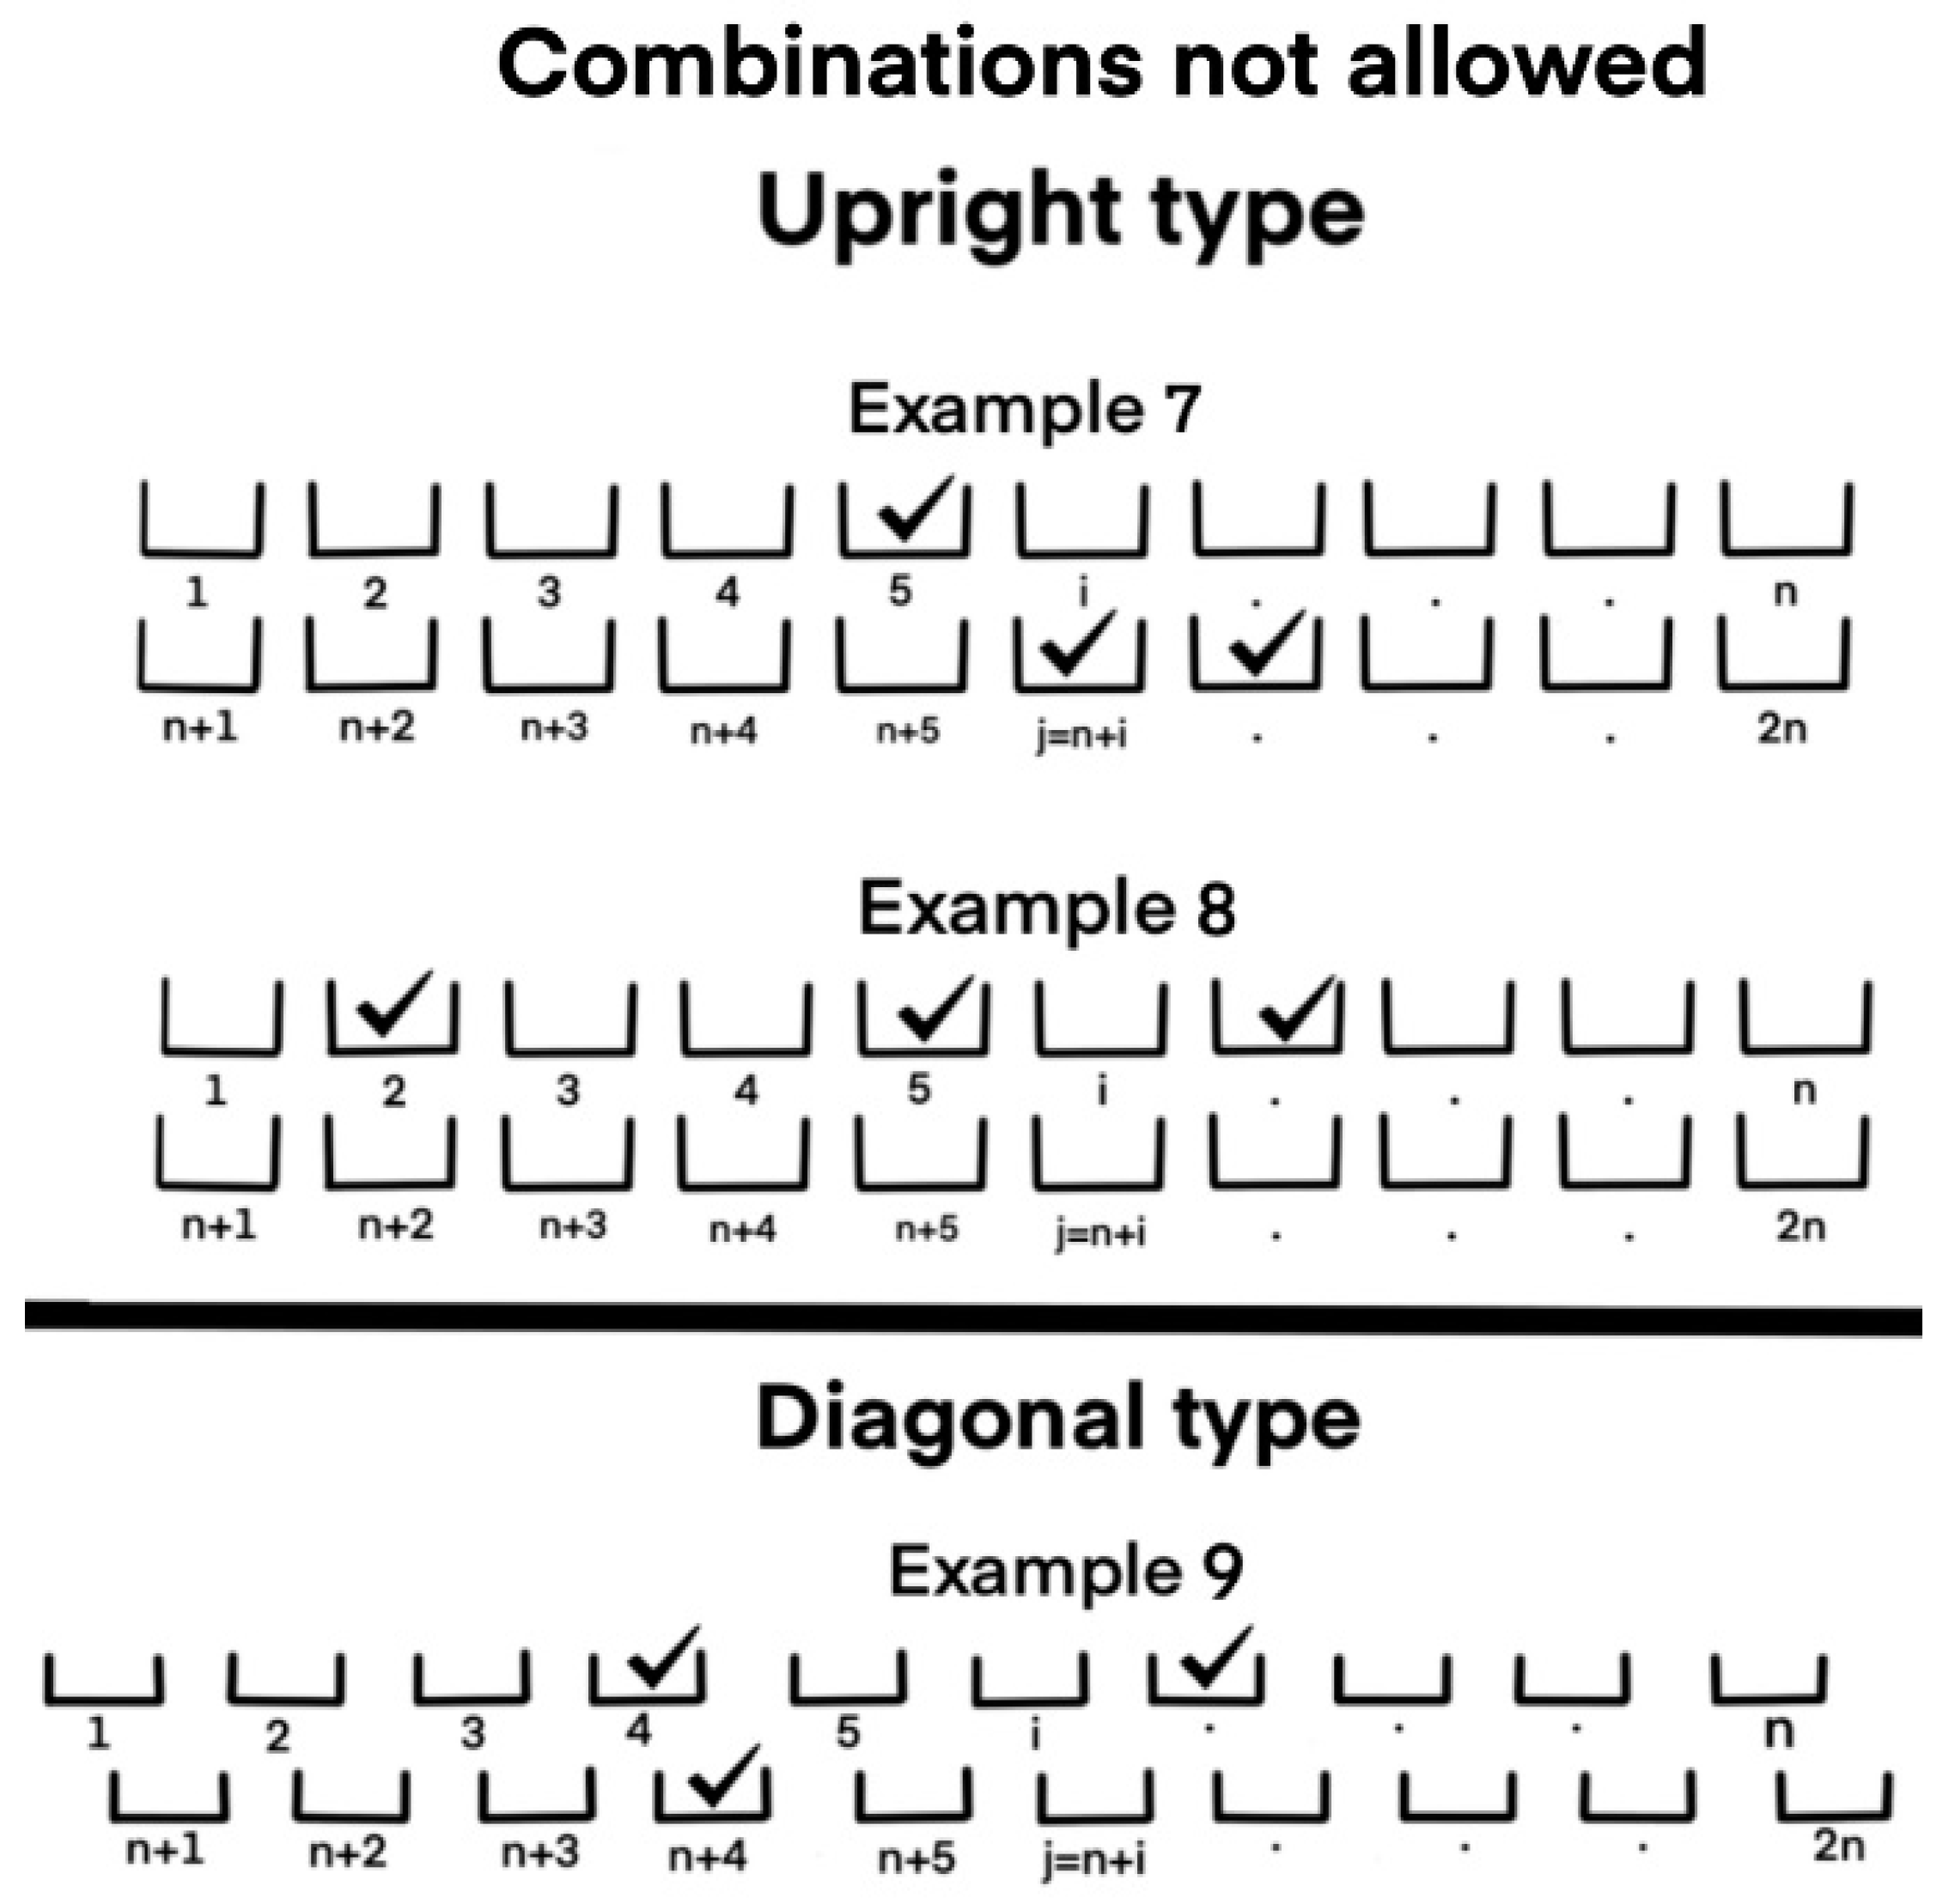
Figure 3 below illustrates the invalid combinations for each machine. For example, for
with
, Hopper 3 in a double-layered upright system is a weighing hopper, while Hopper 13 is a booster hopper. Here, Hopper 3 may be selected for combination provided that Hopper 13 is also selected, while, for the diagonal system, they cannot be selected simultaneously. Examples 7 and 8 of
Figure 5 denote invalid combinations for the upright machine when trying to combine weighing hoppers without considering their corresponding booster hopper. Furthermore, Example 9 illustrates an incorrect combination in the diagonal machine when trying to simultaneously discharge the weighing hopper with their corresponding booster hopper.
4. Hopper-Filling Strategies
In the industrial field, the filling configuration of the hoppers during the multihead weighing process is made based on the experience and skill of the machine operator. This is since the machine does not have a predetermined configuration strategy for all the types of existing products that can be packaged in it. To address this fact, the present research proposes solving the packaging problem through an algorithm for different
hopper combinations, with an average feed for each hopper according to the three filling strategies proposed by [
14,
19,
20] for single-layered weighers (see
Table 2, Equations (15)–(17)). Two of these strategies consider the cases in which each hopper
is filled with a different average quantity of product
(instead of a common value
). In this sense, and considering the original concept of each filling strategy, this study will explore the cases in which hopper feeds are defined so that hopper subgroups may share the same value of
. These strategies have been implemented in single-layered machines using single-target and bio-target algorithms with good results in reducing process variability [
14,
18,
19,
20]. However, they have not yet been tested on double-layered machines. With the implementation of the strategies, it is also intended to evaluate if it is more efficient for the process to supply all hoppers with the same amount of product or uneven amount of product according to the coefficient of proportionality
related to the product to be packed. Hopper feed variation will depend on a change value represented by the
parameter, which is commonly used in statistical process control to simulate out-of-control processes. Nevertheless, for the purposes hereof, it will be used to voluntarily simulate an uneven product supply for weighing hoppers. Herein,
will take values from 0 to 3 with increments of 0.5 (these increments are represented by the
parameter, as expressed in Equation (15)). In addition, the average filling value for each hopper will also be influenced by the proportionality coefficient
(
), which will depend on the type of material to be packaged. In this document, proportionality coefficients are used for two different pasta products: Fusilli, with
and Ravioli, with
[
19,
20]. For example, to calculate the standard deviation for a target weight of 500 g when we want to pack a product such as Fusilli by combining three hoppers, we will have a theoretical deviation of
= 20.5 g.
In this way, to assess the algorithm proposed for double-layered machines, the three strategies will determine the average product supply for hopper subgroups and the total number of hoppers in each subgroup. The first strategy
proposes dividing the
weighing hopper into five groups,
and feeding different average quantities to each subgroup
, establishing the filling configuration during the packaging process according to Equation (15). The second strategy
proposes diving the
weighing hopper into three groups,
and feeding different average quantities to each subgroup
, as per Equation (16). Finally, in the third strategy
the
weighing hoppers are filled with the same amount of product,
for each hopper, as expressed in Equation (17).
In addition to the
,
, and
filling strategies, in which an average product supply is established for each subgroup, we must define a distribution of hoppers, in particular, the number of hoppers that are assigned to each subgroup (see
Table 2). In this sense, three types of distributions are proposed: equal, central, and extreme. In the equal distribution strategy, each group includes approximately the same number of hoppers. For example, for the
filling strategy, the total number of hoppers
is divided among the five groups
. Each of the
(
) is assigned a number of hoppers equal to the largest integer multiplied by 5 that is closest to
(integer part
). If the remainder of the division
is 1, the central group
will have one more hopper. If it is 2, a hopper will be assigned to each extreme group. For
they are distributed between
. If
the
group will have one less hopper than the rest.
The central distribution consists of assigning as many hoppers as possible to the central set of hoppers. For example, in strategy
for
and
one and two hoppers will be assigned, respectively, to each end, and the surplus is assigned to the central group. Finally, the extreme distribution assigns the largest number of hoppers to the extreme subgroups
, and the least amount to
.
Table 3 and
Table 4 illustrate an example of the number of hoppers for each subgroup according to the
,
, and
strategies with
weighing hoppers, and the average supply values for central, equal, and extreme subgroup distributions.
6. Preliminary Analysis
To validate the algorithm, we used proportionality coefficients of
for Fusilli and
for Ravioli [
20]. In addition, a number of
= 16 weighing hoppers were assessed, at
= 2, 3, 4, 5, and 7,
and a target weight of
g. The number of hoppers in each subgroup is shown in
Table 3. Combinations generated for the different values of
assessed are presented in
Table 1. The performance measures calculated were the average weight of the packages produced (
), the standard deviation of the packages produced (
), and the coefficient of variation of the packages produced
, all above for
= 10,000 packages.
Results for the double-layered upright and diagonal machine are presented in
Table 5 and
Table 6. Here, we observe that at
, for the double-layered upright machine, the
strategy produces a weight closer to
and lower values of
and
when
= 7. However, this strategy offers the highest values for
and
, thus becoming the least favorable for the process. In
and
, the average weight closest to
and lower values of
and
were obtained at
= 7. However, their values were similar to
= 6. These last strategies seem to be the most convenient in terms of reducing process variability. This behavior of the strategies is maintained for the double-layered diagonal machine, which also denotes lower values when compared to those obtained in the double-layered upright machine.
However, the results of the tests for
show that the average weight of the packages closest to the target weight and the lowest values of
and
are presented for
in both machines, being lower in
and
. In general terms, we observe that when the value of the proportionality coefficient is increased to
, the
,
and
values also increase. However, the behavior (operation) of the process is similar for both products. Based on these results, the design of experiments presented in
Section 7 was proposed to determine which conditions decrease process variability and provide higher values and as close as possible to the target weight.
7. Experiment Design
To follow up on our preliminary analysis, an experiment design (DOE) of fixed effects factors [
24] was conducted to determine the best combination of treatments that provides the least process variability. For the design, the factor levels that evidenced the best performance in their coefficient of variation are considered, discarding those that yielded the lowest levels of process variability reduction. The multifactorial design consists of eight factors, as shown in
Table 7, for a total of 1512 treatments in each machine, each of them with three replicates, finally obtaining 12,096 runs. The response variable studied is the coefficient of variation obtained in each run of 10,000 packages since it is a measure that may be used to compare different target weights
. In addition to analyzing the best factor combination, the upright and diagonal machines are compared against each other to determine which offers less process variability. Here, the first factor encompasses two levels, which refer to the double-layered upright or diagonal machine. A second factor is associated with the number of weighing hoppers. In this case, machines with 10, 14, and 16 weighing hoppers were assessed. The third factor is the number of hoppers to combine with values from
to
. Another factor to consider is the target label weight, which is set at two levels: 250 g and 500 g. In addition, two packaging products, Fusilli and Ravioli, constitute the two levels of the sixth factor. The
and
strategies determine hopper subgroups, grouped by equal, central, and extreme levels. The filling position constitutes the eighth factor with seven levels
0, 0.5, 1, 1.5, 2, 2.5, and 3, which simulate an out-of-control process when
.
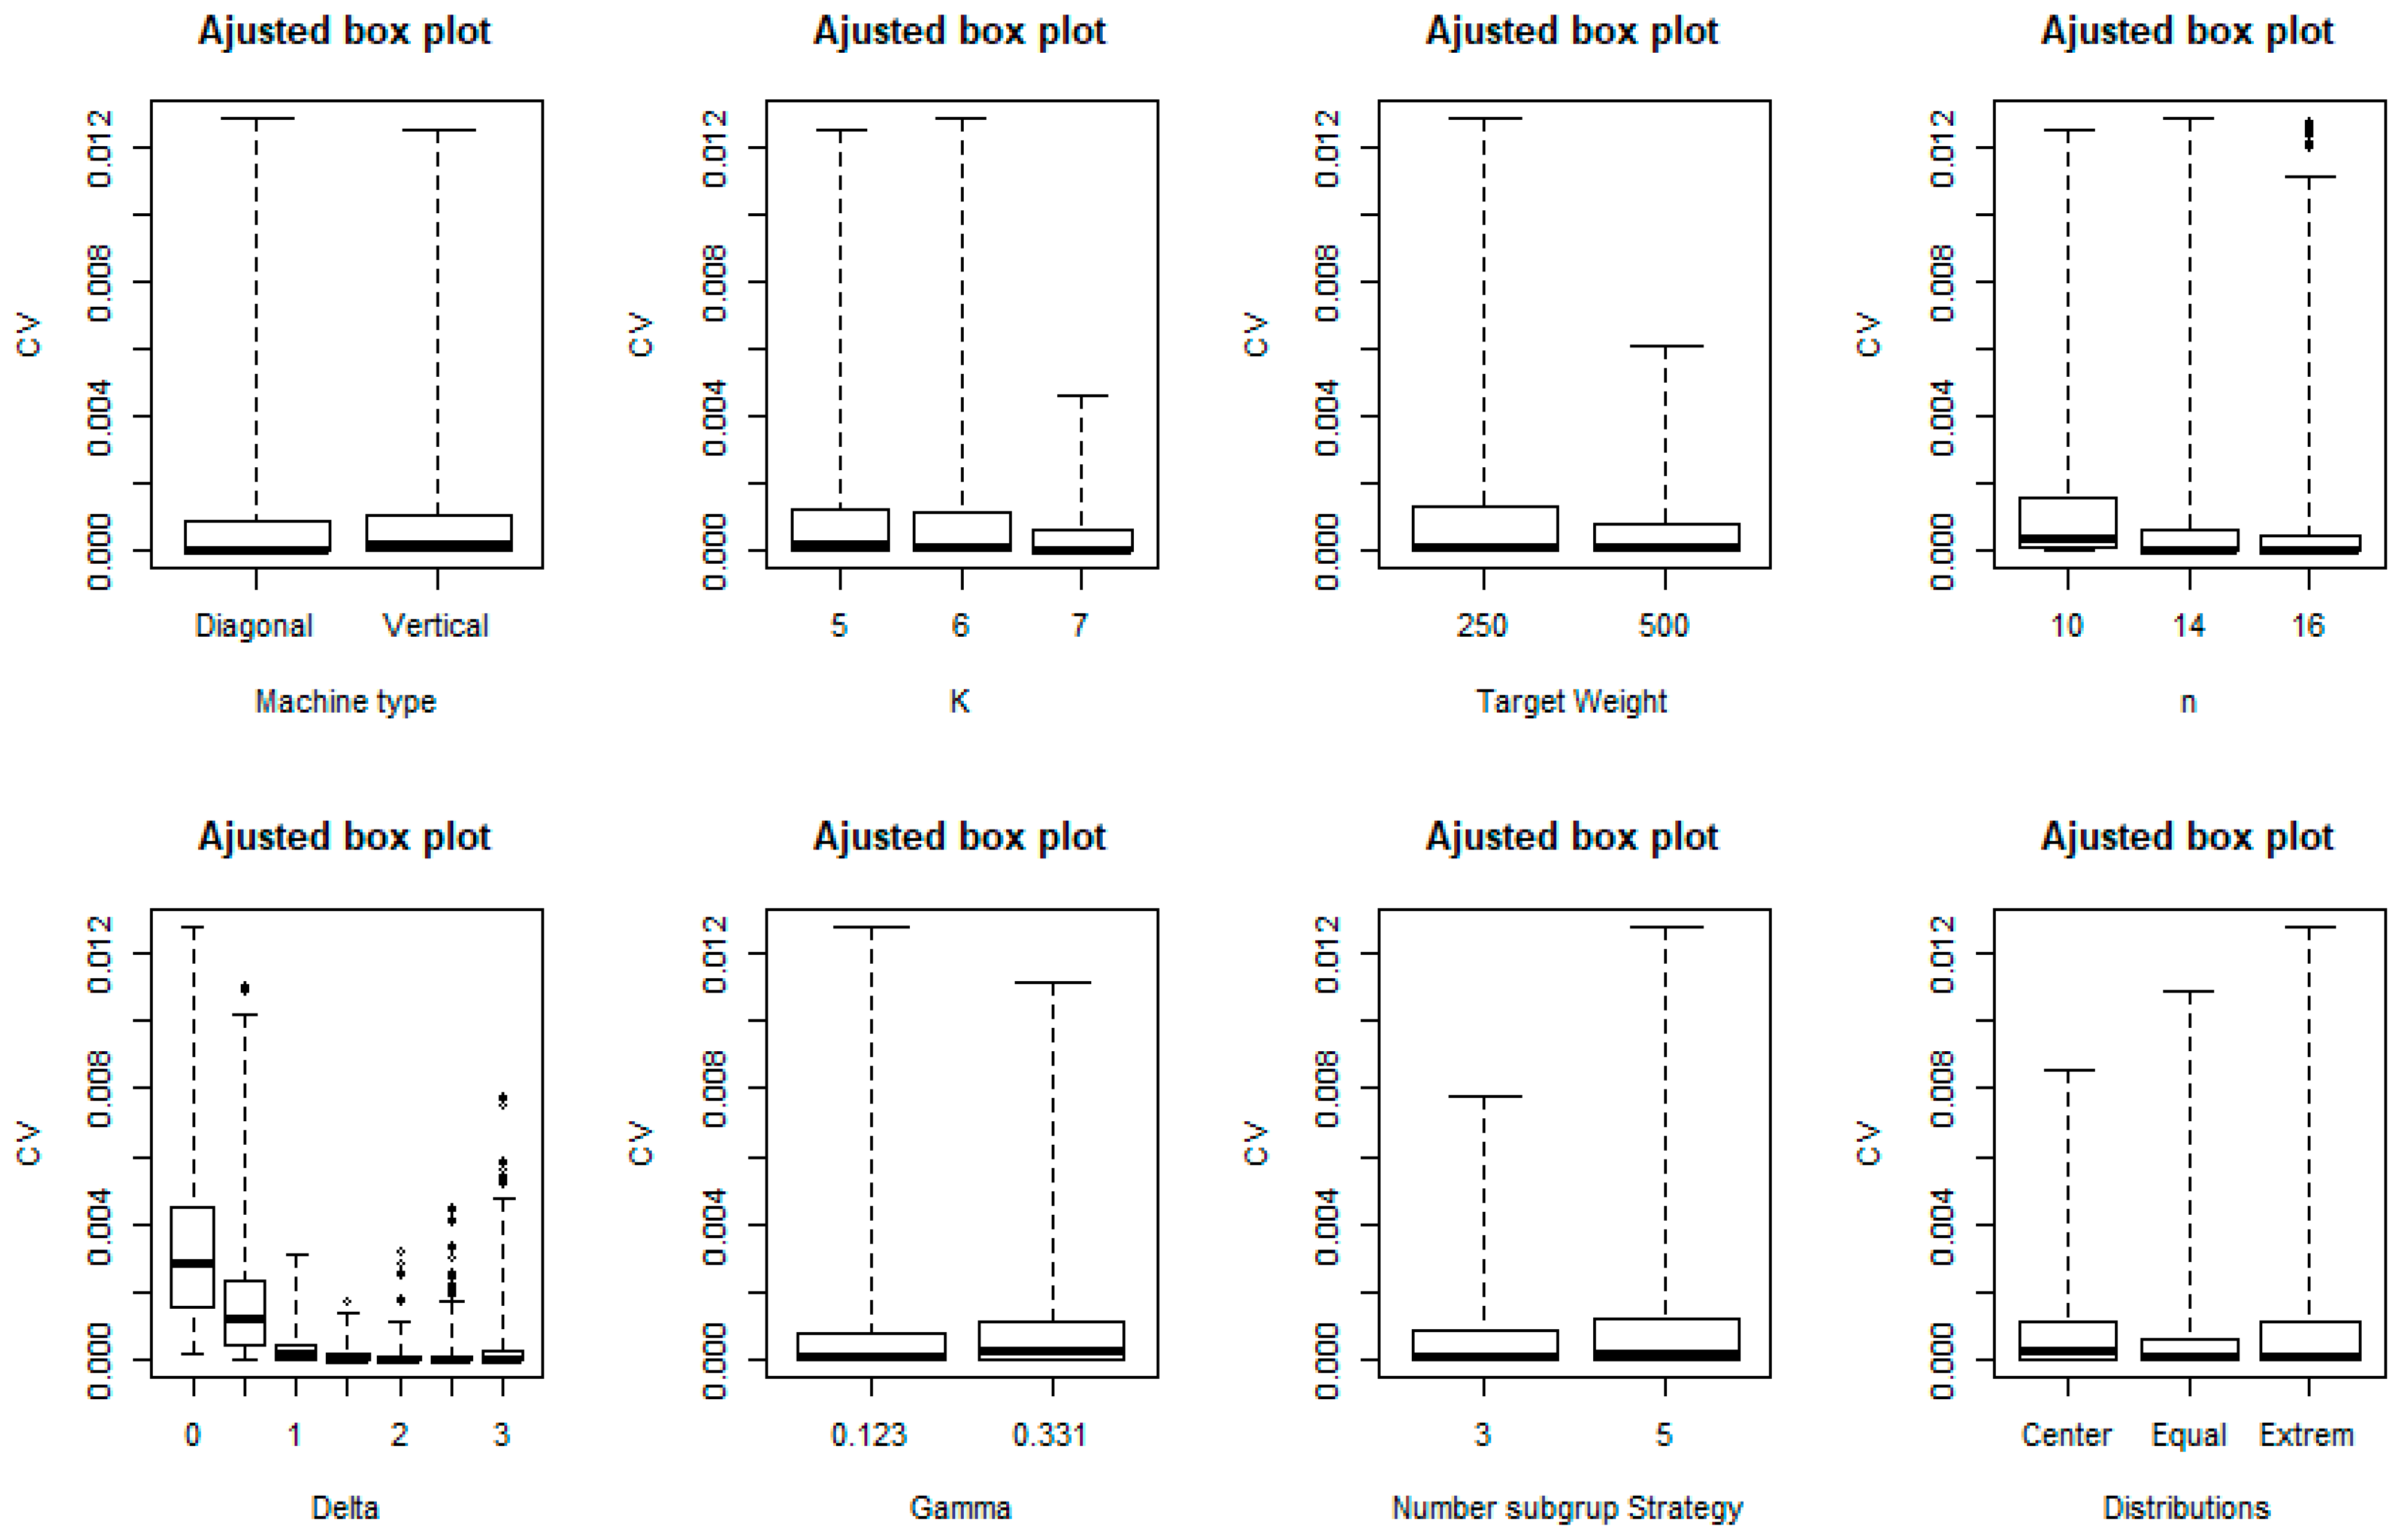
Given that the data of the response variation coefficient variable (
CVpaq) are asymmetric, with a lower target weight, adjusted box plots are used to compare the levels within the same factor, as shown in
Figure 6. To assess the experiment design, a transformation of the variable
by Johnson’s method [
25] is used to standardize the data, thus obtaining the transformed coefficient of variation (
) as the response variable.
Results from the experiment design were analyzed using analysis of variance (ANOVA).
Table 8 denotes the results of the ANOVA. As it may be observed, no significant differences were found in the product type and number of subgroups factors for the hopper distribution.
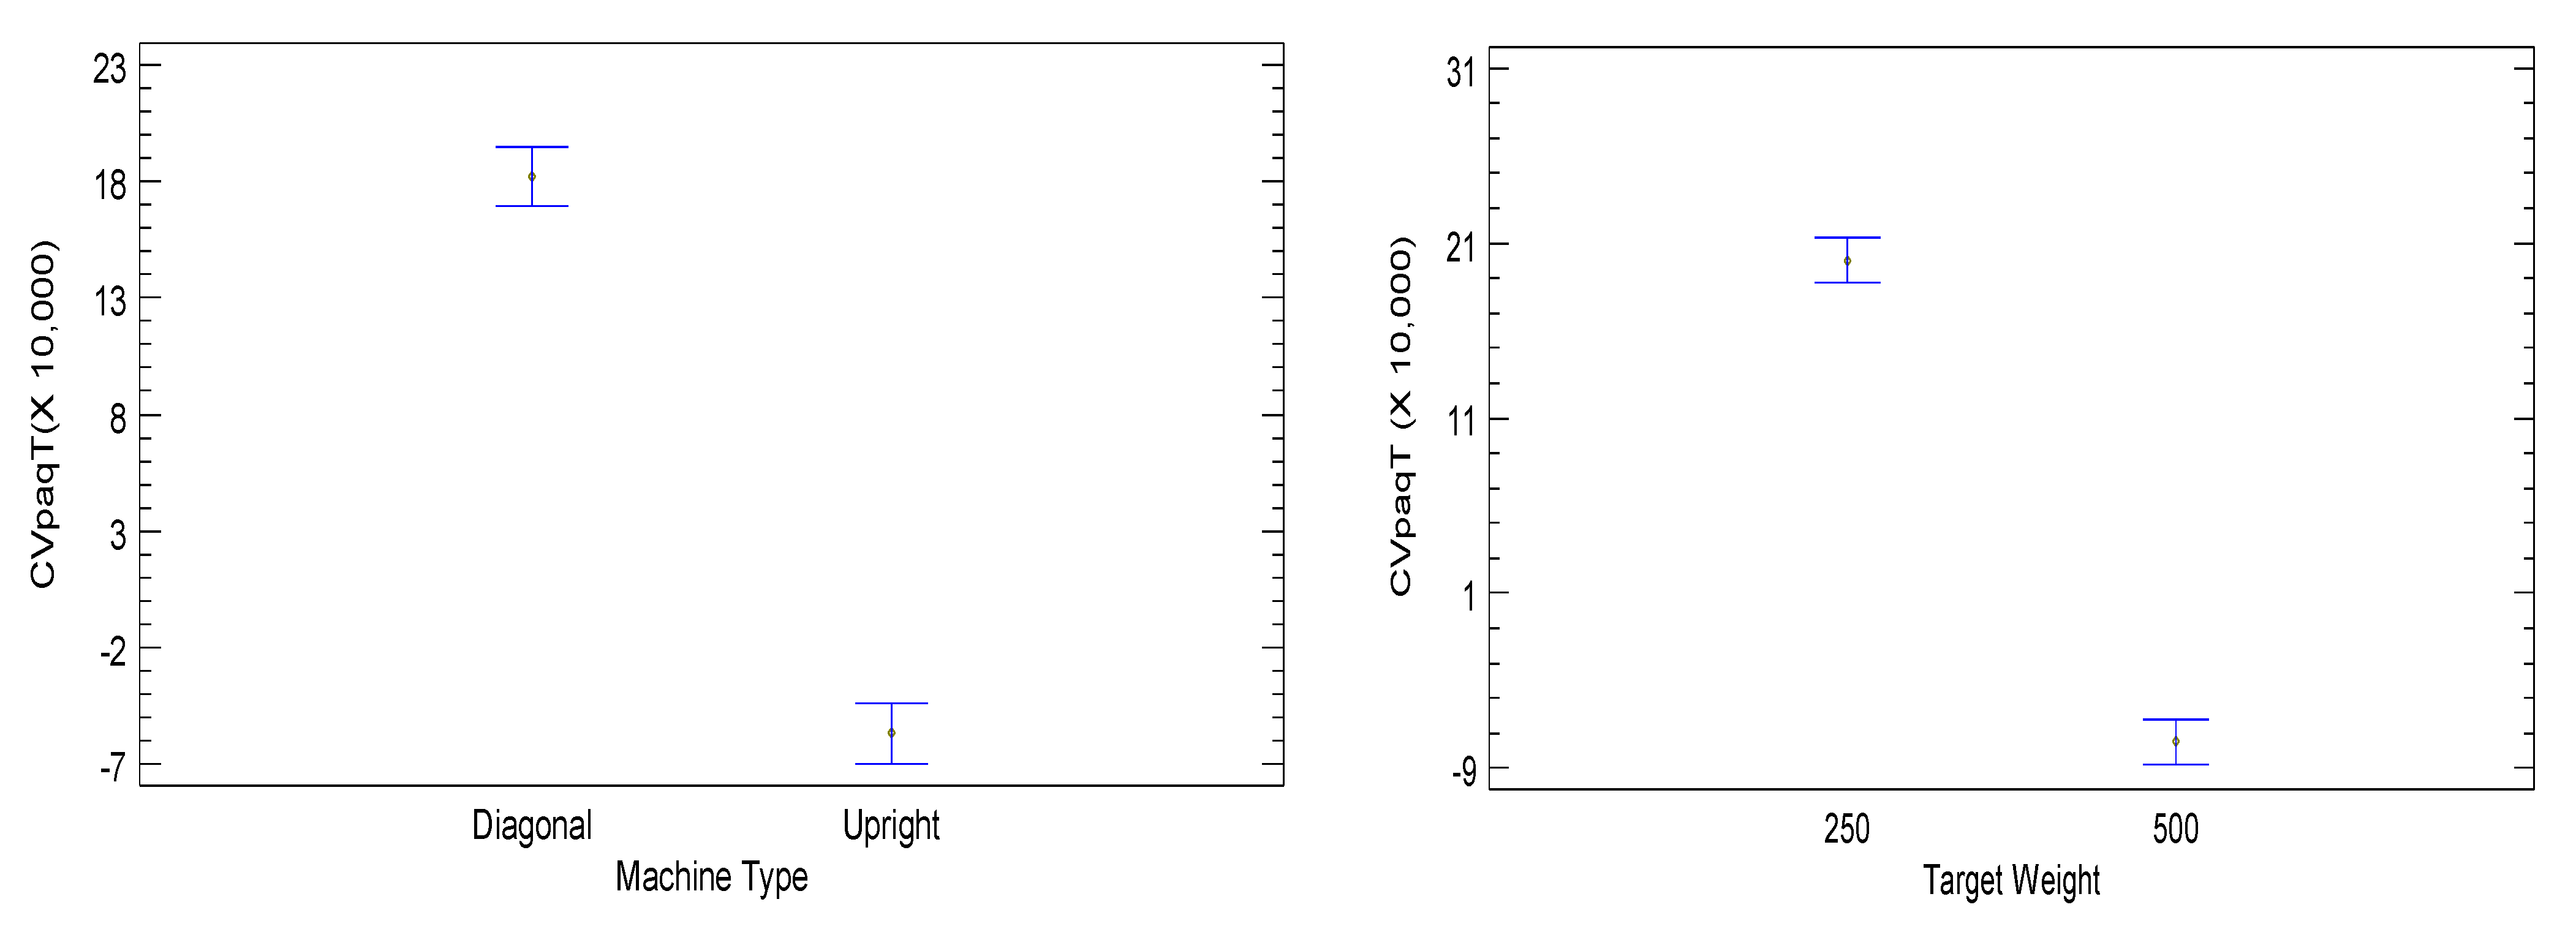
Figure 7 denotes the significant factors. When analyzing the interactions, significant
p-values were found for
Machine Type Target Weight,
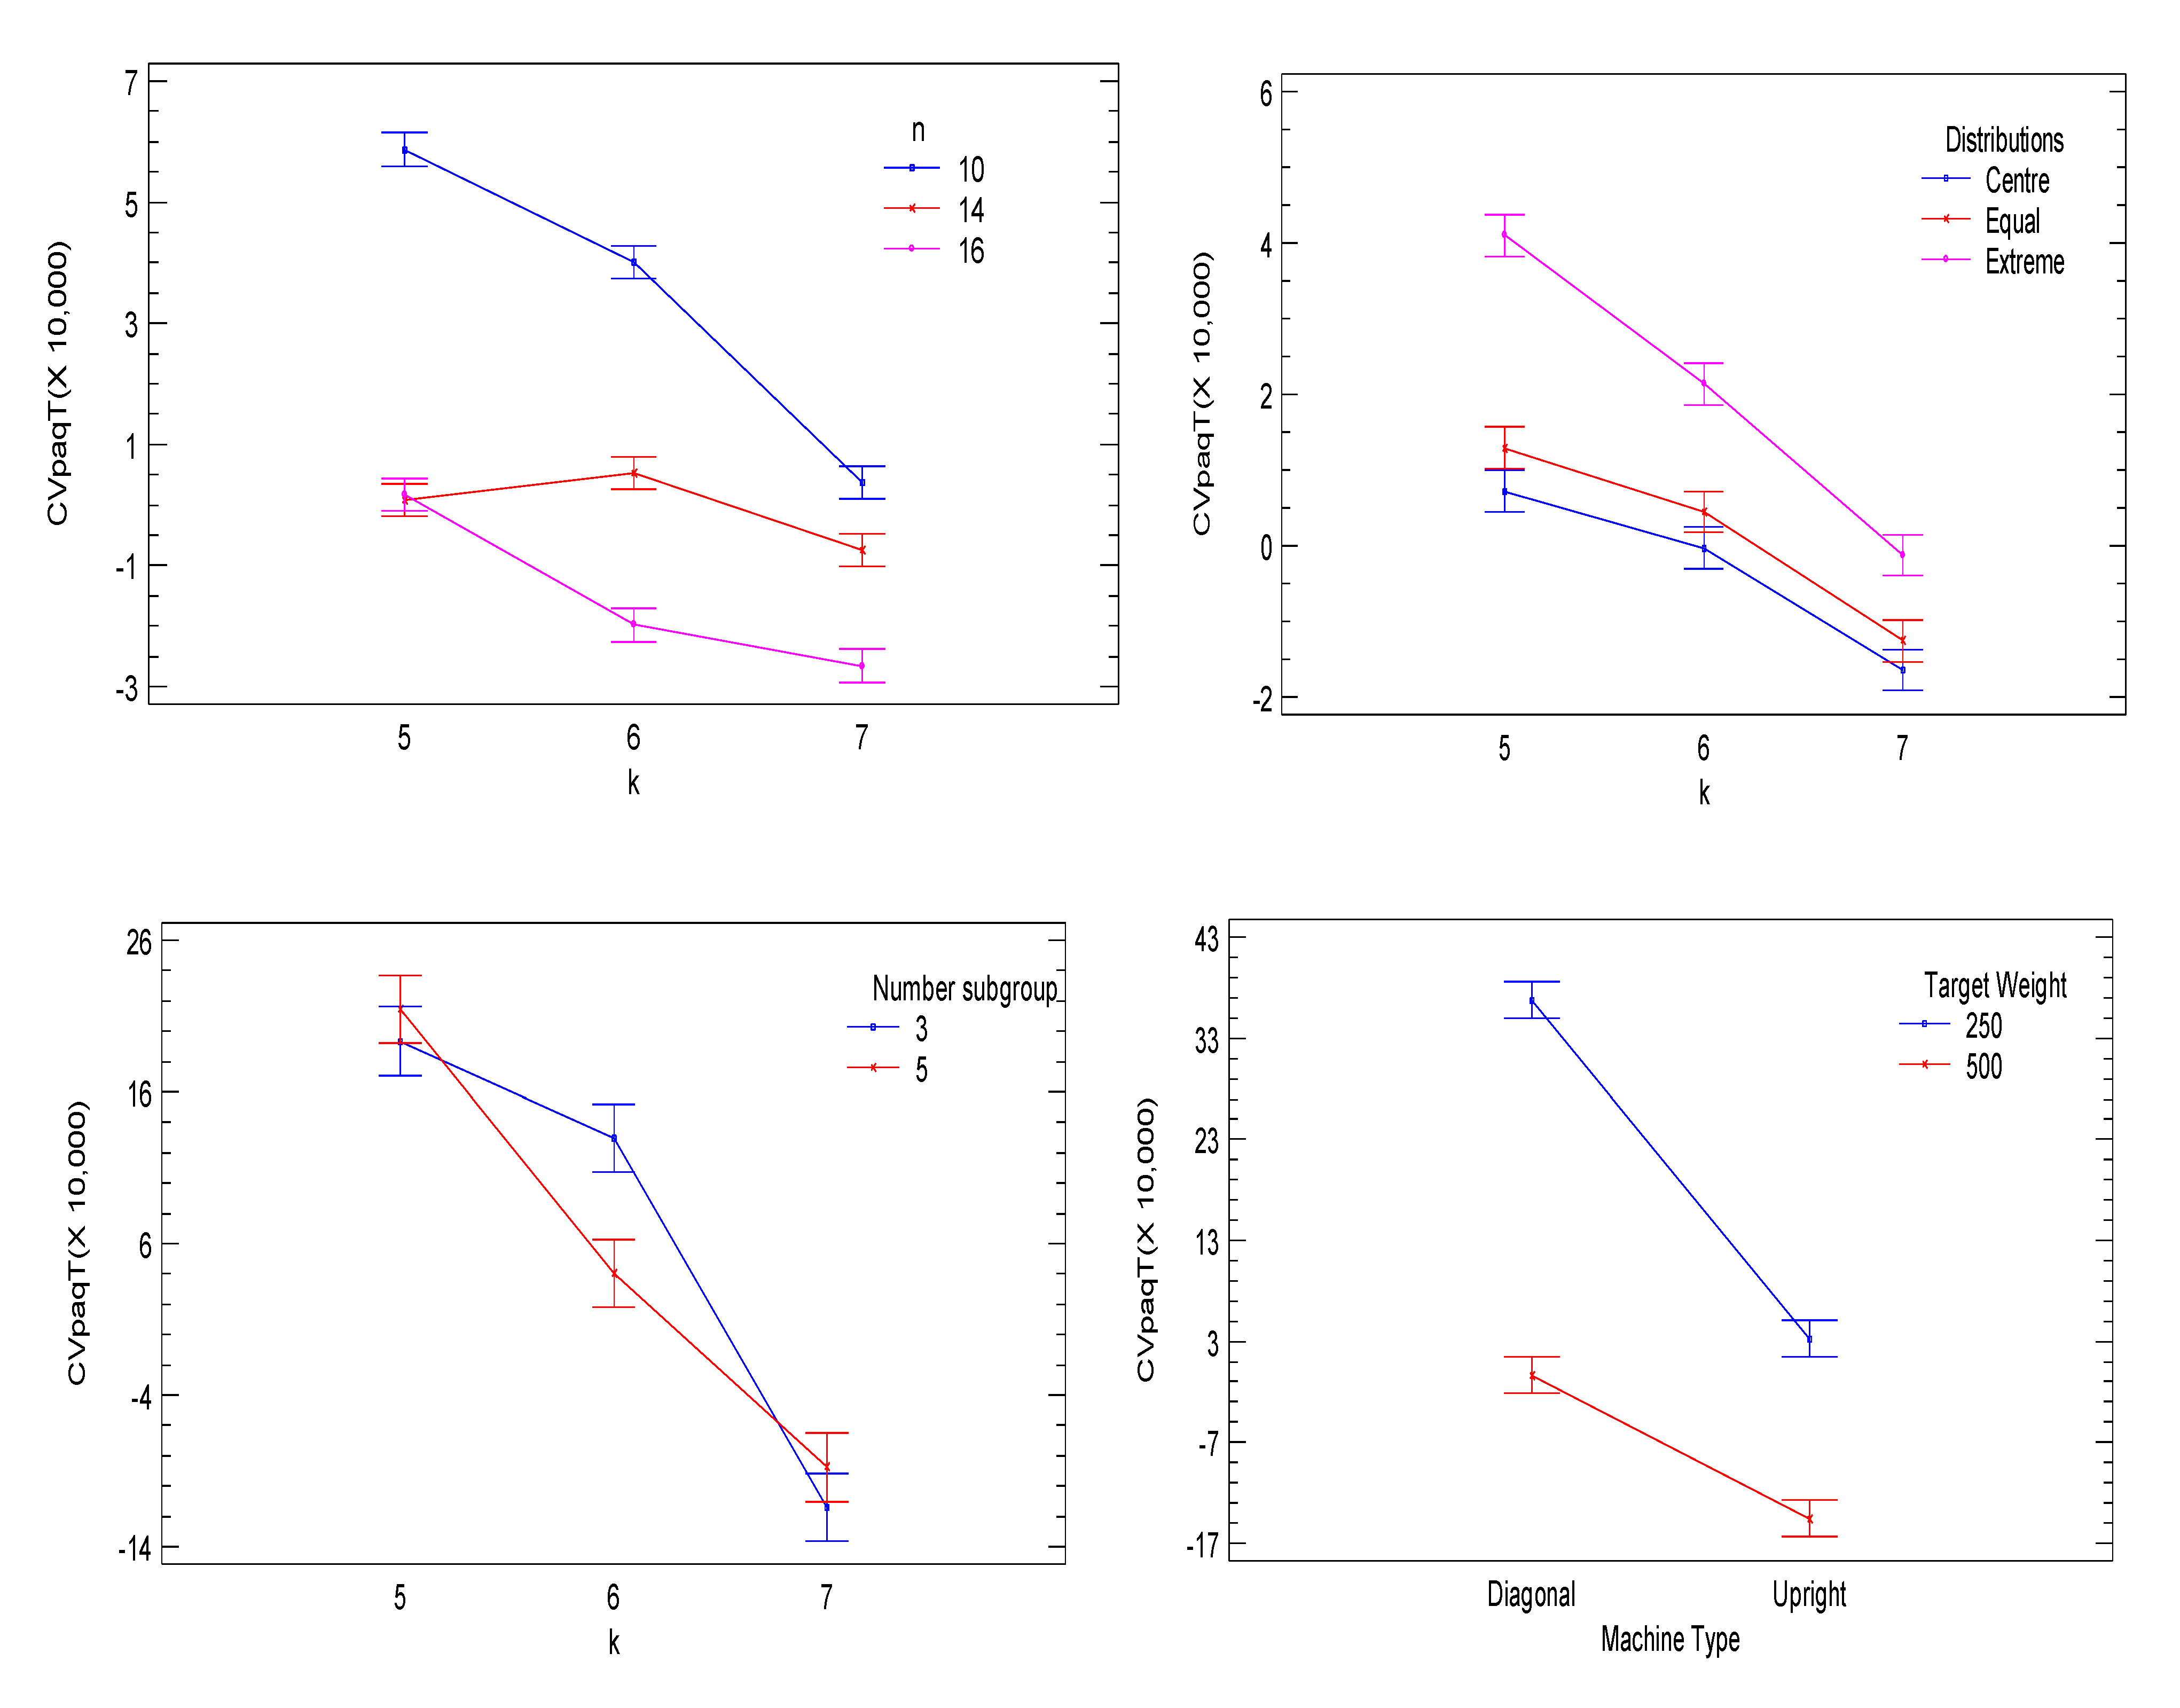
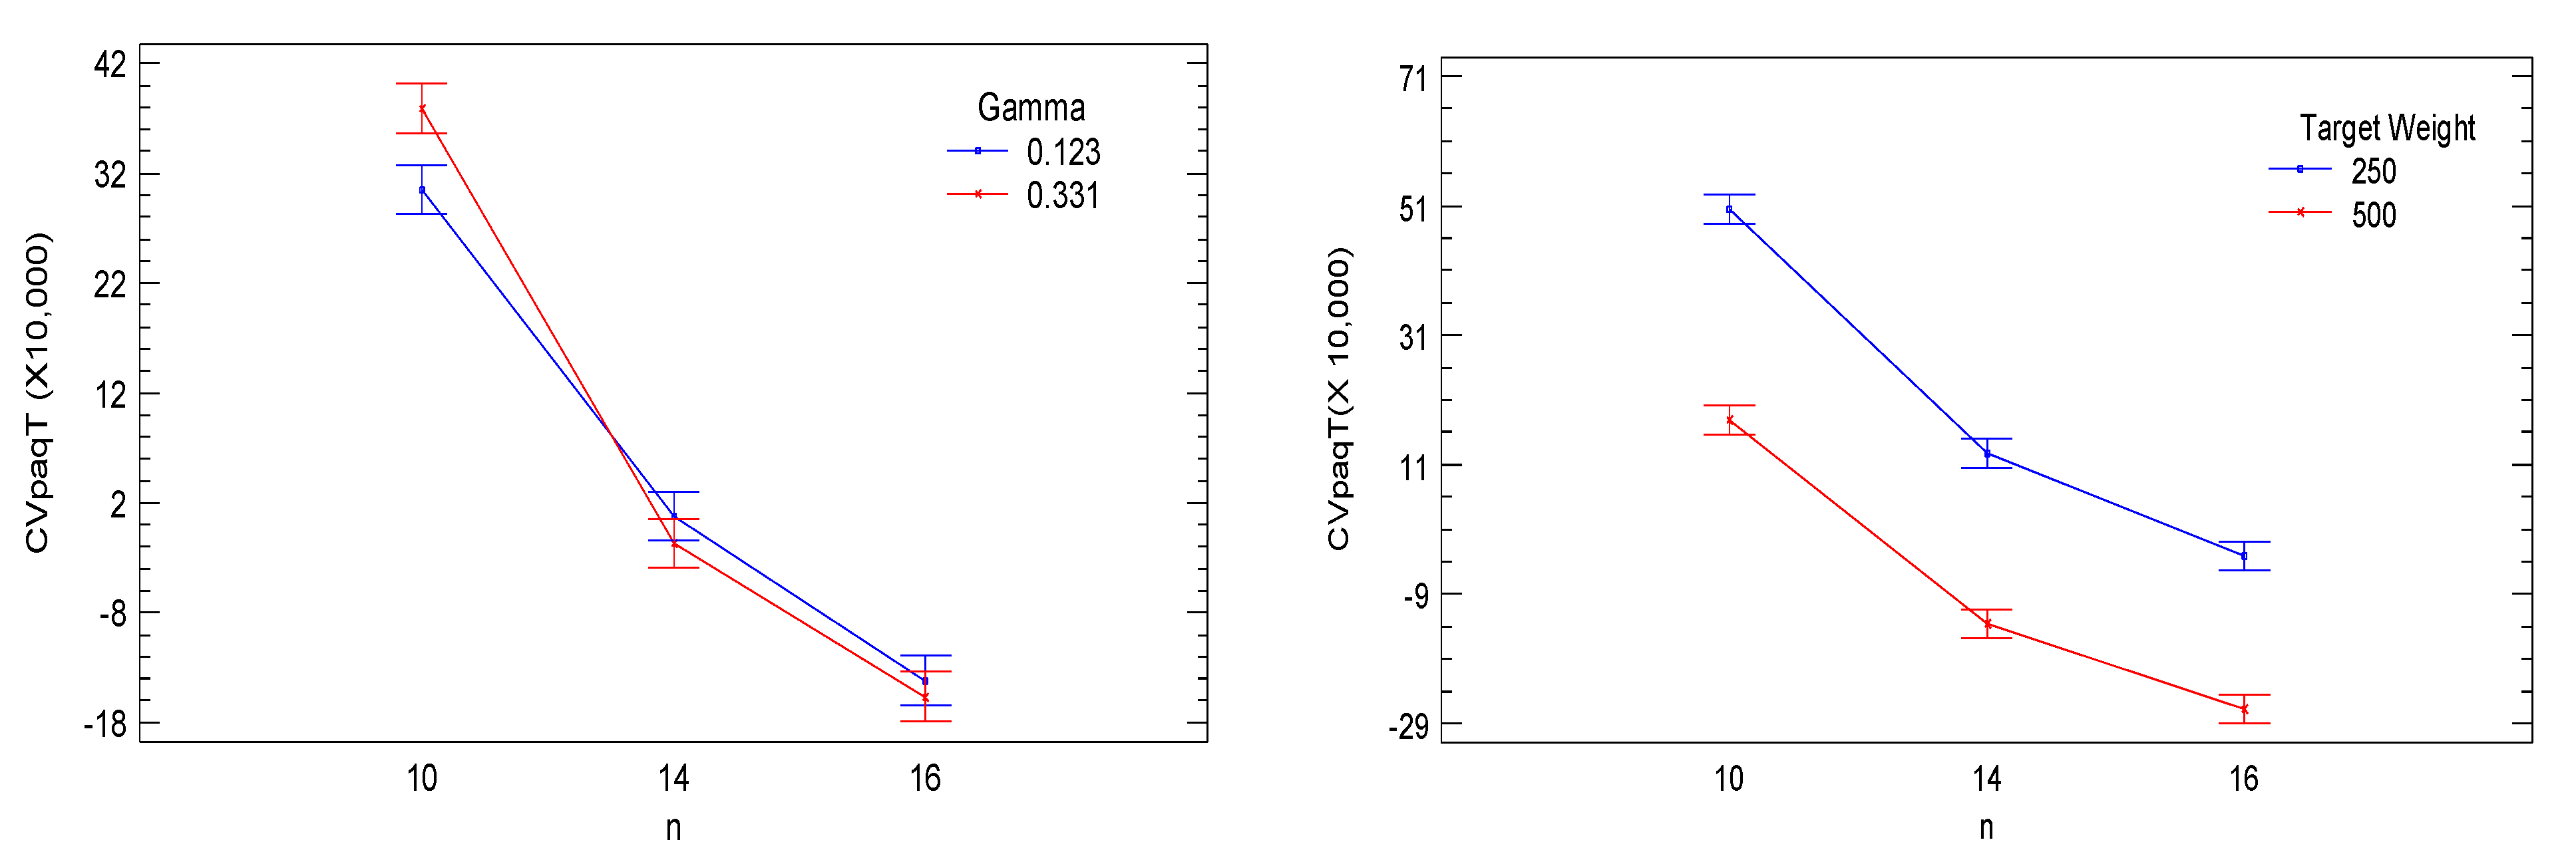
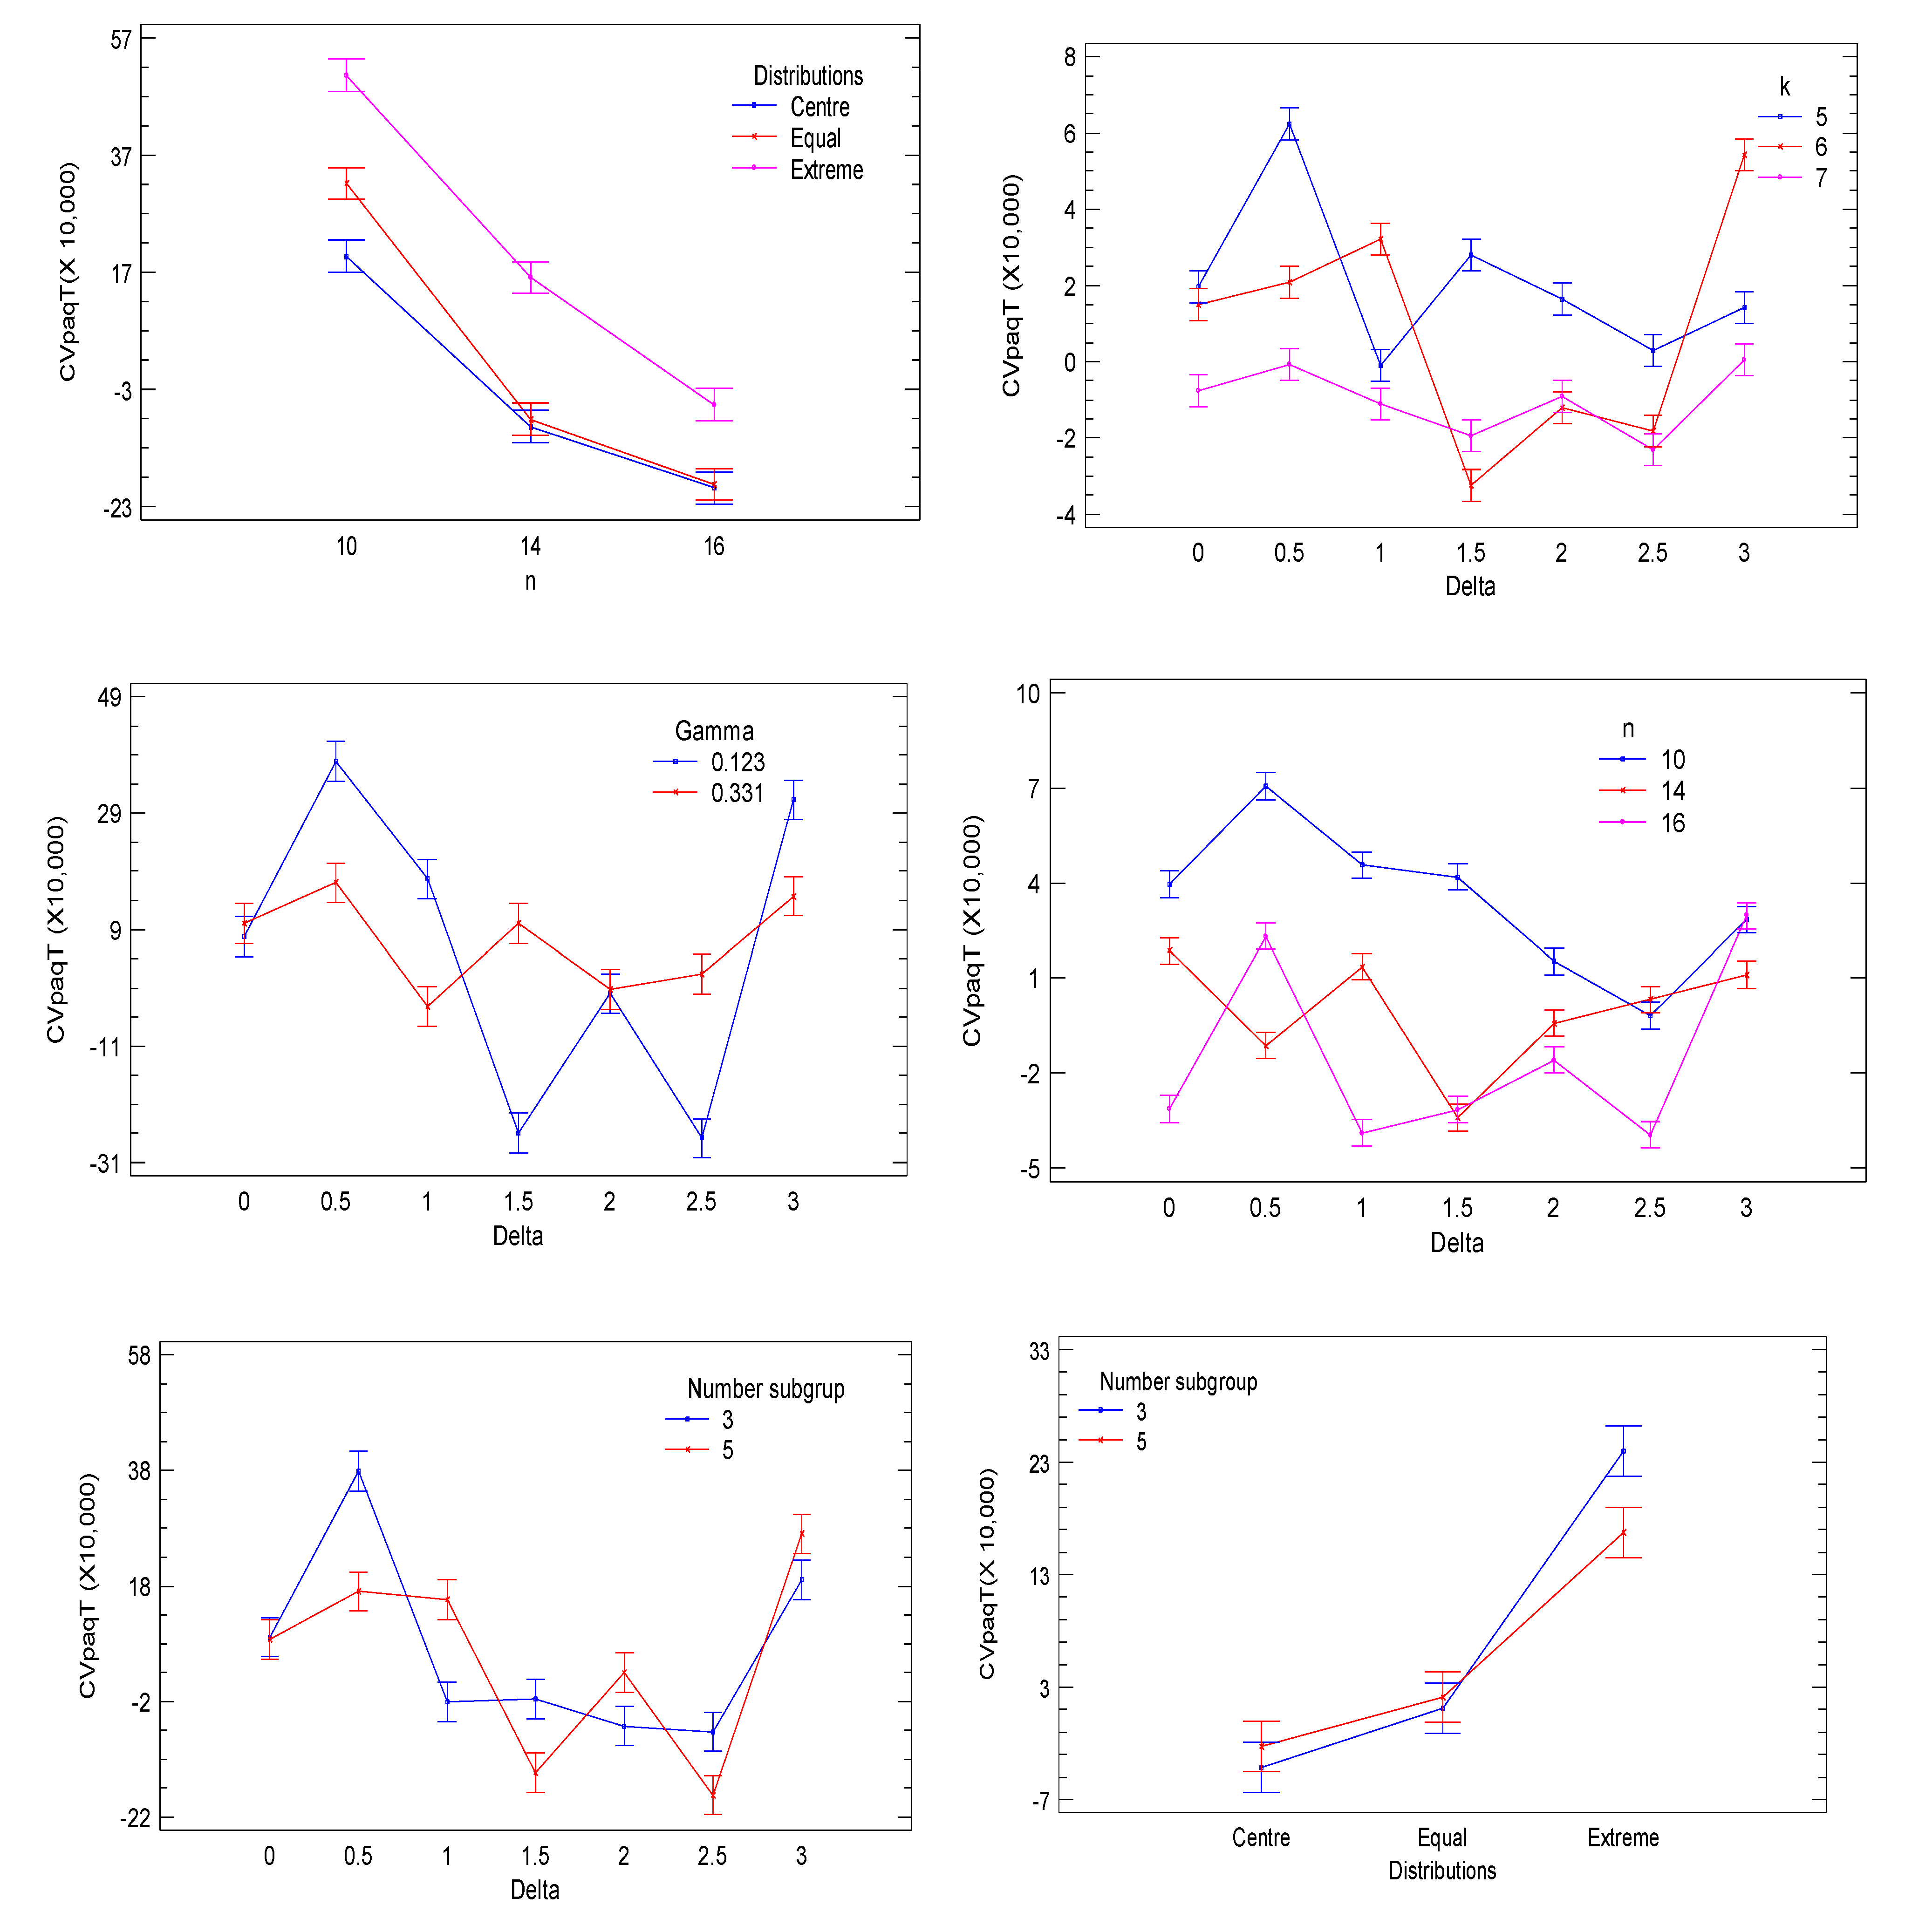
Machine Type· k, Target Weight·n, n·k, n k, n·Delta, n·Gamma, n·Hopper Distribution, k·Delta, k·Number of Subgroups, k·Hopper Distribution, Delta·Gamma, Delta·Number of Subgroups, and Number of Subgroups·Hopper Distribution.Based on the results of the significant interactions between the design factors (
Figure 8 and
Figure 9), we can infer that when comparing machine performances according to the number of weighing hoppers,
provides greater accuracy, and it is even better when the target weight is 500 g. For the number of hoppers combined, significant differences were found between the mean values of the coefficient of variation.
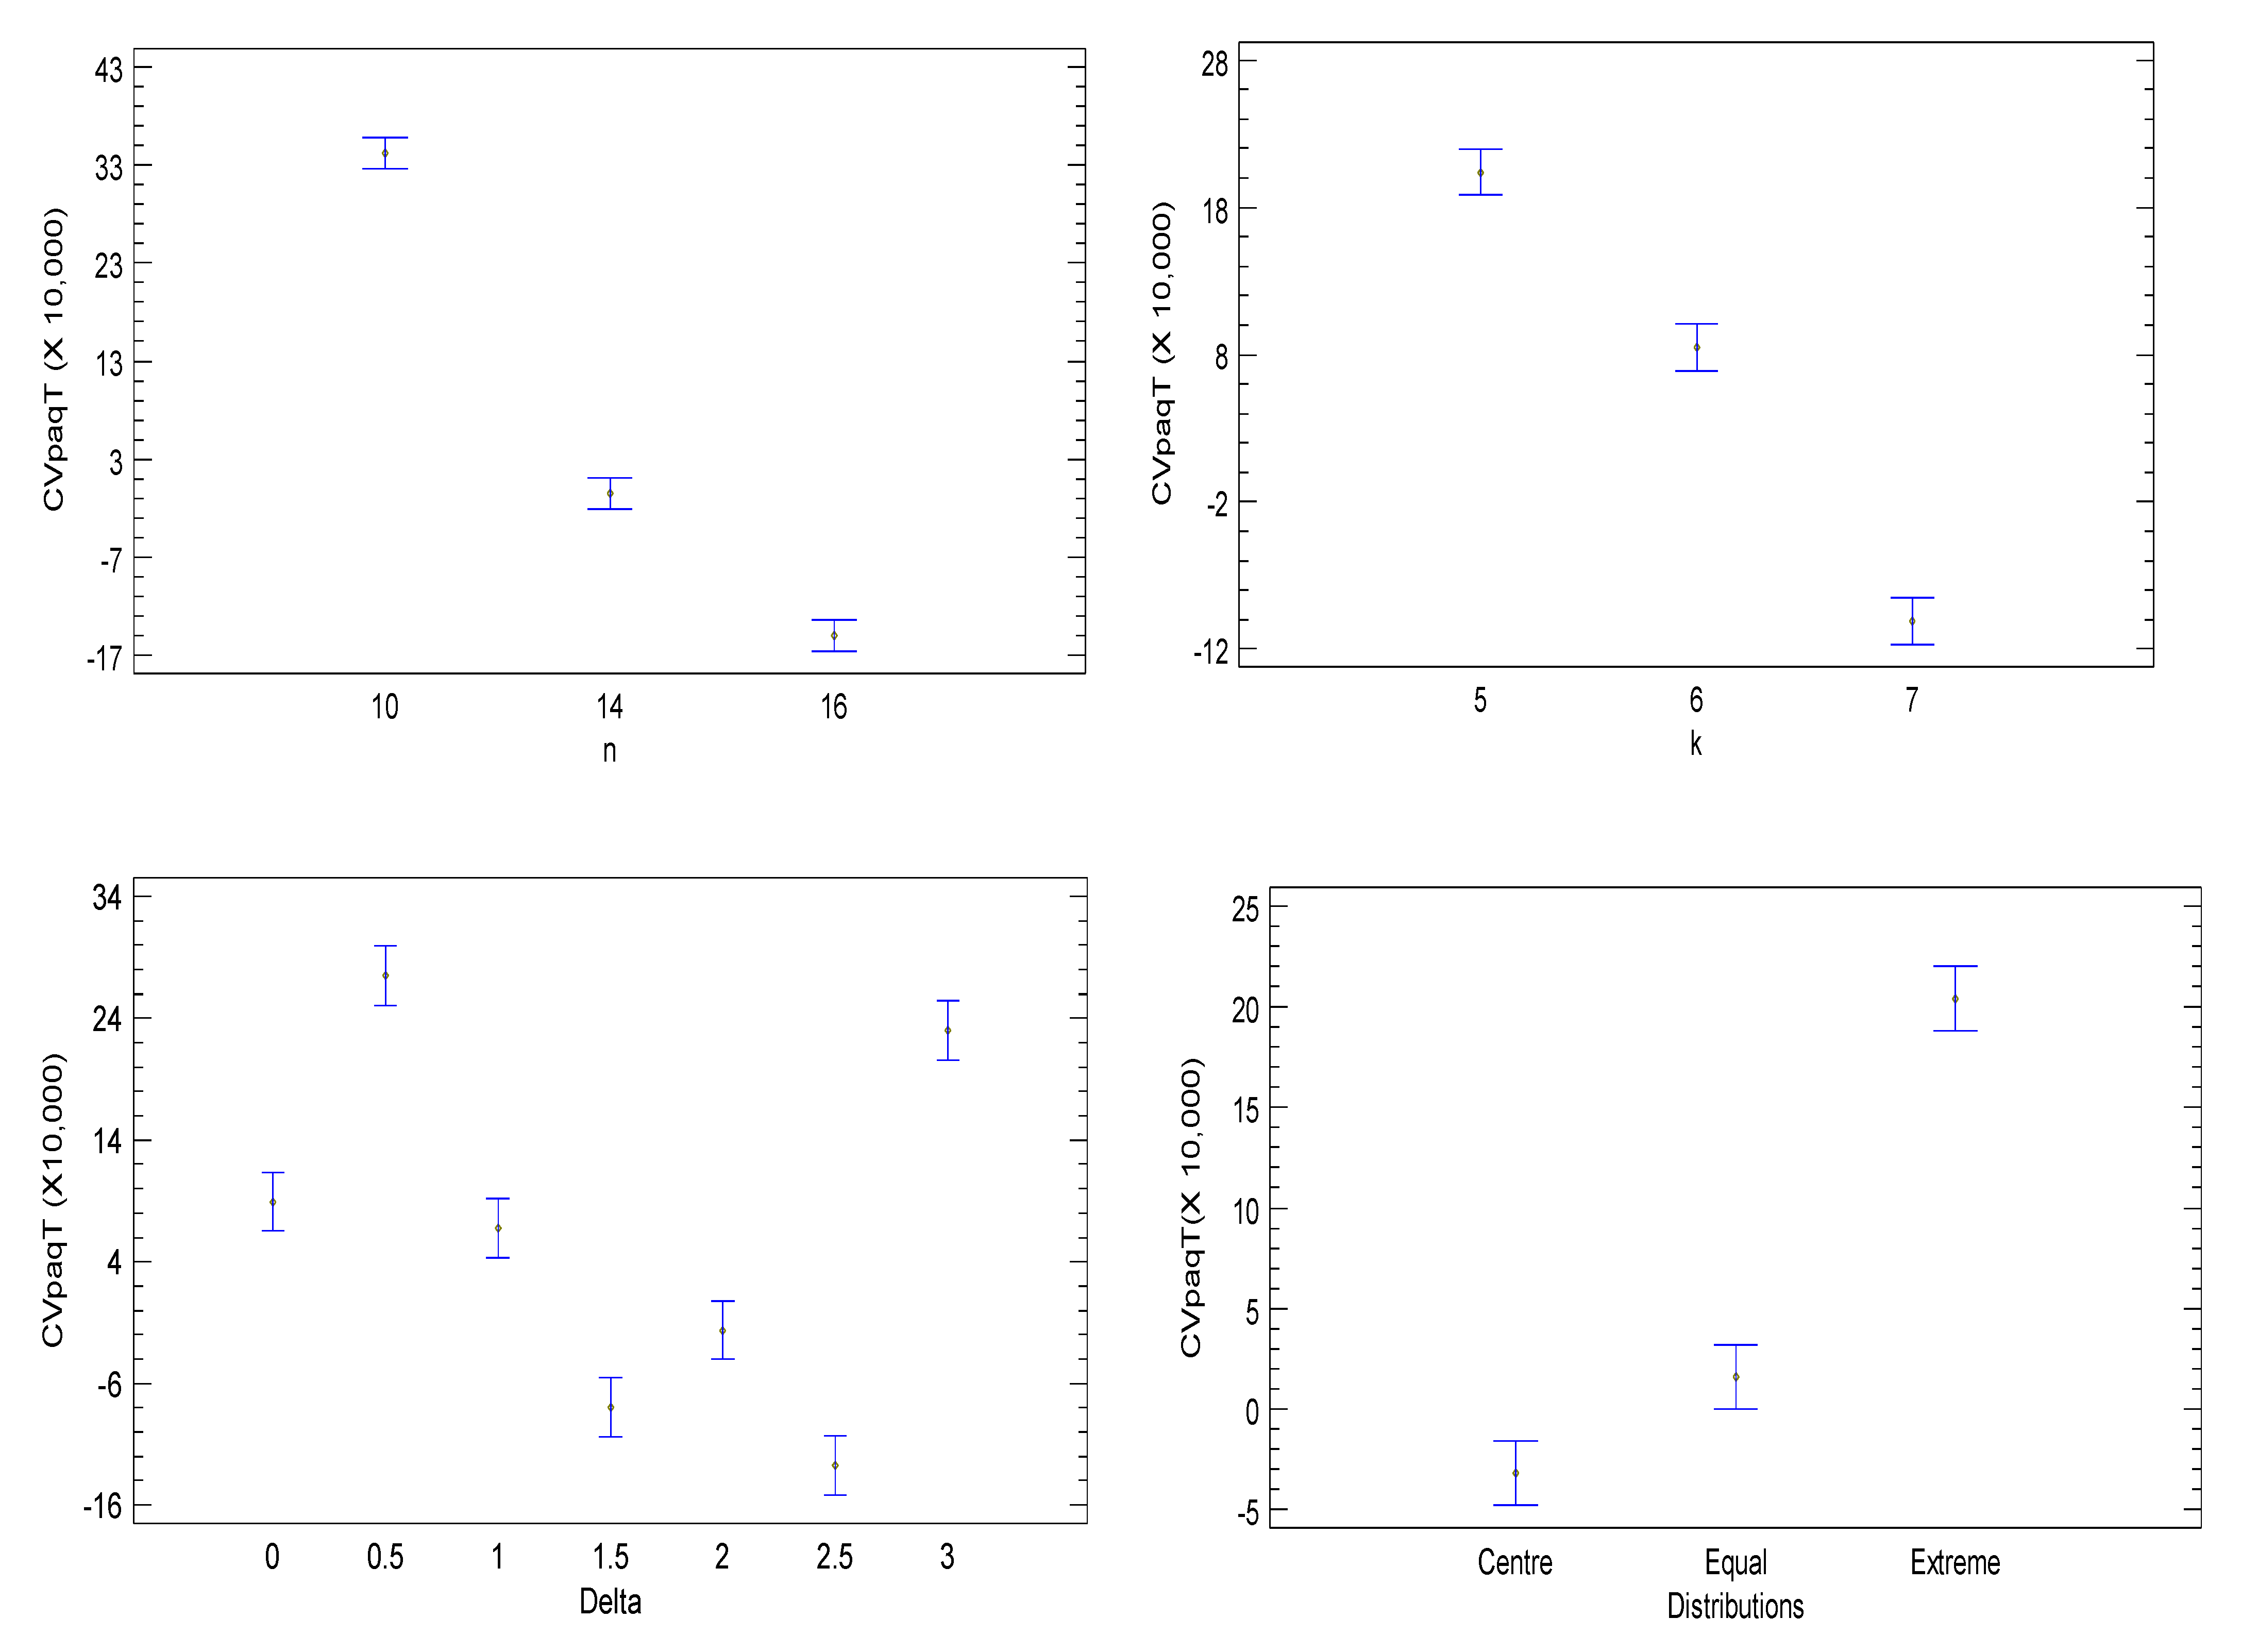
Figure 6 and
Figure 7 denote that for almost all interactions,
is the ideal number of hoppers to reach the target weight, except at
= 1.5, which suggests the use of six hopper combinations. Significant differences were also found for
, according to the target weight, exhibiting better behaviors if
. Regarding the
and
filling strategies, five subgroups provided better results at
. In addition, significant differences were found regarding the product type. In this aspect, better results were found when the proportionality coefficient is the lowest because lower values of
introduce less variability in the weights supplied to the weighing hoppers. Here, Fusilli (
) reported less process variability with an optimum point at
. Regarding the hopper distribution for each group, the central strategy denotes better behavior for both machines. Hence, we can conclude that the optimal process uses the diagonal machine at
,
,
, central distribution,
(
for Ravioli), and
.
8. Discussion
Multihead machines for their proper operation require two processes: packaging and machine configuration. The packaging process is linked to the problem of the backpack, that is, how to select the hoppers whose sum of the weights is greater and closest possible to the target weight. The new software, implemented for upright and diagonal double-layer machines with real weights according to the preliminary results (
Table 5 and
Table 6), shows that it is capable of responding to the problem by finding the optimal value in each package, complying with the requirements. On the other hand, the configuration of the machine is related to the amount of product that each weighing hopper receives, and in this sense, the filling strategies focus on evaluating the performance of the machine according to the amount of product supplied to each hopper. The S3 strategy provides each hopper with the same amount of product, while the S2 divides the hoppers into three groups and in the same way, S1 into five groups, which guarantees an unequal supply of product to each subset of hoppers. The preliminary results of
Table 5 and
Table 6 show that the configuration of the machines with the lowest performance in terms of the target weight and the variation of the process is the S3 strategy, which supplies the same quantity of product to all the hoppers; therefore, it is not taken into account for the design of the experiment (
Table 7). Likewise, in the configuration process, distribution strategies (central, equal, and extreme) were tested with the number of hoppers for each subset determined in each strategy S1 and S2, according to the group to which the largest number of hoppers is assigned. In the results of the design of experiments (
Table 8), it is observed that there is no difference between the strategies S1 and S2 (
p-value = 0.27); however, when contrasting them in the presence of other factors, for example, the number of hoppers to combine (k) and the delta value (δ), we find that in the presence of these factors, there is a significant difference between them. In the same sense, for the type of product, significant
p-values are found in the presence of a second factor such as the case of delta and the number of hoppers in the system. In accordance with the above, the type of product is an important factor to take into account when configuring the machine. When analyzing the interactions of the other factors with the delta value (δ) (
Table 8,
Figure 8 and
Figure 9), we find that the process presents less variability in values of δ = 1.5, which suggests a group of hoppers receive content that is far away plus 1.5 standard deviations of the average content according to the target weight and the type of product to be packed. Finally, the results suggest that for
k = 7, hopper combinations the packaging process achieves its optimal value.


