Article

Brain Metastasis Response to Stereotactic Radio Surgery: A Mathematical Approach

by
Odelaisy León-Triana
1,*,
Julián Pérez-Beteta 
1,
David Albillo
2,
Ana Ortiz de Mendivil
3,
Luis Pérez-Romasanta
4,
Elisabet González-Del Portillo
4,
Manuel Llorente
5,
Natalia Carballo
5,
Estanislao Arana
6,† and
Víctor M. Pérez-García
1,†
1
Mathematical Oncology Laboratory (MOLAB), Department of Mathematics and Instituto de Matemática Aplicada a la Ciencia y la Ingeniería, Universidad de Castilla-La Mancha, Avda. Camilo José Cela, 3, 13071 Ciudad Real, Spain
2
Radiology Unit, MD Anderson Cancer Center, 28033 Madrid, Spain
3
Department of Radiation Oncology, Sanchinarro University Hospital, HM Hospitales, 28015 Madrid, Spain
4
Radiation Oncology Service, Salamanca University Hospital, 37007 Salamanca, Spain
5
MD Anderson Cancer Center, 28033 Madrid, Spain
6
Fundación Instituto Valenciano de Oncología, 46009 Valencia, Spain
*
Author to whom correspondence should be addressed.
Joint senior authors.
Mathematics 2021, 9(7), 716; https://doi.org/10.3390/math9070716
Submission received: 9 February 2021 / Revised: 21 March 2021 / Accepted: 22 March 2021 / Published: 26 March 2021

Abstract

:
Brain metastases (BMs) are cancer cells that spread to the brain from primary tumors in other organs. Up to 35% of adult cancer patients develop BMs. The treatment of BM patients who have well-controlled extracranial disease and a small number of lesions consists of localized doses of radiation (stereotactic radio surgery (SRS)). Estimating prognosis among BM patients may allow treatments to be chosen that balance durability of intracranial tumor control with quality of life and the side effects of treatment. No mathematical model-based quantitative biomarkers have been determined for estimating prognosis. As a first step toward that goal, we describe a mathematical model of growth and response of brain metastasis to stereotactic radio surgery. The mathematical model incorporates some biological mechanisms involved in BM growth and response to SRS and allows the observed dynamics to be accurately described.

1. Introduction

Cancer is one of the world’s major health problems and is the second leading cause of death in industrialized countries. Vast resources have been devoted to cancer research in recent decades, which has resulted in only a small reduction in cancer death rates, of about 1–2% per year [1]. The question has been raised of whether different approaches, complementing classical ones, may be required to achieve more substantial breakthroughs in the war on cancer. One of these may be to increase the use of tools offered by applied mathematics. This is reflected in an increasing number of publications and reviews on the interface between mathematics and cancer [2,3,4,5].
Brain metastases (BMs) are cancer cells that have spread to the brain from tumors in other organs in the body. A substantial number, some 10–35% of adult cancer patients, develop BMs [6]. BMs are a major cancer-related complication and are 10 times more common than malignant primary brain tumors. The incidence of BMs is rising because improved systemic therapies control systemic disease and prolong survival but cross the blood–brain barrier (the highly selective membrane barrier that separates the circulating blood from the brain) too poorly to be able to control BMs.
The treatment of BM patients who have well-controlled extracranial disease and three or fewer measurable lesions typically consists of high localized doses of radiation (stereotactic radio surgery (SRS)) on the visible lesions and sometimes whole-brain radiotherapy (WBRT) to target potentially occult BMs. This therapeutic approach allows metastatic lesions to be controlled in many, but not all BM patients [7].
Applied mathematicians have studied different aspects of metastatic processes: the growth and distribution of untreated metastatic tumors [8,9,10,11,12,13], the extravasation process [14], cancer metastasis networks [15,16,17,18], the interaction between the primary and metastatic tumors [19] and therapeutic strategies minimizing the metastatic burden [20], to cite a few examples.
To our knowledge, few studies have considered the mathematical modeling of BM growth and response to RT [21,22]. This is a situation of interest since the tumor’s response to radiation therapy (RT), either alone or in combination with other treatments, has been thoroughly studied in other brain tumors such as glioblastoma (see e.g., [23,24,25,26,27,28,29,30,31,32]) or low-grade glioma (e.g., [33,34,35,36,37,38]).
Very little is known of how to describe mathematically the dynamics of metastatic tumors in the brain and their response to therapies. BMs as seen in MRIs are composed of several compartments: the contrast-enhancing tumor, the necrotic core and an infiltration component.
Estimating prognosis among patients with BMs is clinically relevant, as it may allow clinicians to recommend treatments that balance durability of intracranial tumor control with quality of life and the side effects of treatment. The prognostic index that has become most prominent is the diagnosis-specific Graded Prognostic Assessment (GPA) [39]. This index includes prognostic factors that depend on the type of cancer, age, Karnofsky Performance Scale score, extracranial disease status, number of BMs, etc. For the case of primary brain tumors, mathematical modeling has helped in defining biomarkers of prognosis [40,41,42,43] and response to therapies [44,45,46].
As a first step in constructing prognostic and response biomarkers in BMs, we developed a minimal mathematical model able to describe the longitudinal dynamics of BMs. This was done using BM patient imaging data to feed ordinary differential equations (ODEs) in biologically grounded tumor growth models. First, the extent to which these models could describe the dynamics of untreated BMs was analyzed. Next, the dynamics of response to radiosurgery over time was studied when death mechanisms and damaged cell compartments were included.
The remainder of the paper is organized as follows: First, Section 2 sets out our mathematical model and describes the patient cohort used to validate it and the methodologies used to process the imaging data. Next, Section 3 describes the results. Finally, Section 4 discusses the implications of our study and summarizes our conclusions.

2. Mathematical Model and Methods

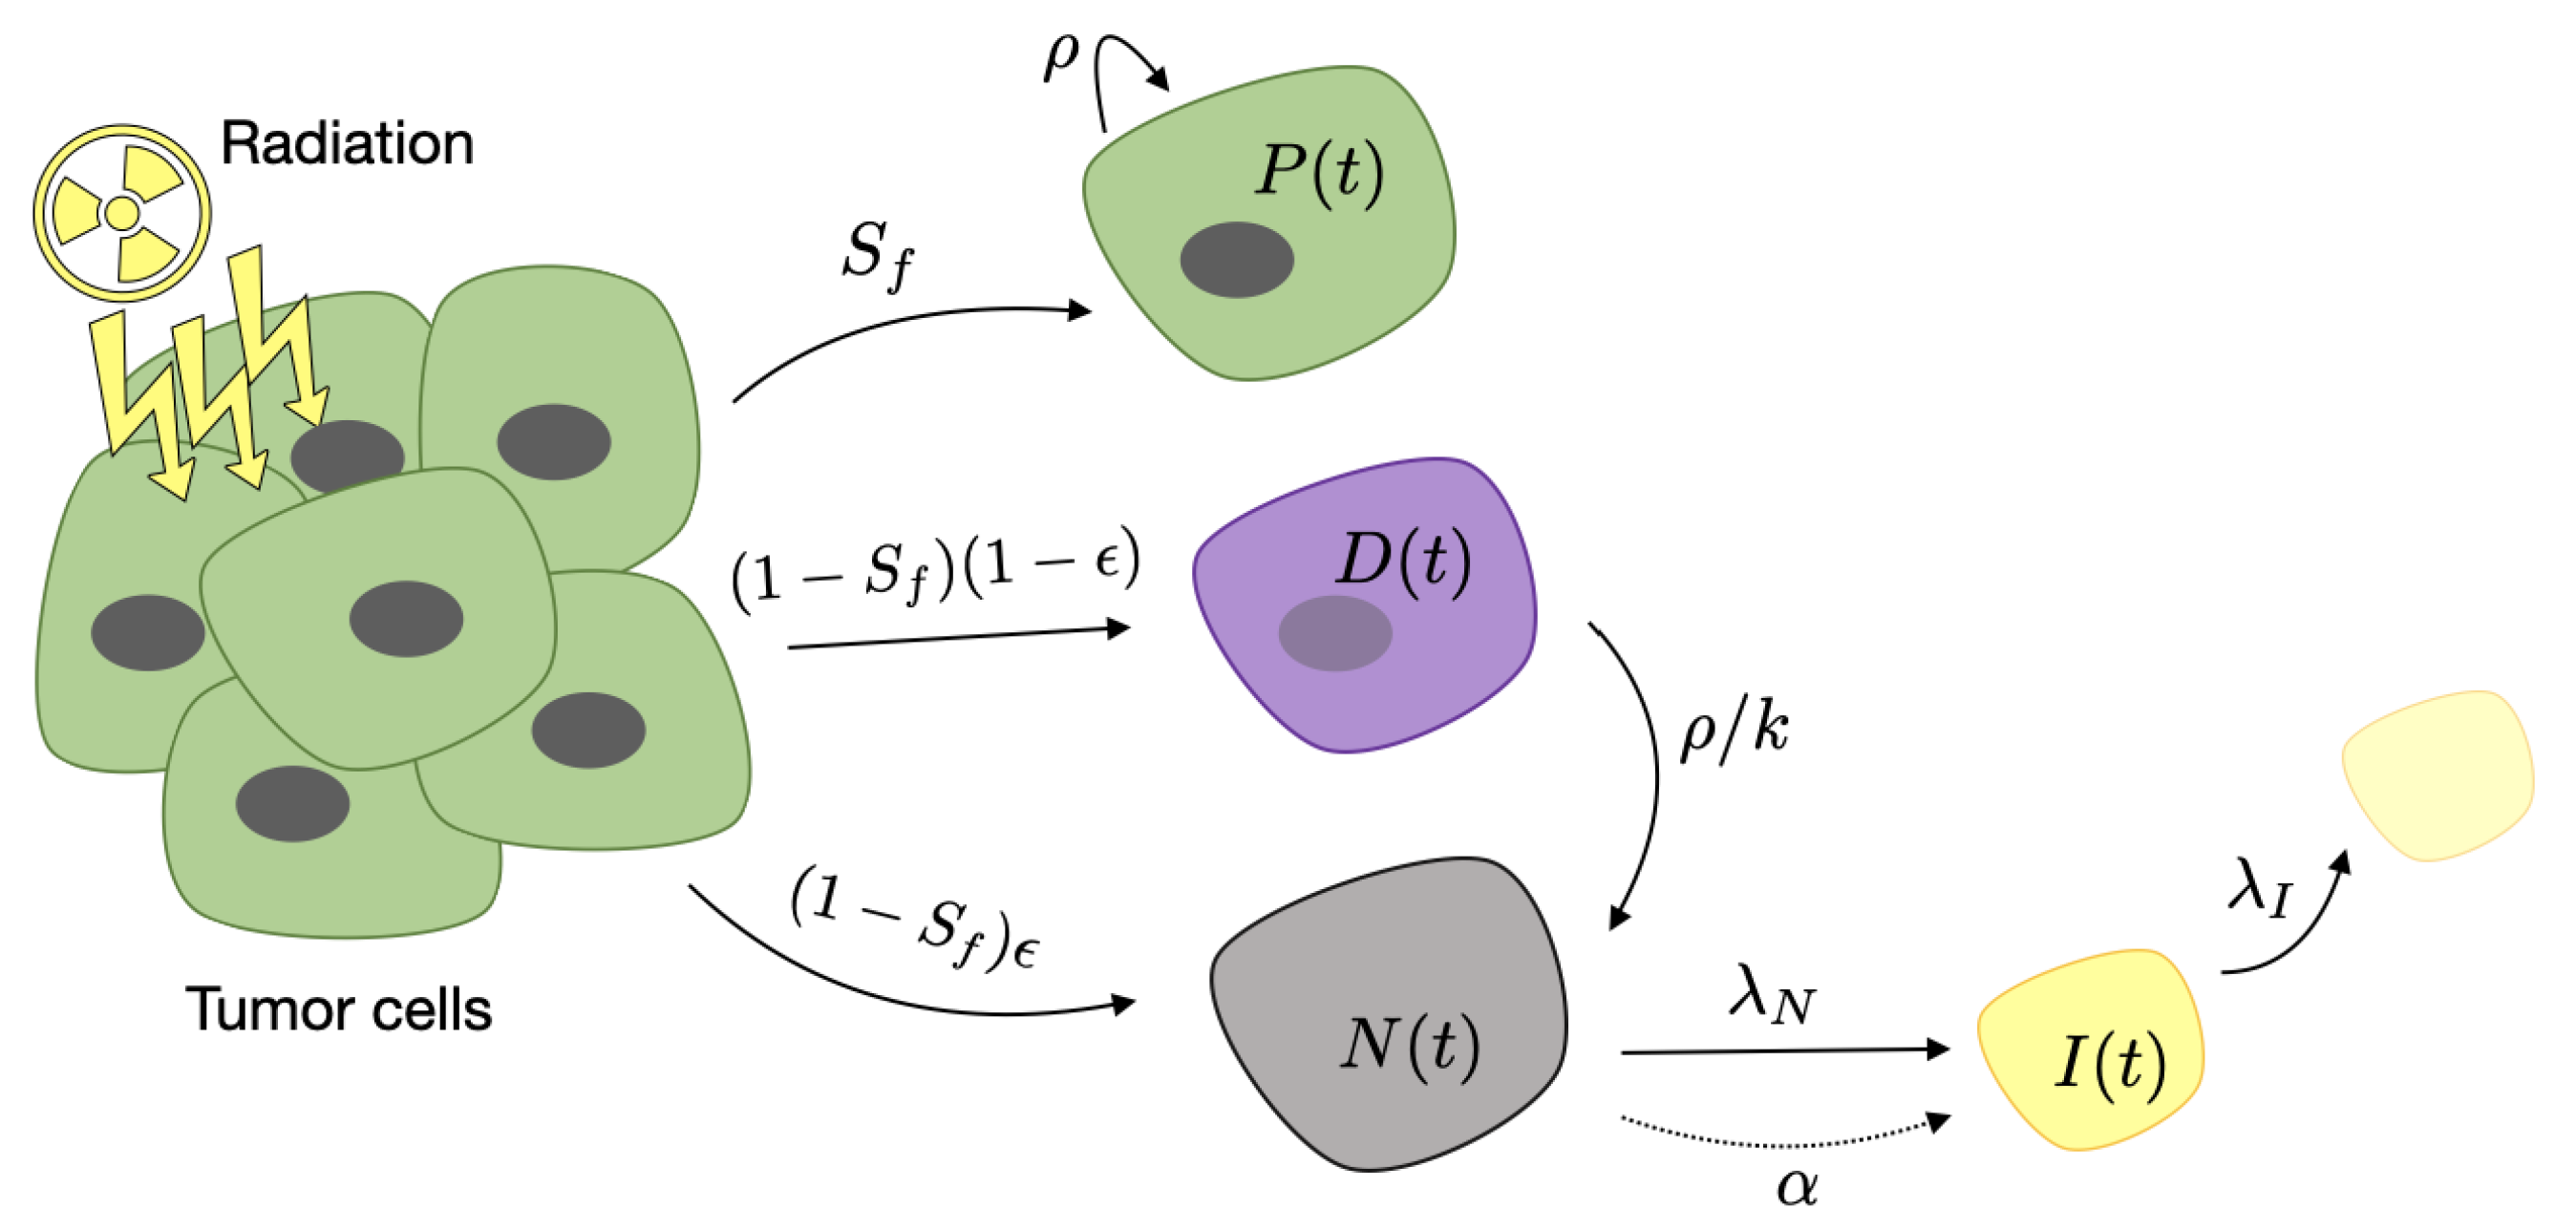
2.1. Mathematical Model of Response to Radiosurgery

Our mathematical model to describe growth and response to therapy of brain metastases is based on a set of ordinary differential equations for the different cellular compartments involved in a simplified description of the tumor growth dynamics. The first will be the proliferating tumor cells P ( t ) . Since BMs are often small tumors that are detected at an early phase of growth, far from the brain’s carrying capacity, the number of proliferating cancer cells can be described by an exponential model of the form
d P d t = ρ P .
In Equation (1), P ( t ) represents the number of proliferating cancer cells at time t, and ρ represents the rate of proliferation. A recent paper [47] has shown that the growth dynamics of brain metastasis could be better described by a superlinear growth law. For the sake of simplicity, in this paper we will keep the simpler and more classical growth law given by Equation (1).
Stereotactic radiosurgery is a highly precise form of radiation therapy that lethally damages a fraction 1 S f of the irradiated proliferating cancer cells. Lethal damage, caused by high doses of radiation, cannot be repaired and occurs via different pathways. Here we will account for the two most important pathways in the response to SRS. The first process is fast and leads to a fraction ϵ of lethally damaged cells being incorporated directly into the necrotic cell ( N ( t ) ) compartment. The second process leads to a population D ( t ) of lethally damaged cells that may undergo one or more divisions before dying by mitotic catastrophe [48]. The evolution of this cellular compartment is given by the equation
d D d t = ρ k D ,
where k is the average number of mitosis cycles completed before death. In practice, k / ρ provides a, typically long, time scale for the death of this population of damaged cells. This type of model have been found to provide a good description for the response of low-grade glioma [35] and prostate cancer [49] to radiation therapy.
There is evidence in the literature that SRS destroys tumor vascular beds, thereby deteriorating the tumor microenvironment and leading to indirect tumor cell death [50]. These phenomena can produce regions of hypoxia, tumor necrosis and massive release of tumor antigens, elevating antitumor immune response in a short period of time. Furthermore, tumor hypoxia may persist after vascular injury caused by SRS, and both oxygenated and hypoxic cells are ablated by high-dose radiation [51]. This fact, together with the impossibility of accounting for the number of hypoxic cells in brain metastases through MRI, motivates the non-inclusion of this population within the mathematical model. Thus, we will also account for a population of immune cells I ( t ) present in the tumor, whose dynamics would be governed by the equation
d I d t = α N λ I I .
In Equation (3), α is a stimulation parameter that accounts for the immune system activation by the presence of necrosis, and λ I is the decay rate of the immune activation.
Finally, the dynamics of the necrotic cell (or necrosis) compartment will be governed by the equation
d N d t = ρ k D λ N N I .
Thus, we will describe necrosis dynamics by the contribution of damaged cells through mitotic death and the interaction with the immune system, which in turn is activated by the release of a variety of pro-oxidant and proinflammatory cytokines such as tumor necrosis factors [52]. The first term in Equation (4) corresponds to the contribution of damaged cells, and the second describes the elimination of necrotic cells by the action of immune cells. This process is modulated by the constant λ N .
As to the initial data, the tumor is assumed to be composed mostly of proliferating cells before treatment. SRS is performed at a given time t 0 on a tumor cell population T ( t 0 ) . As stated above, a fraction of tumor cells S f will suffer either no damage or only sublethal damage and will remain viable. A further fraction ( 1 S f ) will receive lethal damage of which a fraction ϵ will die on a short time scale (i.e., days), and the remainder will move into the compartment of lethally damaged cells. This means that
P ( t 0 ) = S f T ( t 0 ) ,
D ( t 0 ) = ( 1 S f ) ( 1 ϵ ) T ( t 0 ) ,
N ( t 0 ) = ( 1 S f ) ϵ T ( t 0 ) ,
I ( t 0 ) = 0 ,
where S f and ϵ ( 0 , 1 ) . Figure 1 summarizes the different compartments included in the model and the effect of radiosurgery. In this paper, we assumed the pretreatment number of immune cells to be very small. Intratumoral areas in lung cancer brain metastases have been reported to contain low numbers of inflammatory cells [53], high levels of immunosuppressive molecules [54] and a suppressed immune microenvironment [55].
In addition to damaging cancer cells, SRS damages healthy tissue cells located in the field of the ionizing radiation. In spite of the increasing spatial precision of current radiosurgery techniques, radiation necrosis of normal cells is a frequent complication. Since brain tissue renewal occurs on very long time scales of many months, this damage appears typically more than a year after SRS [56]. This effect has nothing to do with tumor recurrence but can be confused with it on imaging because of the increase in the inflammatory compartment. To account for that, we will include an explicit additional source term in the necrotic compartment h ( t ) in Equation (4):
d N d t = ρ k D λ N N I + h ( t ) .
Note that T ( t ) = P ( t ) + D ( t ) + N ( t ) + I ( t ) is a measure of the number of cellular elements in the tumor and its environment. We assumed it to be related to the observed tumor volume, which appears in MRIs as a combination of active areas ( P + D + I ) plus a necrotic component (N).
The model was solved and fitted to the available longitudinal volumetric data (see below) using ode45 and fmincon functions included in the scientific software package MATLAB (R2019b, The MathWorks, Inc., Natick, MA, USA). We performed a heuristic procedure to validate that the fitted model attained a global minimum on the set of parameters estimated (see Appendix A for a particular example). All parameters were fitted for each metastasis individually, even in the case of lesions belonging to the same patient.

2.2. Patients

Patients included were participants in the study METMATH (Metastasis and Mathematics), a retrospective, multicenter, nonrandomized study approved by the Ethics Committees of Instituto Valenciano de Oncología (code 2011-46, 2011), Hospitales HM (code 18.09.1303-GHM, 2018) and Hospital Universitario Ramón y Cajal (code METMATH, 2018). We reviewed the METMATH records to look for patients satisfying the following inclusion criteria: patients diagnosed with brain metastasis of a primary lung cancer that had undergone at least a T1-weighted MRI examination with contrast before SRS and at least two T1-weighted MRIs after SRS. The time interval between the diagnostic MRI and SRS had to be at most 2 weeks. Patients who received whole-brain radiation therapy within 4 months before SRS, or during the followup period, were excluded. Patients who received surgery were also excluded. In total, 45 patients satisfied the inclusion criteria. Patients with more than one treated brain metastasis were analyzed; 32 patients had only one BM, 11 patients had two BMs and 2 patients had three BMs. Finally, 60 brain metastases were included. Median patient age was 60 years (range 43–80) and sex was 59% male, 41% female.
The dose and fractionation schedule was chosen at the discretion of the treating radiation oncologists and performed using γ -rays. A total of 46 lesions were treated with a single dose (range 17–24 Gy), six lesions with three dose fractions (range 5.5–8.8 Gy) and eight lesions received between four and six dose fractions (range 4–9.5 Gy). The mean follow-up period of the patients studied was 11 months (range 3–30 months).
Contrast-enhanced T1-weighted sequence was gradient echo transformed using 3D spoiled-gradient recalled echo or 3D fast-field echo after intravenous administration of a single dose of gadobenate dimeglumine (0.10 mmol/kg) with a 6–8-min delay.
MRI studies were performed in the axial or coronal plane with either a 1.5 T Siemens scanner (259), a 3 T Philips scanner (45) or a 1 T Philips scanner (13). Imaging parameters were no gap, slice thickness of 0.5–2.0 mm (mean 1.1 mm), 0.4–1.1 mm (mean 0.6 mm) resolutions in the x and y planes and 0.6–2.0 mm spacing between slices (mean 1.5 mm).

2.3. Tumor Segmentation

Brain metastasis T1-weighted images were collected in DICOM format and analyzed by the same image expert (OLT, 2 years of experience on tumor segmentation) and reviewed by either a senior radiologist (EA) or an image expert with 5 years of expertise in tumor segmentation (JPB). The tumor volume for each brain metastasis was defined on gadolinium-enhanced magnetic resonance imaging (T1Gd-MRI) as the contrast-enhancing (CE) compartment of the tumor combined with the central non-enhancing (non-CE) compartment enclosed by the contrast (the latter usually represented necrosis).
Segmentation was performed by importing image files into the scientific software package MATLAB (R2019b, The MathWorks, Inc., Natick, MA, USA). Images were manually placed in a 3D box and then semi-automatically delineated using a gray-level threshold chosen to identify the contrast-enhancing volume. Segmentation was corrected manually slice by slice as described in [45].

3. Results

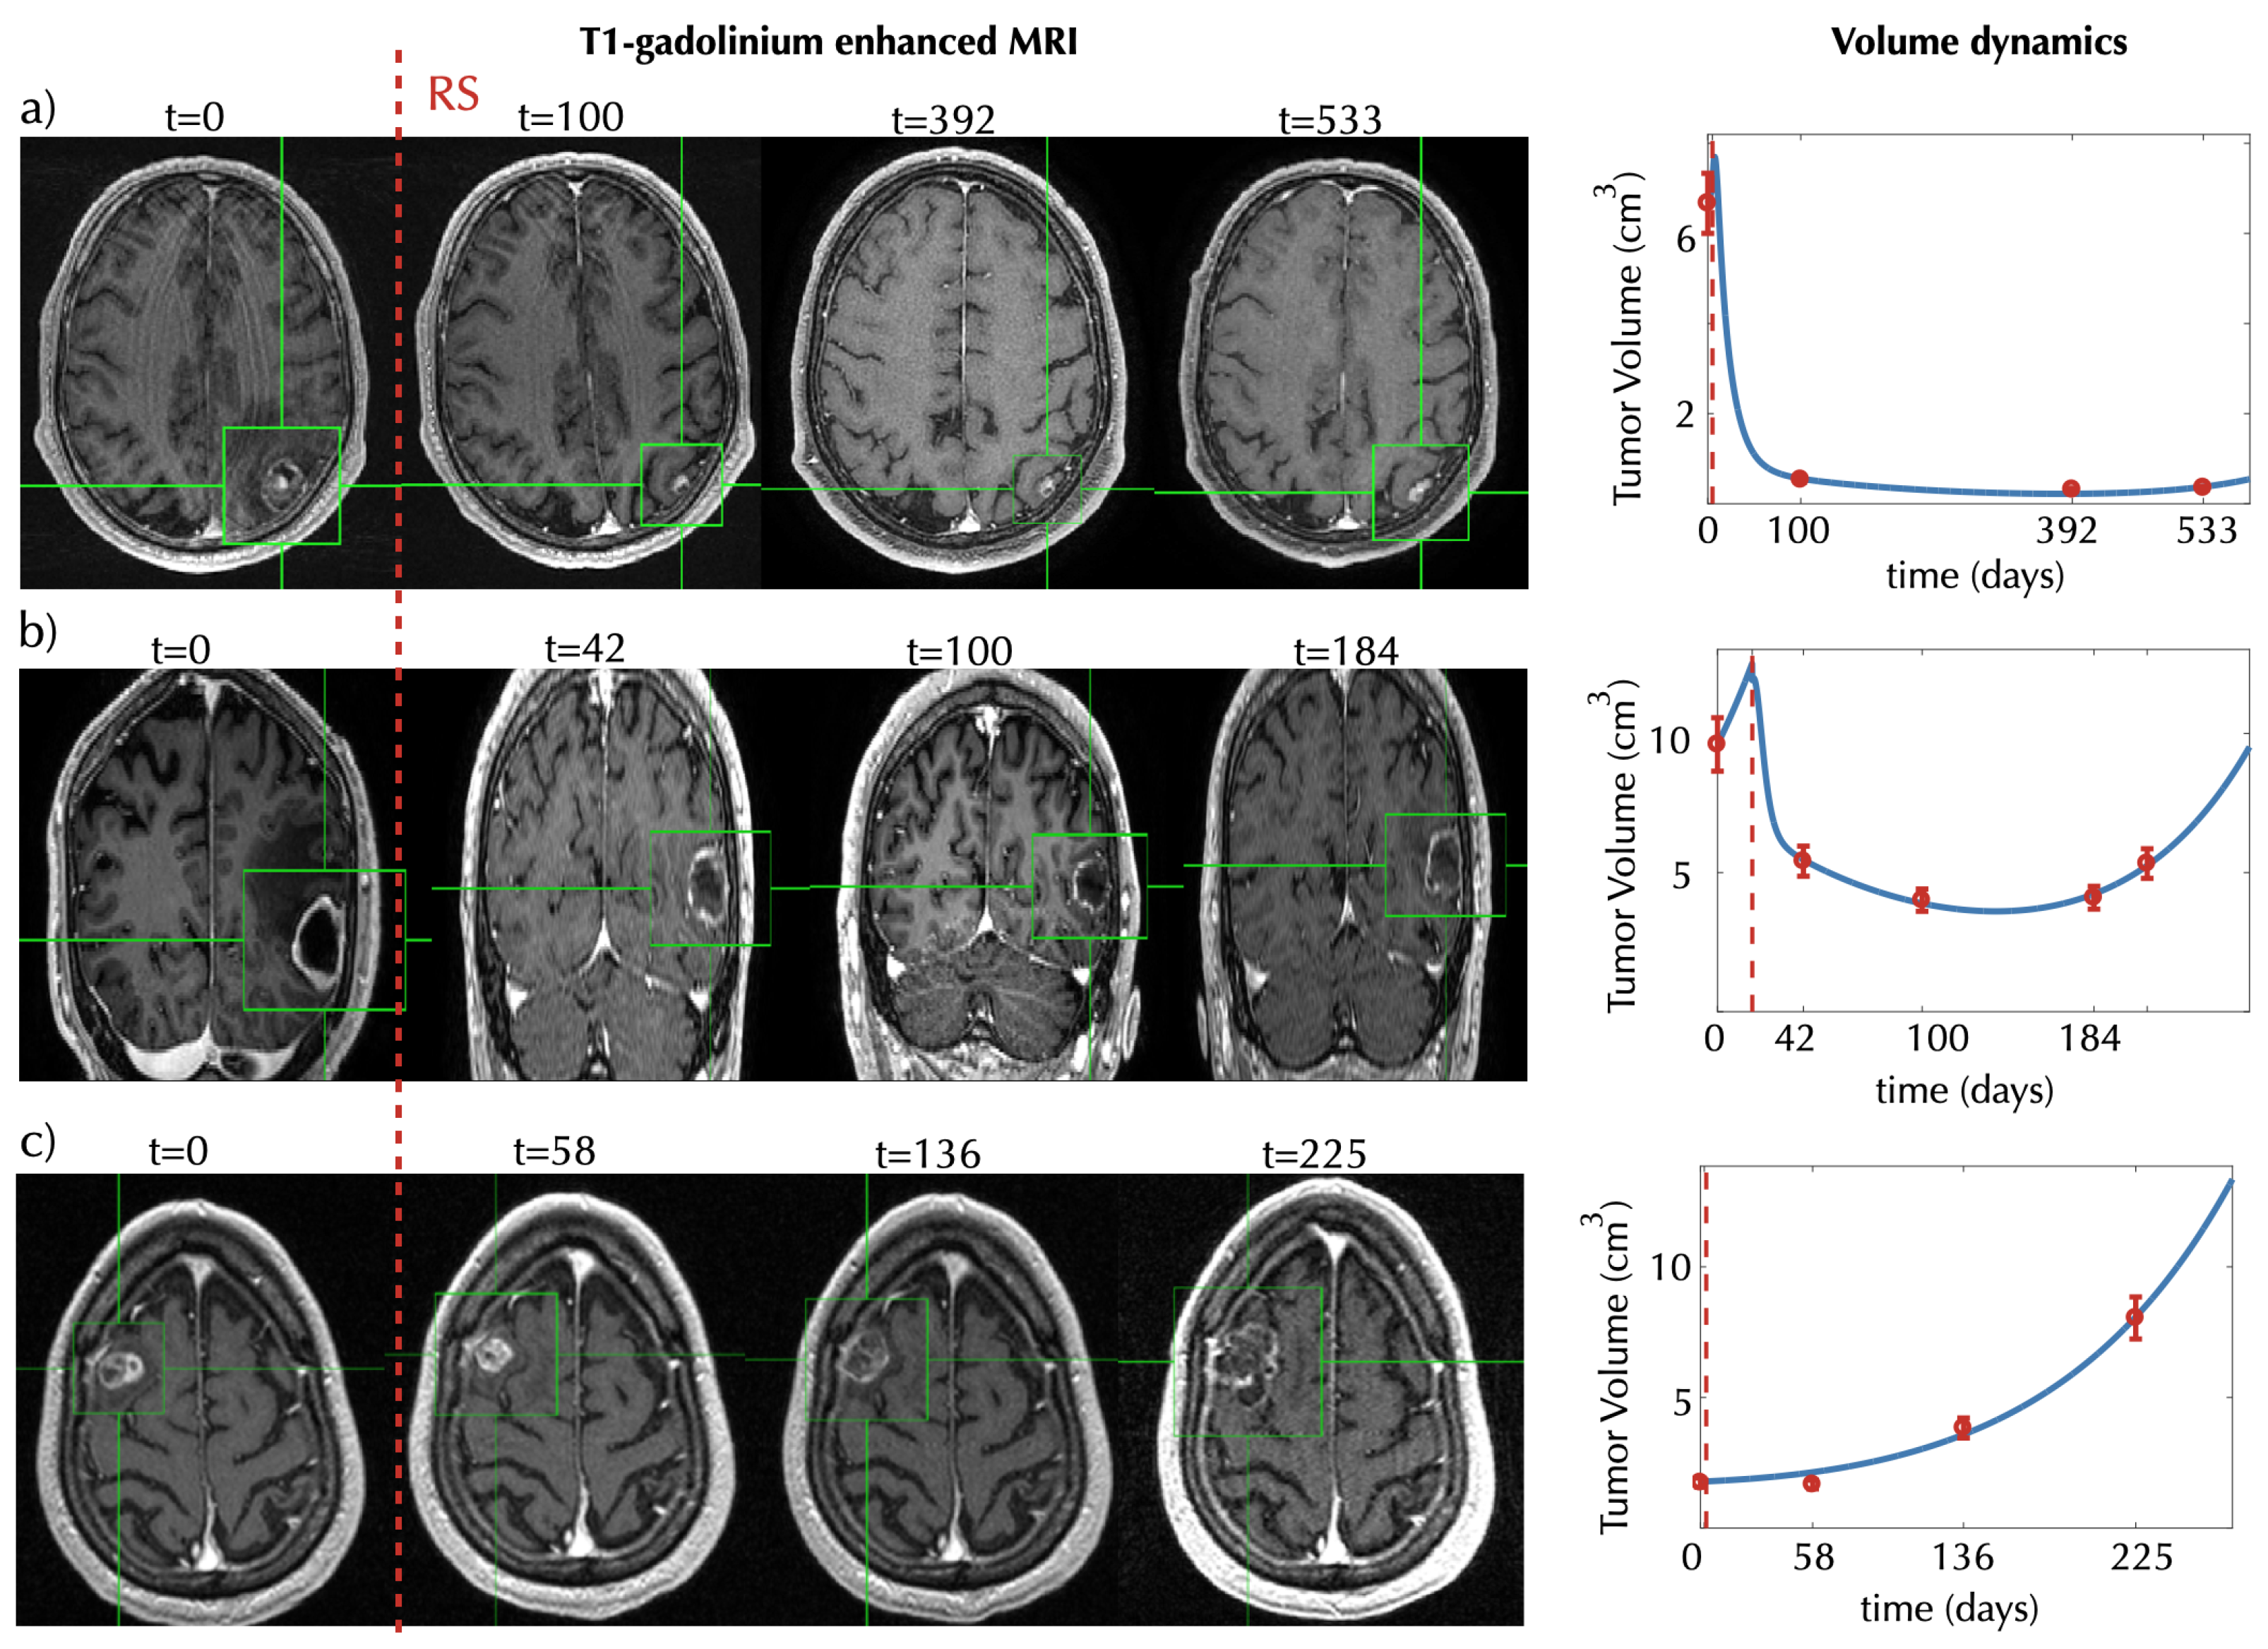
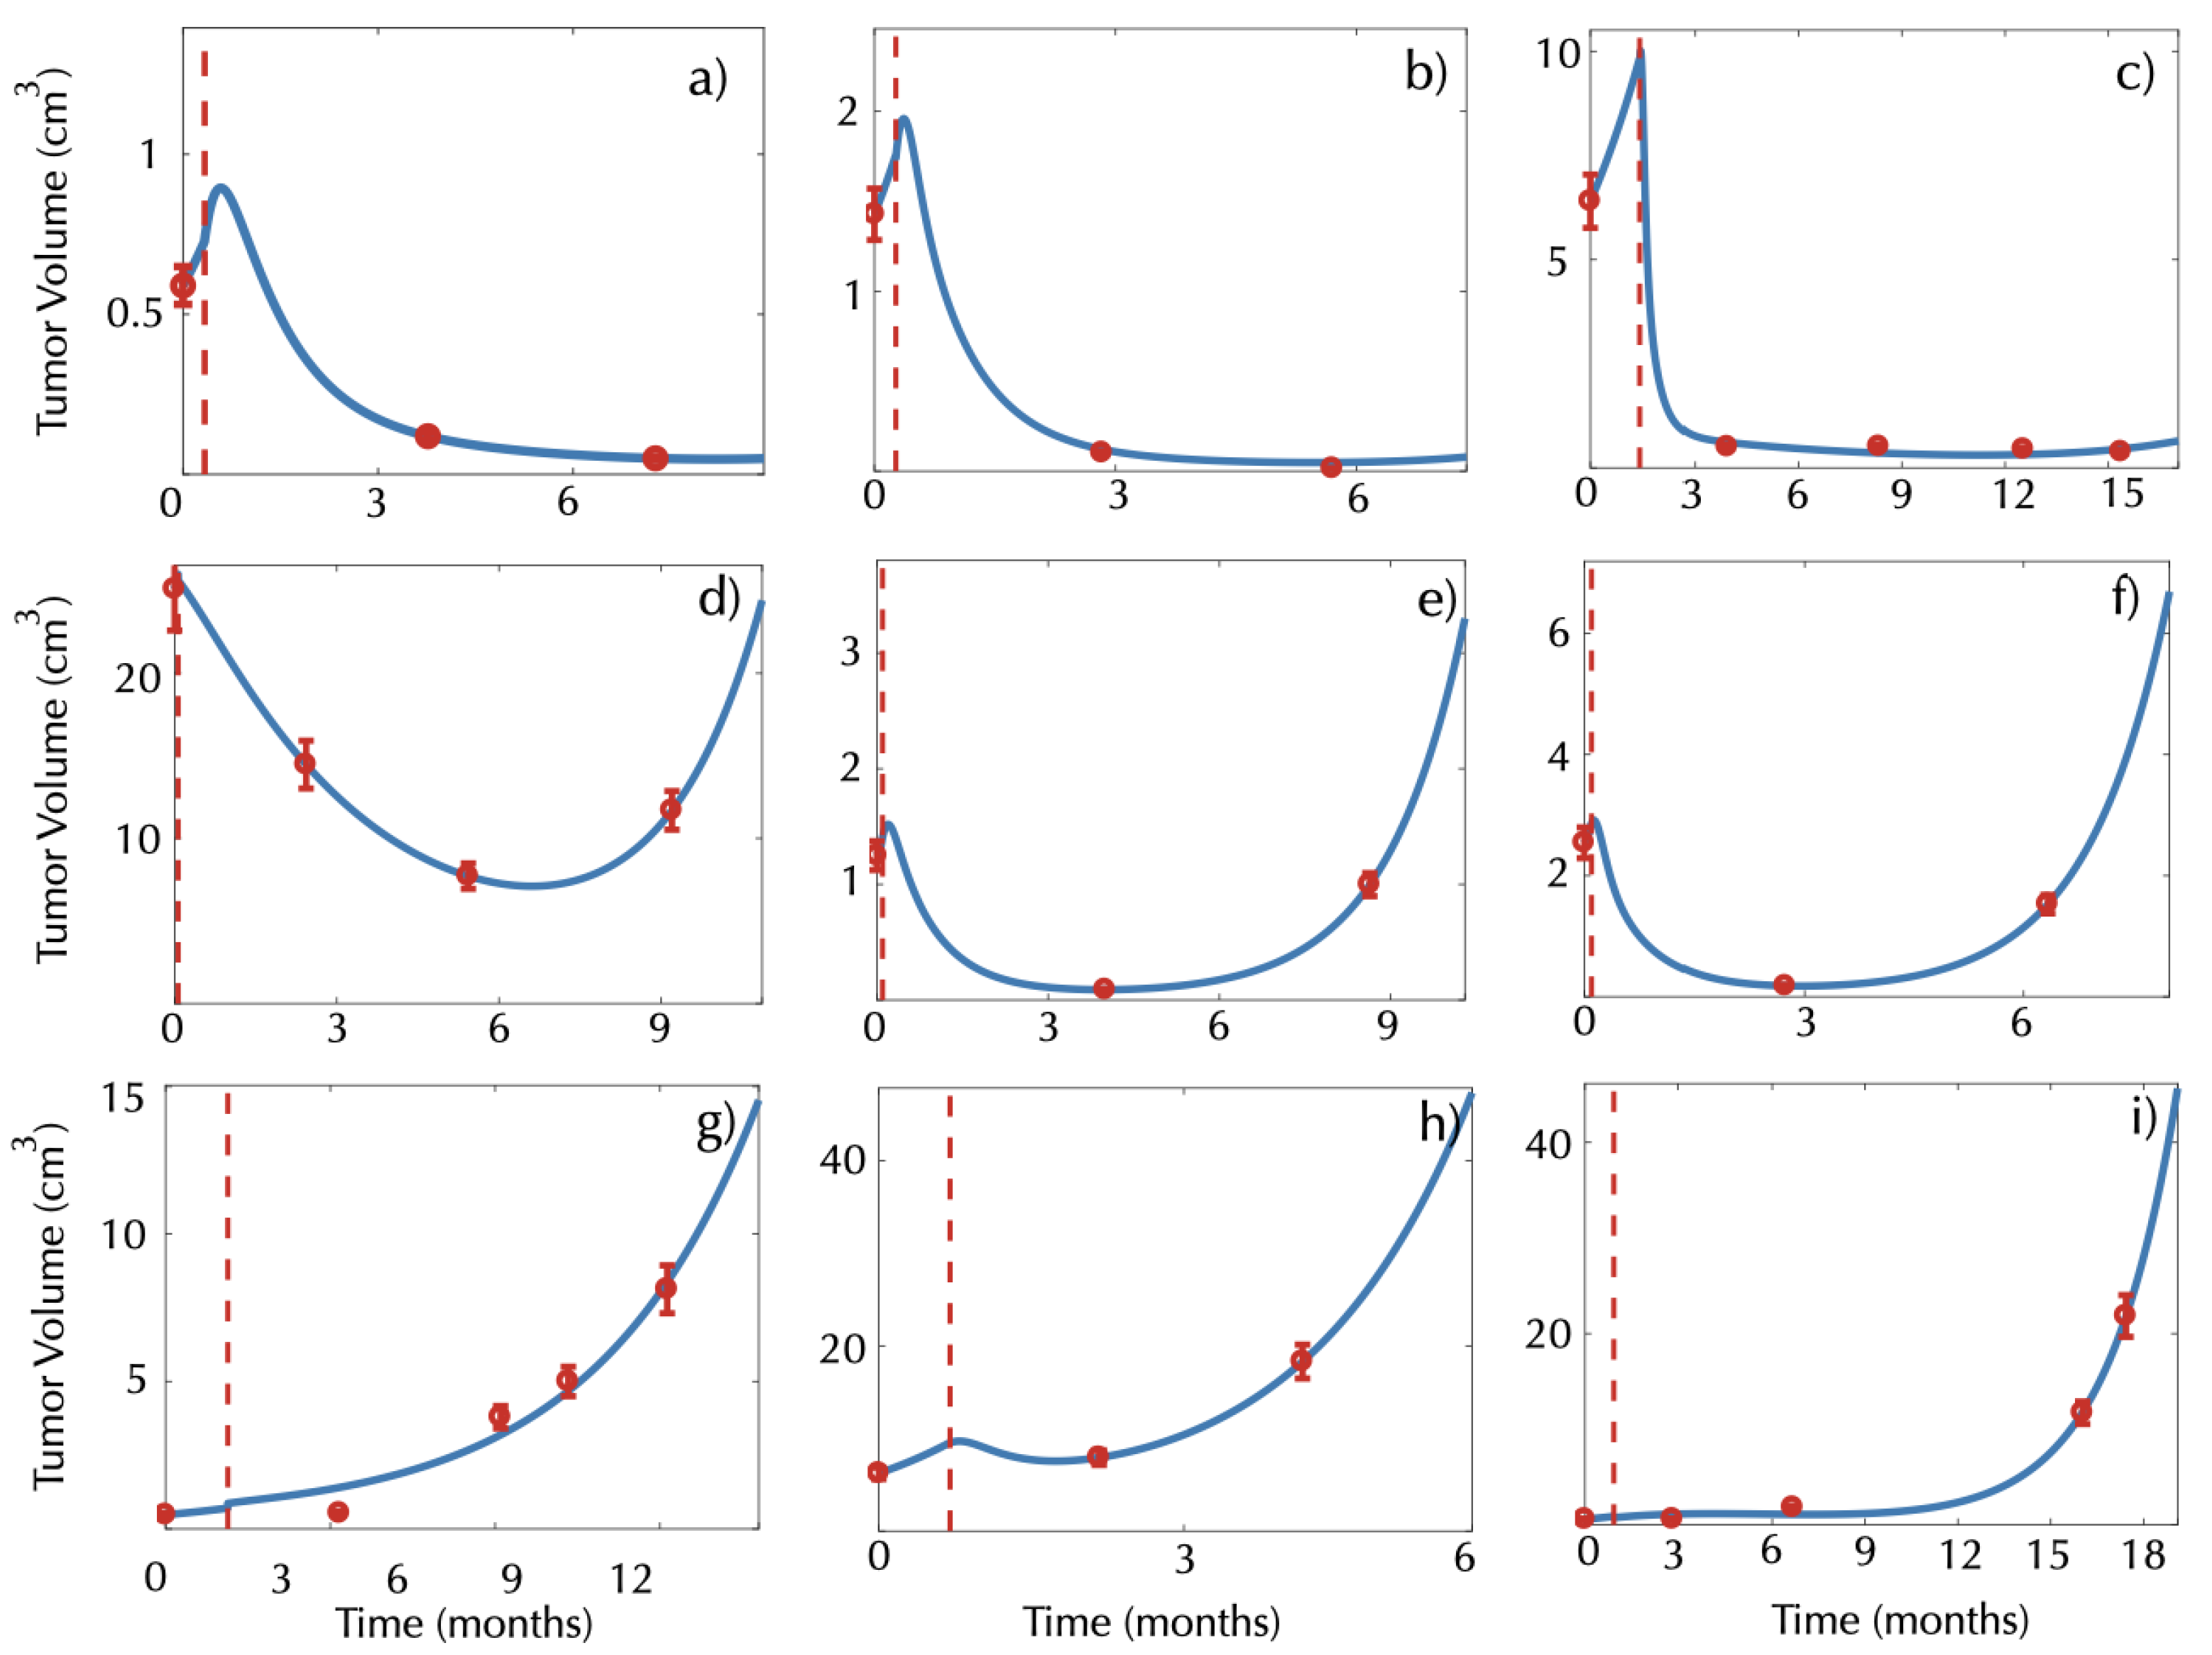
3.1. Mathematical Model Describe the Response to Radiosurgery

Figure 2 shows examples of the time evolution of the volume of brain metastases treated with SRS in three patients. The cases chosen provide instances of three different typical behaviors. In the first case (Figure 2a), the patient had a sustained response lasting for at least 17 months. In a second patient (Figure 2b), the tumor decreased in volume for approximately 184 days and relapsed after the initial response. Finally, in the third case (Figure 2c), the tumor continued to grow after radiosurgery treatment. Henceforth, we will denote the lesion behaviors described in the cases shown as monotonically decreasing lesions (MDLs), lesions that are first decreasing and later increasing (DILs) and monotonically increasing lesions (MILs).
Our mathematical model was able to describe the different scenarios shown in Figure 2.
Figure 3 shows additional examples for 9 of the 60 metastases. The model was able to describe different dynamics of response to treatment in all cases. It also provided good fits for the longitudinal volumetric data of 36 metastases, which showed evolution framed within one of the three behaviors mentioned above: 6 metastases showed an MDL behavior, 19 showed a DIL behavior and 11 showed an MIL behavior. This study included only 13 patients with more than one metastasis treated, and thus a statistical analysis to assess similarities in the behavior of the lesions could not be performed. Four of the 11 patients were observed to have the same post-treatment dynamics in all of their metastases, but the other seven patients had lesions with different longitudinal dynamics after treatment therapy.

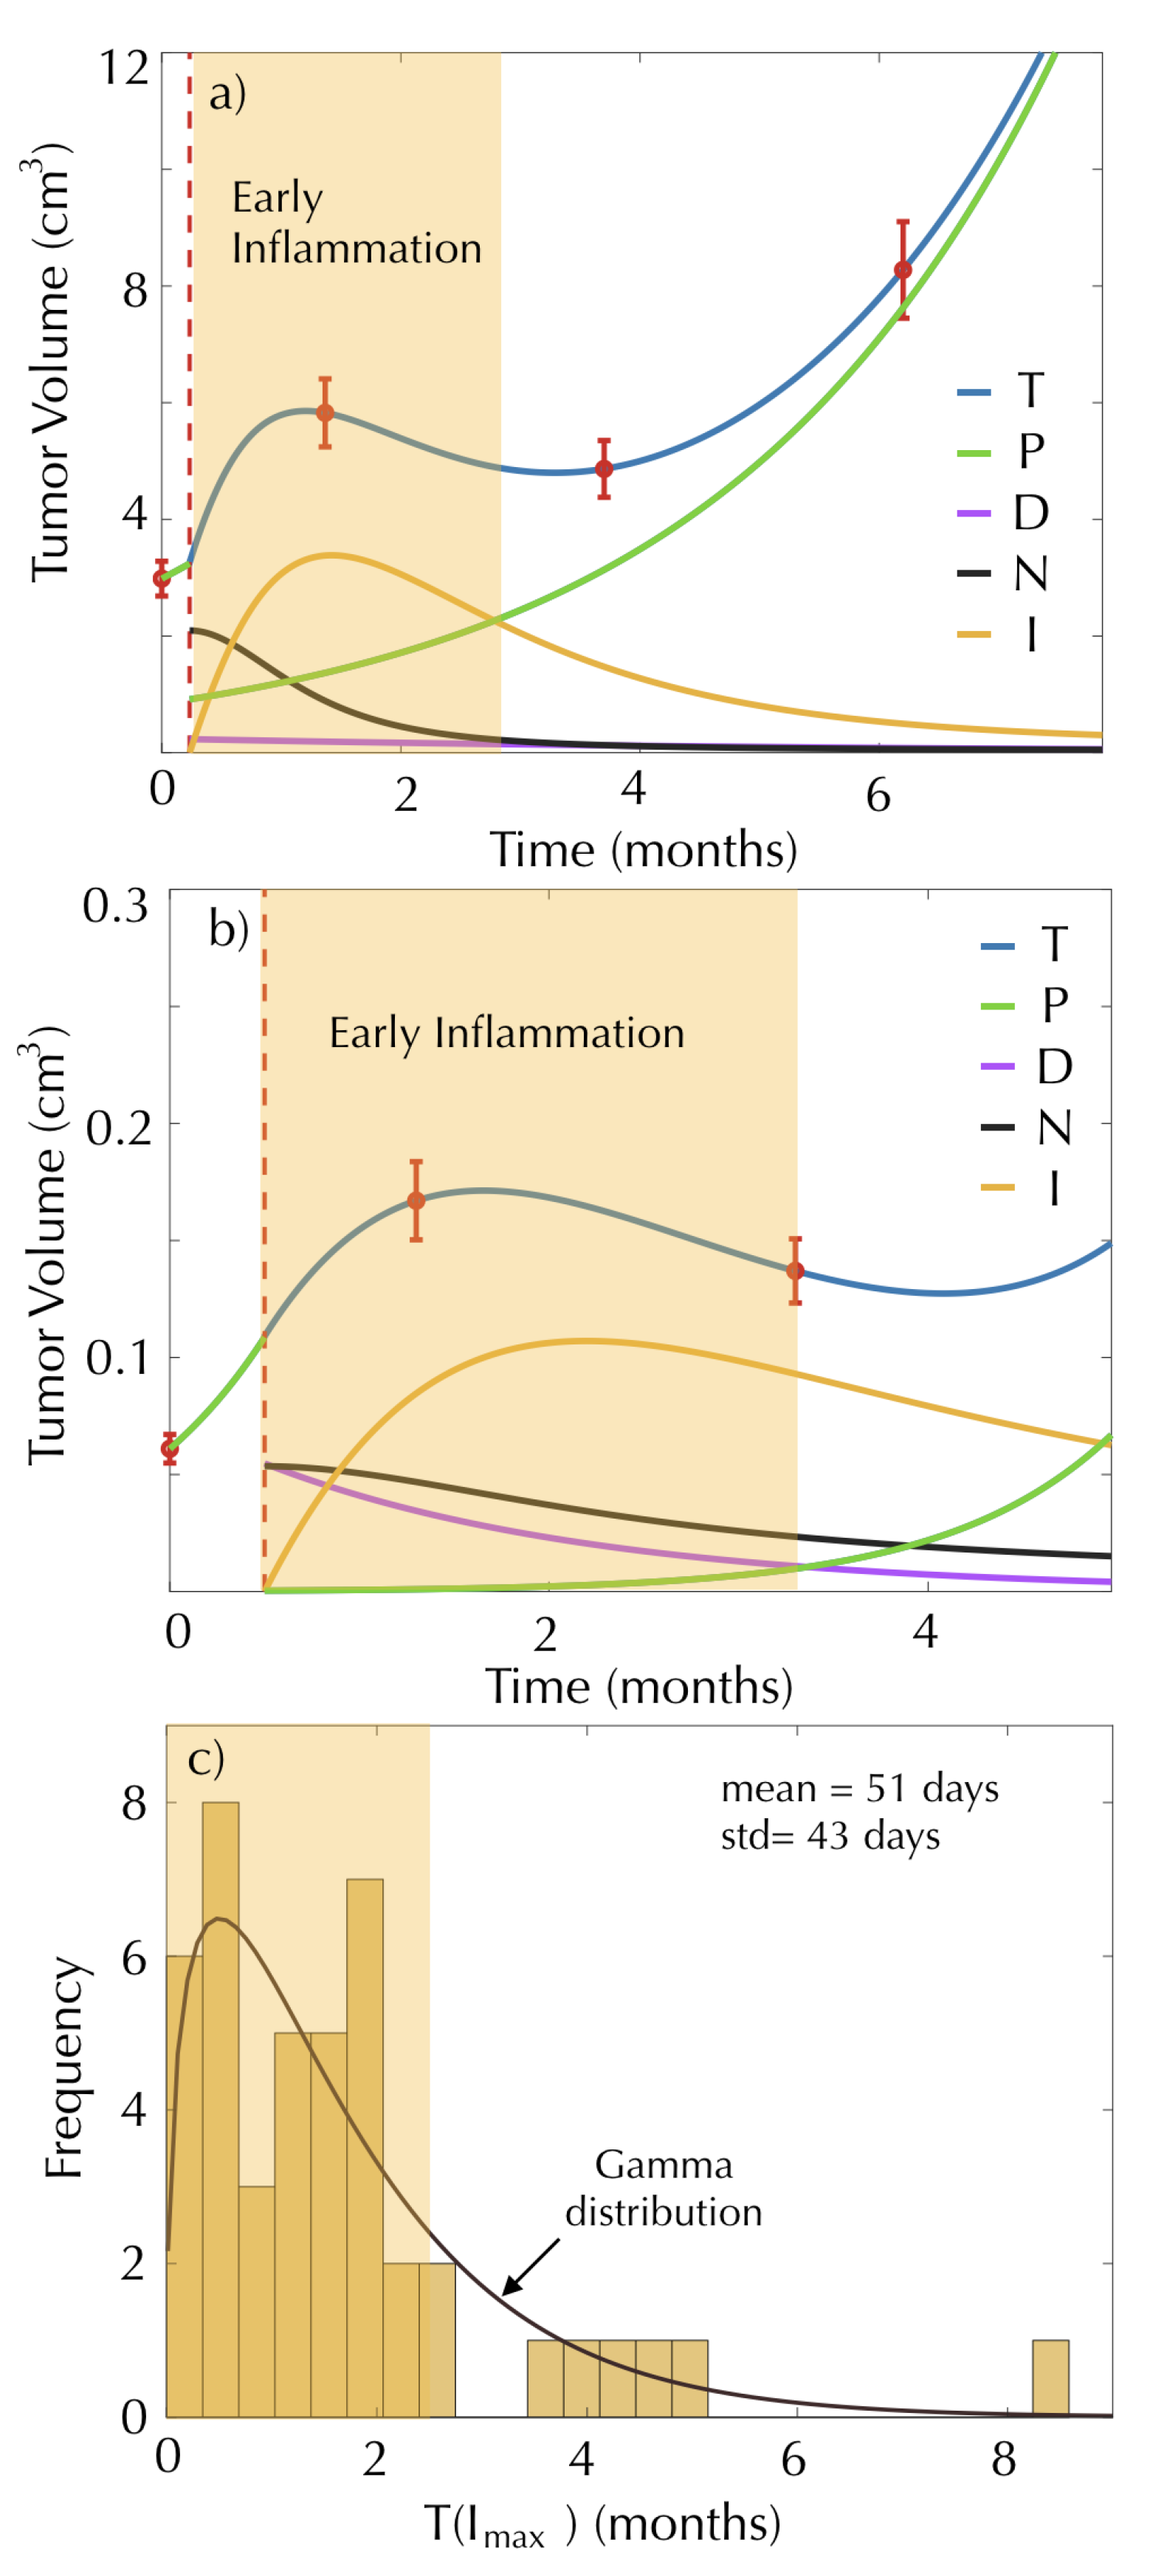
3.2. The Mathematical Model Describes the Early Inflammatory Dynamics Observed in the Post-SRS Response

Six patients in our dataset had imaging studies performed within the period of 3 months after SRS. These BMs increased in size initially, suggesting treatment failure. However, they decreased in size after a few weeks, which was shown by the second examination after SRS. This is due to an early inflammatory response to the treatment that is assumed to occur in most cases. In fact, this is the reason why the first control post-treatment MRI is typically performed 3 months after SRS once the effect of early inflammation has vanished. Figure 4a,b shows the longitudinal volumetric dynamics of BMs and the best fits using the mathematical model for two of those patients.
It is interesting that when breaking the total tumor volume into the different components (color lines in Figure 4), it was obvious that the initial volumetric growth was actually associated with an increase in immune activation. In both cases, radiation generated a large initial number of necrotic cells that stimulated immune cells. The sum of all the cellular compartments resulted in an increase in the total volume, but in fact, the number of proliferating cells was smaller after SRS treatment.
We calculated T ( I m a x ) , representing the time when the immune cell population reaches its peak for the model fits. Figure 4c shows the histogram of the calculated times for the 42 metastases classified within the above response groups.
The computed times can be approximated by a gamma distribution with shape parameter a = 1.4 and scale parameter b = 36 , and they have a mean value equal to 51 days and a variance equal to 43 days. This means that the peak of inflammation occurs more frequently between months 1 and 2 after SRS. Thus, our model confirms that when MRI scans are performed within 3 months after treatment, the results may be affected by early inflammation events and do not provide a reliable measure of the proliferating tumor component.
It is important to emphasize that all four classes of response dynamics studied so far (monotonically decreasing lesions, lesions that are first decreasing and later increasing, monotonically increasing lesions and early inflammation) were accurately described by the mathematical model given by Equations (1)–(4). Figure 5 shows the mean square errors (MSEs) of the best fits obtained using the mathematical model for this subset of brain metastases.

3.3. Damage to Healthy Tissue Could Lead to Late Inflammatory Response and Radiation Necrosis

Late radiation necrosis is a frequent event after SRS treatment [57,58]. This is typically observed in MRIs as volumetric growth of the lesion, typically between 1 and 2 years after SRS, followed by spontaneous (partial or complete) remission. Radiation necrosis (also called “pseudoprogression”) poses a challenge to radiologists since it is very difficult to differentiate it from true tumor progression. In the former case, there is no need for anti-tumoral treatment, while the latter requires a different therapy.
In our dataset, 7 BMs were diagnosed with radiation necrosis and an additional 11 BMs presented late episodes of volume increase followed by volume decrease compatible with that condition. Figure 6 shows two examples of the dynamics and the best fits obtained, using different mathematical models. First, we tried to fit the dynamics using Equations (1)–(4). However, the model did not accurately describe the dynamics (see dashed blue lines in Figure 6a,b) with large MSEs (Figure 6e).
To explain the inflammatory response in this group of patients, we included the late damage to the surrounding healthy tissue as described by Equation (9). To do so, the parameters in Equations (1)–(3) and (9) were fitted for each metastasis using a Gaussian form for the damage function h ( t ) = k Normal ( μ , σ ) . A substantial reduction in the MSE was obtained (Figure 6f) in line with the model dynamics, closely resembling the data (see solid blue lines in Figure 6a,b).

3.4. Time to Tumor Progression Can Be Obtained from the Mathematical Model

Finally, our mathematical model allowed for a theoretical estimation of the time of tumor progression from the initial response data.
After therapy, proliferating cells have exponential growth given by the explicit solution P ( t ) = P 0 e ρ t . Similarly, damaged cells have exponential decay given by D ( t ) = D 0 e ρ t / k . When d T / d t > 0 , tumor volume will grow back. In ideal conditions, the immune system is able to efficiently counteract necrotic cells, and both populations would eventually disappear. Under this assumption, tumor progression is determined by the populations of proliferating and damaged cells, i.e., P 0 e ρ t 1 k D 0 e ρ t / k > 0 . Taking the most reasonable value, k = 2 , i.e., damaged cells dying after two cell cycles on average, and substituting the values of P 0 and D 0 using Equations  (5) and (6), the previous inequality is satisfied if
t p > 2 3 1 ρ ln ( 1 S f ) ( 1 ϵ ) 2 S f ,
where ( 1 S f ) ( 1 ϵ ) > 2 S f > 0 , when D 0 > 2 P 0 . If  D 0 < 2 P 0 , the inequality is satisfied for all values of t > t 0 . Equation (10) can provide an estimate of the time to progression under the assumptions that there is no damage to the healthy tissue ( h = 0 ) and that the survival fraction is positive ( S f > 0 ). The value provided by this equation can be compared with the progression time observed for each patient.
Figure 7 shows three examples of the longitudinal dynamics of BMs after treatment using the mathematical model. Panels on the left display the dynamics for the three patients. The rightmost panels show the dynamics of the different populations according to the mathematical model (1)–(4).
In the first example (see Figure 7a,d), in a tumor without inflammation, the progression time clearly indicates the moment in which the proliferating cells outgrow half of the damaged cell compartment, thus dominating tumor growth. For this patient, there is an increase in tumor volume right after the progression time t p computed from our mathematical model (Equation (10)).
The second and third examples correspond to patients diagnosed with radiation necrosis. The progression time could be used in these cases to distinguish between an increase in the tumor volume caused only by the radiation necrosis (false progression) and an increase caused by real growth. Specifically, the second example (Figure 7b,e) corresponds to a patient with radiation necrosis without progression. In this case, the tumor volume increase can be associated with the radiation necrosis, as it occurs 10 months before progression was expected. In the third example, radiation necrosis occurs after the progression time. In the graph, it is possible to see how even if the tumor volume increases due to the radiation necrosis, it continues growing after the inflammation decreases, suggesting the coexistence of radiation necrosis and tumor progression.

4. Discussion and Conclusions

In this study, we put forward a mathematical model that describes the effect of SRS on brain metastases. The mathematical model includes only four cellular compartments (proliferating, necrotic, damaged and immune) to account for the different dynamics observed after SRS. Interestingly, the simple model was able to describe the volumetric evolution of the lesions observed in the clinic and the different scenarios related to inflammation.
We wanted to keep the complexity of the model at a minimum. It is easy to construct complex models accounting for many different, and not too well-known, biological processes. However that often results in too many unknown parameters to be fitted using a limited amount of biological data. In our case, the only available information was the MRI data and, more specifically, tumor volume. Retaining only a small number of essential variables/parameters is the best way to avoid overfitting problems.
In our mathematical model, we used a single population of proliferating metastatic cells accounting effectively for the tumor dynamics. Brain metastases, and specifically lung cancer ones, are heterogeneous and composed of genetically and phenotypically different subpopulations [59,60,61]. This heterogeneity leads to a differential response to radiation therapy depending on many molecular factors such as EGFR overexpression [62], TopBP1 and Claspin [63], MET [64], CAVEOLIN-1 [65] and many others [66,67]. Indeed, radiation resistance is not only associated with specific individual features of the cancer cells. It is being increasingly recognized that the tumor microenvironment, cell–cell communications and other factors play a role in this complex emergent property [68,69,70]. Here, we intended to develop a minimal model able to describe observed volumetric dynamics, which is the only follow-up information available through standard MRI-imaging.
It is interesting that the model was able to describe qualitatively the observed dynamics without accounting for other relevant biological details of response to radiation therapy such as the differential response of well-oxygenated and hypoxic cells to radiation therapy [48] that has been included in other, more detailed models of radiation therapy of brain tumors by different authors (see e.g., [28,71,72,73,74]). Another effect not accounted for in this study was the fact that irradiated cells may undergo cell cycle arrest or become quiescent for long time periods after sublethal radiation doses [33]. As imaging techniques progress and provide biological data on metastasis status able to feed more complex mathematical models, it may be relevant to develop models including all those biological processes.
In the context of our simplifying assumptions, we assumed the proliferation rate of the BMs to be the same after treatment as before it. The phenomenon of growth acceleration of residual tumors of certain histologies after fractionated radiotherapy courses, the so-called accelerated repopulation, has been known for a long time [48]. However, repopulation rate has been found to be lower in tumors with increased cell loss, as happens in radiation surgery [75]. In fact, there are no reports of observations of accelerated repopulation after radiation surgery treatments. This is also consistent with the observation in experimental tumors that the triggering of accelerated repopulation requires minimum total treatment durations longer than than 3–4 weeks in human tumors [48].
Other biological processes could also lead to differences in proliferation rate with time. The possibility of actions on the primary tumor influencing the dissemination and growth dynamics of metastasis has been hypothesized on the basis of different sources of biomedical data and studied mathematically [19,76,77]. However, in the case of brain metastases, the blood–brain barrier may provide a chemical firewall for the communication between the primary tumor and metastatic colonies, and the fact is that no solid evidence of such chemical links has been provided. Moreover in the case studied here of stage IV lung cancer, surgical treatment of the primary tumor is not typically a therapeutic option. This is why we did not account for any “communication” between the primary tumor and the BMs in our modeling approach.
Early post-treatment inflammation was very easily accounted for in the model by incorporating early cell death (necrosis) and associated inflammatory response. Radiation necrosis events, assumed to be the result of damage to healthy tissue, were incorporated in a simple and rather ad hoc way by the function h ( t ) . The effect of radiation on healthy tissue as an additional source of necrosis could be analyzed under different forms of this function, but we have chosen the Gaussian form as a first approximation. Induced damage to normal tissue by radiation therapy has been studied using mechanistic mathematical models [78], where the cell population is directly exposed to radiation. Incorporating more details of the SRS-induced damage to healthy tissue could allow us to write mechanistic equations for the normal tissue behavior in response to treatment. As a first approach, we wanted to keep the model simple and with a minimal number of parameters, but more complex mathematical models could account for this effect in a more elegant way.
In this work, we chose S f to be an adjustable parameter instead of a fixed predetermined value. In the context of elementary “static” mathematical approaches to radiation therapy such as the linear–quadratic equation, it is customary to assume a given S f value to solve problems in therapy replanning and other such applications. That given S f value would be characteristic of the tumor histology. However, that approach is of limited use in the context of radiation surgery of brain metastasis because there is a broad variety of potential outcomes to SRS treatment ranging from no response to complete response even for the same primary types. This is probably due to the intra- and interpatient heterogeneity as well as the role of many other elements in the response such as the tumor or immune environments, as discussed previously.
According to the results of the model fits, it seems that this simple model has some limitations in describing the tumor dynamics in some patients undergoing radiation necrosis. The model fitting in these cases showed mean square errors larger than those obtained in the more common scenarios of early response to SRS. This suggests that radiation necrosis is a more complex phenomenon where different biological factors may play a role.
One of the current problems in clinical practice is to differentiate between tumor progression and radiation necrosis, as both display a similar course as observed in the MRI, requiring advanced diagnostic techniques for identification [79,80]. In this study, we obtained an analytical estimate for the progression time due to the growth of remnant proliferating cells after SRS. This estimated time may be the basis for biomarkers helping clinicians to distinguish between progression and radiation necrosis. If the tumor increases in size at a time close to the predicted tumor recurrence, this could be an indication of tumor progression. On the other hand, tumor outgrowths at times much earlier than the estimated by the model could be an indication of the presence of an inflammatory process.
The key point in moving from Equation (10) to a clinically relevant biomarker would be to define the requirements for a reliable estimate of the outgrowth time, as this must be done from MRI data. In principle, only a small number of data points are necessary to obtain the value of this parameter ( ρ , ϵ , S f ). If there are two MR imaging exams before SRS, they would allow the tumor proliferation rate ρ to be estimated. Interestingly, performing a second MRI immediately before SRS also has advantages from the clinical point of view, since it would allow for a more precise definition of the target volume. It has been reported recently [81,82] that measurable changes occur in brain metastasis over a short period of time, on the order of a week, so a final planning right before SRS would help in achieving greater therapeutic efficacy and provide a second MRI to obtain a baseline growth rate estimate.
The parameters ϵ and S f can be obtained using the first few (2–3) MRIs of the standard follow-up after radiosurgery. Thus, patients with two pretreatment MRIs and a 1-year follow-up after SRS could have precise progression time estimates that could be used for comparison with the observed dynamics after the first year. Unfortunately, our database did not have patients fulfilling these requirements (i.e., all patients who presented radiation necrosis or progression had only one pretreatment MRI), so we could not explore the idea in more detail. As future work, we will address this by planning either a retrospective search for such patients or a prospective study.
This work is one of the first mathematical studies describing the different outcomes observed in the response of brain metastasis to radiosurgery using longitudinal tumor imaging data. Brain metastasis is a condition 10 times more frequent than primary brain tumors. It is thus striking that so many mathematical papers have studied primary brain tumors and their time dynamics while BMs have received little attention. Our model is a first step to a mathematical description of that disease. We hope that this work will stimulate further studies addressing this important condition and that richer datasets could be used to feed more elaborate models in the future.
In conclusion, we have developed a mathematical model based on a set of ordinary differential equations that describe the observed longitudinal dynamics of brain metastases after SRS. The model allowed the varying early longitudinal dynamics observed in patients to be accurately described with very few parameters. Radiation necrosis events were described in a simplified way, and in most cases, they were also fitted accurately using the model. We obtained an equation for the expected tumor progression time based on a few parameters that could be the basis for biomarkers to help in discriminating between radiation necrosis and true progression, which currently represents a major challenge in the clinical setting.

Author Contributions

Conceptualization, E.A. and V.M.P.-G.; methodology, V.M.P.-G. and O.L.-T.; software, J.P.-B. and O.L.-T.; formal analysis, O.L.-T.; resources, D.A., L.P.-R., E.A., A.O.d.M., M.L., E.G.-D.P. and N.C.; data curation, J.P.-B., D.A., L.P.-R., E.A., A.O.d.M. and O.L.-T.; writing—original draft preparation, O.L.-T. and V.M.P.-G.; project administration, V.M.P.-G. All authors have read and agreed to the published version of the manuscript.

Funding

This research was supported by Ministerio de Ciencia e Innovación, Spain (grant number PID2019-110895RB-I00), and Junta de Comunidades de Castilla-La Mancha (grant number SBPLY/17/180501/000154). OLT is supported by a PhD Fellowship from the University of Castilla-La Mancha research plan.

Institutional Review Board Statement

The study was conducted according to the guidelines of the Declaration of Helsinki. The protocol was approved by the Ethics Committees of Instituto Valenciano de Oncología (project identification code 2011-46), Hospitales HM (project identification code 18.09.1303-GHM) and Hospital Universitario Ramón y Cajal as Institutional Review Board for MD Anderson Cancer Centre, Madrid (project identification code METMATH).

Informed Consent Statement

Patient consent was waived as the data were obtained from retrospective observational clinical studies that were approved by the corresponding institutional review boards.

Data Availability Statement

The data presented in this study are available upon request from the corresponding author.

Conflicts of Interest

The authors declare no conflicts of interest.

Abbreviations

BMsBrain Metastases
SRSStereotactic Radio Surgery
RTRadiation Therapy
MRIMagnetic Resonance Imaging

Appendix A

To confirm that the optimization procedure implemented in the MATLAB function fmincon was not trapped in a local minimum of the parameter space, we heuristically explored parameter values around the solution. To do so, we plotted the profiles of the objective function by fixing all parameters except one at their optimal values and considered the unset parameter as a variable. The function used is given by the expression MSE = 1 n i = 1 n ( V ^ i ( ρ , S f , ϵ , λ N , λ I , α , h ) V i ) 2 , where n is the total number of follow-up MRIs performed for each metastases, V i is the segmented volume of scan i and V ^ i ( ρ , S f , ϵ , λ N , λ I , α , h ) is related to the total number of cellular elements in the tumor and its environment T ( t i ) given by the model (see Section 2.1).
Figure A1 shows two examples of minimum MSE profiles as a function of a single parameter, where the other parameters have been set to the optimal value obtained by fitting the data using fmincon. The simulations suggest that the set of parameter values provided by the MATLAB routine were indeed global minima, although the procedure used cannot guarantee it with absolute certainty.
Figure A1. MSE profiles as a function of a single parameter where the other parameters have been set as the optimal values obtained by fitting the data of two metastases (A,B) using fmincon. The red dots represent the value of the parameter estimating all the parameters at the same time. The red dashed lines represent the minima of the MSE function.
Mathematics 09 00716 g0a1

References

  1. Siegel, R.L.; Miller, K.D.; Jemal, A. Cancer statistics. CA Cancer J. Clin. 2016, 66, 7–30. [Google Scholar] [CrossRef] [Green Version]
  2. Clairambault, J. Optimizing cancer pharmacotherapeutics using mathematical modeling and a systems biology approach. Pers. Med. 2011, 8, 271–286. [Google Scholar] [CrossRef] [Green Version]
  3. Jackson, T.; Komarova, N.; Swanson, K. Mathematical oncology: Using mathematics to enable cancer discoveries. Am. Math. Month. 2014, 121, 840–856. [Google Scholar] [CrossRef] [Green Version]
  4. Altrock, P.M.; Liu, L.L.; Michor, F. The mathematics of cancer: Integrating quantitative models. Nat. Rev. Cancer 2016, 15, 730–745. [Google Scholar] [CrossRef]
  5. Pérez-García, V.M.; Fitzpatrick, S.; Pérez-Romasanta, L.A.; Pesic, M.; Schucht, P.; Arana, E.; Sánchez-Gómez, P. Applied mathematics and nonlinear sciences in the war on cancer. Appl. Math. Nonlinear Sci. 2016, 1, 423–436. [Google Scholar] [CrossRef] [Green Version]
  6. Fox, B.D.; Cheung, V.J.; Patel, A.J.; Suki, D.; Rao, G. Epidemiology of metastatic brain tumors. Neurosurg. Clin. N. Am. 2011, 22, 1–6. [Google Scholar] [CrossRef]
  7. Venkatesan, P. SRS is non-inferior to WBRT for brain metastases. Lancet Oncol. 2018, 19, e386. [Google Scholar] [CrossRef]
  8. Iwata, K.; Kawasaki, K.; Shigesada, N. A dynamical model for the growth and size distribution of multiple metastatic tumors. J. Theor. Biol. 2000, 203, 177–186. [Google Scholar] [CrossRef] [Green Version]
  9. Hartung, N.; Mollard, S.; Barbolosi, D.; Benabdallah, A.; Chapuisat, G.; Henry, G.; Giacometti, S.; Iliadis, A.; Ciccolini, J.; Faivre, C.; et al. Mathematical modeling of tumor growth and metastatic spreading: Validation in tumor-bearing mice. Cancer Res. 2014, 74, 6397–6407. [Google Scholar] [CrossRef] [Green Version]
  10. Barbolosi, D.; Benabdallah, A.; Hubert, F.; Verga, F. Mathematical and numerical analysis for a model of growing metastatic tumors. Math. Biosci. 2009, 218, 1–14. [Google Scholar] [CrossRef] [Green Version]
  11. Barbolosi, D.; Summer, I.; Meille, C.; Serre, R.; Kelly, A.; Zerdoud, S.; Bournaud, C.; Schvartz, C.; Toubeau, M.; Toubert, M.E.; et al. Modeling therapeutic response to radioiodine in metastatic thyroid cancer: A proof-of-concept study for individualized medicine. Oncotarget 2017, 8, 39167–39176. [Google Scholar] [CrossRef]
  12. Mollard, S.; Ciccolini, J.; Imbs, D.C.; El Cheikh, R.; Barbolosi, D.; Benzekry, S. Model driven optimization of antiangiogenics + cytotoxics combination: Application to breast cancer mice treated with bevacizumab + paclitaxel doublet leads to reduced tumor growth and fewer metastasis. Oncotarget 2017, 8, 23087–23098. [Google Scholar] [CrossRef] [Green Version]
  13. Bilous, M.; Serdjebi, C.; Boyer, A.; Tomasini, P.; Pouypoudat, C.; Barbolosi, D.; Barlesi, F.; Chomy, F.; Benzekry, S. Quantitative mathematical modeling of clinical brain metastasis dynamics in non-small cell lung cancer. Sci. Rep. 2019, 9, 13018. [Google Scholar] [CrossRef] [Green Version]
  14. Brodland, G.W.; Veldhuis, J.H. The mechanics of metastasis: Insights from a computational model. PLoS ONE 2012, 7, e44281. [Google Scholar] [CrossRef] [Green Version]
  15. Chen, L.L.; Blumm, N.; Christakis, N.A.; Barabási, A.L.; Deisboeck, T.S. Cancer metastasis networks and the prediction of progression patterns. Br. J. Cancer 2009, 101, 749–758. [Google Scholar] [CrossRef] [PubMed] [Green Version]
  16. Newton, P.K.; Mason, J.; Bethel, K.; Bazhenova, L.; Nieva, J.; Norton, L.; Kuhn, P. Spreaders and sponges define metastasis in lung cancer: A Markov chain Monte Carlo mathematical model. Cancer Res. 2013, 73, 2760–2769. [Google Scholar] [CrossRef] [Green Version]
  17. Scott, J.G.; Basanta, D.; Anderson, A.R.; Gerlee, P. A mathematical model of tumour self-seeding reveals secondary metastatic deposits as drivers of primary tumour growth. J. R. Soc. Interface 2013, 10, 20130011. [Google Scholar] [CrossRef] [Green Version]
  18. Newton, P.K.; Mason, J.; Bethel, K.; Bazhenova, L.A.; Nieva, J.; Kuhn, P. A stochastic Markov chain model to describe lung cancer growth and metastasis. PLoS ONE 2012, 7, e34637. [Google Scholar] [CrossRef] [Green Version]
  19. Diego, D.; Calvo, G.F.; Pérez-García, V.M. Modeling the connection between primary and metastatic tumors. J. Math. Biol. 2013, 67, 657–692. [Google Scholar] [CrossRef]
  20. Haeno, H.; Gonen, M.; Davis, M.B.; Herman, J.M.; Iacobuzio-Donahue, C.A.; Michor, F. Computational modeling of pancreatic cancer reveals kinetics of metastasis suggesting optimum treatment strategies. Cell 2012, 148, 362–375. [Google Scholar] [CrossRef] [Green Version]
  21. Watanabe, Y.; Dahlman, E.L.; Leder, K.Z.; Hui, S.K. A mathematical model of tumor growth and its response to single irradiation. Theor. Biol. Med. Model. 2016, 13, 6. [Google Scholar] [CrossRef] [Green Version]
  22. Dehghan, M.; Narimani, N. Radial basis function-generated finite difference scheme for simulating the brain cancer growth model under radiotherapy in various types of computational domains. Comput. Methods Programs Biomed. 2020, 195, 105641. [Google Scholar] [CrossRef]
  23. Leder, K.; Pitter, K.; Laplant, Q.; Hambardzumyan, D.; Ross, B.D.; Chan, T.A.; Holland, E.C.; Michor, F. Mathematical modeling of PDGF-driven glioblastoma reveals optimized radiation dosing schedules. Cell 2014, 156, 603–616. [Google Scholar] [CrossRef] [Green Version]
  24. Eikenberry, S.E.; Kuang, Y. Virtual glioblastoma: Growth, migration and treatment in a three-dimensional model. Cell Prolif. 2009, 42, 511–528. [Google Scholar] [CrossRef]
  25. Rockne, R.; Alvord, E.C., Jr.; Rockhill, J.K.; Swanson, K.R. A mathematical model for brain tumor response to radiation therapy. J. Math. Biol. 2009, 59, 561. [Google Scholar] [CrossRef] [Green Version]
  26. Rockne, R.; Rockhill, J.; Mrugala, M.; Spence, M.; Kalet, I.; Hendrickson, K.; Lai, A.; Cloughesy, T.; Alvord, C.; Swanson, K. Predicting the efficacy of radiotherapy in individual glioblastoma patients in vivo: A mathematical modeling approach. Phys. Med. Biol. 2010, 55, 3271–3285. [Google Scholar] [CrossRef] [PubMed] [Green Version]
  27. Nazari, A.J.; Sardari, D.; Vali, A.R.; Maghooli, K. Computer implementation of a new therapeutic model for GBM tumor. Comput. Math. Methods Med. 2014, 2014, 481935. [Google Scholar] [CrossRef] [Green Version]
  28. Martínez-González, A.; Durán-Prado, M.; Calvo, G.F.; Alcain, F.J.; Pérez-Romasanta, L.A.; Pérez-García, V.M. Combined therapies of antithrombotics and antioxidants delay in silico brain tumour progression. Math. Med. Biol. 2015, 32, 239–262. [Google Scholar] [CrossRef] [PubMed]
  29. Yu, V.Y.; Nguyen, D.; Pajonk, F.; Kupelian, P.; Kaprealian, T.; Selch, M.; Low, D.A.; Sheng, K. Incorporating cancer stem cells in radiation therapy treatment response modeling and the implication in glioblastoma multiforme treatment resistance. Int. J. Radiat. Oncol. Biol. Phys. 2015, 91, 866–875. [Google Scholar] [CrossRef]
  30. Borasi, G.; Nahum, A. Modelling the radiotherapy effect in the reaction-diffusion equation. Eur. J. Med. Phys. 2016, 32, 1175–1179. [Google Scholar] [CrossRef]
  31. Chakwizira, A.; Ahlstedt, J.; Redebrandt, H.N.; Ceberg, C. Mathematical modelling of the synergistic combination of radiotherapy and indoleamine-2,3-dioxygenase (IDO) inhibitory immunotherapy against glioblastoma. Br. J. Radiol. 2018, 91, 1087. [Google Scholar] [CrossRef]
  32. Hawkins-Daarud, A.; Rockne, R.; Corwin, D.; Anderson, A.R.A.; Kinahan, P.; Swanson, K.R. In silico analysis suggests differential response to bevacizumab and radiation combination therapy in newly diagnosed glioblastoma. J. R. Soc. Interface 2015, 12, 20150388. [Google Scholar] [CrossRef] [Green Version]
  33. Ribba, B.; Kaloshi, G.; Peyre, M.; Ricard, D.; Calvez, V.; Tod, M.; Cajavec-Bernard, B.; Idbaih, A.; Psimaras, D.; Dainese, L.; et al. A tumor growth inhibition model for low-grade glioma treated with chemotherapy or radiotherapy. Clin. Cancer Res. 2012, 15, 5071–5080. [Google Scholar] [CrossRef] [Green Version]
  34. Badoual, M.; Gerin, C.; Derouler, C.; Grammaticos, B.; Llitjos, J.F.; Oppenheim, C.; Varlet, P.; Pallud, J. Oedema-based model for diffuse low-grade gliomas: Application to clinical cases under radiotherapy. Cell Prolif. 2014, 47, 369–380. [Google Scholar] [CrossRef]
  35. Pérez-García, V.M.; Bogdanska, M.; Martínez-González, A.; Belmonte-Beitia, J.; Schucht, P.; Pérez-Romasanta, L.A. Delay effects in the response of low-grade gliomas to radiotherapy: A mathematical model and its therapeutical implications. Math. Biol. Med. 2015, 32, 307–329. [Google Scholar] [CrossRef] [Green Version]
  36. Galochkina, T.; Bratus, A.; Pérez-García, V.M. Optimal radiotherapy protocol for low-grade gliomas: Insights from a mathematical model. Math. Biosci. 2015, 267, 1–9. [Google Scholar] [CrossRef] [PubMed]
  37. Henares-Molina, A.; Benzekry, S.; Lara, P.C.; García-Rojo, M.; Pérez-García, V.M.; Martínez-González, A. Non-standard radiotherapy fractionations delay the time to malignant transformation of low-grade gliomas. PLoS ONE 2017, 12, e0178552. [Google Scholar] [CrossRef] [PubMed] [Green Version]
  38. Pérez-García, V.M.; Pérez-Romasanta, L.A. Extreme protraction for low-grade gliomas: Theoretical proof of concept of a novel therapeutical strategy. Math. Med. Biol. 2016, 33, 253–271. [Google Scholar] [CrossRef] [PubMed] [Green Version]
  39. Sperduto, P.W.; Kased, N.; Roberge, D.; Xu, Z.; Shanley, R.; Luo, X.; Sneed, P.K.; Chao, S.T.; Weil, R.J.; Suh, J.; et al. Summary report on the graded prognostic assessment: An accurate and facile diagnosis- specific tool to estimate survival for patients with brain metastases. J. Clin. Oncol. 2012, 30, 419–425. [Google Scholar] [CrossRef] [Green Version]
  40. Swanson, K.R.; Harpold, H.L.P.; Peacock, D.L.; Rockne, R.; Pennington, C.; Kilbride, L.; Grant, R.; Wardlaw, J.M.; Alvord, E.C., Jr. Velocity of radial expansion of contrast-enhancing gliomas and the effectiveness of radiotherapy in individual patients: A proof of principle. Clin. Oncol. 2008, 20, 301–308. [Google Scholar] [CrossRef]
  41. Wang, C.H.; Rockhill, J.K.; Mrugala, M.; Peacock, D.L.; Lai, A.; Jusenius, K.; Wardlaw, J.M.; Cloughesy, T.; Spence, A.; Rockne, R.; et al. Prognostic significance of growth kinetics in newly diagnosed glioblastomas revealed by combining serial imaging with a novel biomathematical model. Cancer Res. 2009, 69, 9133–9140. [Google Scholar] [CrossRef] [Green Version]
  42. Pérez-Beteta, J.; Molina-García, D.; Martínez-González, A.; Henares-Molina, A.; Amo-Salas, M.; Luque, B.; Arregui, E.; Calvo, M.; Borrás, J.M.; Martino, J.; et al. Morphological MRI-based features provide pretreatment and post-surgery survival prediction in glioblastoma. Eur. Radiol. 2019, 29, 1968–1977. [Google Scholar] [CrossRef]
  43. Pérez-Beteta, J.; Molina, D.; Villena, M.; Rodríguez, M.J.; Velásquez, C.; Martino, J.; Meléndez-Asensio, B.; Rodríguez de Lope, Á.; Morcillo, R.; Sepúlveda, J.M.; et al. Morphologic features on MR imaging classify multifocal glioblastomas in different prognostic groups. Am. J. Neuro-Radiol. 2019, 40, 634–640. [Google Scholar] [CrossRef]
  44. Massey, S.C.; White, H.; Whitmire, P.; Doyle, T.; Johnston, S.K.; Singleton, K.W.; Jackson, P.R.; Hawkins-Daarud, A.; Bendok, B.R.; Porter, A.B.; et al. Image-based metric of invasiveness predicts response to adjuvant temozolomide for primary glioblastoma. PLoS ONE 2020, 15, e0230492. [Google Scholar] [CrossRef] [Green Version]
  45. Pérez-Beteta, J.; Molina-García, D.; Ortiz-Alhambra, J.A.; Fernández-Romero, A.; Luque, B.; Arregui, E.; Calvo, M.; Borrás, J.M.; Meléndez, B.; Rodríguez de Lope, Á.; et al. Tumor surface regularity at MR imaging predicts survival and response to surgery in patients with glioblastoma. Radiology 2018, 288, 218–225. [Google Scholar] [CrossRef]
  46. Amelot, A.; Deroulers, C.; Badoual, M.; Polivka, M.; Adle-Biassette, H.; Houdart, E.; Carpentier, A.F.; Froelich, S.; Mandonnet, E. Surgical decision making from image-based biophysical modeling of glioblastoma: Not ready for primetime. Neurosurgery 2017, 80, 793–799. [Google Scholar] [CrossRef]
  47. Pérez-García, V.M.; Calvo, G.F.; Bosque, J.J.; León-Triana, O.; Jiménez, J.; Pérez-Beteta, J.; Belmonte-Beitia, J.; Valiente, M.; Zhu, L.; García-Gómez, P.; et al. Universal scaling laws rule explosive growth in human cancers. Nat. Phys. 2020, 16, 1232–1237. [Google Scholar] [CrossRef]
  48. Joiner., M.C.; Van der Kogel, A.J. Basic Clinical Radiobiology; CRC Press: Boca Raton, FL, USA, 2018. [Google Scholar]
  49. Lorenzo, G.; Pérez-García, V.M.; Mariño, A.; Pérez-Romasanta, L.A.; Reali, A.; Gomez, H. Mechanistic modelling of prostate- specific antigen dynamics shows potential for personalized prediction of radiation therapy outcome. J. R. Soc. Interface 2019, 16, 20190195. [Google Scholar] [CrossRef] [Green Version]
  50. Kim, M.S.; Kim, W.; Park, I.H.; Kim, H.J.; Lee, E.; Jung, J.H.; Cho, L.C.; Song, C.W. Radiobiological mechanisms of stereotactic body radiation therapy and stereotactic radiation surgery. Radiat. Oncol. J. 2015, 33, 265–275. [Google Scholar] [CrossRef] [Green Version]
  51. Brown, J.M.; Carlson, D.J.; Brenner, D.J. The tumor radiobiology of SRS and SBRT: Are more than the 5 Rs involved? Int. J. Radiat. Oncol. Biol. Phys. 2014, 88, 254–262. [Google Scholar] [CrossRef] [Green Version]
  52. Rock, K.L.; Kono, H. The inflammatory response to cell death. Annu. Rev. Pathol. 2008, 3, 99–126. [Google Scholar] [CrossRef]
  53. Berghoff, A.S.; Lassmann, H.; Preusser, M.; Höftberger, R. Characterization of the inflammatory response to solid cancer metastases in the human brain. Clin. Exp. Metastasis 2013, 30, 69–81. [Google Scholar] [CrossRef]
  54. Jiang, J.; Wu, L.; Yuan, F.; Ji, J.; Lin, X.; Yang, W.; Wu, J.; Shi, M.; Yang, H.; Ma, Y.; et al. Characterization of the immune microenvironment in brain metastases from different solid tumors. Cancer Med. 2020, 9, 2299–2308. [Google Scholar] [CrossRef] [Green Version]
  55. Kudo, Y.; Haymaker, C.; Zhang, J.; Reuben, A.; Duose, D.Y.; Fujimoto, J.; Roy-Chowdhuri, S.; Solis Soto, L.M.; Dejima, H.; Parra, E.R.; et al. Suppressed immune microenvironment and repertoire in brain metastases from patients with resected non-small-cell lung cancer. Ann. Oncol. 2019, 30, 1521–1530. [Google Scholar] [CrossRef] [Green Version]
  56. Vellayappan, B.; Tan, C.L.; Yong, C.; Khor, L.K.; Koh, W.Y.; Yeo, T.T.; Detsky, J.; Lo, S.; Sahgal, A. Diagnosis and management of radiation necrosis in patients with brain metastases. Front. Oncol. 2018, 8, 395. [Google Scholar] [CrossRef]
  57. Kohutek, Z.A.; Yamada, Y.; Chan, T.A.; Brennan, C.W.; Tabar, V.; Gutin, P.H.; Yang, T.J.; Rosenblum, M.K.; Ballangrud, Å.; Young, R.J.; et al. Long-term risk of radionecrosis and imaging changes after stereotactic radiosurgery for brain metastases. J. Neurooncol. 2015, 125, 149–156. [Google Scholar] [CrossRef] [Green Version]
  58. Donovan, E.K.; Parpia, S.; Greenspoon, J.N. Incidence of radionecrosis in single-fraction radiosurgery compared with fractionated radiotherapy in the treatment of brain metastasis. Curr. Oncol. 2019, 26, e328–e333. [Google Scholar] [CrossRef] [Green Version]
  59. Liu, Y.; Ye, G.; Huang, L.; Zhang, C.; Sheng, Y.; Wu, B.; Han, L.; Wu, C.; Dong, B.; Qi, Y. Single-cell transcriptome analysis demonstrates inter-patient and intra-tumor heterogeneity in primary and metastatic lung adenocarcinoma. Aging 2020, 12, 21559–21581. [Google Scholar] [CrossRef]
  60. Shih, D.J.H.; Nayyar, N.; Bihun, I.; Dagogo-Jack, I.; Gill, C.M.; Aquilanti, E.; Bertalan, M.; Kaplan, A.; D’Andrea, M.R.; Chukwueke, U.; et al. Genomic characterization of human brain metastases identifies drivers of metastatic lung adenocarcinoma. Nat Genet 2020, 52, 371–377. [Google Scholar] [CrossRef]
  61. Perus, L.J.M.; Walsh, L.A. Microenvironmental heterogeneity in brain malignancies. Front. Immunol. 2019, 10, 2294. [Google Scholar] [CrossRef]
  62. Akimoto, T.; Hunter, N.R.; Buchmiller, L.; Mason, K.; Ang, K.K.; Milas, L. Inverse relationship between epidermal growth factor receptor expression and radiocurability of murine carcinomas. Clin. Cancer Res. 1999, 5, 2884–2890. [Google Scholar]
  63. Choi, S.H.; Yang, H.; Lee, S.H.; Ki, J.H.; Nam, D.H.; Yoo, H.Y. TopBP1 and Claspin contribute to the radioresistance of lung cancer brain metastases. Mol. Cancer. 2014, 13, 211. [Google Scholar] [CrossRef] [Green Version]
  64. Stella, G.M.; Corino, A.; Berzero, G.; Kolling, S.; Filippi, A.R.; Benvenuti, S. Brain metastases from lung cancer: Is MET an actionable target? Cancers 2019, 11, 271. [Google Scholar] [CrossRef] [Green Version]
  65. Duregon, E.; Senetta, R.; Pittaro, A.; Verdun di Cantogno, L.; Stella, G.; De Blasi, P.; Zorzetto, M.; Mantovani, C.; Papotti, M.; Cassoni, P. CAVEOLIN-1 expression in brain metastasis from lung cancer predicts worse outcome and radioresistance, irrespective of tumor histotype. Oncotarget 2015, 6, 29626–29636. [Google Scholar] [CrossRef] [Green Version]
  66. Soffietti, R.; Ahluwalia, M.; Lin, N.; Rudà, R. Management of brain metastases according to molecular subtypes. Nat. Rev. Neurol. 2020, 16, 557–574. [Google Scholar] [CrossRef]
  67. Ahmed, K.A.; Berglund, A.E.; Welsh, E.A.; Naghavi, A.O.; Kim, Y.; Yu, M.; Robinson, T.J.; Eschrich, S.A.; Johnstone, P.A.S.; Torres-Roca, J.F. The radiosensitivity of brain metastases based upon primary histology utilizing a multigene index of tumor radiosensitivity. Neuro Oncol. 2017, 19, 1145–1146. [Google Scholar] [CrossRef] [Green Version]
  68. Smart, D.; Garcia-Glaessner, A.; Palmieri, D.; Wong-Goodrich, S.J.; Kramp, T.; Gril, B.; Shukla, S.; Lyle, T.; Hua, E.; Cameron, H.A.; et al. Analysis of radiation therapy in a model of triple-negative breast cancer brain metastasis. Clin. Exp. Metastasis 2015, 32, 717–727. [Google Scholar] [CrossRef]
  69. Voglstaetter, M.; Thomsen, A.R.; Nouvel, J.; Koch, A.; Jank, P.; Navarro, E.G.; Gainey-Schleicher, T.; Khanduri, R.; Groß, A.; Rossner, F.; et al. Tspan8 is expressed in breast cancer and regulates E-cadherin/catenin signalling and metastasis accompanied by increased circulating extracellular vesicles. J. Pathol. 2019, 248, 421–437. [Google Scholar] [CrossRef]
  70. Wingrove, E.; Liu, Z.Z.; Patel, K.D.; Arnal-Estapé, A.; Cai, W.L.; Melnick, M.A.; Politi, K.; Monteiro, C.; Zhu, L.; Valiente, M.; et al. Transcriptomic hallmarks of tumor plasticity and stromal interactions in brain metastasis. Cell Rep. 2019, 27, 1277–1292.e7. [Google Scholar] [CrossRef] [Green Version]
  71. Toma-Dasu, I.; Dasu, A. Modelling Tumour Oxygenation, Reoxygenation and Implications on Treatment. Comput. Math. Methods Med. 2013, 141087. [Google Scholar] [CrossRef] [Green Version]
  72. Rockne, R.C.; Trister, A.D.; Jacobs, J.; Hawkins-Daarud, A.J.; Nean, M.L.; Hendrickson, K.; Mrugala, M.M.; Rockhill, J.K.; Kinahan, P.; Krohn, K.A.; et al. A patient-specific computational model of hypoxia-modulated radiation resistance in glioblastoma using 18F-FMISO-PET. J. R. Soc. Interface 2015, 12, 20141174. [Google Scholar] [CrossRef] [PubMed] [Green Version]
  73. Lewin, T.D.; Maini, P.K.; Moros, E.G.; Enderling, H.; Byrne, H.M. The evolution of tumour composition during fractionated radiotherapy: Implications for outcome. Bull. Math. Biol. 2018, 80, 1207–1235. [Google Scholar] [CrossRef] [Green Version]
  74. Kuznetsov, M.; Kolobov, A. Optimization of dose fractionation for radiotherapy of a solid tumor with account of oxygen effect and proliferative heterogeneity. Mathematics 2020, 8, 1204. [Google Scholar] [CrossRef]
  75. Hessel, F.; Petersen, C.; Zips, D.; Krause, M.; Pfitzmann, D.; Thames, H.D.; Baumann, M. Impact of increased cell loss on the repopulation rate during fractionated irradiation in human FaDu squamous cell carcinoma growing in nude mice. Int. J. Radiat. Biol. 2003, 79, 479–486. [Google Scholar] [CrossRef]
  76. Hanin, L.; Rose, J. Suppression of metastasis by primary tumor and ac- celeration of metastasis following primary tumor resection: A natural law? Bull. Math. Biol. 2018, 80, 519–539. [Google Scholar] [CrossRef]
  77. Franssen, L.C.; Lorenzi, T.; Burgess, A.E.F.; Chaplain, M.A.J. A mathematical framework for modelling the metastatic spread of cancer. Bull. Math. Biol. 2019, 81, 1965–2010. [Google Scholar] [CrossRef] [Green Version]
  78. Hanin, L.; Zaider, M. A mechanistic description of radiation-induced damage to normal tissue and its healing kinetics. Phys. Med. Biol. 2013, 58, 825–839. [Google Scholar] [CrossRef] [PubMed]
  79. Essig, M.; Waschkies, M.; Wenz, F.; Debus, J.; Hentrich, H.R.; Knopp, M.V. Assessment of brain metastases with dynamic susceptibility-weighted contrast-enhanced MR imaging: Initial results. Radiology 2003, 228, 193–199. [Google Scholar] [CrossRef]
  80. Barajas, R.F.; Chang, J.S.; Sneed, P.K.; Segal, M.R.; McDermott, M.W.; Cha, S. Distinguishing recurrent intra-axial metastatic tumor from radiation necrosis following gamma knife radiosurgery using dynamic susceptibility-weighted contrast-enhanced perfusion MR imaging. AJNR Am. J. Neuroradiol. 2009, 30, 367–372. [Google Scholar] [CrossRef] [Green Version]
  81. Salkeld, A.L.; Hau, E.K.C.; Nahar, N.; Sykes, J.R.; Wang, W.; Thwaites, D.I. Changes in brain metastasis during radiosurgical planning. Int. J. Radiat. Oncol. Biol. Phys. 2018, 102, 727–733. [Google Scholar] [CrossRef]
  82. Garcia, M.A.; Anwar, M.; Yu, Y.; Duriseti, S.; Merritt, B.; Nakamura, J.; Hess, C.; Theodosopoulos, P.V.; McDermott, M.; Sneed, P.K.; et al. Brain metastasis growth on preradiosurgical magnetic resonance imaging. Pract. Radiat. Oncol. 2018, 8, e369–e376. [Google Scholar] [CrossRef] [PubMed]
Figure 1. Schematic description of the compartments included in Equations (1)–(4) and the effect of radiosurgery. Different cellular compartments appear after stereotactic radio surgery (SRS) on metastatic cells. Proliferating cells P ( t ) continue to grow at a rate ρ . Damaged cells D ( t ) become necrotic N ( t ) at a rate of ρ / k because of the mitotic catastrophe. Necrosis stimulates the immune cell I ( t ) activation with a stimulation parameter α and is removed by its interaction with them. Immune cells are inactivated with a decay rate λ I .
Mathematics 09 00716 g001
Figure 2. Evolution of tumor response for three brain metastasis (BM) patients. Left subplots show characteristic two-dimensional slices of the contrast-enhanced T1-weighted MRI scans showing the metastasis response to SRS for different times (in days) starting from a baseline pretreatment scan (taken to be t = 0 days). Subplots in (a) and (c) show axial slices, and subplots in (b) show coronal slices. Green boxes containing the tumors are shown to help locate them. Panels in the rightmost column show the volumetric longitudinal data obtained from the 3D segmentations (red dots) and the best fits (blue lines) obtained using the mathematical model of Equations (1)–(4). The model parameters obtained for the best fits are (a) S f = 0.02 × 10 2 , ϵ = 0.90 , ρ = 0.01 , λ N = 0.06 , λ I = 0.07 , α = 0.10 ; (b) S f = 0.12 × 10 1 , ϵ = 0.60 , ρ = 0.02 , λ N = 0.20 , λ I = 0.01 , α = 0.04 ; and (c) S f = 0.40 , ϵ = 0.10 , ρ = 0.01 , λ N = 0.01 , λ I = 0.10 , α = 0.01 .
Mathematics 09 00716 g002
Figure 3. Examples of longitudinal volumetric tumor data (red circles) and best fits obtained with the model (1)–(4) (blue lines) for patients showing (ac) monotonically decreasing lesions (MDLs), (df) lesions that are first decreasing and later increasing (DILs) and (gi) monotonically increasing lesions (MILs). The vertical dashed red lines mark the radiosurgery date. All times are measured in months from the baseline pretreatment scan.
Mathematics 09 00716 g003
Figure 4. Early inflammation occurs in the early response after surgery. The subplots (a) and (b) show the dynamics of the proliferating cells (green line), damaged cells (magenta line), necrotic cells (black line), immune cells (yellow line) and total tumor cells (blue line) of two patients, governed by Equations (1)–(4). Red circles represent the tumor volume measurement, and dashed red lines mark the radiosurgery date. (c) Histogram and distribution function of T ( I m a x ) for the model fits of 42 BMs.
Mathematics 09 00716 g004
Figure 5. Mean square errors of the best fits of the model (1)–(4) to the metastasis volumetric data for the 42 metastases showing a monotonous decrease (MDL), decrease first and later increase (DIL), monotonous increase (MIL) and early inflammation in response to SRS. The formula used is given by the expression MSE = 1 n i = 1 n ( V ^ i V i ) 2 , where n is the total number of follow-up MRIs performed for each metastases, V i is the segmented volume of scan i and V ^ i is the volume estimated with the model at the time of scan i.
Mathematics 09 00716 g005
Figure 6. Late inflammatory response and result of model fit. (a,b) Tumor volumetric longitudinal dynamics (solid red circles) for two patients receiving radiosurgery and best fits obtained using either Equations (1)–(4) (dashed blue lines) or Equations (1)–(3) and (9) (solid blue line). Vertical dashed red lines represent the SRS date. Best fits for the healthy tissue damage were obtained in the first case by (c) h ( t ) = 130 × N ( 20 , 2.3 ) and (d) h ( t ) = 6.5 × N ( 12 , 2.3 ) . MSE obtained when fitting the model to the group of 18 BMs using (e) Equations (1)–(4) and (f) Equations (1)–(3) and (9).
Mathematics 09 00716 g006
Figure 7. Real longitudinal dynamics of three BMs and of the different compartments after SRS according to the model (1)–(4). Red dots in panels (ac) represent the longitudinal tumor volumetric data for the three BMs chosen. Solid blue lines show the best fits obtained using the model Equations (1)–(4). The second column (df) shows radiosurgery response for proliferating cells (green line), damaged cells (magenta line), necrotic cells (black line) and immune cells (yellow line) obtained from the model. Dashed red lines mark the date of SRS, and vertical black lines mark the time of tumor progression as calculated by Equation (10).
Mathematics 09 00716 g007
Publisher’s Note: MDPI stays neutral with regard to jurisdictional claims in published maps and institutional affiliations.

