Abstract
The difficulties of predictive maintenance of power grids are related to the large spread of electrical infrastructures and the definition of early warning indicators. Such indicator is the partial discharge activities—which can be very informative about the rising insulation problems of electrical materials. However, the detection and the localization of the partial discharges are very complicate tasks and are currently subject to intensive studies in both theoretical and practical domains. The traditional way to approach the global surveillance of partial discharge sources is to first detect it and the second is to attempt to localize their positions. Despite the numerous proposed approaches, based on advanced transient signal processing tools, there is no any operational technique to efficiently asses the partial discharge sources in a real power network. In this context, our paper proposes a new approach based on the global evaluation of entropy of transient phenomena detected in a power network, without needing any localization of the sources of these phenomena. We will show that this approach provides an effective evaluation of partial discharges sources. Moreover, since the technique requires a reduced number of sensors, it is very advantageous to use in real contexts.
1. Introduction
In the last few years, more and more research has been conducted on the study of the systems we depend on in our daily lives from the perspective of analyzing their operation in order to obtain information on possible defects and degradations that can lead to system problems [1,2,3,4]. A typical case where this type of research is conducted is the surveillance of the power networks.
This is a crucial operation for maintaining the security of energy supply, and is vital for all economic (industry, transport, telecommunications, etc.) and social (supplying energy to individuals) activities. The major issue is the early warning of the sources of problems, which, if not detected, will cause power failures with significant losses. Network managers are faced with an aging network that must withstand two-way demands, in particular from intermittent energy production. In this context, the continuous monitoring of electrical networks with distributed sensors is the solution that is being globally explored, with several new technologies currently in the study and development phase. The distributed sensors are generally aimed to detect the partial discharge activities, which represent early signs of faults that could become problematic in time [5]. In this context, the accurate detection of partial discharge activity is nowadays a general research topic of great interest, both theoretical and practical.
The detection techniques used are generally energetic, with thresholds determined for each type of configuration (also called energy-based detection methods) and, using GPS technology, they can allow for the localization of the sources [6]. Another type of approach is based on the projection on dictionaries (wavelets, for example), which amounts to detecting the presence of a transient via its resemblance to the waveforms of the dictionary [7]. Both the energy-based and wavelet methods have been studied and compared in the field of partial discharges detection [8].
In order to characterize a transient phenomenon, new methods have been developed that complement those listed above. The most important are based on a new space of interpretation that exploits the sparsity of the transient given by compressive sensing [9,10], the phase diagram analysis as way to analyze electrical transients [11], and the entropy defined in the time-frequency domain [12]. In this state-of-the-art context, the idea behind our contribution is to consider the entropy as a statistical notion of the system that can highlight the specific time where transient phenomena occur. Through this, we manage to perform a scan of the entire system in terms of transient generated, thus being able to identify various disruptive sources that do not find their place in the normal operating conditions of the system. We will show that this entropy-based approach makes important contributions to existing techniques from the perspective of system scanning and analysis of acquired signals, and we will show that it can be easily used in characterizing existing systems.
The structure of the paper shows the following: Section 2 presents the signal model considered in this paper as well as the methods we propose, and Section 3 describes the results obtained by applying the methods of analysis and performance. Section 4 discusses the interpretation of the obtained results, and the Section 5 presents the conclusions of this paper and the future perspectives that are foreseen.
2. Signal Processing Methods
The monitoring of large size systems, such as a power network, is nowadays a challenging topic from different perspectives: sensing strategy, information management, and decision, but all of these are asking for signal analysis methods able to extract useful signals (corresponding to faults) from the observed signals that also contain coherent components, often much stronger than the useful signals. In the context of a power network, monitoring useful signals corresponds to partial discharge’s appearing at an arbitrary range with respect of the sensing point—Figure 1. At the same time, very close to sensing points (placed generally at the main substation level), we receive signals corresponding to loads and, because of the proximity with sensing point, they are much more energetic than the useful signals.
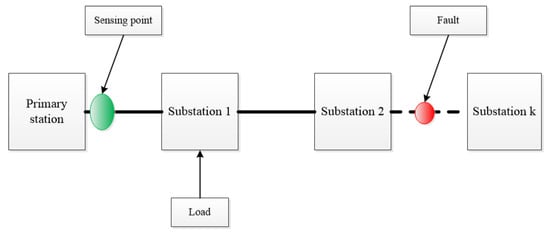
Figure 1.
Block diagram of an electrical network.
This system’s behavior can be expressed in terms of the sensed signal model as:
where is the signal close to the sensing point that is usually not subject to propagation, is the signal specific to partial discharge and can be described by Equation (2), and N is the amount of noise added.
The description of the partial discharge signal includes one parameter for modeling the propagation effect and the local transient specific to the partial discharge . For instance, if we have only a delay and attenuation on the cable, will be defined according to the mathematical relation:
In order to detect these weak useful signals, our approach is to evaluate the entropy variation at a global level based on the following consideration: if the event of the useful signals is weaker than the corrupting one, then they are propagating in the system and the effect of the propagation (reflection but also dispersion) will add natural behavior that will modify the entropy of the entire system. Using this information, we can highlight the time moments in which different transient signals appear in the analyzed system. This will be useful for the control part of the network, so different decisions can be made regarding the maintenance of the network. For our studies, two definitions of the entropy are: classical spectral entropy and phase diagram-based entropy estimation.
2.1. Spectral Entropy
The spectral entropy is a method used in the signal processing field in order to express the spectral distribution of power for an analyzed signal [13]. Starting from a signal , it is necessary to determine its power spectrum :
where represents the discrete Fourier Transform of the signal. To compute the instantaneous spectral entropy, it is necessary to convert the spectrum into a probability density function, which can be performed by normalization over all frequency components, using Equation (5). In order to be able to highlight the evolution of the spectral entropy in time, we are interested in its value in each moment of time from the analyzed signal.
where is the probability distribution at time t and is the time-frequency power spectrogram [13]. Then the spectral entropy at time t is determined by the equation:
Using the propriety of estimating the uniformity of signal power distribution in the frequency domain, this method was used to differentiate different faults [14,15]. Its main advantage consists of highlighting the changes that take place in the evolution of a system. Thus, we can quantify the time moments specific to signals of interest.
2.2. Phase Diagram-Based Entropy
The phase diagram analysis is a method used in non-linear data analysis in order to characterize a dynamical system [16,17]. Based on the advantage of not having a data analysis model, it can indicate changes in system behavior based on certain nonlinear properties. Starting from the studied signal in the form of a time series, we move on to a representation in a multidimensional space, with the help of vectors .
where are the phase space vectors, are the axis unit vectors, m is the embedding dimension, is the delay between the samples, and , with as the length of the time series. Usually, the delay is computed using the false nearest neighbor method [18,19] or the multi-lag phase-space analysis [20,21]. The embedding dimension is chosen using the false nearest neighbor method [18,19]. In order to be able to reach the statistical result of interest, it is necessary to evaluate all the samples of the signal, a fact for which the value 1 is chosen for the delay.
For each vector in the phase space, it is possible to create a quantity with the help of the degree of similarity between the vector and another vector of the space , which can be verified [22] by the equation:
where is the Heaviside function, is a threshold value, and is the operator of Euclidean distance.
The logarithm of the expression is computed:
and from here, the phase diagram-based entropy is defined by the equation:
The tolerance threshold r does not have an exact value; it is often defined as a percentage of the standard deviation of the analyzed time series.
3. Results
In order to develop the considerations highlighted in Section 2, in this paper, we considered testing the methods using simulated signals and real signals obtained from the realization of a reduced scale facility of an electrical network.
3.1. Normal and Faulty Operation of the Electrical Network in Simulation
For the simulation part, two cases are studied, one that reflects normal operation and one that reflects malfunction. The malfunction signal consists of a Gaussian transient specific to an external load and two defects equivalent to two partial discharges. One defect is located on the positive side and another on the negative side of the axis. The signal has a sampling frequency of 10 KHz, a duration of 300 ms, and a white noise signal with a variance of 0.02 was added over it. The normal operation signal is a white noise signal with a variance of 0.02, which is of the same length as the previous signal. Both signals can be seen in Figure 2.
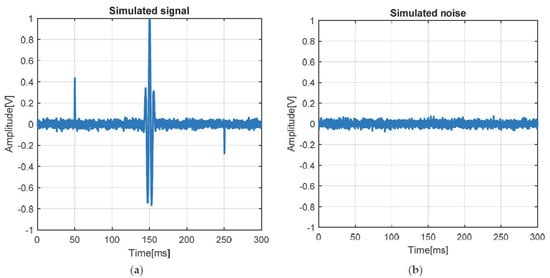
Figure 2.
(a) The simulated network signal; (b) the simulated noise.
The first method of analysis used is spectral entropy. Using the two available signals, their spectral entropy is calculated by calculating the instantaneous spectral entropy for each time moment from the analyzed signal. In Figure 3, a comparison was made between the two cases. The white noise signal has the highest spectral entropy. If the analyzed signal contains information, in our case, faults, the spectral entropy decreases, so the two signals can be distinguished. It is also possible to determine the time moments at which the two defects appear, at the values 50 ms and 250 ms.
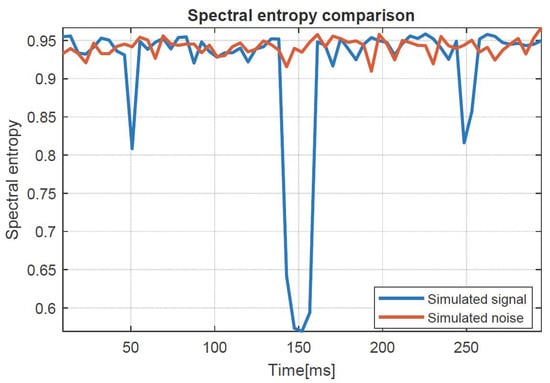
Figure 3.
Spectral entropy of the two simulated signals.
The following considerations were used to use the secondary method. First, a 20-sample analysis window was chosen. This window was slid with one sample for the entire duration of the signal. The window covers the entire signal specific to a fault in the network and was used as a signal that will be represented with the phase diagram method. Using the algorithm described in Section 2, it was possible to calculate the phase diagram-based entropy in each sliding analysis window. By concatenating the values, it was possible to obtain the graphs from Figure 4 specific to the two analyzed signals. In order to choose the parameter of the threshold used, a value of 0.2 from the window variance was used.
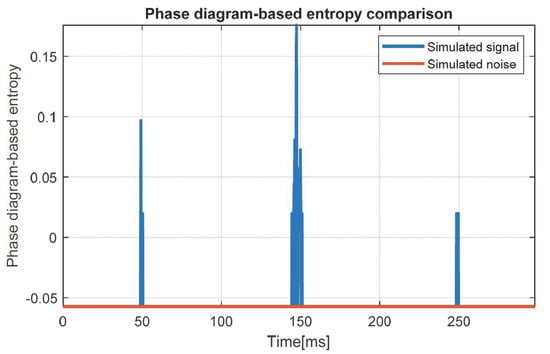
Figure 4.
Phase diagram-based entropy of the two simulated signals for .
As can be seen in Figure 4, we can identify the time of appearance of a defect in the network because, at that time, the phase diagram-based entropy has a significant increase compared to the time when we have no additional activity on the analyzed signal.
3.2. Normal and Faulty Operation of the Electrical Network in Real Case
In order to study the methods on a real, practical system, a benchmark of a three-phase electrical power network with two workstations was used, which provided the signals of interest, as it can be seen in Figure 5.
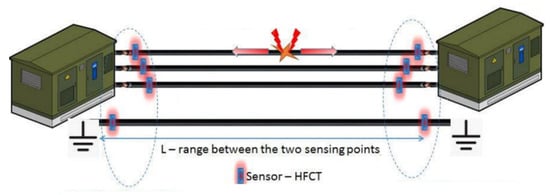
Figure 5.
The experimental benchmark.
Network monitoring and signal acquisition were performed via TiePie acquisition and preprocessing boards (https://www.tiepie.com/ accessed on 21 February 2021) and high frequency current transformer sensors. The acquisition board has four inputs, one for each sensor. Three sensors were positioned on the three electrical cables specific to the network phases and one sensor on the ground. In the first phase, a visual analysis of the signals carried in the network was performed using the Handyscope HS4 USB oscilloscope.
With its help, it was possible to perform a scan of the entire evaluated network. This system is shown in Figure 6. After ascertaining the existence of the partial discharge signals, the signals were recorded, and the two methods of analysis discussed were applied to them.
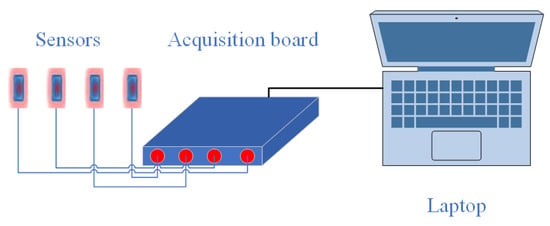
Figure 6.
The acquisition and monitoring system.
Figure 7 shows a comparison in the time domain of the two states of the analyzed electrical network. It also observes, on the left side, the appearance of two partial discharges over the signal transmitted through the network around 2 ms. The signals were acquired from a power distribution network at a sampling frequency of 6.25 MHz and have a duration of 5 ms.
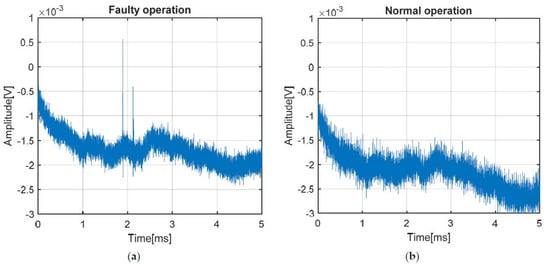
Figure 7.
(a) Faulty operation of the system; (b) normal operation of the system.
Using the graphs in Figure 8, it can be observed that the spectral entropy can be used to determine the moments of time in which changes occur in the state of the system; the two maximums were discovered corresponding to the two partial discharges. Thus, an analysis of the activity carried out on the cables of the electrical network can be performed.
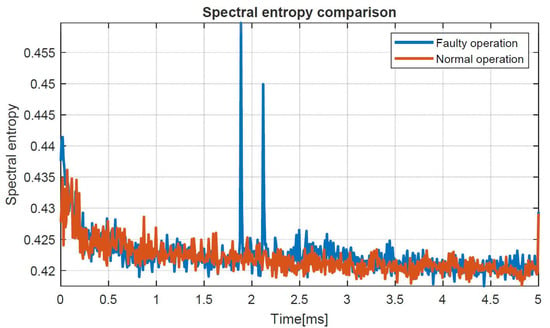
Figure 8.
The spectral entropy of the two analyzed states of the system.
With the help of the phase diagram-based entropy, the appearance of partial discharges in the network is highlighted. As can be seen in Figure 9, the two maxima of the phase diagram-based entropy render the two specific moments of the occurrences of the faults. The threshold used is a sensitive parameter and, depending on its value, the result has a more or less high accuracy. In order to calculate the phase diagram-based entropy, a value of 0.6 from the sliding window variance was used.
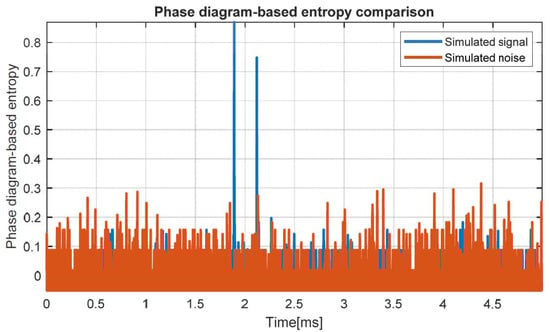
Figure 9.
The phase diagram-based entropy of the two analyzed states of the system for .
3.3. Characterization of the Faulty Condition of the Electrical Network
In order to further analyze the faulty state of the system, in addition to the real signal captured by the network, we also studied a calibration case by introducing a rectangular pulse in the network. As parameters, the signal had a pulse width of 1 us at a repetition period of 1 ms. We chose this signal in order to be able to study the effect of signal distortion in terms of partial discharges, with the two cases being observed below. The signal was generated with the signal generator built into the Handyscope HS5 USB oscilloscope equipment and was introduced into the analyzed electrical network. The purpose of the calibration operation was to introduce in a controlled manner electrical signals in the network, which when subjected to deformations due to propagation will be similar to the partial discharge signals. Zooming in on the two signals from Figure 10 shows both the discharge and its reflection on the cable.
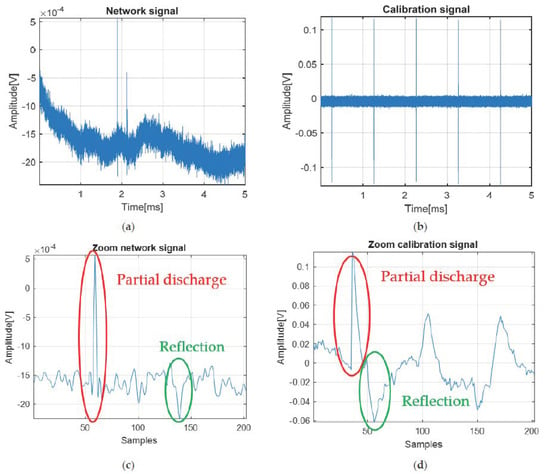
Figure 10.
(a) Network signal; (b) calibration signal; (c) zoom of the network signal; (d) zoom of the calibration signal.
In the study of these two cases, in addition to the two methods that we proposed, we compared the results obtained with a state-of-the-art technique widely used for partial discharge detection: spectrogram approach. To determine the spectrogram of the signals, we considered the following parameters: a Hamming window of 64 samples size, the number of overlapped samples 60, and the number of Fast Fourier Transform points 64. After which, the sum of the columns was applied to the spectrogram, and the detection curves from Figure 11 were obtained.
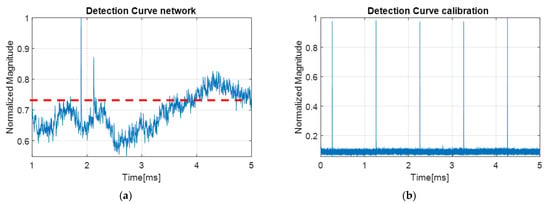
Figure 11.
(a) Detection curve using spectrogram approach for the network signal; (b) detection curve using spectrogram approach for the calibration signal.
As can be seen, this method does not always offer high performance. In the case of the calibration signal, the time moments of the occurrence of the transients are detected. In the case of the network signal, although the two-time moments of the transients are highlighted, there are problems in choosing the detection threshold. This can lead to false alarms in the detection process.
It is observed in Figure 12 that the spectral entropy provides the answers we need regarding the detection of time moments corresponding to cable activities that are not part of the normal functioning of the network.
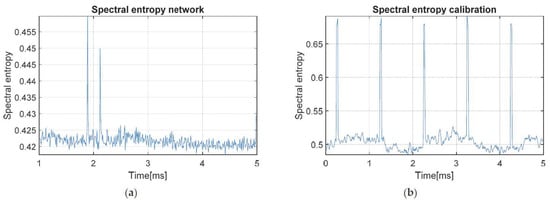
Figure 12.
(a) Spectral entropy of the network signal; (b) spectral entropy of the calibration signal.
By isolating each signal of interest, we can make a transition to the representation plan of the phase diagram, and the representations for the two partial discharges and two reflections can be observed. In Figure 13, we can see the four representations in the phase space. In order to reach these results, the optimal value equal to m = 3 for the encapsulation size was determined with the help of false nearest neighbors and, for the time delay, the value d = 1 was chosen so that it corresponds to the implications of the algorithm for determining the phase diagram-based entropy. It is observed that each analyzed signal class has a unique representation in this space, a specific pattern that each type of signal analyzed follows from the perspective of the trajectory. Using the information provided by the phase diagram and the fact that each type of detected signal has a different representation, we can identify for each signal its generating source. Thus, specific signal classes can be made (for example: transients, sag, swell, harmonics, etc.). In this sense, the signal specific to the partial discharge can be separated from the other existing signals in the network.
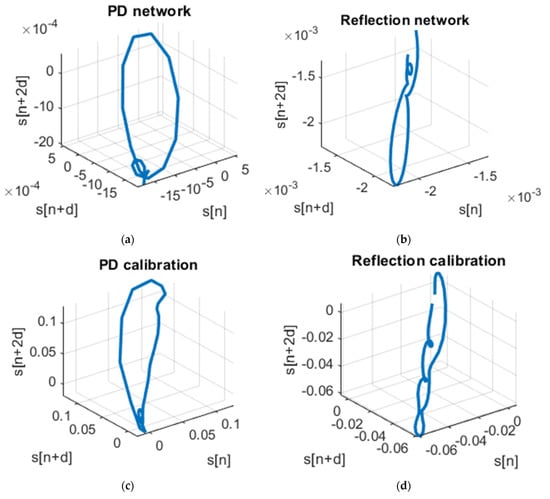
Figure 13.
(a) Partial discharge from the network signal: d = 1, m = 3; (b) reflection of partial discharge from the network signal: d = 1, m = 3; (c) partial discharge from the calibration signal: d = 1, m = 3; (d) reflection of partial discharge from the calibration signal: d = 1, m = 3.
In order to characterize the analyzed electrical network based on the phase diagram-based entropy, a sliding window was implemented through, with which successive signal pieces will be analyzed based on the representation in the phase diagram. The results obtained can be viewed in Figure 14.

Figure 14.
(a) Phase diagram-based entropy of the network signal for ; (b) phase diagram-based entropy of the calibration signal for .
It is observed that the phase diagram-based entropy can be used to discover a change in the signal trajectory, which leads to the appearance of a foreign signal in the analyzed network, highlighting all the triggering moments for them.
As these results indicate that the transients are properly detected, which allows an accurate estimation of the times of arrival of the transient waves received in different sensing points of the network.
For the localization part, the concept presented in [23] can be used. Off course, the localization of the partial discharge sources is a very important aspect in the diagnostic of power cables. There are two main elements ensuring the accuracy of the localization procedure. The first one is the proper detection of any transient that naturally will conduct to accurate estimation of the times of arrival of the detected transient waves. The second element—the accurate synchronization (using GPS-based systems) between the sensing points of the network as well as the geometrical configuration of the sensing points—will allow the localization of transient sources. Nevertheless, for underground cables, the synchronization is a major problem. This is why the work proposed in [23] is referenced as a potential way to accurately localize the transient sources in a network. In this paper, we address only the detection problem, which is the main requirement allowing for the accurate localization via the innovation proposed in [23].
4. Discussion
The choice of monitoring electrical cables is based on the fact that at the moment we are dependent on many electrical applications. Because of this, the part of preventing major defects plays an extremely important role. Decisions regarding the operating status of electrical cables must be made in a timely manner, so that no downtime occurs in the operation of a system.
To achieve this, several methods of analysis can be used, each with its own advantages and disadvantages. The two methods of statistical analysis described in this paper have the following main advantages: the signal processing is carried out in a simplistic manner; no additional processing of intermediate results is needed so that we reach a conclusion, and the accuracy of the results is high, as we are able to identify each activity that takes place on the cable.
It has been shown that using spectral entropy can distinguish between two states of a system; moreover, it is a good detection method, with a low computational time to determine possible activities that may occur on an electrical cable.
The analysis based on the extraction of information related to the phase diagram-based entropy from the nonlinear phase space completes and strengthens the detection part of the methods. By using this approach, there is the possibility of assigning spatial characteristics to the signals detected by representing them using the phase diagram method.
5. Conclusions
This paper is based on the analysis and statistical interpretation of an electrical system, according to which a characterization of its operating state can be made.
Two statistical methods based on entropy were studied so that there is a common reference point in the analysis. As entropy is the most pertinent measure to characterize a system, it can provide us with sufficient information in order to make a decision based on statistical interpretation.
In this paper, an entropy-based algorithm is proposed for the accurate detection of defective activities on an electric cable. Spectral entropy and phase diagram-based entropy are used as a major feature to separate cable activities from voltage signal or noise signals.
Particular attention must be paid to the choice of the threshold parameter from the calculation of the phase diagram-based entropy. By not having a fixed value, its value can vary, and the results obtained can be influenced in terms of accuracy.
Another important parameter that can lead to uncertain results is the size of the sliding window used. If the window is too small, it will not be able to capture the entire activity, which will make it impossible to perform detection, and if the window is too large problems will occur related to the exact determination of the time of activity, introducing false detection times.
Future work is based on the integration of machine learning elements in this approach, creating an automated system so that all detected activities can be characterized and classified.
Also, a future research direction will be based on the extraction of some parameters and estimators from the phase diagram and the implementation of new ways of quantifying the information provided by it. Thus, the process of classification and characterization of the signals will become easier, and we will give up the visual stage of the diagrams.
Author Contributions
Conceptualization, D.S., A.D. and C.I.; methodology, D.S.; software, D.S.; validation, A.D., C.I. and A.S.; formal analysis, D.S.; investigation, D.S., A.D.; resources, C.I.; data curation, C.I.; writing—original draft preparation, D.S.; writing—review and editing, A.D. and C.I.; visualization, D.S.; supervision, A.S.; project administration, A.D.; funding acquisition, C.I. All authors have read and agreed to the published version of the manuscript.
Funding
This research was funded by Région Auvergne-Rhone-Alpes, grant number CLASS_T 2019 and the ALTRANS company (https://www.altransinnov.com accessed on 21 February 2021).
Institutional Review Board Statement
Not applicable.
Informed Consent Statement
Not applicable.
Data Availability Statement
The data presented in this study can be found on the ALTRANS company site: https://www.altransinnov.com/poc.html accessed on 17 March 2021.
Acknowledgments
This work has been realized in the CLASS_T project framework, supported by the Auvergne-Rhone-Alpes Region funding—Pack Ambition Recherche program. The authors are very thankful to the ALTRANS start-up (https://www.altransinnov.com accessed on 21 February 2021) for the access to their experimental facilities.
Conflicts of Interest
The authors declare no conflict of interest.
References
- Heitkoetter, W.; Medjroubi, W.; Vogt, T.; Agert, C. Comparison of Open Source Power Grid Models—Combining a Mathematical, Visual and Electrical Analysis in an Open Source Tool. Energies 2019, 12, 4728. [Google Scholar] [CrossRef]
- Mar, A.; Pereira, P.; Martins, J.F. A Survey on Power Grid Faults and Their Origins: A Contribution to Improving Power Grid Resilience. Energies 2019, 12, 4667. [Google Scholar] [CrossRef]
- Cai, G.; Wang, L.; Yang, D.; Sun, Z.; Wang, B. Harmonic Detection for Power Grids Using Adaptive Variational Mode Decomposition. Energies 2019, 12, 232. [Google Scholar] [CrossRef]
- Shaik, A.G.; Mahela, O.P. Power Quality Assessment and Event Detection in Hybrid Power System. Electr. Power Syst. Res. 2018, 161, 26–44. [Google Scholar] [CrossRef]
- Stone, G.C. Partial Discharge Diagnostics and Electrical Equipment Insulation Condition Assessment. IEEE Trans. Dielectr. Electr. Insul. 2005, 12, 891–903. [Google Scholar] [CrossRef]
- Van Der Wielen, P.; Steennis, F. First Field Experience of On-Line Partial Discharge Monitoring of MV Cable Systems with Location. In Proceedings of the IET Conference Publications; IET: Prague, Czech Republic, 2009; p. 70. [Google Scholar]
- Advanced Testing and Monitoring Solutions for Electrical Assets—Altanova Group—Altanova Group. Available online: https://www.altanova-group.com/ (accessed on 18 February 2021).
- Gottin, B.; Ioana, C.; Chanussot, J.; D’Urso, G.; Espilit, T. Detection and Localization of Transient Sources: Comparative Study of Complex-Lag Distribution Concept Versus Wavelets and Spectrogram-Based Methods. EURASIP J. Adv. Sig. Proc. 2009, 2009. [Google Scholar] [CrossRef]
- Orović, I.; Papić, V.; Ioana, C.; Li, X.; Stanković, S. Compressive Sensing in Signal Processing: Algorithms and Transform Domain Formulations. Math. Probl. Eng. 2016, 2016, 7616393. [Google Scholar] [CrossRef]
- Stanković, I.; Ioana, C.; Daković, M. On the Reconstruction of Nonsparse Time-Frequency Signals with Sparsity Constraint from a Reduced Set of Samples. Signal Process. 2018, 142, 480–484. [Google Scholar] [CrossRef]
- Vasile, C.; Digulescu, A.; Ioana, C. Electrical Fault Characterization by Hough Transform of Phase Diagram Information. In Proceedings of the 2017 IEEE International Conference on Microwaves, Antennas, Communications and Electronic Systems (COMCAS); IEEE: Piscataway, NJ, USA, 2017; pp. 1–4. [Google Scholar]
- Saulig, N.; Lerga, J.; Milanovic, Z.; Ioana, C. Extraction of Useful Information Content From Noisy Signals Based on Structural Affinity of Clustered TFDs’ Coefficients. IEEE Trans. Signal Process. 2019, 67, 3154–3167. [Google Scholar] [CrossRef]
- Misra, H.; Ikbal, S.; Bourlard, H.; Hermansky, H. Spectral Entropy Based Feature for Robust ASR. In Proceedings of the 2004 IEEE International Conference on Acoustics, Speech, and Signal Processing; IEEE: Montreal, QC, Canada, 2004; Volume 1, p. I-193. [Google Scholar]
- Pan, Y.N.; Chen, J.; Li, X.L. Spectral Entropy: A Complementary Index for Rolling Element Bearing Performance Degradation Assessment. Proc. Inst. Mech. Eng. Part C J. Mech. Eng. Sci. 2009, 223, 1223–1231. [Google Scholar] [CrossRef]
- Sharma, V.; Parey, A. A Review of Gear Fault Diagnosis Using Various Condition Indicators. Procedia Eng. 2016, 144, 253–263. [Google Scholar] [CrossRef]
- Webber, C.; Zbilut, J. Recurrence Quantification Analysis of Nonlinear Dynamical Systems. Tutor. Contemp. Nonlinear Methods Behav. Sci. 2005. [Google Scholar]
- Zbilut, J.; Webber, C. Embeddings and Delays as Derived from Quantification of Recurrence Plots. Phys. Lett. A 1992, 171, 199–203. [Google Scholar] [CrossRef]
- Kantz, H.; Schreiber, T. Nonlinear Time Series Analysis, 2nd ed.; Cambridge University Press: Cambridge, UK, 2003; ISBN 978-0-521-52902-0. [Google Scholar]
- Marwan, N.; Carmen Romano, M.; Thiel, M.; Kurths, J. Recurrence Plots for the Analysis of Complex Systems. Phys. Rep. 2007, 438, 237–329. [Google Scholar] [CrossRef]
- Digulescu, A.; Murgan, I.; Ioana, C.; Candel, I.; Serbanescu, A. Applications of Transient Signal Analysis Using the Concept of Recurrence Plot Analysis. In Recurrence Plots and Their Quantifications: Expanding Horizons; Webber, C.L., Ioana, C., Marwan, N., Eds.; Springer Proceedings in Physics; Springer International Publishing: Cham, Switzerland, 2016; Volume 180, pp. 19–38. ISBN 978-3-319-29921-1. [Google Scholar]
- Bernard, C.; Digulescu, A.; Girard, A.; Ioana, C. Multi-lag Phase Diagram Analysis for Transient Signal Characterization. In Recurrence Plots and Their Quantifications: Expanding Horizons; Webber, C.L., Ioana, C., Marwan, N., Eds.; Springer Proceedings in Physics; Springer International Publishing: Cham, Switzerland, 2016; Volume 180, pp. 39–63. ISBN 978-3-319-29921-1. [Google Scholar]
- Pincus, S.M. Approximate Entropy as a Measure of System Complexity. Proc. Natl. Acad. Sci. USA 1991, 88, 2297–2301. [Google Scholar] [CrossRef] [PubMed]
- Ioana, C. Procédé de Localisation d’une Source d’impulsions dans un Milieu Dispersif. International Patent N° G01R 31/08, 22 July 2015. [Google Scholar]
Publisher’s Note: MDPI stays neutral with regard to jurisdictional claims in published maps and institutional affiliations. |
© 2021 by the authors. Licensee MDPI, Basel, Switzerland. This article is an open access article distributed under the terms and conditions of the Creative Commons Attribution (CC BY) license (http://creativecommons.org/licenses/by/4.0/).