Article

Comparative Investigation on Hydrodynamic Performance of Pump-Jet Propulsion Designed by Direct and Inverse Design Methods

1
National Research Center of Pumps, Jiangsu University, Zhenjiang 212013, China
2
Institute of Fluid Engineering Equipment, JITRI, Jiangsu University, Zhenjiang 212013, China
3
School of Energy and Power Engineering, Jiangsu University, Zhenjiang 212013, China
*
Authors to whom correspondence should be addressed.
Mathematics 2021, 9(4), 343; https://doi.org/10.3390/math9040343
Submission received: 7 December 2020 / Revised: 28 January 2021 / Accepted: 29 January 2021 / Published: 9 February 2021

Abstract

:
Pump-jet propulsion, a new propulsion technology, is primarily designed for underwater vehicles. Because of its concealment and excellent performance, it has been widely used, but due to its confidentiality and complexity, few studies have been published. To explore the relevant design theory of pump-jet propulsion with the aim of increasing its performance, in this study, we applied the direct and inverse design methods to construct a three-dimensional pump-jet model. The direct design method was carried out by comparing the lifting and lifting-line design methods, followed by further geometric optimization of the better model. In a numerical study using computational fluid dynamics (CFD) simulations, the Reynolds Averaged Naviere-Stokes (RANS) equations with SST k-ω turbulence model were solved in a cylindrical computational domain around the pump-jet propulsion device. A numerical investigation of the E779A propeller was carried out beforehand, using different advance ratios, in order to validate the accuracy of the numerical simulation method. The results show that for the direct method, although the model designed using the lifting-line method produced a greater thrust and the pump-jet designed using the lifting method was more efficient and stable, which is more suitable for small and medium underwater vehicles. When considering the inverse design method, the pump-jet propeller obviously accelerated the fluid, and the speed was obviously greater than that designed using the direct design method, while the turbulent kinetic energy in the flow field was higher, as well as the energy loss. Therefore, for small- and medium-sized underwater vehicles, if the priorities are high thrust and high efficiency, the inverse design method is the best option, whereas if stability and lower energy loss are preferred, the direct design method should be adopted.

1. Introduction

Pump-jet propulsion, a relatively recent research subject, has mainly been used in the military field in recent years. Because of its degree of concealment and its excellent performance when voyaging underwater, it has been increasingly used in marine equipment propulsion systems [1]. However, due to the confidentiality and complexity of such systems, there is little published literature available on pump-jet propulsion. Therefore, research on the design theory and performance of pump-jet propellers will help develop small- and medium-sized underwater vehicles. In recent years, many researchers have explored new or improved traditional methods with the aim of designing pump-jet propellers with improved performance. In terms of their geometric structures, pump-jet propellers are a complex combined type of underwater propeller that relies on hydrodynamic force to create thrust. They are generally composed of a rotor, a duct, and a stator [2]. This structure can reduce the inflow speed to delay the generation of cavitation phenomenon so as to improve the cavitation performance and the critical speed for the underwater vehicle. According to the installation position of the stator, pump-jets can be divided into front stator pump-jets and rear stator pump-jets. The front stator type is characterized by better noise performance, while the rear stator type is more inclined towards high degrees of efficiency and thrust [3,4,5].
The design concept of pump-jet blades can be broken down into two options—direct methods and inverse design methods—and the design processes for both are shown in Figure 1. The direct method is a traditional design method and is based on the design requirements for the blades. In this manner, the initial blade parameters can be obtained based on the flow conditions; then, through computational fluid dynamics (CFD) numerical simulation and experimentation, the structure of the initial model can be optimized by analyzing the hydrodynamic performance of the calculation and tests. The direct design method was first applied in studies on catheters with stator blades. As early as 1964, in the Armed Services Technical Information Agency (ASTIA) Document report, Henderson [6] pointed out that pump-jet propellers still achieve excellent propulsion performance even when cavitation occurs; then, he modified the one-dimensional theory of the axial flow pump to meet the application needs of the pump-jet propeller. The University of Pennsylvania [7] first designed a pump-jet propeller for application in torpedoes, and published a report on the principles of pump-jet design. Later, Furuya and Chiang [8] pointed out that the flow field of the pump-jet propeller was similar to that of the axial flow pump. Therefore, it was necessary to design the rotor and stator on the basis of the theory of the axial flow turbine. Subsequently, Korde [9] used the principle of the Downingtown–Huber pump to design a pump-jet propeller with a special shape. The simulation results showed that its performance was better than that of the traditional skew propeller. In recent years, Lu Lin [10] and Quan Zhiqiang [11] used pump and propeller design methods to conduct relevant selection and design of pump-jets; by carrying out numerical simulation studies, they found that the designed pump-jet performance was much better. In contrast to the work of others, Liu Yebao [12] combined propeller circulation design theory and the lifting method to design a pump-jet based on the characteristics of a pump-jet, and then predicted the performance of the pump-jet using the panel method.
The inverse design method can be divided into two main parts: flow field calculation and blade shape calculation. The blade shape is iteratively improved on the basis of the results of the flow field, while simultaneously determining the optimal impeller [13]. In this case, it is possible to avoid the tedious process of relying on traditional design experience, repeated model verification and impeller improvement. Generally, the inverse design method can be divided into two categories: the first is the mutual iterative calculation of direct and inverse methods; the other is a single inverse design concept. However, there are still many limitations in the second type and the research is insufficient. The first category method is to take the blades designed by the direct method as the known condition and to use the analysis of the simulation results as the basis of the inverse design section. Zhang Mingyu [14] adopted the three-dimensional inverse design method to carry out the design of the rotor and stator of the pump-jet propeller, and conducted the open water calculation and the hydraulic characteristics comparison between the pump-jet propeller and the propeller. It was found that the designed pump-jet propeller has a higher efficiency and better high-speed adaptability. Jin Shuanbao [15] took the MK48 torpedo as the research object, and explored the theory of overall selection of pump-jet propulsion and the design method of three-dimensional shape by combining theoretical analysis with numerical simulation and experiment, whose results verified the accuracy of the pump-jet selection and design method.
Due to the high cost of the test stand, there is little experimental study in the performance of the pump-jet propulsion at present. Suryanarayana et al. [16,17,18] found that at a higher inflow velocity coefficient, cavitation bubbles change at the suction surface with the increase of the rotating speed of the cavitation rotor; however, no cavitation occurs in the stator and duct in the cavitation water tunnel experiment. Shirazi et al. [19] studied the hydrodynamic performance of full-sized pump-jet propellers in a towing tank by conducting bollard towing, self-propelled point, and bare hull drag tests. He found that the hydraulic coefficient of the newly designed propeller varied much less with the propulsion coefficient than that of the conventional propellers. Compared with the experimental research, the numerical simulation research results are more abundant, with fewer costs and more detailed flow field information. Stefan Ivanell [20] used the CFD method to numerically calculate the hydrodynamic performance of the torpedo equipped with a pump propeller, which was then verified by the experimental data.
To explore the appropriate design method of the pump-jet propeller, our study used two kinds of methods, i.e., the direct and inverse design methods, to construct the rotor based on the characteristics of the pump-jet propulsion. The direct design method includes the lifting method (based on the theory of axial flow pump design) and the lifting-line method (based on the theory of propeller design); the stator was designed by the modified coefficient method, which is similar to the lifting method. Then, the inverse design method was adopted to design the pump-jet via the mutual iteration method. Based on the SST k-ω turbulence model, the numerical calculation of the pump-jet was carried out to evaluate the performance of the pump-jet propulsion designed by different methods. By comparing and analyzing the corresponding flow field and hydrodynamic performance results, the most suitable method for the pump-jet propeller design was concluded. The outcome of this paper provides a reference for the design and research of small and medium-sized underwater vehicle propulsions.

2. Design Methods of Pump-Jet Propulsion

2.1. Direct Design of Pump-Jet Model

Before designing the pump-jet thruster, it was necessary to give relevant design indicators in advance, e.g., the necessary performance parameters, including pump-jet inflow speed, thrust, etc. In order to make the propeller produce a suitable thrust with a high efficiency when the pump-jet propulsion is operating, the head of the propeller must correspond to the resistance of the body. The other parameters should also be matched with the performance to reduce or delay cavitation while ensuring high efficiency and heavy thrust.

2.1.1. Lifting Design Method

The fluid movement in the rotor is a complex three-dimensional flow. For the movement, the fluid enters the duct along the axial position, then fully develops in the internal channel of the pump-jet, then it is rectified by the stator and ejected through the tail of the duct. The thrust produced by the pump-jet propeller can be explained by Newton’s third discipline. The lifting method, based on one- and two-element design theories, was originally applied to the design of axial flow pump blades, which is still widely used in the design of axial flow pumps [21,22,23]. The design of the rotor by the lifting method is completely based on the assumption of the independence of the cylindrical layer.
Therefore, when designing a pump-jet rotor using this semi-empirical and semi-theoretical method, the following assumptions need to be made:
(1)
The flow in the rotor is regarded as potential flow, and there is no radial velocity component;
(2)
The distribution of velocity loop is constant along the radius;
(3)
There is no induced velocity in the axial direction.
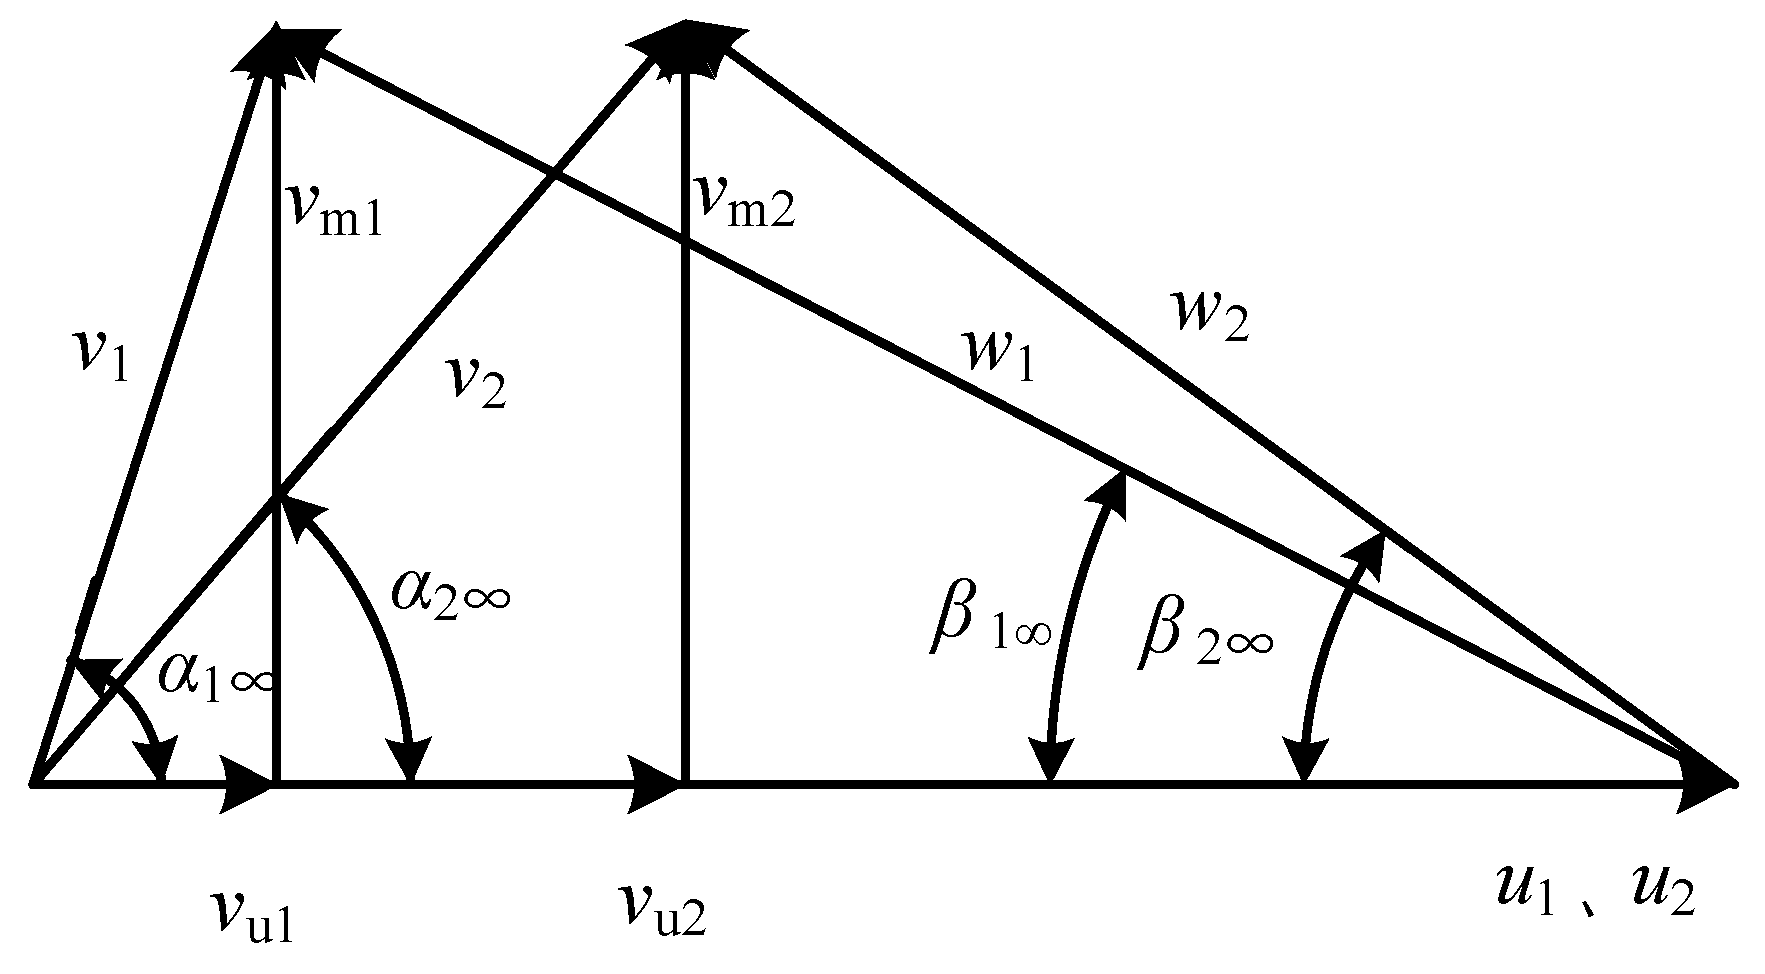
The complex movement of fluid in the rotor domain mainly includes the movement relative to the rotor blades, circular movement accompanying the rotation of the rotor, and absolute movement relative to the duct, which are expressed as absolute velocity v, relative velocity W, and circumferential velocity u, respectively. The inlet and outlet velocity triangle is shown in Figure 2, where β is the inlet angle of the single airfoil profile and ∆α is the attack angle of the single airfoil profile. Among them, subscript 1 represents inlet rotor parameters and subscript 2 represents outlet rotor parameters. For instance, vu1 and vu2 are the circumferential components of the absolute velocity at the inlet and outlet of the rotor; u1 and u2 are the circumferential velocities of the rotor inlet and outlet. Based on the assumption of the independence of the cylindrical layer, the fluid at the inlet on the same cylindrical section has no circumferential pre-swirl, that is vu1 = 0. Then the velocity circulation of the blade at radius r is:
Γ = 2 π r Z ( v u 2 v u 1 ) = t v u 2
where, t is the cascade pitch calculated by   t = 2 π r Z , Z is the number of blades.
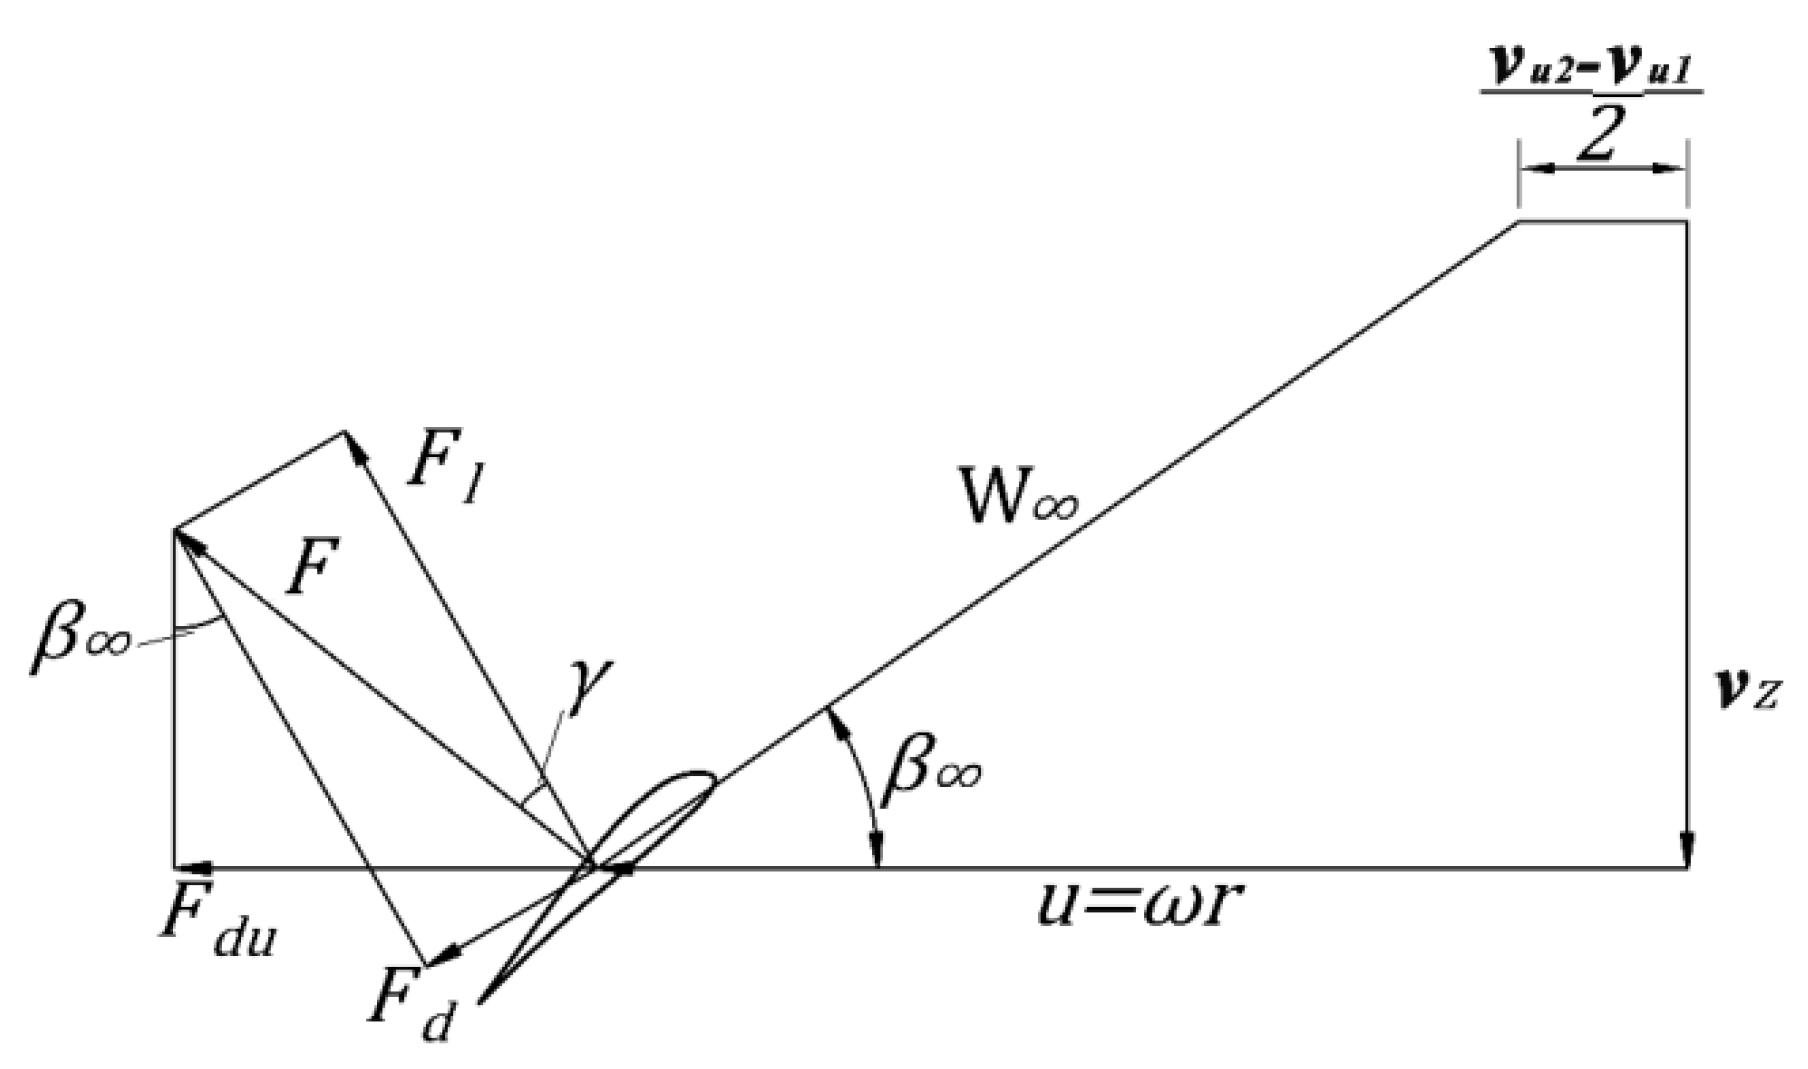
It can be seen that any fluid particle in the rotor domain can be analyzed by Figure 2 and Figure 3. Then the basic equation can be derived from the momentum theorem, as follows:
H t = u 2 v u 2 u 1 v u 1 g = Γ ω 2 π g
where the theoretical head of the pump is Ht, the fluid gravity acceleration is g, and ω is the angular velocity of rotor rotation.
The schematic diagram of the force of the rotor airfoil section in the viscous fluid is shown in Figure 3. In the figure, F is the resultant force, Fl is the lift, and Fd is the resistance, given by:
{ F l = C y 1 2 ρ W 2 A F d = C D 1 2 ρ W 2 A
where W is the average of the relative velocities, Cy is the lift coefficient, CD is the drag coefficient, and A is the maximum projected area. Then the circumferential component of the resultant force is given by
F u = F sin ( β + λ )
where λ is the angle between the lift and the resultant force, namely, the airfoil lift angle. β represents the inflow angle of the incoming flow at infinity. Then the lift coefficient can be introduced for definition by
C y = 2 F l ρ W 2 A
The input power of the blade airfoil profile on the cylindrical layer at the radius r is Z r ω F u , and the output power is Z H ρ v m , then the hydraulic efficiency is given by
η h = H ρ t v m r ω F u
where H is the true head, vm is the axial velocity, and hydraulic efficiency can also be expressed as ƞh = H/Ht. Thus, it can be obtained from Formula (4) and Formula (6) as
H t = r ω F 1 sin ( β + λ ) ρ t v m cos λ
Then, from Formulas (2), (5), and (7), we can get
C y l t = 2 ( v u 2 v u 1 ) W · sin β cos λ sin β cos λ + cos β sin λ
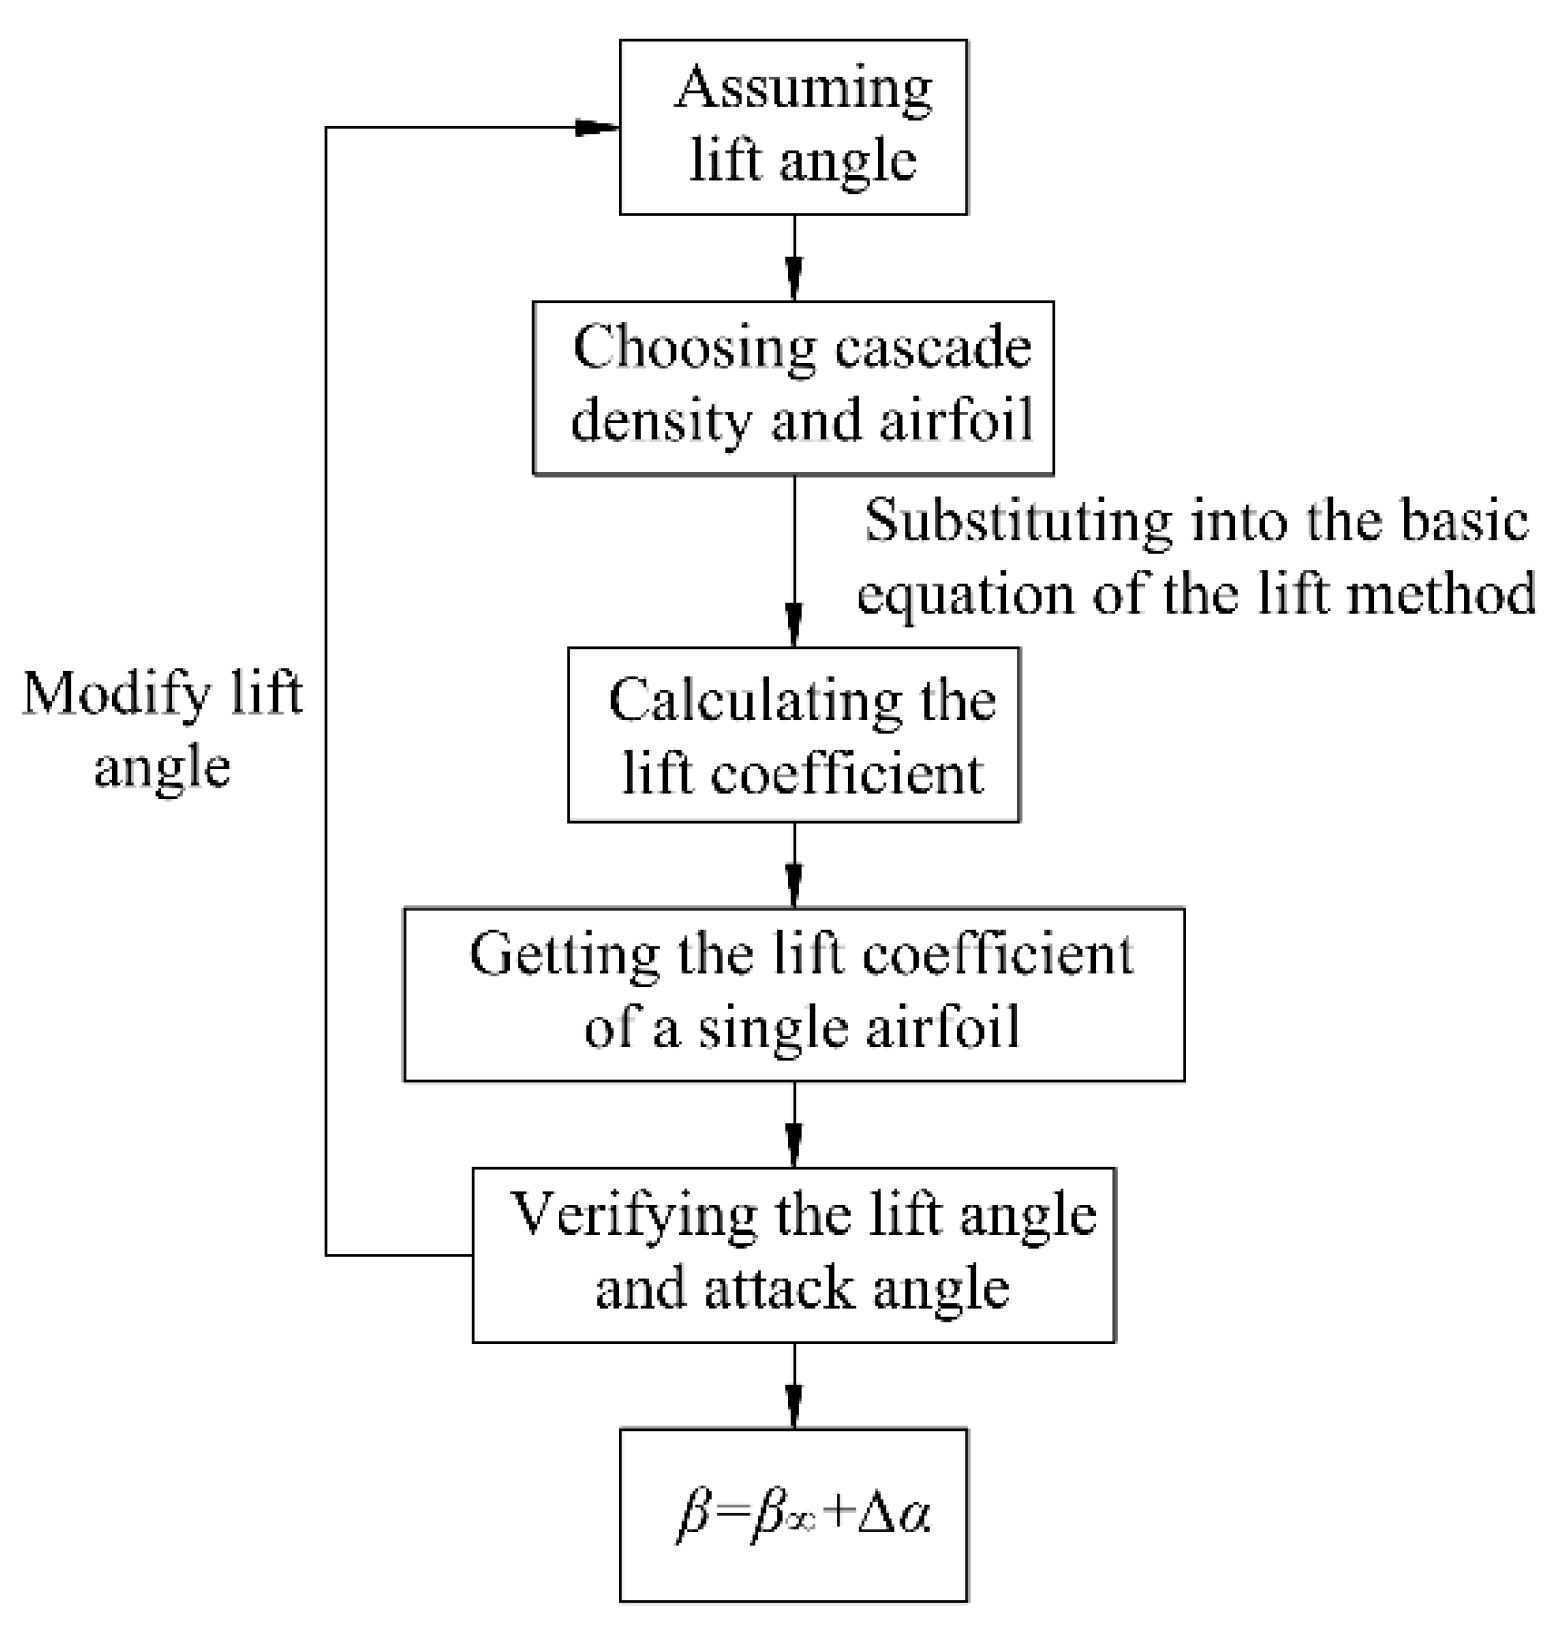
Formula (8) is the basic equation for the lifting design method, where l represents the chord length of the airfoil, and l / t represents the cascade density, which reflects the effective cascade channel area. The basic equation of the lifting design method expresses the relationship between the geometry, size, and flow characteristics of the designed blade section. In the calculation, it is assumed lift angle λ = 1 ° , and select l / t to calculate the lift coefficient Cy and attack angle, and the result can be finally achieved by iterative calculation. The related design process for the lifting method is shown in Figure 4.

2.1.2. Lifting-Line Method

With reference to the lifting-line theory used in propeller design, the pump-jet rotor was designed as a wing with a finite span. The rotor blade is regarded as a lifting-line, namely, an attached vortex line. The circulation of rotor changes in the radial direction, and the lift is also replaced by the concentrated vortex subsequently, and the radial and chordal distributed load can be calculated later. In addition, the hydrodynamic performance of the two-dimensional airfoil in each section is superimposed to predict the performance of the propeller rotor. This theory is based on the following assumptions:
(1)
The fluid is regarded as ideally incompressible;
(2)
Treating the inflow as steady and axisymmetric;
(3)
The rotor wake is regarded as non-contracting, and its influence on the shape of the vortex is not considered;
(4)
The radial induced speed is not considered;
(5)
It is assumed that the circulation at the hub diameter is 0, but for the rotor with a larger hub, a later correction is required.
According to the principle, the lifting-line method is to use lifting-lines to replace rotor blades. At the same time, the circulation and lift coefficient correspond to each other at the airfoil profile positions of different cylindrical radii. When using this theory, the rotor blades have been regarded as having no axial deformation. Figure 5 shows the force triangles and velocity triangles on the control points on the lift line. In the figure, there are axial and circumferential induced velocities Va and Vt, the axial and circumferential components of the inlet flow at the rotor are va and vt, respectively, the resultant force F is divided into lift and drag, the pitch angle of the airfoil profile is the placement angle of the profile with ψ * means, the angle of attack is α, β and βi are the airfoil inlet angle and induced velocity angle, respectively. Assuming that the circulation and the resultant speed v* are known, the rotor thrust and torque can be expressed in the following integral form:
T = ρ Z r h R [ v * Γ cos β i + 0.5 v * 2 c C D sin β i ] d r
Q = ρ Z r h R [ v * Γ sin β i + 0.5 v * 2 c C D cos β i ] r d r
where variable c is the chord length of the airfoil profile, CD is used to express the drag coefficient of the airfoil profile.
In the lifting-line theory, the axial and circumferential components of the induced velocity can be obtained by integration. Because the vortex line replaces the blade and the free vortex is released by the blade, the induced factor can also be used to represent the vortex line. At the dimensionless radius x of the lifting-line, the entire free vortex obtained is as follows:
V a V i n = 1 2 x n 1 d G d x 0 1 x x 0 i a d x 0
V t V i n = 1 2 x n 1 d G d x 0 1 x x 0 i t d x 0
where Vin represents the rotor inlet flow velocity, G is the dimensionless circulation, ia and it are the axial and tangential induction factors, respectively. Moreover, x and x0 are the dimensionless radial coordinates and xh is the dimensionless radius at the hub of the rotor.
The dimensionless circulation is calculated as follows:
G = Γ π D V i n
The integral form of the equation for solving the ring quantity G can be written as
x h 1 d G d x 0 1 x x 0 [ i a + λ i x i t ] d x 0 = 2 V * V i n
The approximate solution equation of the discretized circulation G can be written as
m = 1 m G m [ h m a ( φ ) + λ i x h m t ( φ ) ] = ( 1 x h ) V * V i n  
among them, h m a ( φ ) = π sin φ [ sin ( m φ ) n = 0 m I n a ( φ ) + cos ( m φ ) n = m + 1 N I n a ( φ ) sin ( n φ ) , h m t ( φ ) = π sin φ [ sin ( m φ ) n = 0 m I n t ( φ ) + cos ( m φ ) n = m + 1 N I n t ( φ ) sin ( n φ ) .
The dimensionless circulation G can be rewritten in the series form, as follows:
G = m = 1 G m sin ( m φ )
The approximate solution equation of the discretized dimensionless circulation G can be written as
m = 1 m G m [ h m a ( φ ) + λ 2 x h m t ( φ ) ] = ( 1 x h ) V * V i n
According to the above equations, the lift-length product coefficient (the product of the lift coefficient and the chord length) of the pump-jet rotor in a uniform flow field can be calculated according to the following basic equations.
C l l D = 2 π G x λ V t V i n cos β i

2.1.3. Optimization Following Direct Method Design

When using a direct design method, an optimal design is also required, namely, after the model being designed, the numerical simulation calculation of the simulated flow field is combined with automatic optimization, and the optimization iteration of the design plan is performed to obtain the optimal design plan [24,25,26,27]. According to the results of the fifth section, this section is based on the Isight platform using the optimization method to carry out the remaining work of the pump-jet thruster designed by direct design method, integrating various software, building an automatic optimization design platform, and obtaining a performance-optimized pump-jet model [28]. The Particle swarm optimization (PSO) algorithm was chosen for the optimization of pump-jet. It is a global search algorithm based on swarm intelligence proposed by Professor Eberhart and Kennedy [29] in 1995. Because of the effectiveness of this global awareness, it has been widely used in engineering. The PSO algorithm can reduce the convergence time of the calculation, greatly reducing the amount of calculation required and saving computing resources [30].
Because of the above summary of the principle of PSO, the specific settings of PSO in the optimization process of the pump-jet thruster in this paper are shown in Table 1.
To optimize the overall design of the pump-jet thruster, according to the design principle, some structural parameters of the rotor and stator were selected as optimization variables. These variables are not calculated explicitly in the design steps or obtained by empirical calculations. The initial optimization parameters and the optimized range are shown in Table 2. These five parameters are the rotor blade placement angle, stator blade placement angle, axial distance between rotor and stator, tip clearance, and hub ratio.
To broaden the efficiency range to a certain extent, two advance coefficients, J = 1.06 and J = 1.07 were chosen for optimization, which is defined as J = U/(nD). Specifically, the weighted average efficiency and thrust under these two operating conditions were used as the optimization target for the multi-objective optimization:
{ F 1 ( X ) = i = 1 2 ω i 1 η i F 2 ( X ) = i = 1 2 ω i 2 T i
where X is the set of variables, subscripts 1 and 2 represent efficiency and thrust respectively; the value of i represents two operating conditions; ωi1 and ωi2 are the weights. To improve the propulsion performance at a higher sailing speed, the weights were 0.4 and 0.6, respectively.
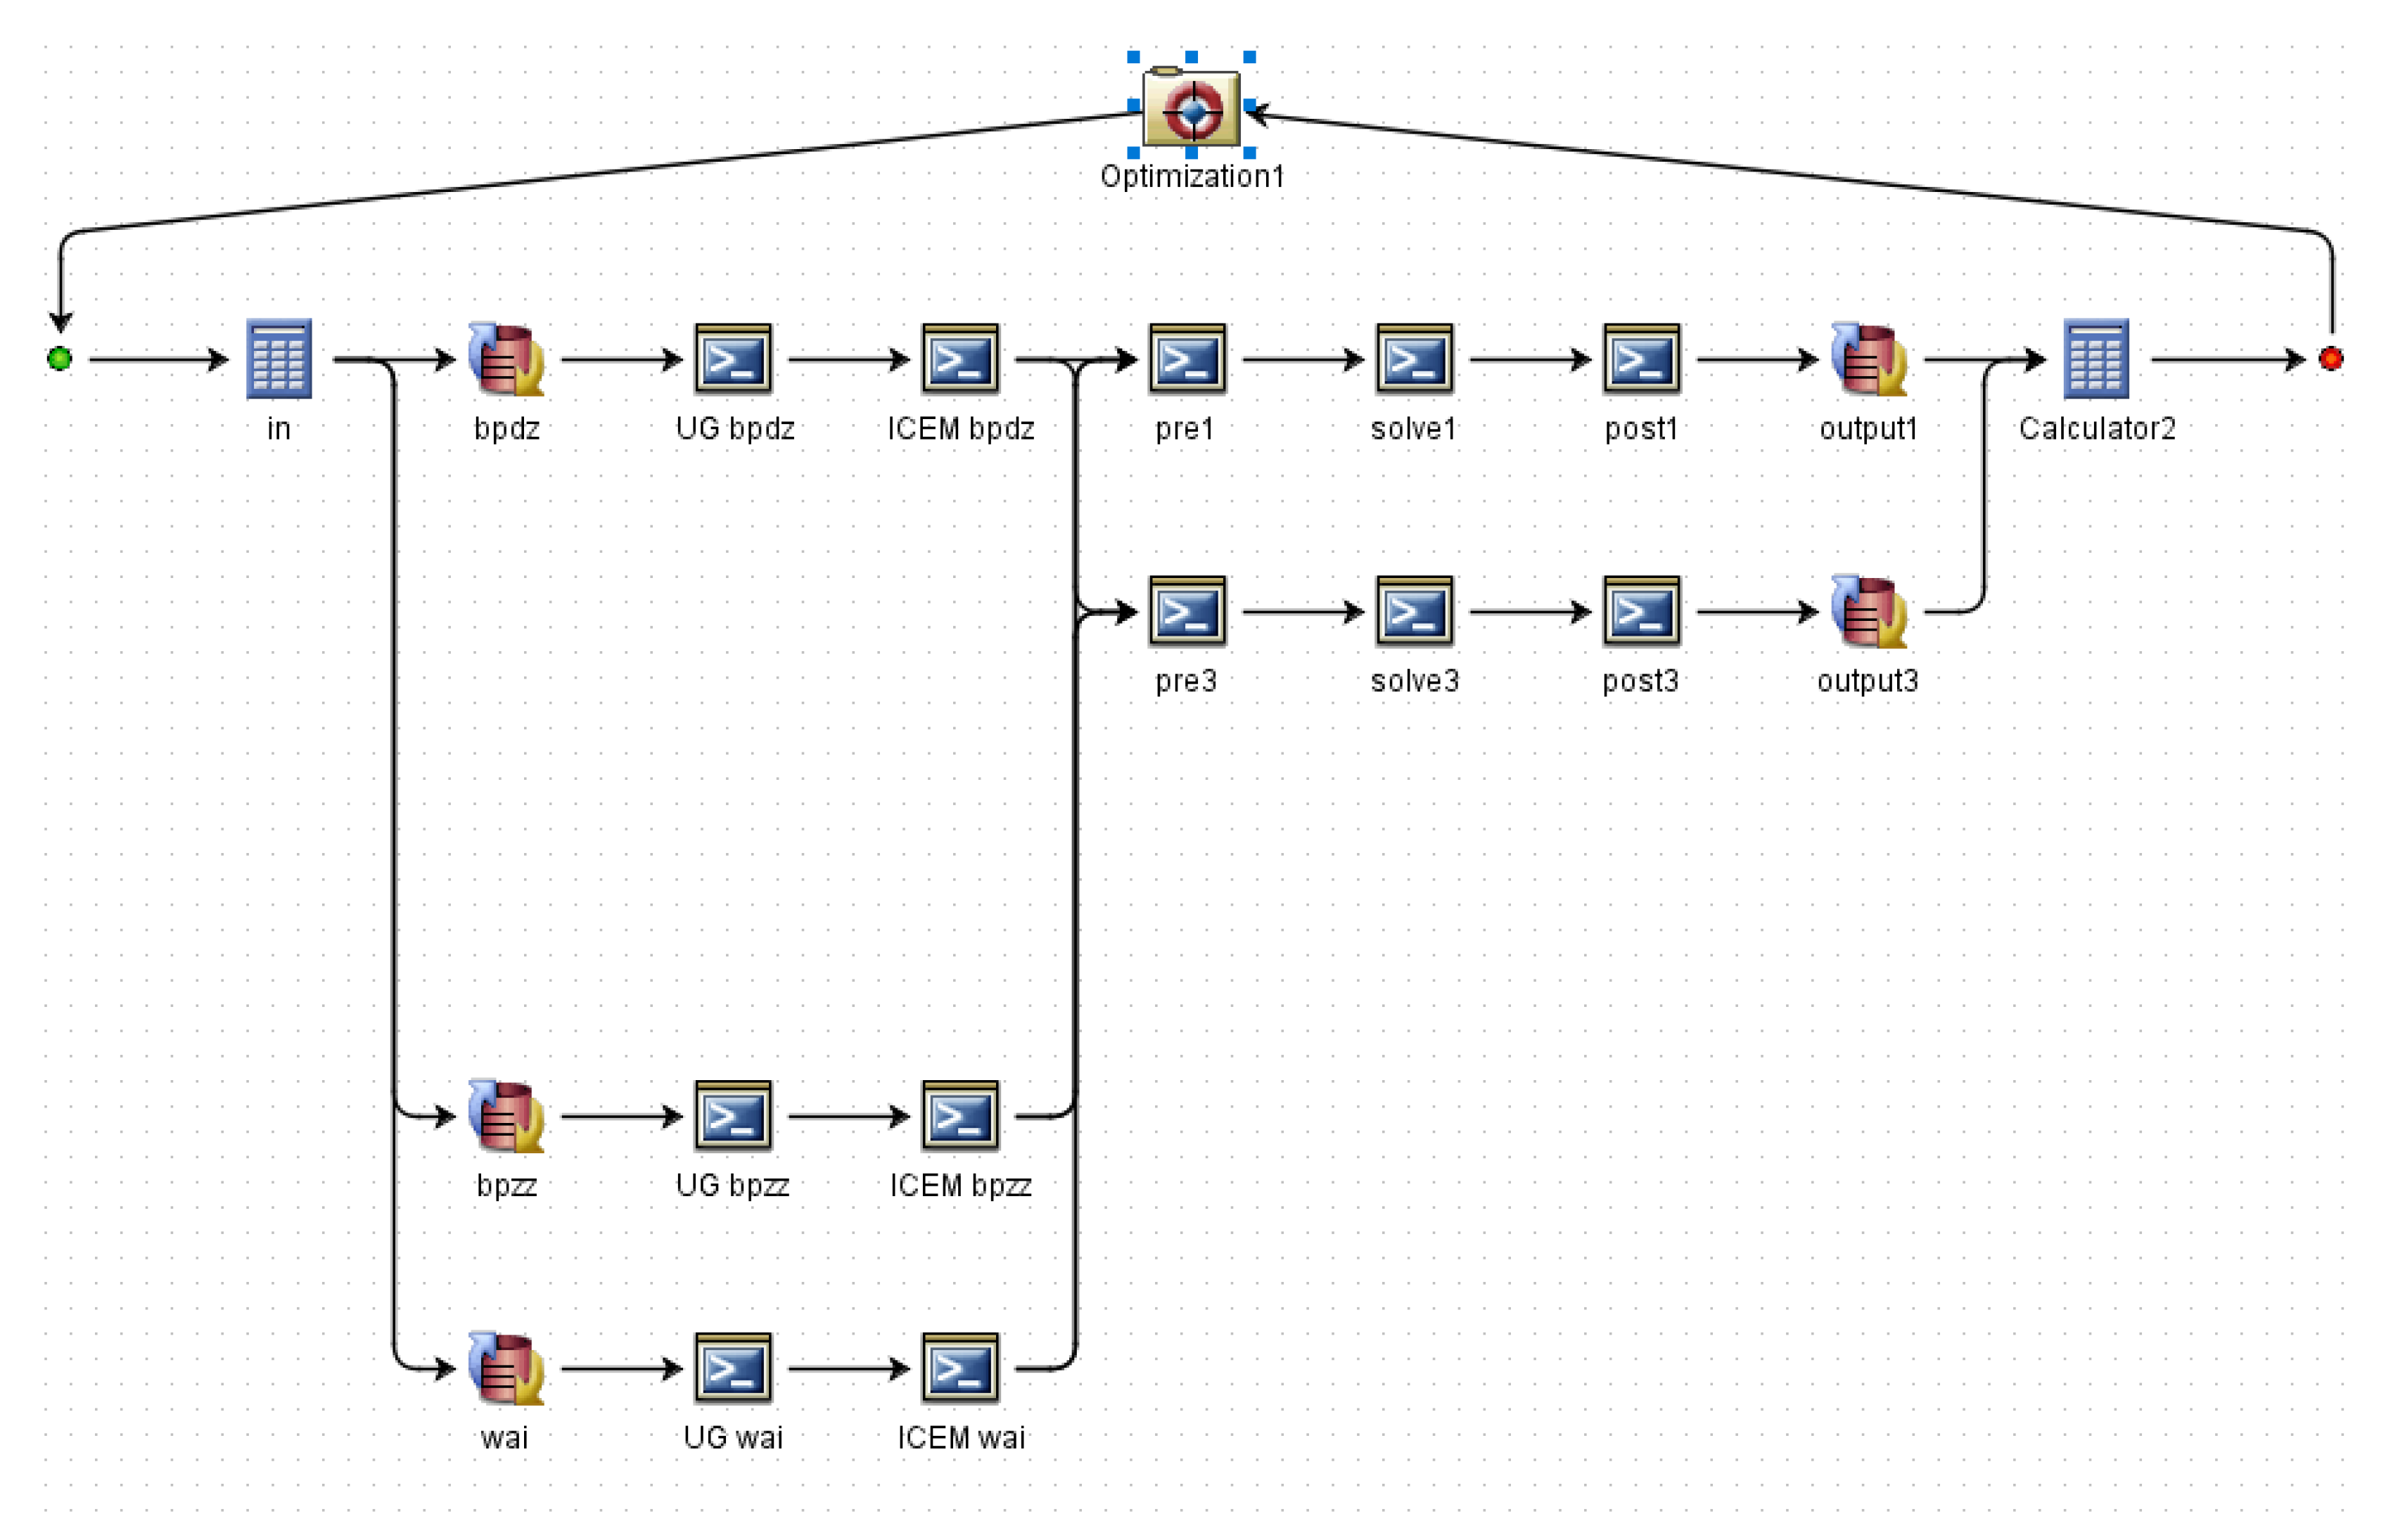
In this study, the optimization part of the direct method design was carried out by the Isight platform, which integrates the 3D modeling software UG, meshing software ICEM, and numerical simulation calculation software CFX [31]. The optimization algorithm module was embedded in the platform. The UG, ICEM, and CFX software were embedded in the platform through scriptwriting and batch processing, and the input and output of each software were set up, and these software modules were connected in series in the platform to automatically complete data exchange between each other, and then the join algorithm was used to make it iterate until the final optimization was completed. The process is shown in Figure 6.
The process can be reformulated with more detail as follows. Firstly, the modeling part chooses the UG software to record the process and generate the script program [32]. Then, the automatic modeling of the new model is carried out by rewriting the parameter file, where the rotor, stator, and external flow field are separately operated. After that, the ICEM is used to mesh the model, while the script was recorded at the same time. During the optimization process, the script file is constantly loaded to automatically mesh the updated geometric model. Finally, the CFD numerical calculation module mainly integrates CFX and CFD-POST to perform numerical simulation for the flow field, obtaining the new model performance and performance analysis. This module is the criterion used to judge the target. In the process of constant iteration, optimization calculation is carried out by the Isight platform, while the algorithm is embedded in the platform. It needs to adjust the optimization parameters and variables without compiling separately [33].

2.2. Inverse Design of Pump-Jet Model

The design method of the three-dimensional inverse design method was adopted for the design of the pump-jet propeller. In the design process of the pump-jet propeller, the direct and inverse methods were alternately iterated. The basic design idea is to give the average circumferential flow and periodicity of the blade. After the flow, the velocity field of the three-dimensional flow was obtained, and the load discipline of the blade surface was given. Based on that, the three-dimensional inverse method calculation model was established, and the iterative calculation was performed. Finally, the inverse design method of the pump jet propeller meeting the performance goal was completed [34].
This method is roughly divided into two parts: blade shape calculation and flow field calculation. Before designing, it is necessary to make corresponding assumptions and restrictions to describe the complex flow field in the pump-jet flow channel. It was assumed that the fluid flow in the working environment of the pump-jet propulsion was steady, not viscous, incompressible, and the incoming flow into the rotor was non-rotating.
When designing pump-jet propeller blades, the thickness of the blades was ignored, and the center surface of the blade was replaced by a vortex so that the effect of the blade on the water was replaced by the vortex on the center surface. The strength of the vortex was controlled by the circumferential average circulation 2 π r V θ [30,35],
r V θ ¯ = Z 2 π 0 2 π Z r V θ d θ
where Z represents the number of blades; represents the circumferential speed; r represents the radius or radial distance.
In the above process, the average flow field and periodic flow field of the blade area and the non-blade area were established. Based on the previous assumptions, on the blade surface where the thickness is ignored, the relative flow velocity Wb is tangent to the blade surface and orthogonal to the blade normal vector S , namely, W b · S = 0 . Expanding the relative speed, we can express this relationship as
( V ¯ z + V ˜ zb ) f z + ( V ¯ r + V ˜ r b ) f r = r V ¯ θ r 2 + V ˜ θ b r ω
where f represents the blade wrap angle, V ˜ represents the periodic velocity. Then the relative velocity direction of the suction surface and pressure surface of the blade is perpendicular to their normal direction and perpendicular to the direction of curl, so the relative velocity increment can be expressed as
W b + W b = 2 π Z ( r V ¯ θ × S ) × S S × S
Formula (20) can be simplified by applying the Bernoulli equation along the streamline; then, the pressure distribution can be inferred as
p + p = 2 π Z ρ W ¯ · r V ¯ θ
where W ¯ = W b + + W b 2 . Formulas (20)–(22) can control the geometry of the blade.
Finally, by combining all the equations in this part, the solution equations for the three-dimensional inverse design method can be obtained. After obtaining the conditions of circulation, blade thickness, number of blades, and boundary conditions, a complete blade design can be realized. The load of the rotor and stator blades is shown in Figure 7, where m represents the position of blade airfoil chord length, indicating that when m is 0, it represents the blade inlet edge, and when m is 1, it represents the blade outlet edge.

3. Numerical Method and Computational Setup

3.1. Governing Equation

In this study, the governing equations for the incompressible and single-phase fluid are the RANS equation, which are shown as the mass and momentum conservations by:
ρ t + ( ρ u i ) x i   =   0
t ( ρ u i ) + ( ρ u i u j ) x j   =   p x i + x i [ μ u i x j ρ u i u j ¯ ] + S i
where ρ is the fluid medium density, μ denotes the fluid dynamic viscosity, u i u j ¯ represents the Reynolds stresses, p represents the pressure, and u is the time-averaged velocity. Moreover, x is the spatial coordinate, S is the source term, while subscript i and j represent the coordinate component.

3.2. Turbulence Model

In this study, the SST k-ω turbulence model was adopted to close the numerical simulation, which is the mixed form of the k-ԑ turbulence model and the k-ω turbulence model [36]. For pump-jet propellers, it has been proved through relevant literature and practice that the SST k-ω turbulence model has a higher accuracy in numerical calculations than the aforementioned k-ε models [37] when dealing with different boundary layers. Therefore, in this study, we used the SST k-ω turbulence model to simulate the pump-jet propulsion. The expressions of its turbulent viscosity, turbulent kinetic energy, and specific dissipation rate are shown in the following equations.
μ t = ρ a 1 k max ( a 1 ω ,   S F 2 )
( ρ k ) t + ( ρ u i k ) x i = x j [ ( μ + μ t σ k ) k x j ] + P k β * ρ k ω
ρ ω t + ρ u i ω x i = x j [ ( μ + μ t σ ω ) ω x j ] + α ω k P k β ρ ω 2 + ( 1 F 1 ) 2 ρ 1 ω σ ω 2 k x j ω x j
σ ω = F 1 σ ω 1 + ( 1 F 1 ) σ ω 2
σ k = F 1 σ k 1 + ( 1 F 1 ) σ k 2
α = F 1 α 1 + ( 1 F 1 ) α 2
P k = μ t ( u i x j + u j x i ) u i x j 2 3 u k x k ( 3 μ t u k x k + ρ k )
where F1 represents the weighting function; F2 represents the mixing function; S represents the curl amplitude, a 1 is empirical coefficient which is 0.31. The constant values are α1 = 5/9, α2 = 0.44, σω1 = 1, σω2 = 1.1682, β1 = 0.075, β2 = 0.0828, β* = 0.075, σω1 = 2, σk1 = 2, σk2 = 1.

3.3. Pump-Jet Basic Parameters and Models

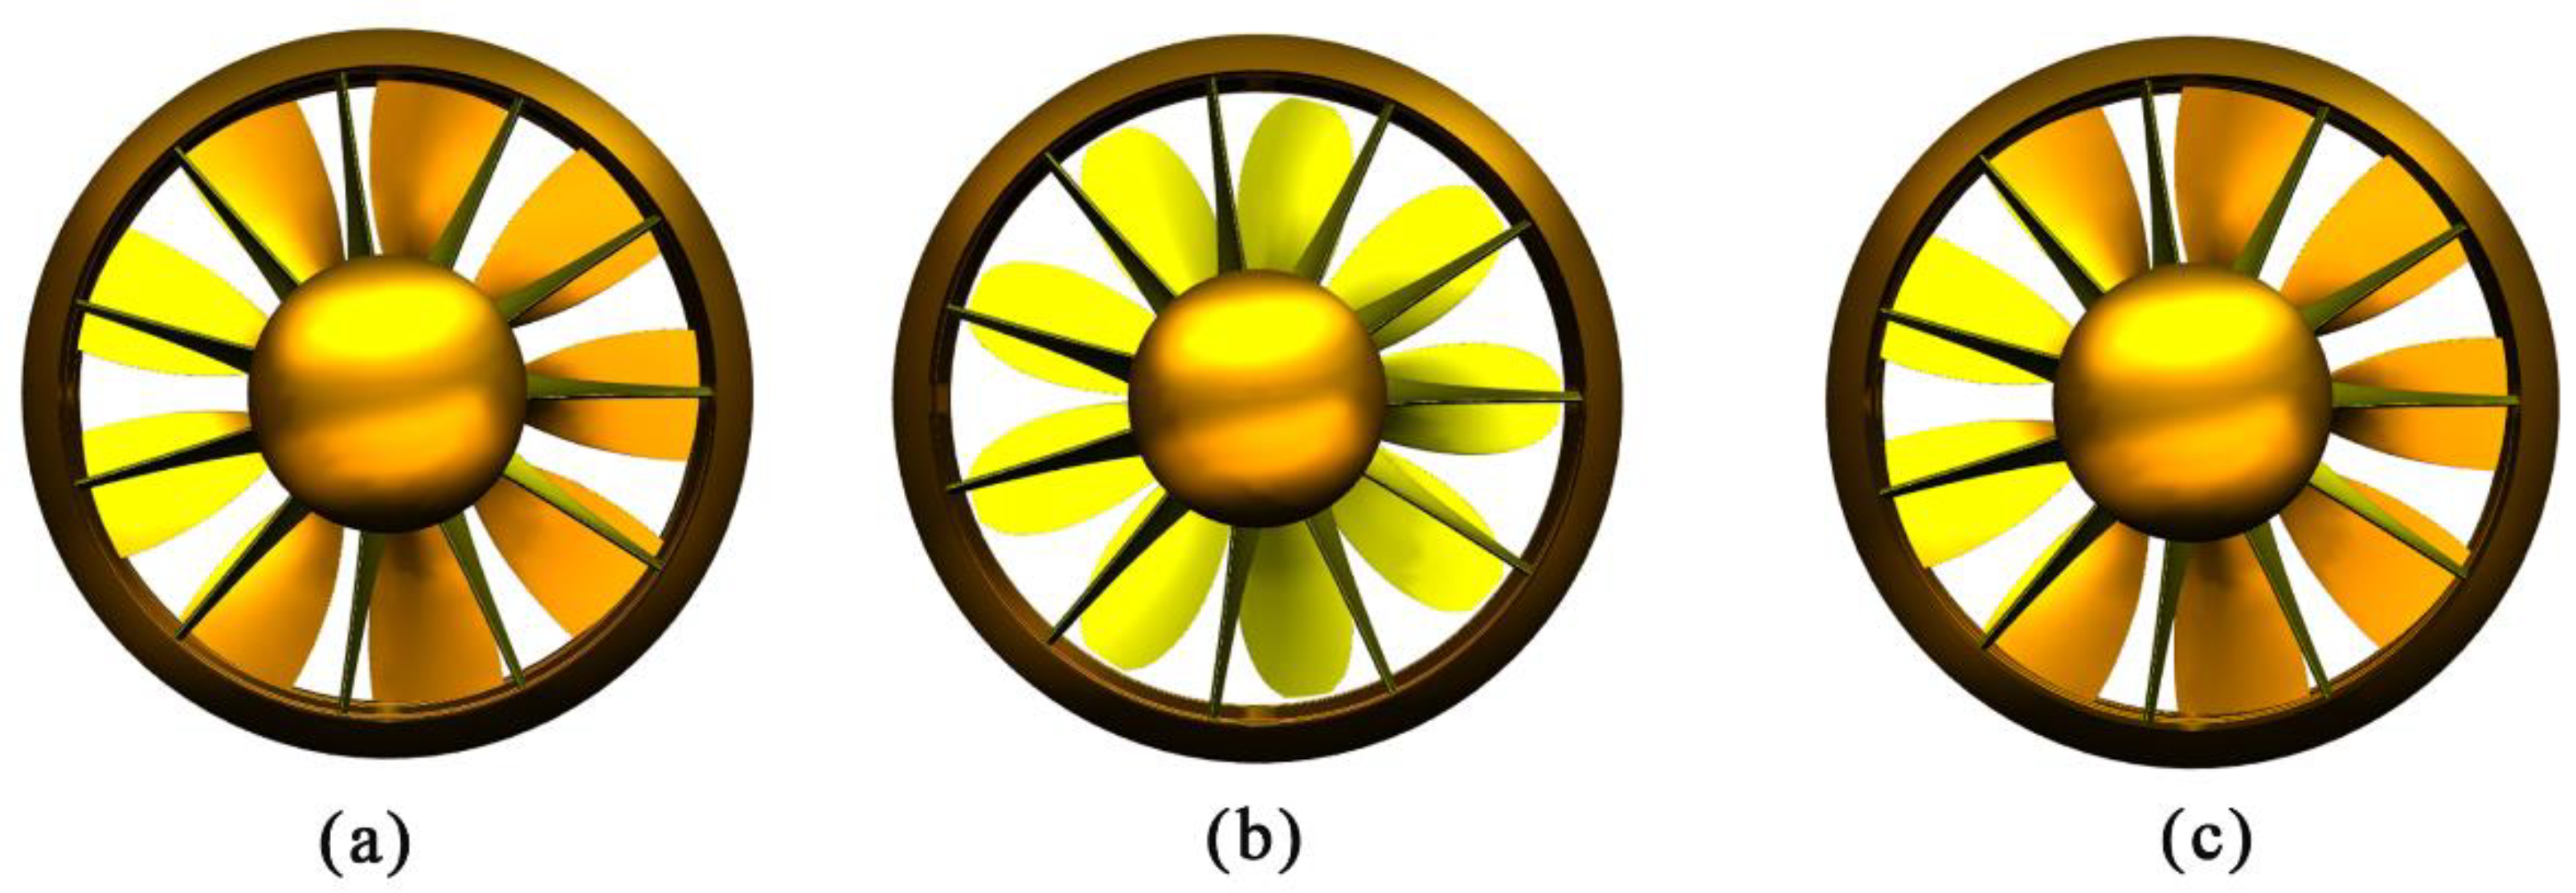
The pump-jet propulsion model in this paper was based on the direct design method and the inverse design method, and are presented in Figure 8 and Figure 9, respectively. Figure 8 shows the model designed by direct design method, including lifting method, lifting-line method, and the optimal model based on the model designed by lifting design method (according to the results in Section 4, we found that lifting method was more suitable for this paper). After optimizing, the rotor hub ratio changed from 0.4 to 0.45, the rotor placement angle changed from 64.9° to 69.66°, the tip clearance changed from 1 to 1.9 mm, the gap of rotor-stator increased from 26.8 to 33.49 mm, and the stator placement angle increased from 77° to 82°. Figure 9 shows the model obtained by the inverse design method. The diameter of the rotor shown was Dt = 0.324 m, and the total length of the pump-jet was 0.30 m, while the propulsion has 9 rotor blades and 11 stator blades. Considering the gap flow between the rotor and the inner wall of the duct, 1 mm was chosen as the minimum gap between the rotor tip and the inner wall of the duct. Comparing the direct design method, the blade designed by the inverse design method becomes more slant, while the stator placement grew larger.

3.4. Mesh Generation and Boundary Conditions

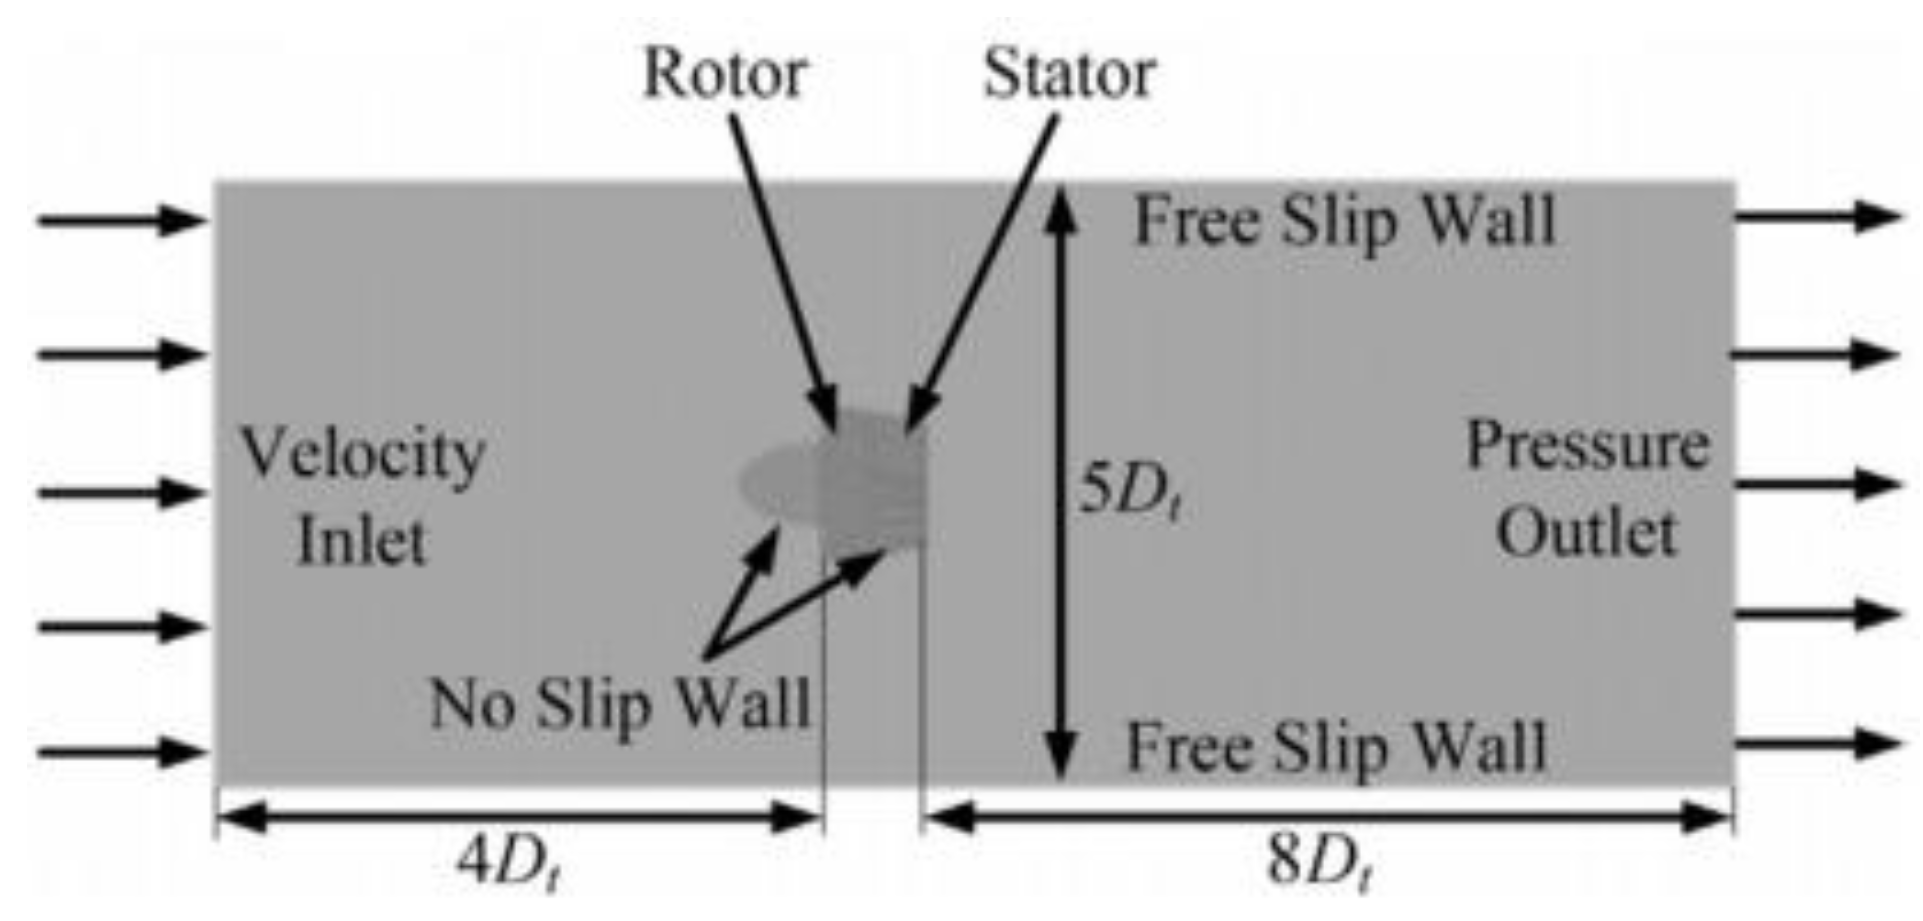
To simulate the operation of the pump-jet propulsion underwater, the external flow field of the pump-jet propulsion was set as a large cylindrical area, which was placed at the same axis as the propulsion presented in Figure 10. For the boundary conditions of the computational domain, the inlet boundary of the external flow field was set to the normal speed as speed inlet, turbulence intensity was 5% as the default, and the outlet was set as the static pressure outlet. The cylindrical wall was set as the free slip wall, and other walls were set as the non-slip wall; the interface between rotor and stator was set as the frozen rotor. Meanwhile, a second-order backward Euler algorithm was adopted as the time derivatives, with the finite volume method chosen for the discretization of equations. The D represents the maximum diameter of the rotor of the pump-jet propulsion. The inlet and outlet of the computational domain of the external flow field were set as 4D and 8D away from the rotor, respectively, whereas the diameter of the overall external flow field was 5D. The setting of the solution time was 1000 iterations, while the residual target of convergence criteria was set to 10−5.
The generation of the structured mesh and O-hexahedral grids, both of which were used around the rotor blade, was adopted by the ANSYS ICEM 17.0 software, as shown in Figure 11. The grid resolution of the SST k-ω model was fine and the Y+ values should be less than 30. Y+ values around the pump-jet propulsion are listed in Table 3:
To visually express the numerical results and to better compare and analyze the hydrodynamic performance of the pump-jet propulsion, in this study, we conducted dimensionless processing on the relevant physical parameters, as shown in Table 4.
As shown in the table, the rotating system includes the rotor; the static system includes the stator and the duct; thrust and torque are represented by T and Q, respectively, subscripts r and s are used to represent the rotating system and the static system, respectively, n is rotating speed of the rotor. It can be seen from the table that modifying the advance coefficient J can be achieved by adjusting the rotating speed n.
To exclude the effect of the number of grid cells on the simulation accuracy, meanwhile avoiding using too many computing resources caused by the excessive grids, it was necessary to conduct the grid-independence analysis of the computational domain [38,39,40]. Table 5 shows the comparison of different grid cell numbers for grid independence analysis, in which J represents advance coefficient, KT represents thrust coefficient, KQ represents torque coefficient, and η is propulsion efficiency. By comparing the thrust coefficient, torque coefficient, and propulsion efficiency with the different number of grid cells of the computational domain under the specific working condition, the most appropriate number of grid cells was concluded.
It can be seen from the table that with the increase of grid number, the difference between the propulsion efficiencies becomes smaller and smaller. Thus, for obtaining the more accurate flow field information near the wall and reducing computational resource consumption, the 3.37 million grid was selected for the numerical simulation in this paper.

3.5. Numerical Method Validation

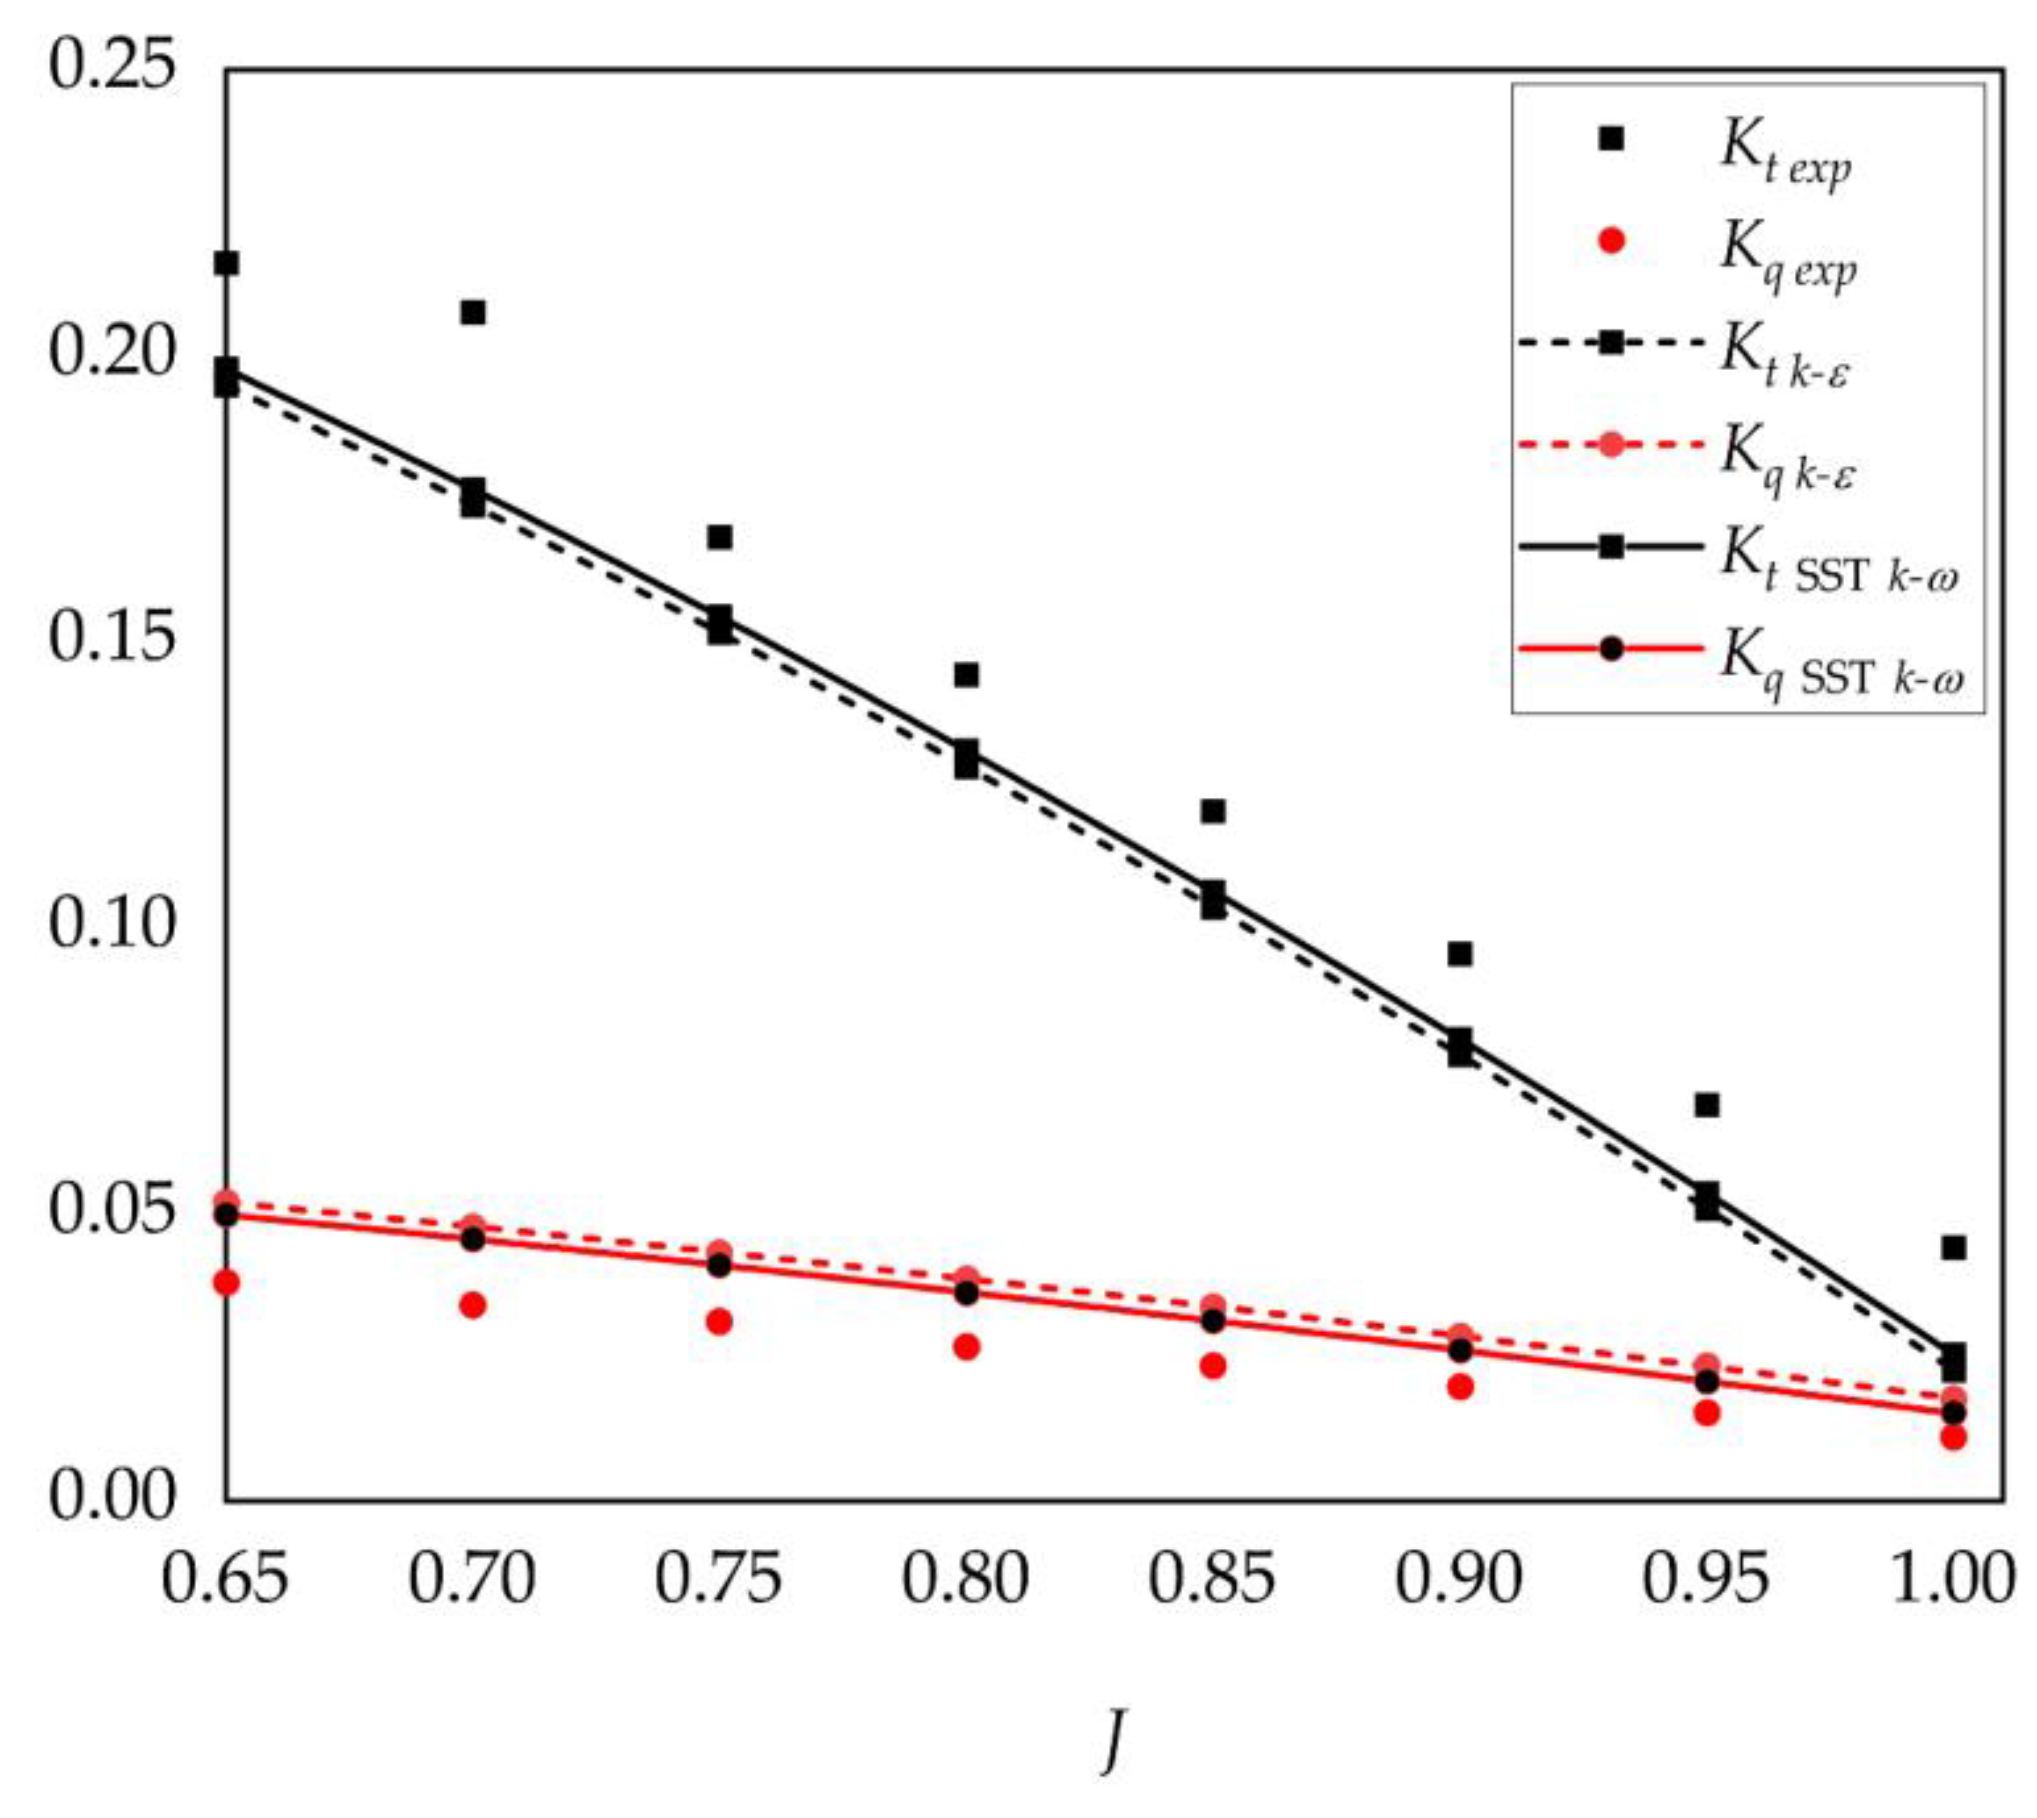
E779A is one of the most widely used propellers, owing to the substantial experimental results [41,42,43]. The experiments were carried out in the Italian Navy cavitation tunnel facility in 2006, leading to the selection of the E779A propeller to test the feasibility of numerical simulation. The boundary conditions of E779A are shown in Figure 12, implying that the outer cylindrical domain is the external flow field and the inner one is the rotational domain. The advance coefficient J = U/(nD), where U represents the inflow velocity, while n and D are rotational speed and diameter of propeller, respectively.
The SST k-ω turbulence model was adopted in the E779A propeller simulation. Figure 13 shows the comparison between calculation and experiment results, where Kt is the thrust coefficient and Kq is the torque coefficient. The propulsion efficiency η is defined as η = Kt/Kq*J/(2π). Moreover, it can be seen from the figure that the numerical results generally agree well with the experimental data with an error of less than ten percent, which implies that the numerical approach employed in this study is stable and reliable.

4. Results and Discussion

4.1. Analysis of Pump-Jet Performance by Direct Design Method

4.1.1. Comparison of Lifting Method and Lifting-Line Method

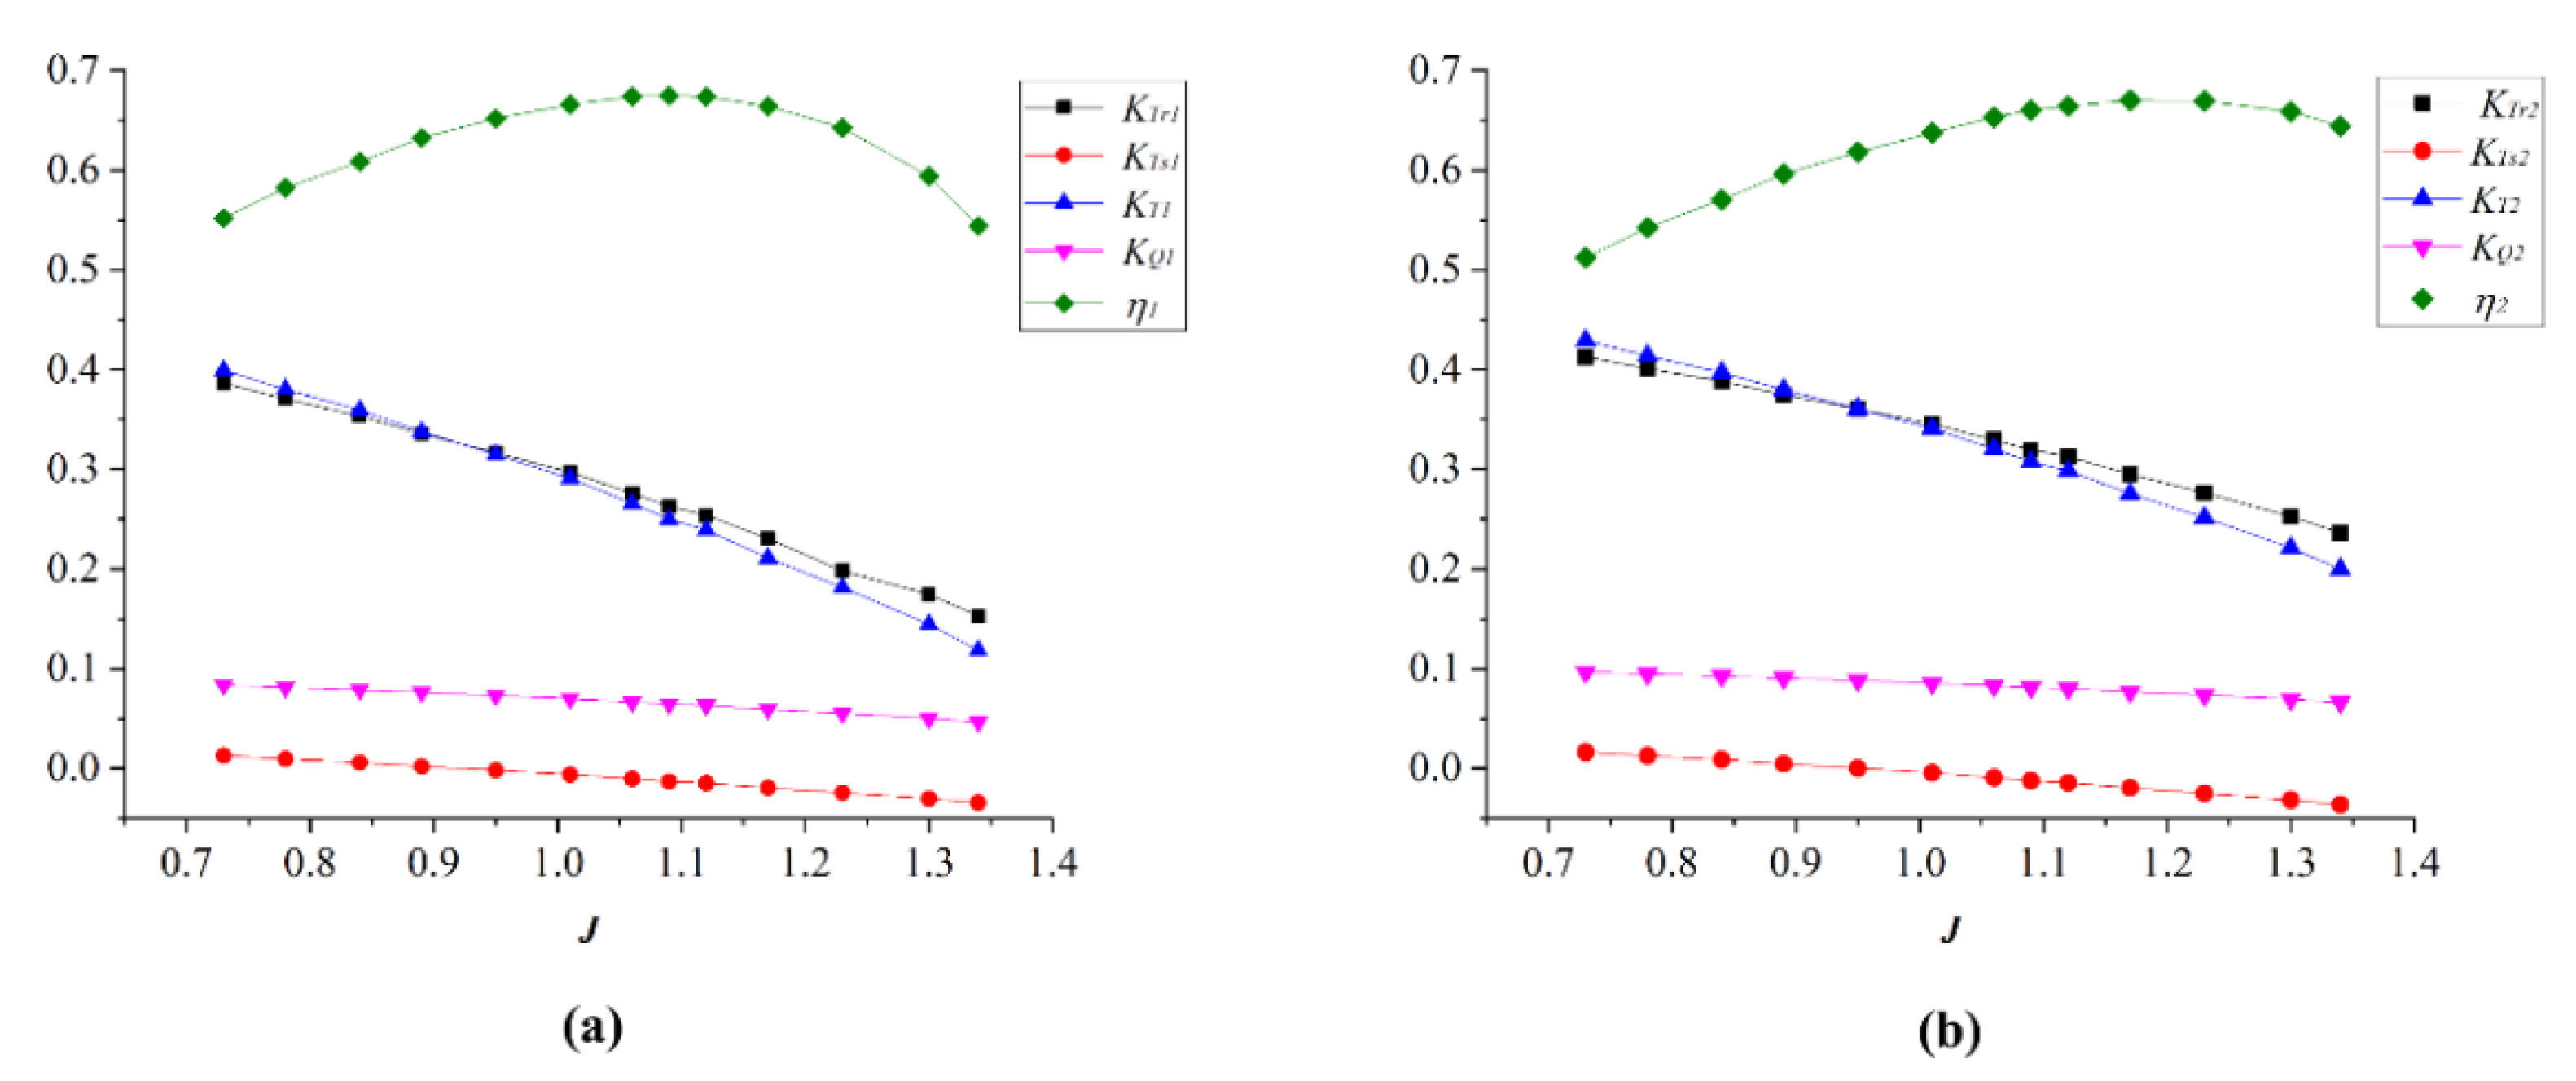
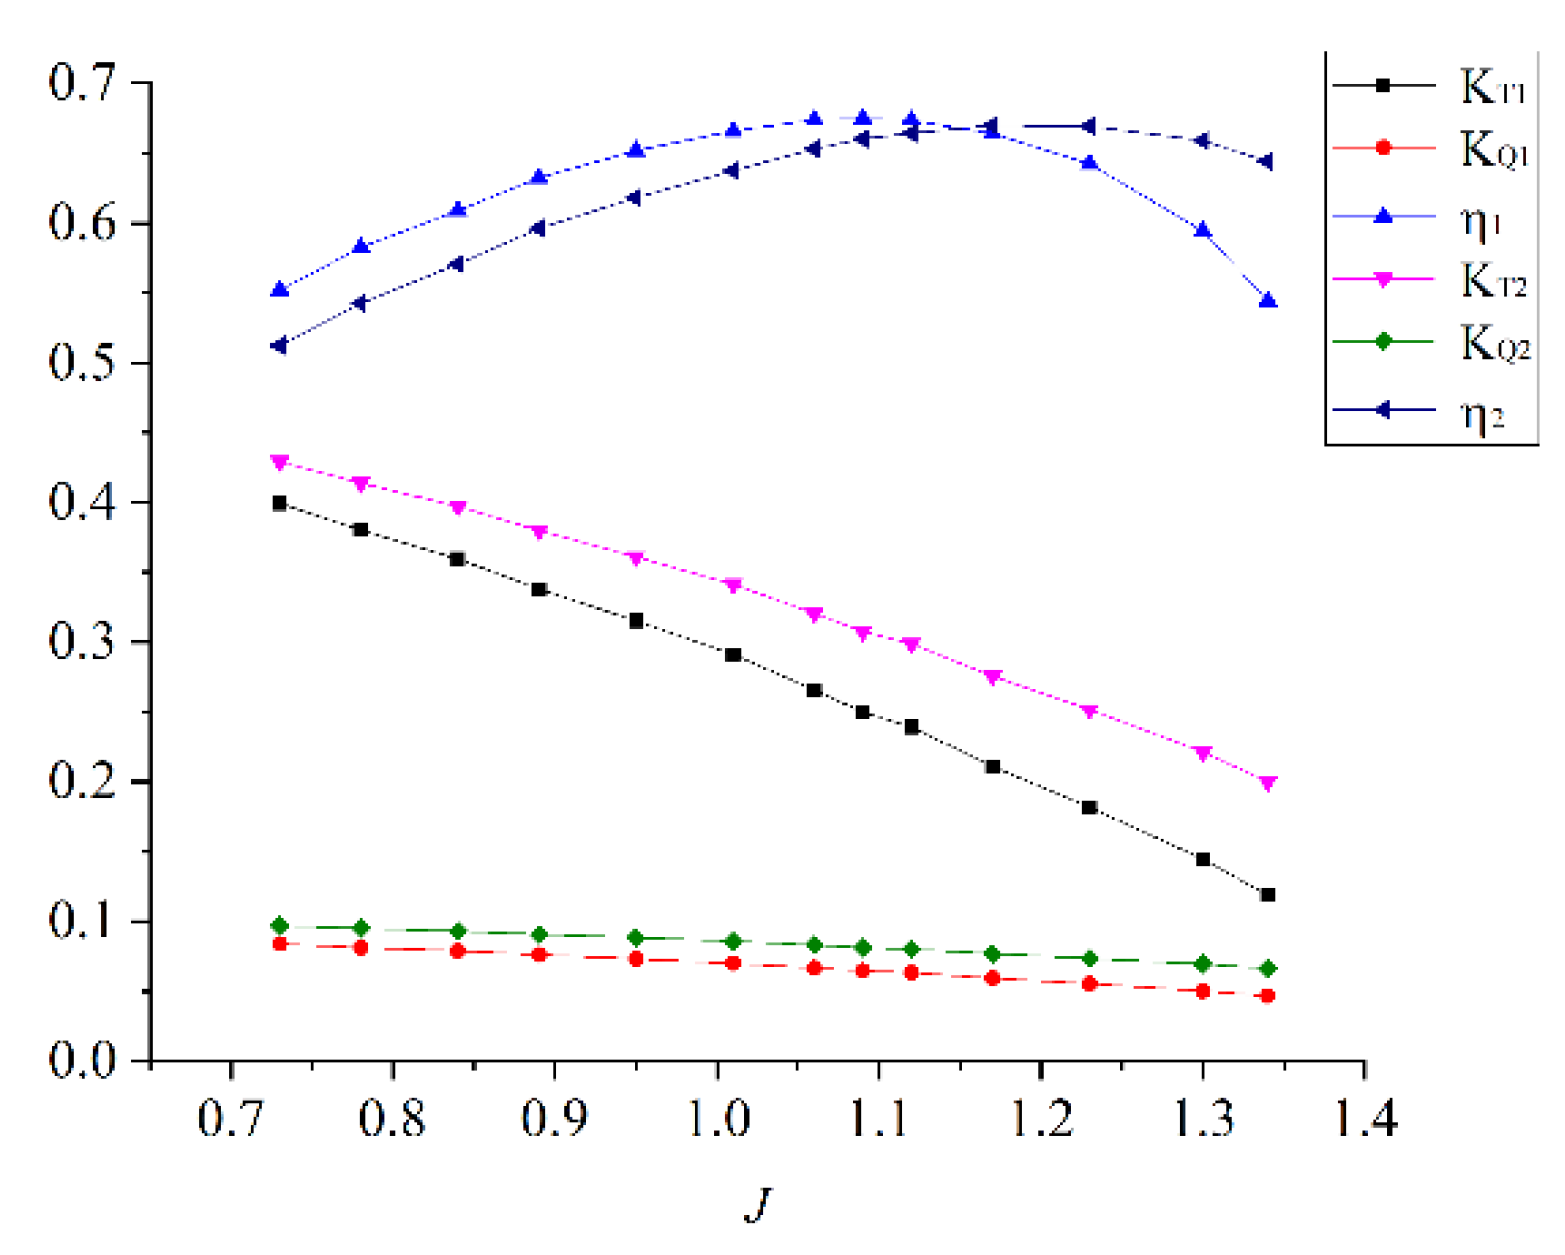
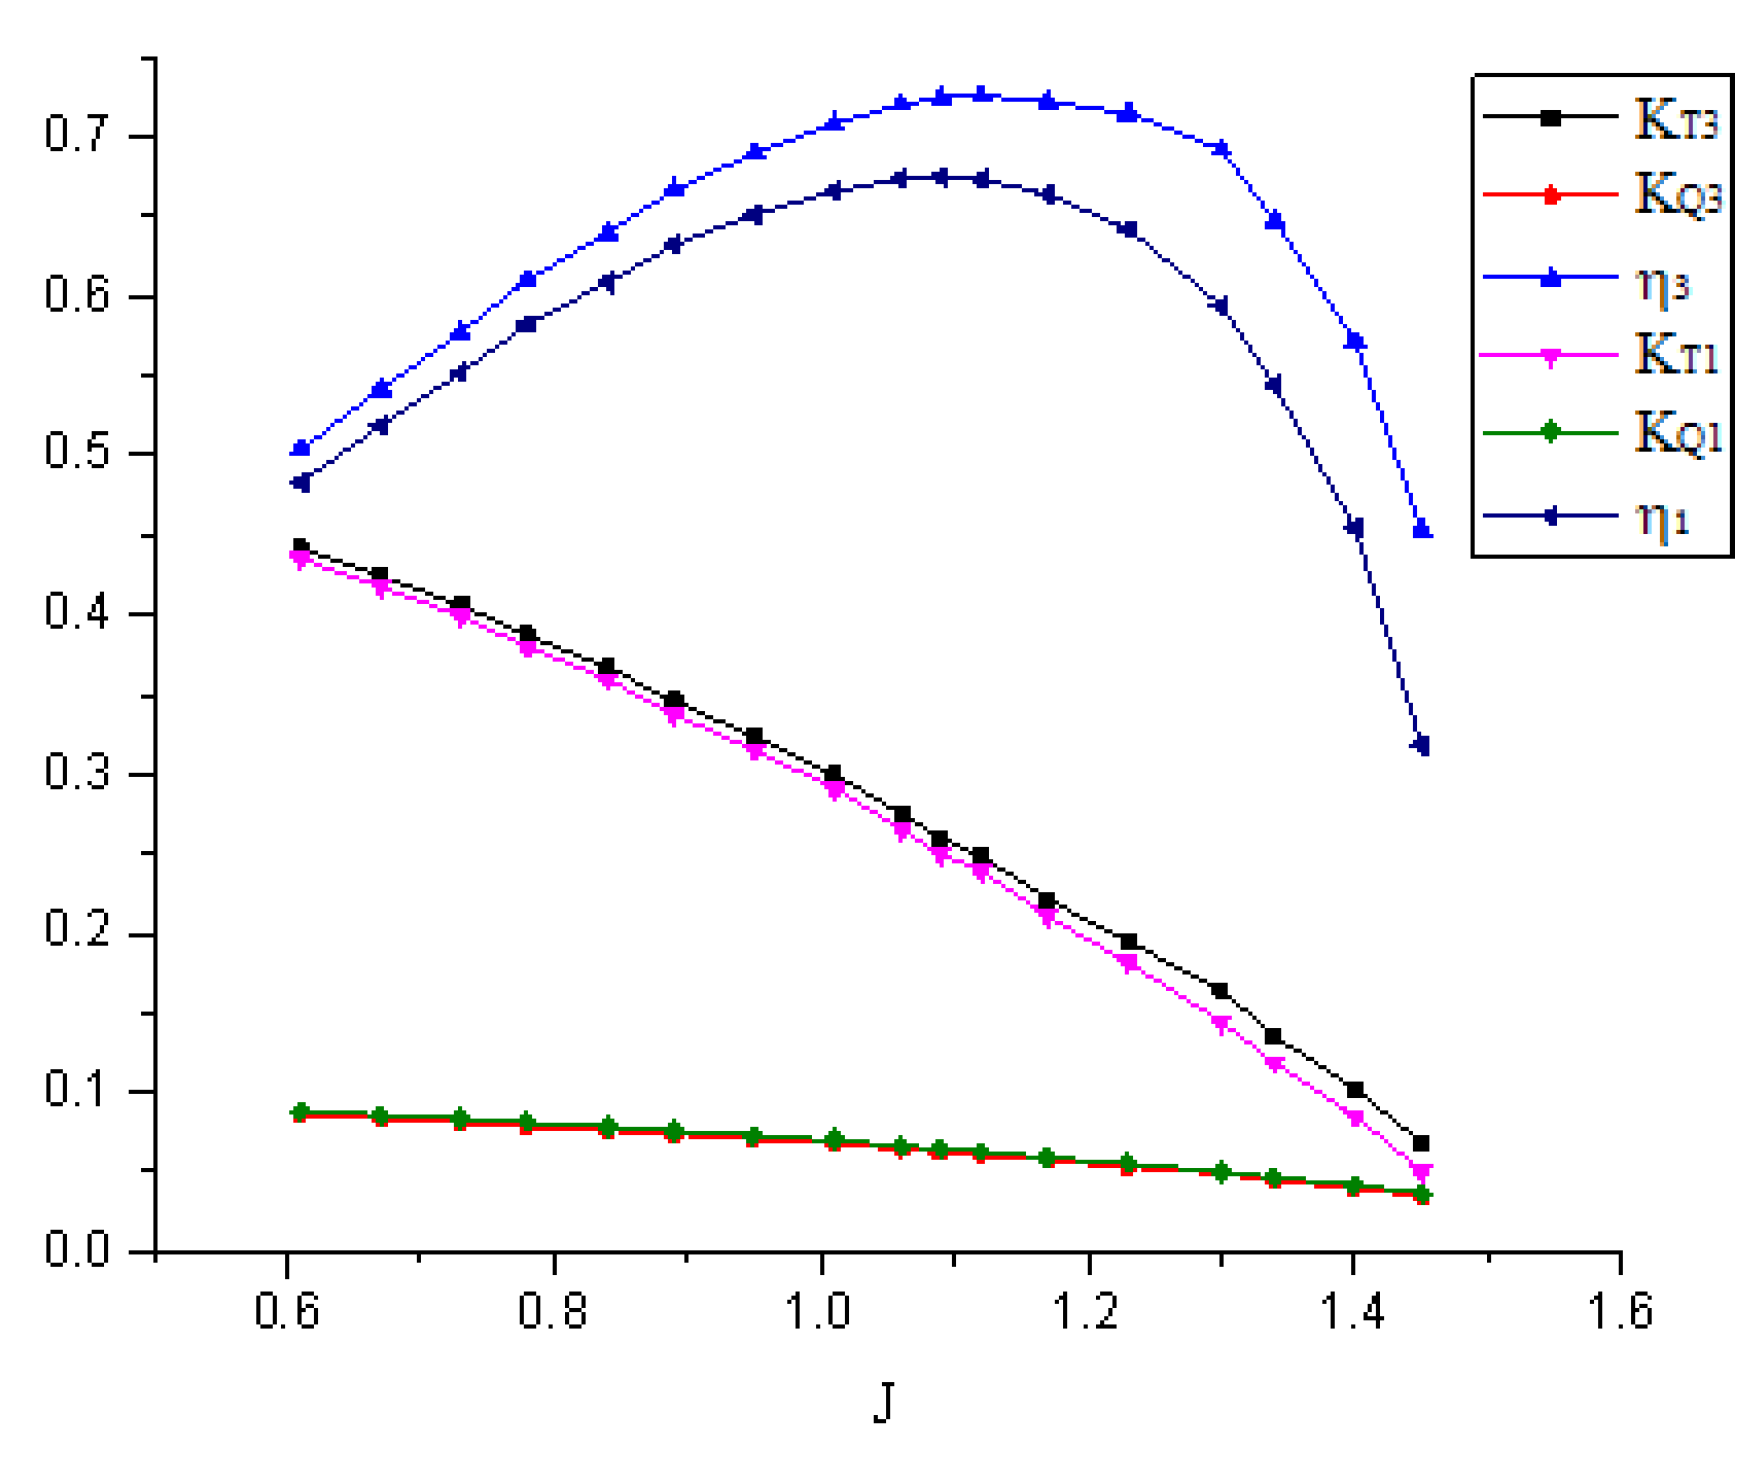
To compare and analyze the hydrodynamic performance of the propeller designed by the two methods more intuitively, Figure 14 shows the hydrodynamic performance curves, where subscript 1 of the symbol represents the performance of the model by the lifting method, subscript 2 represents the performance of the model by the lifting-line method. As can be seen, the general trends of the propeller hydrodynamic curves designed by the two methods are almost the same, while the thrust coefficient of the rotor system is significantly greater than that of the stator system, which is the main source of the overall thrust. Therefore, the rotor system contributes most of the useful work. Another important finding is that both the rotor system thrust and the stator system thrust have a relatively good linear relationship with the advance coefficient J.
Figure 15 shows the comparison of hydrodynamic performance by the two design methods. It can be seen from the figure that when the advance coefficients J are 1.09 and 1.17; the efficiency of the two pump-jet propellers is the largest, reaching 67.48% and 67%, respectively. When J < 1.15, compared to the pump-jet designed by the lifting-line method, the efficiency of pump-jet by lifting method is roughly five percent higher on average. When the advanced ratio is 1.2, the decrease is obvious. In the working conditions, the size of the efficient range (η > 60%) of the two methods is almost the same, but the lifting method is more suitable for low and medium speeds, while the lifting-line method is more suitable for medium and high speeds.
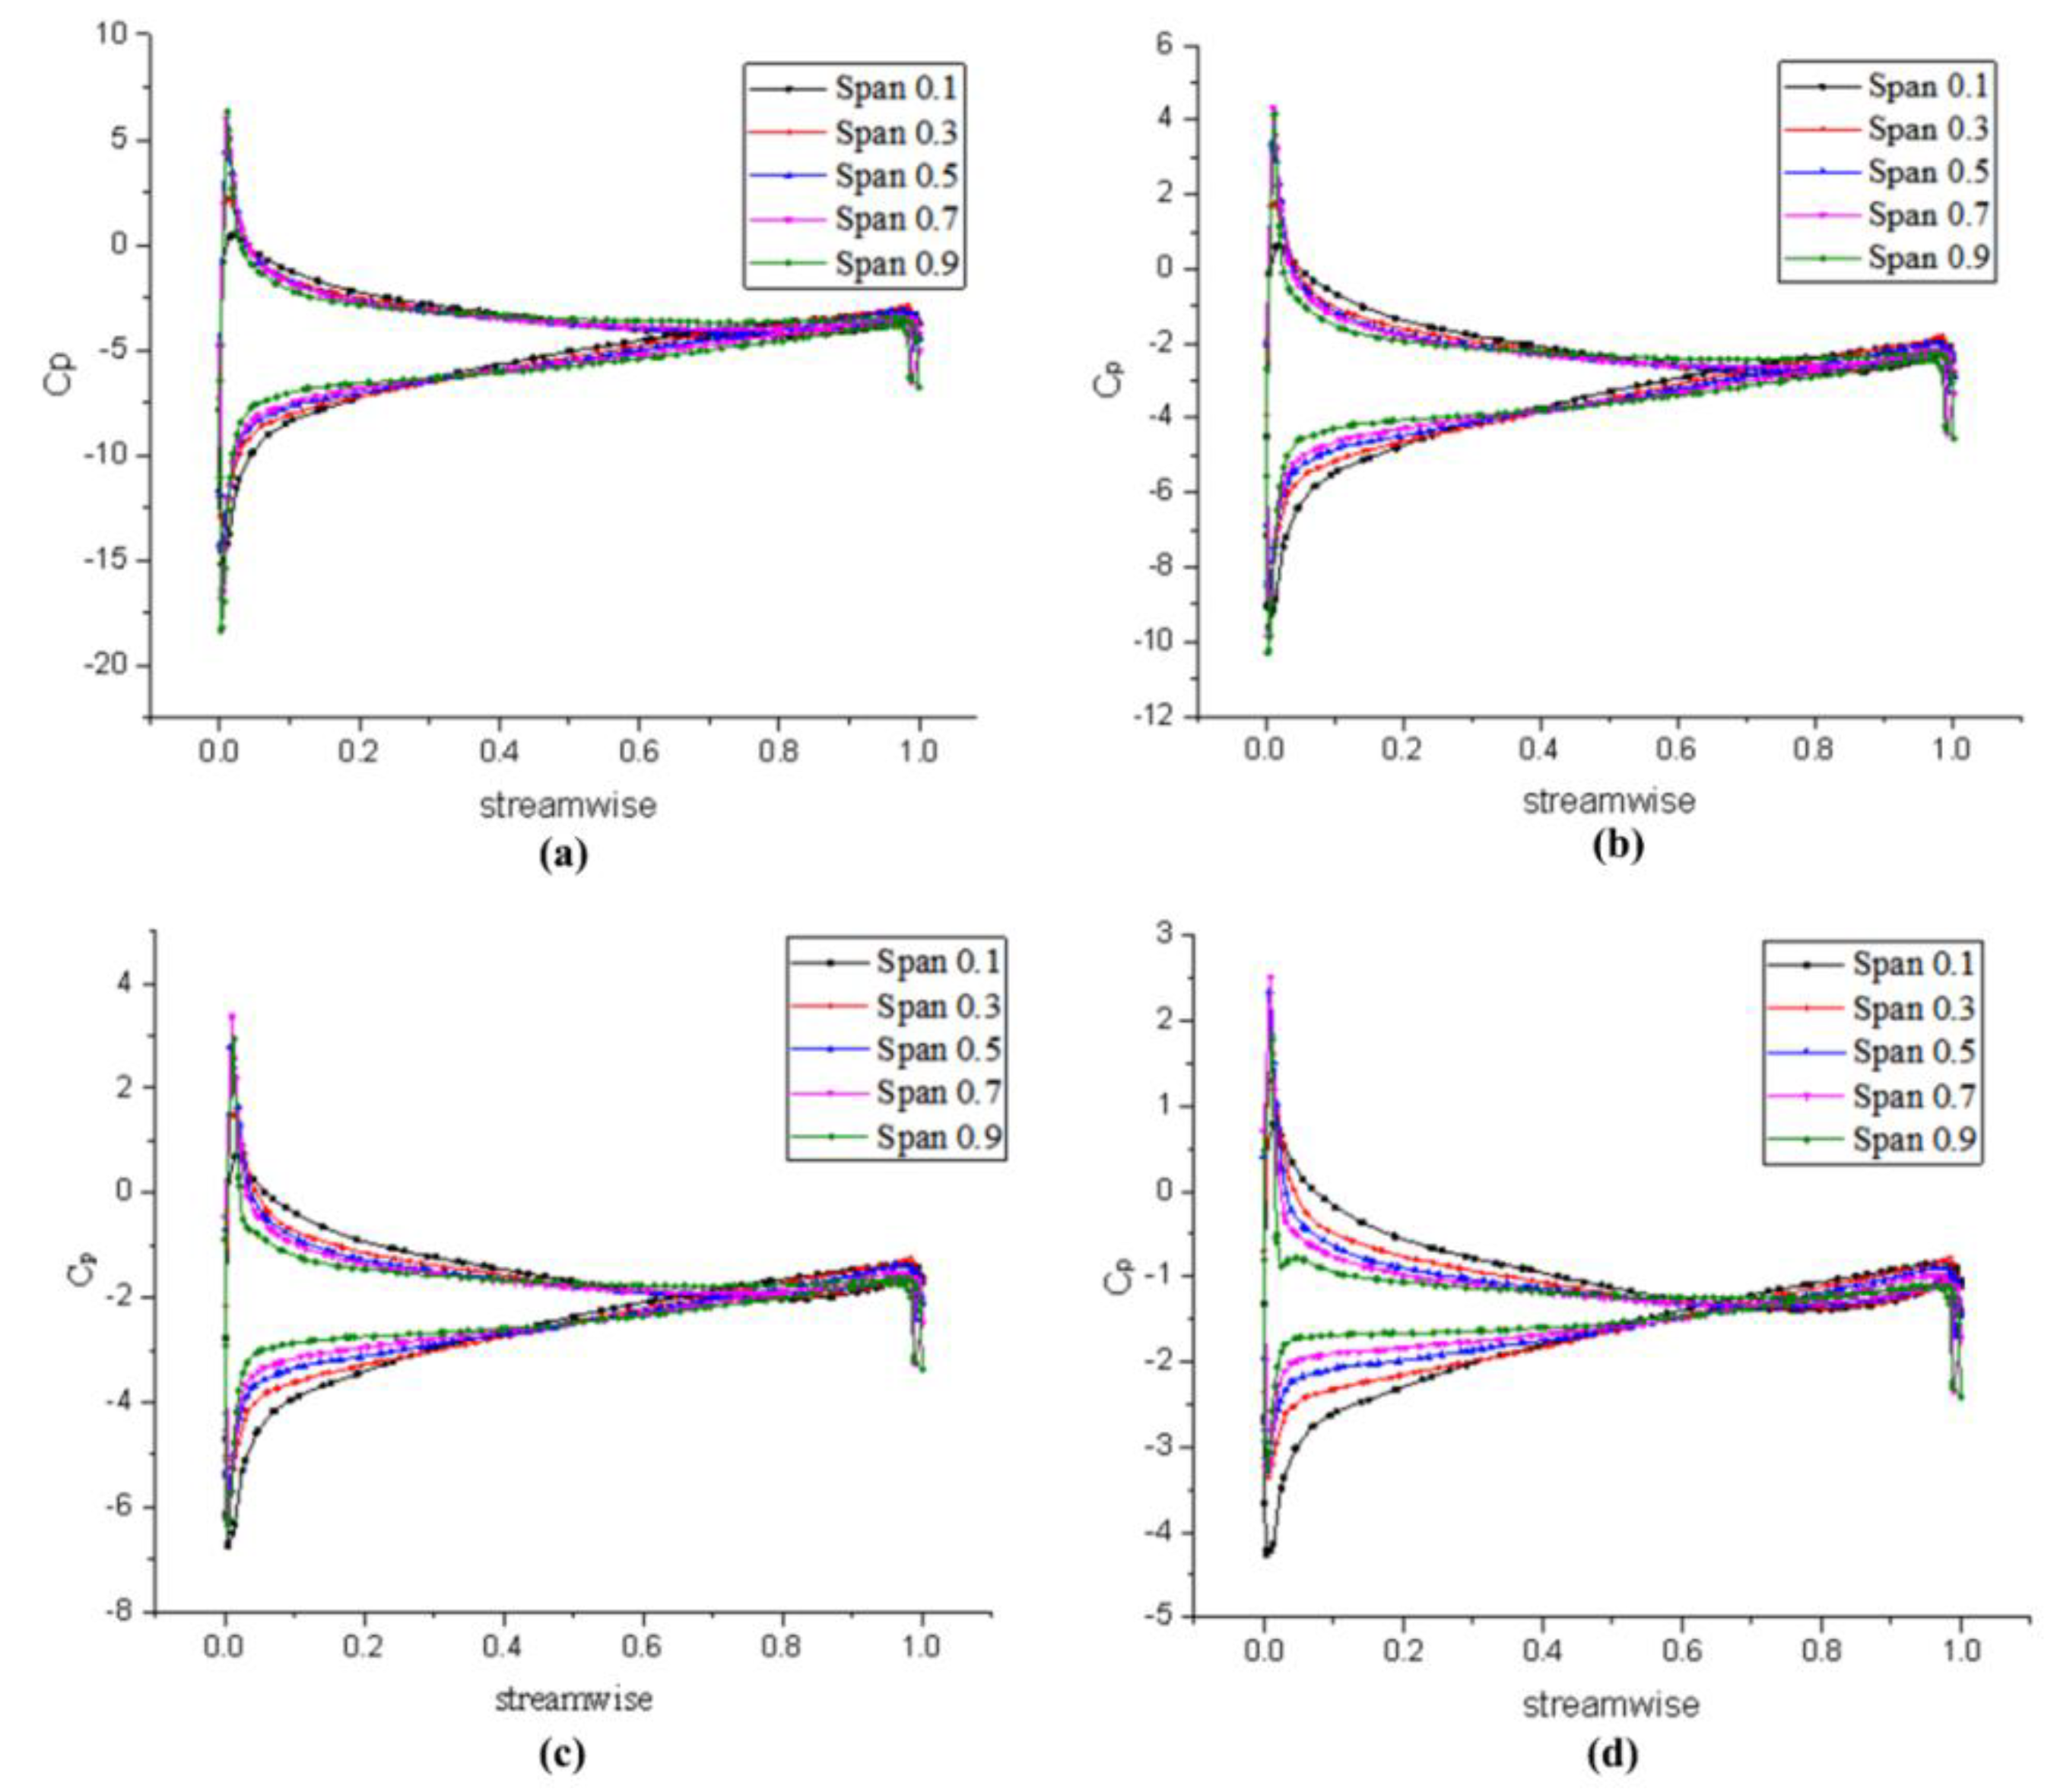
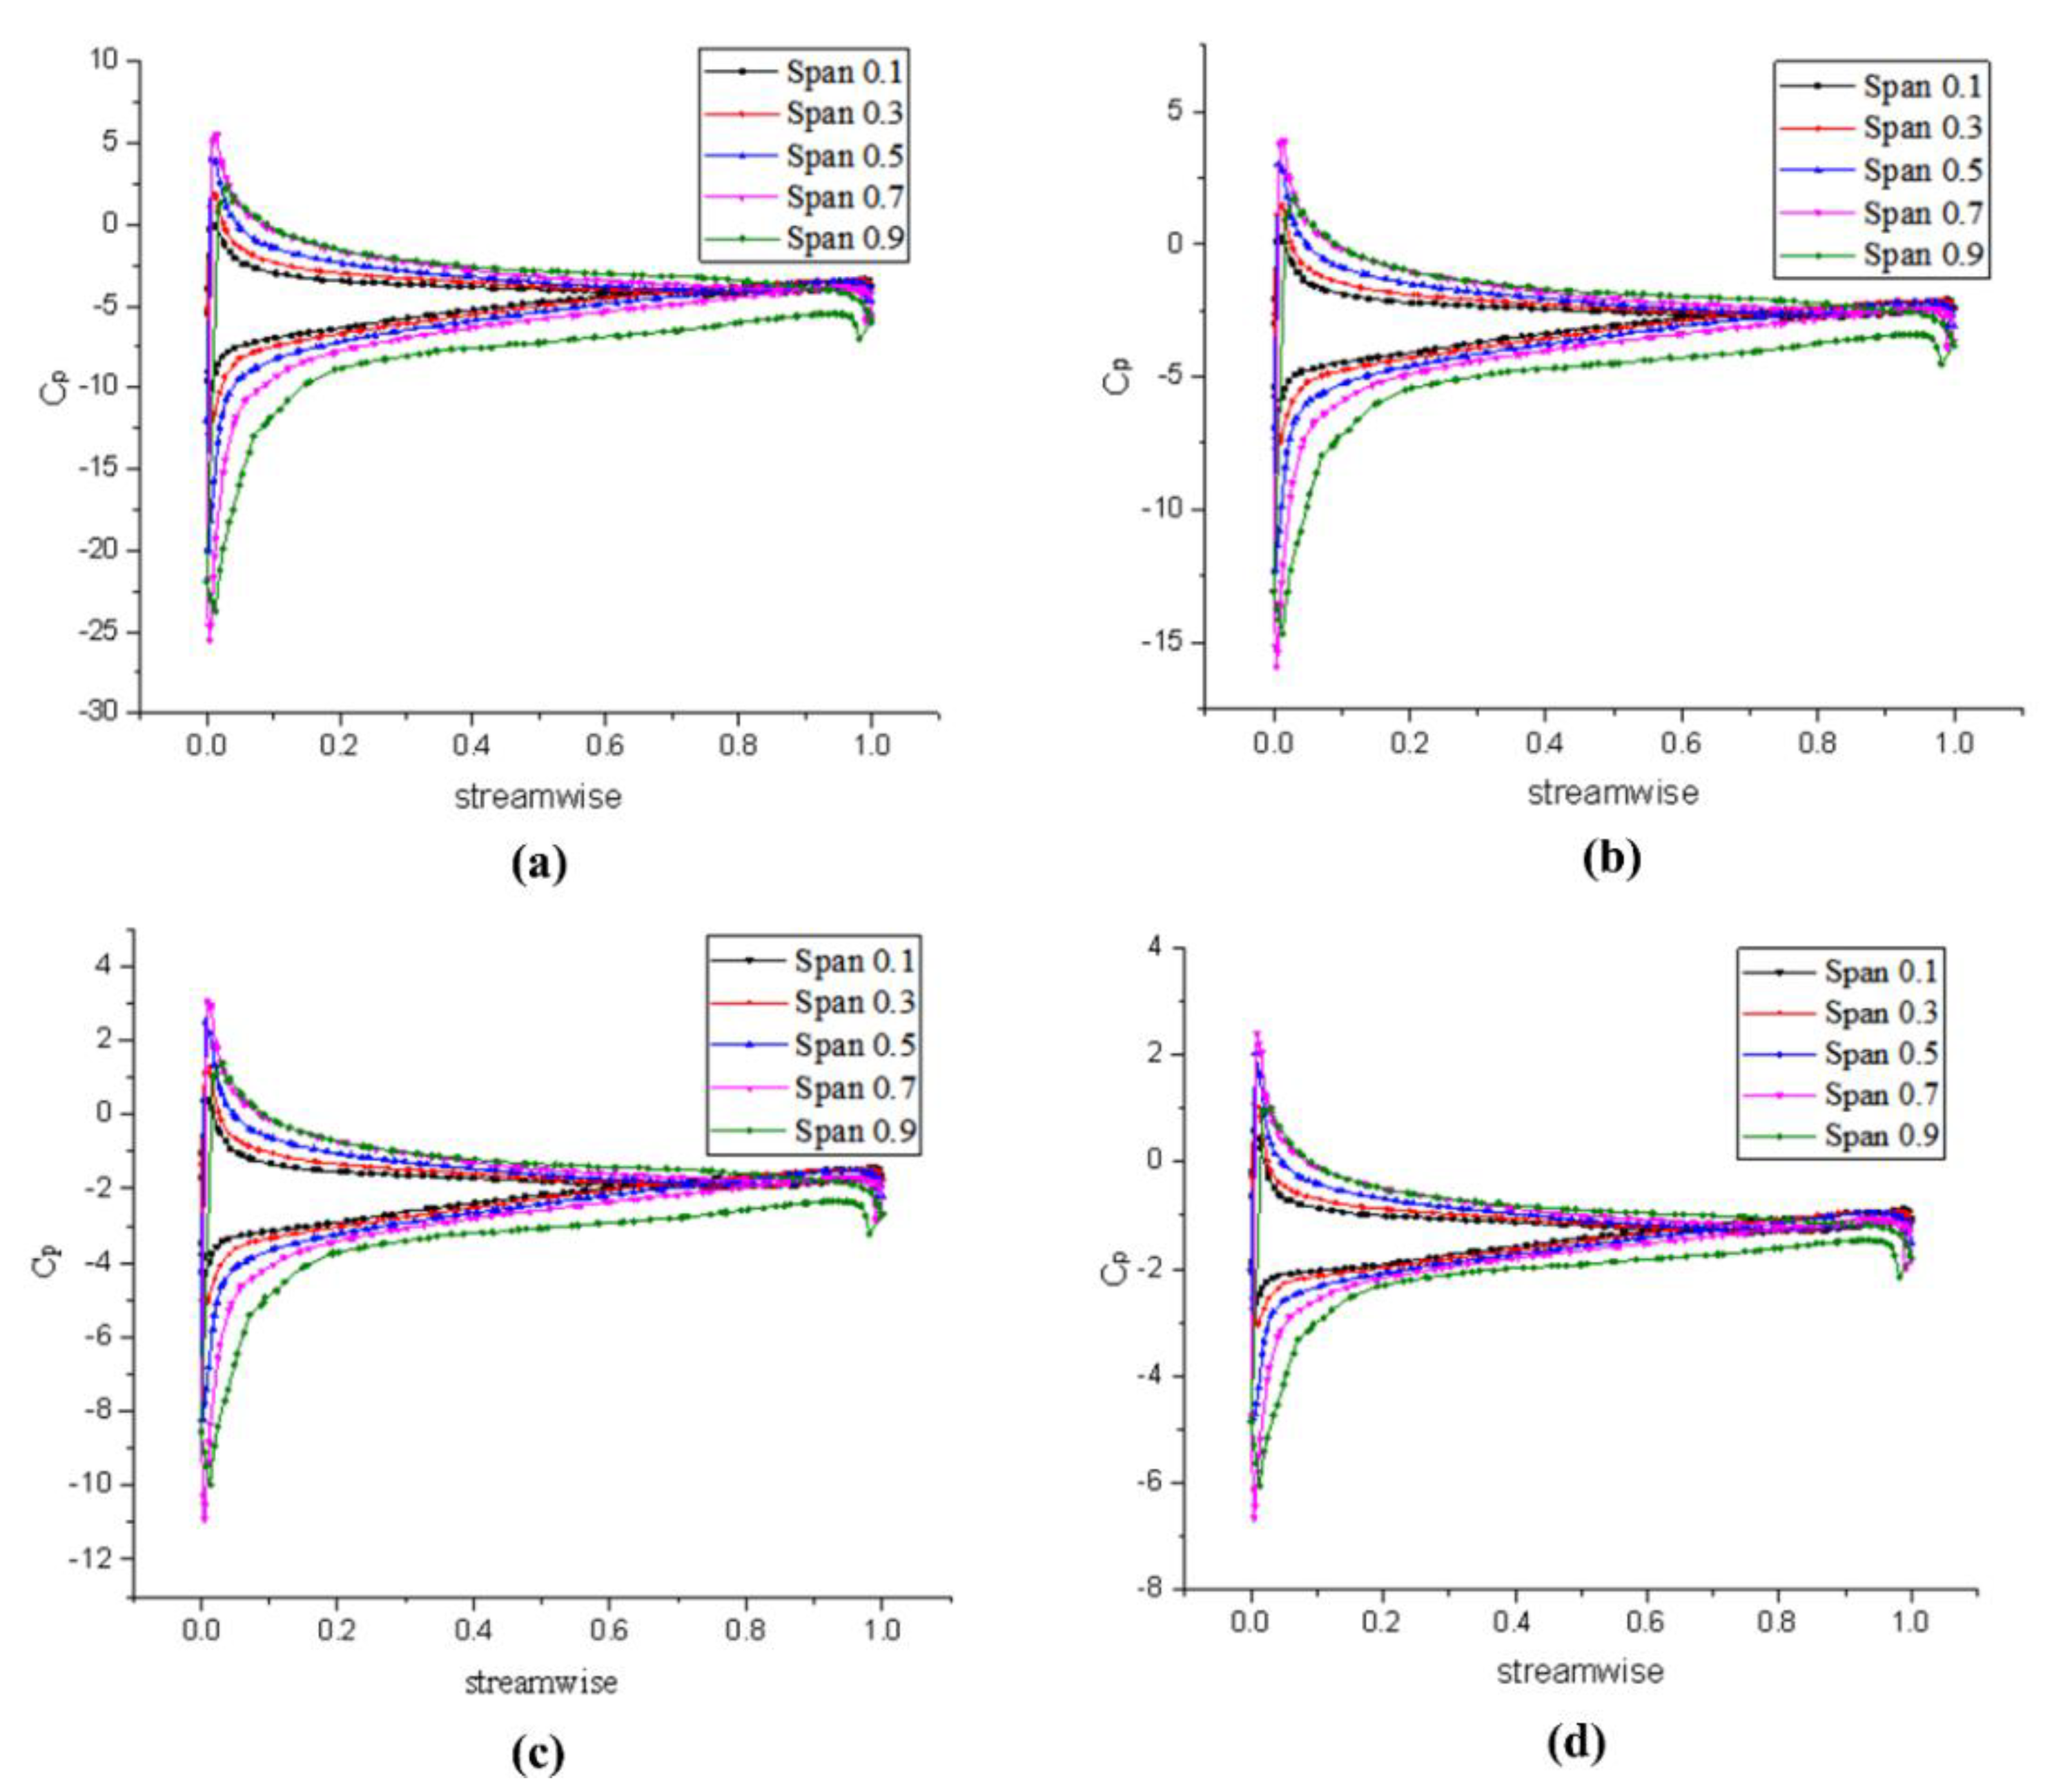
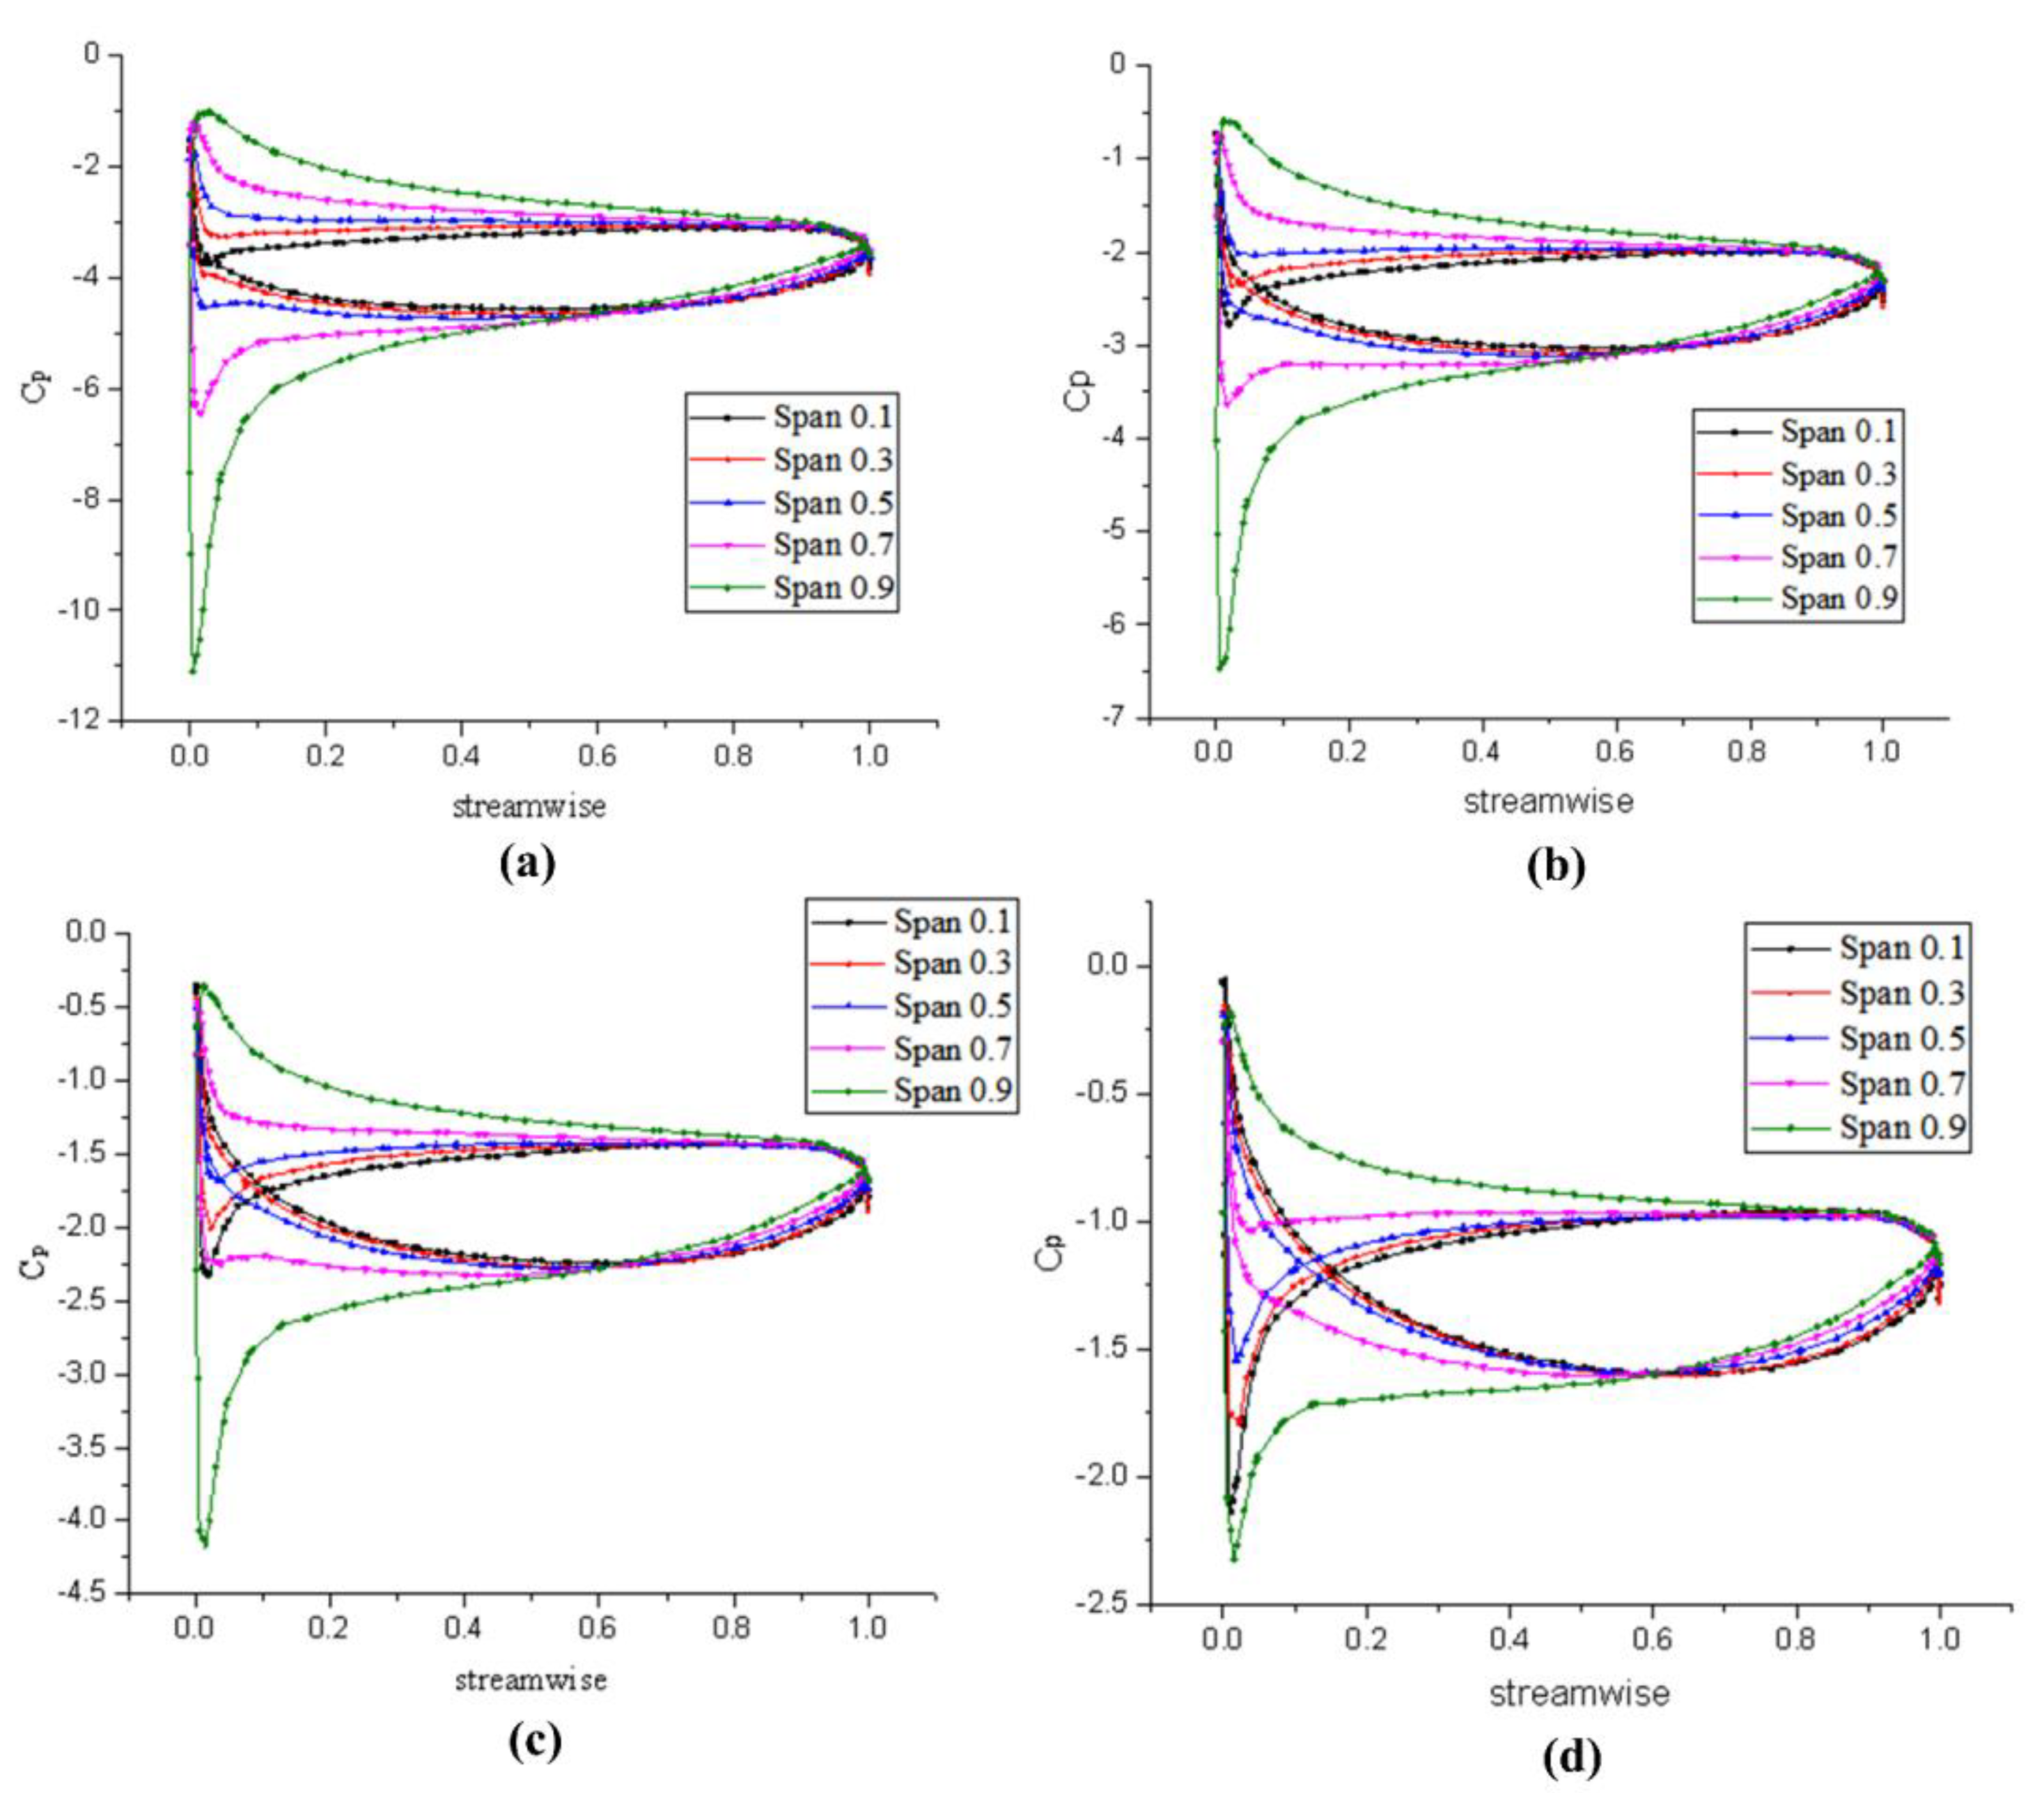
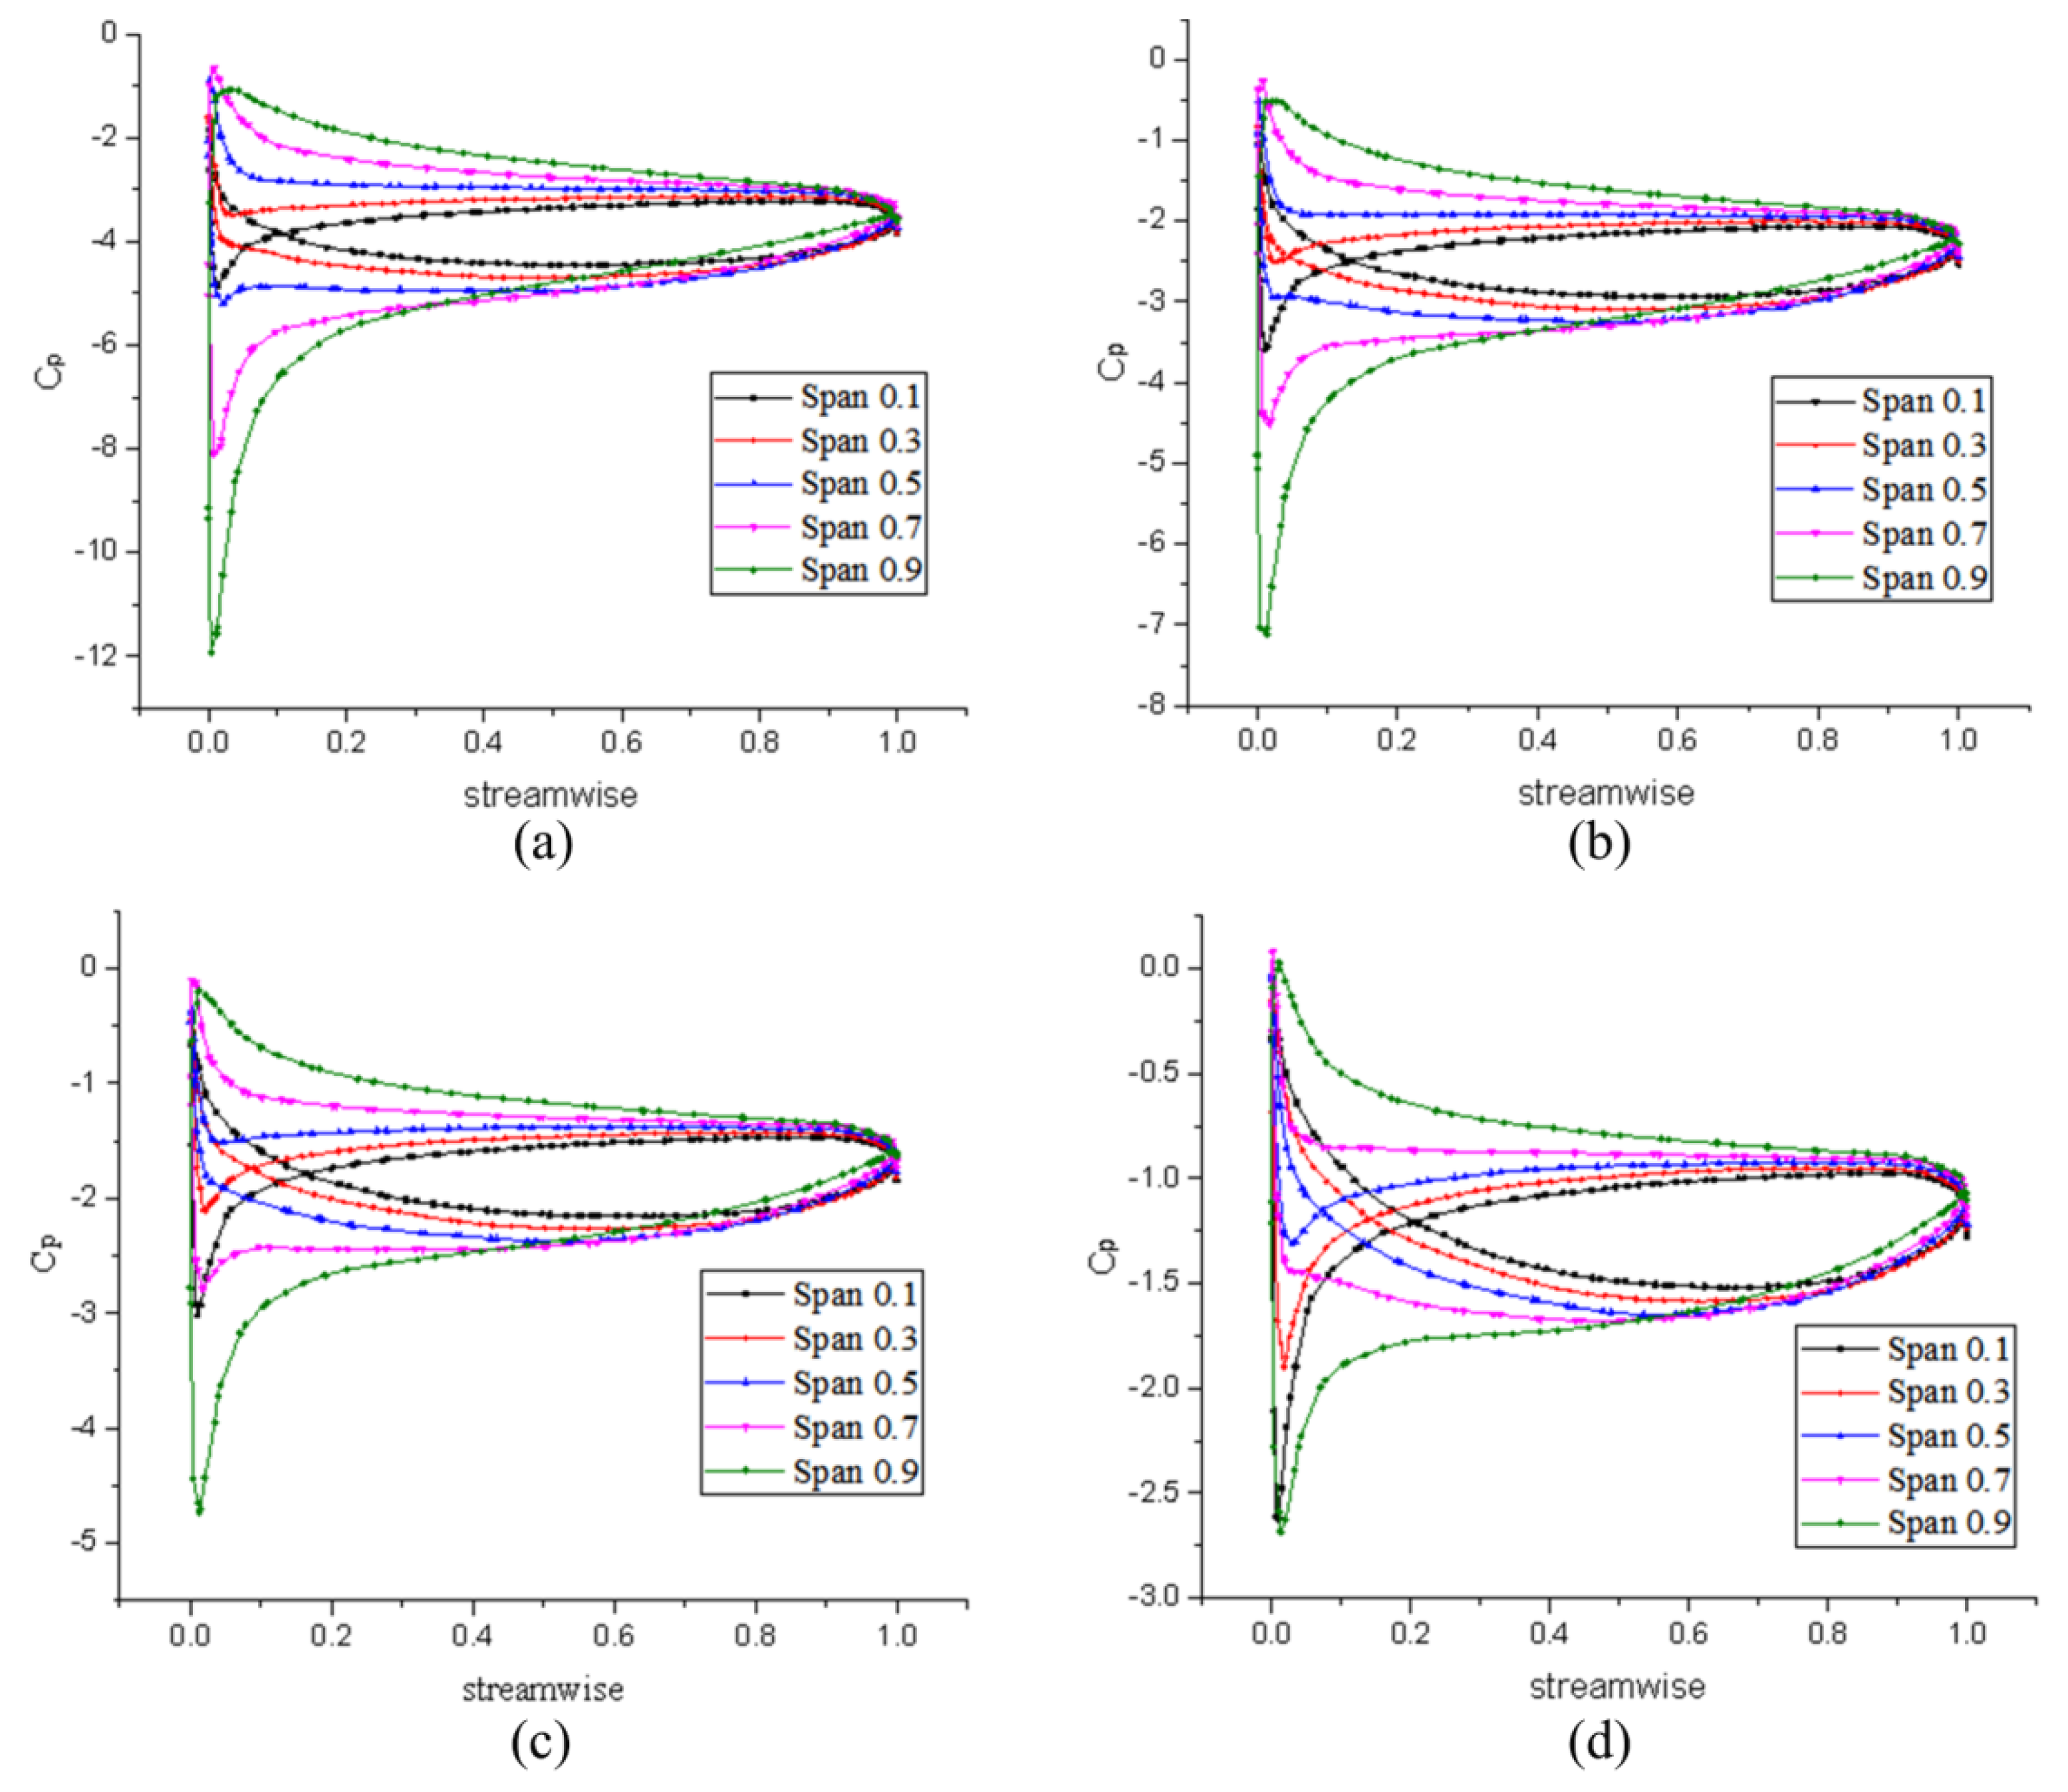
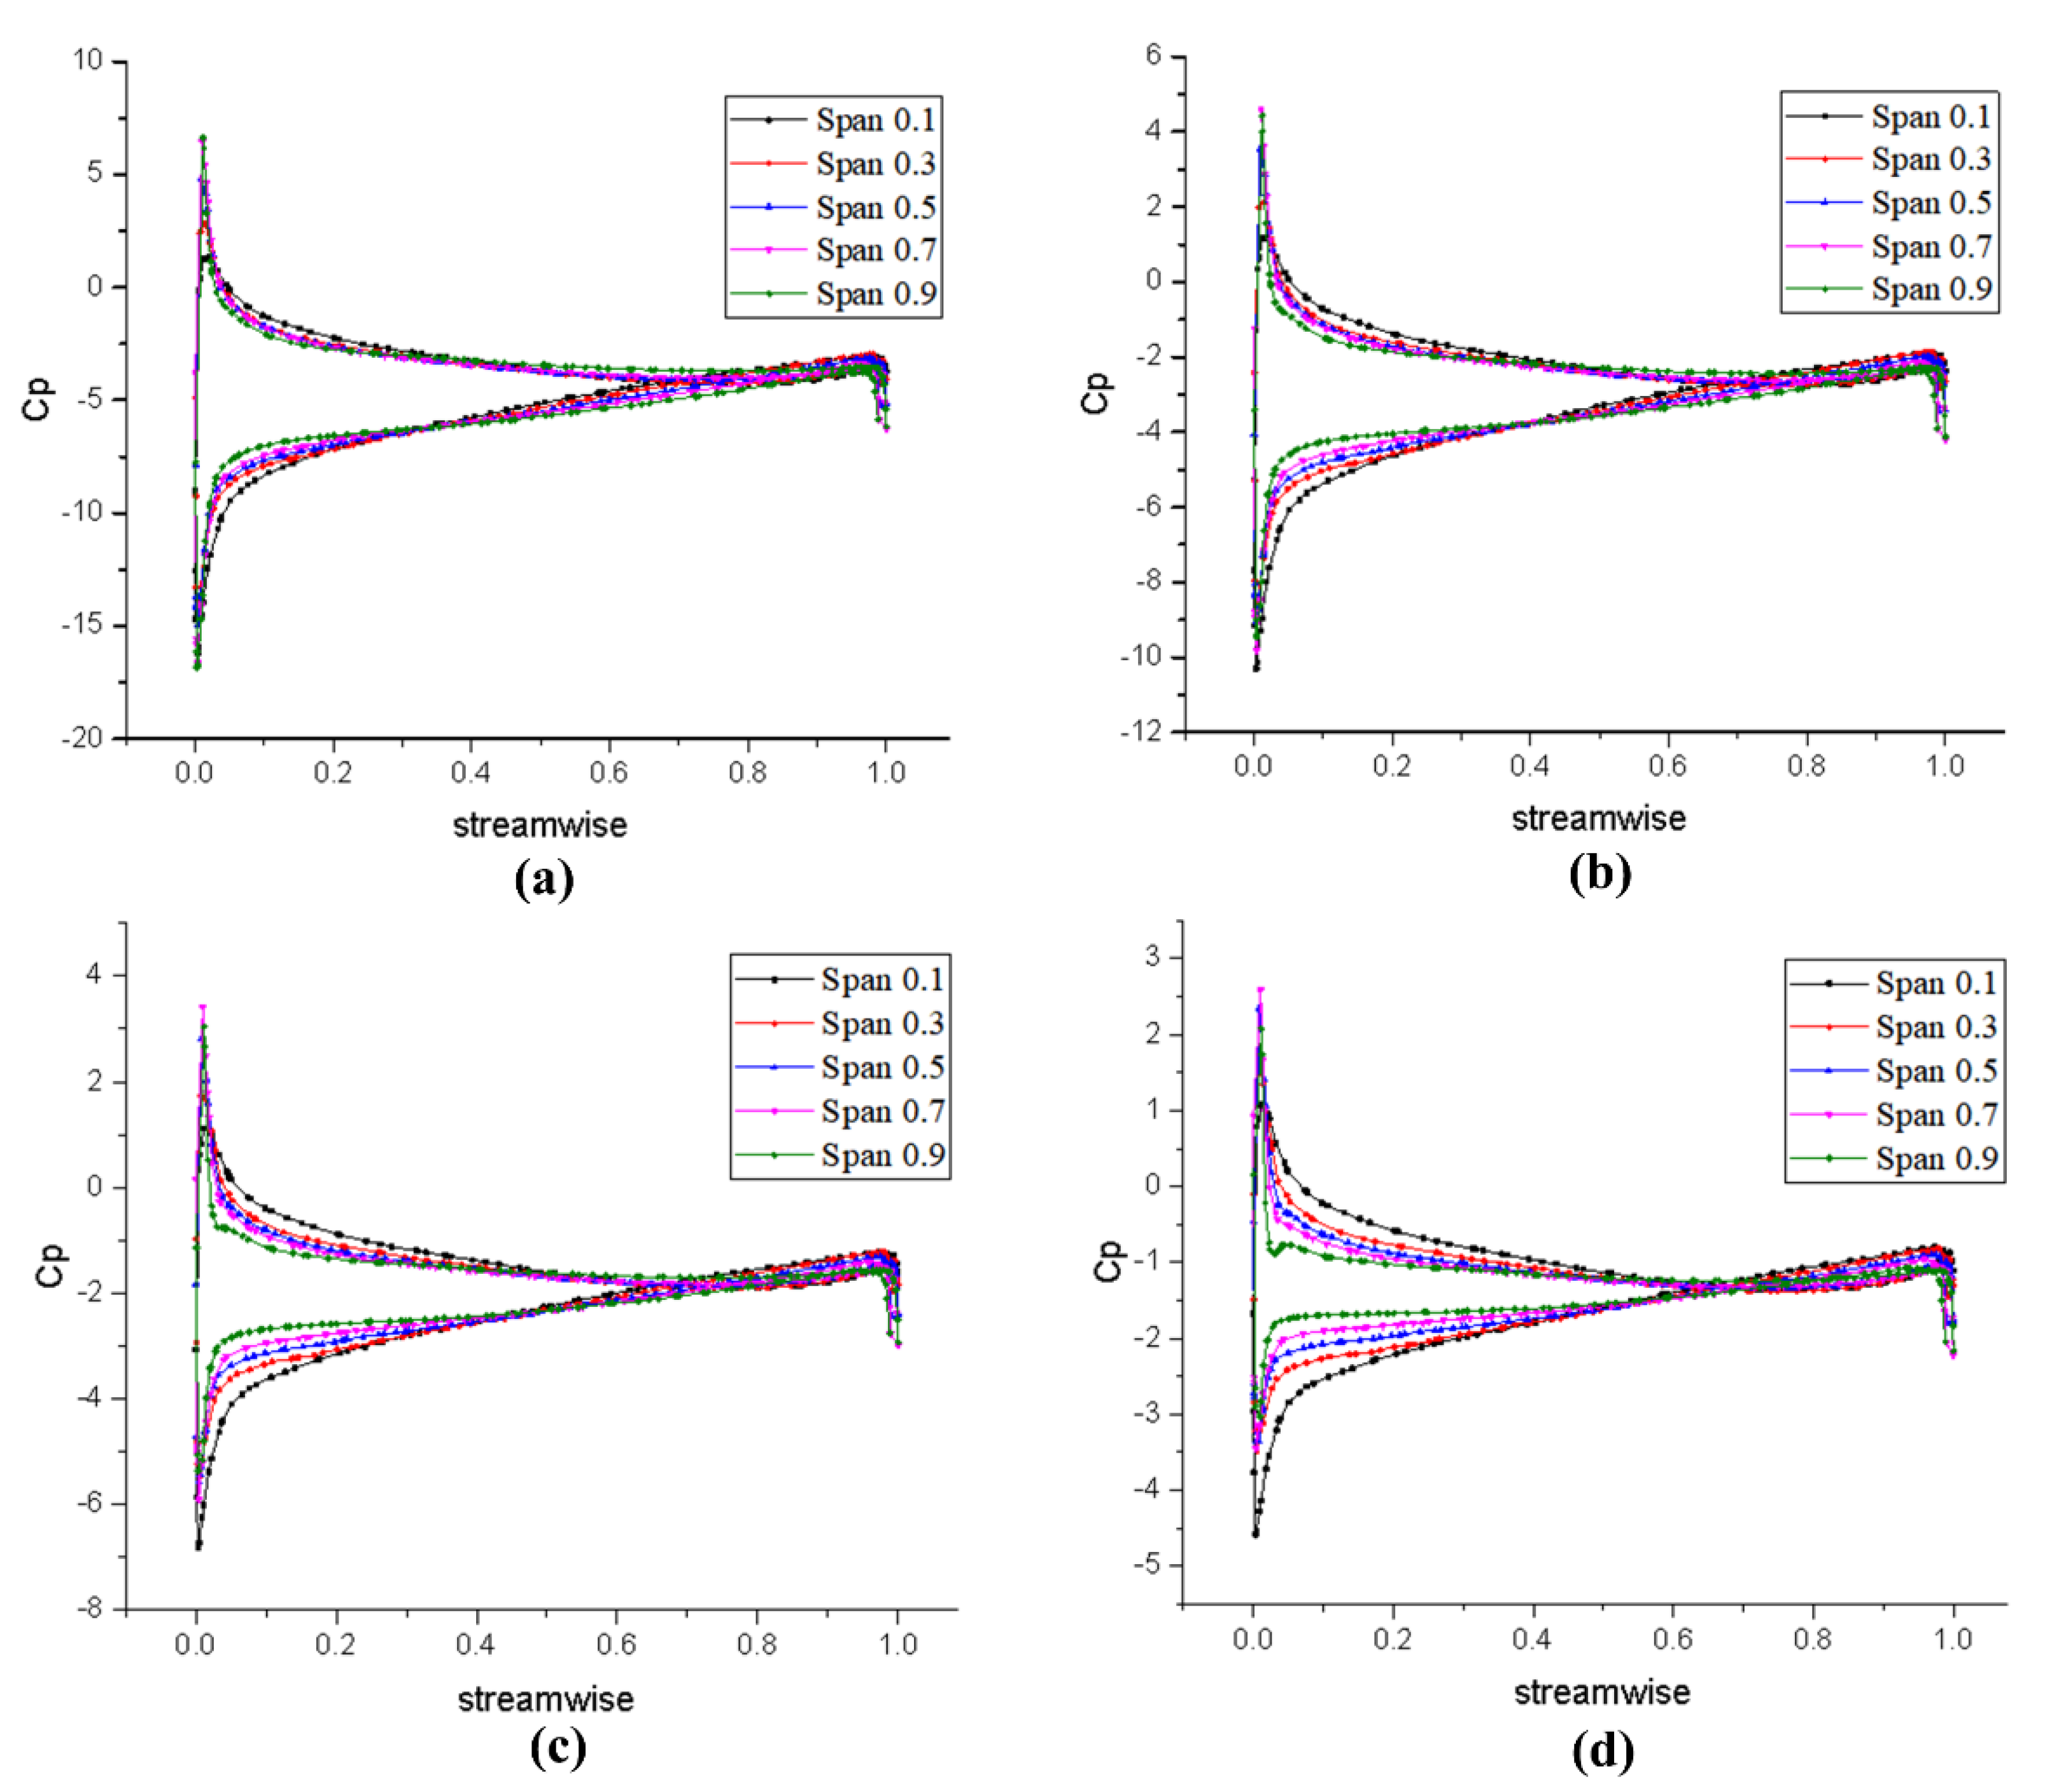
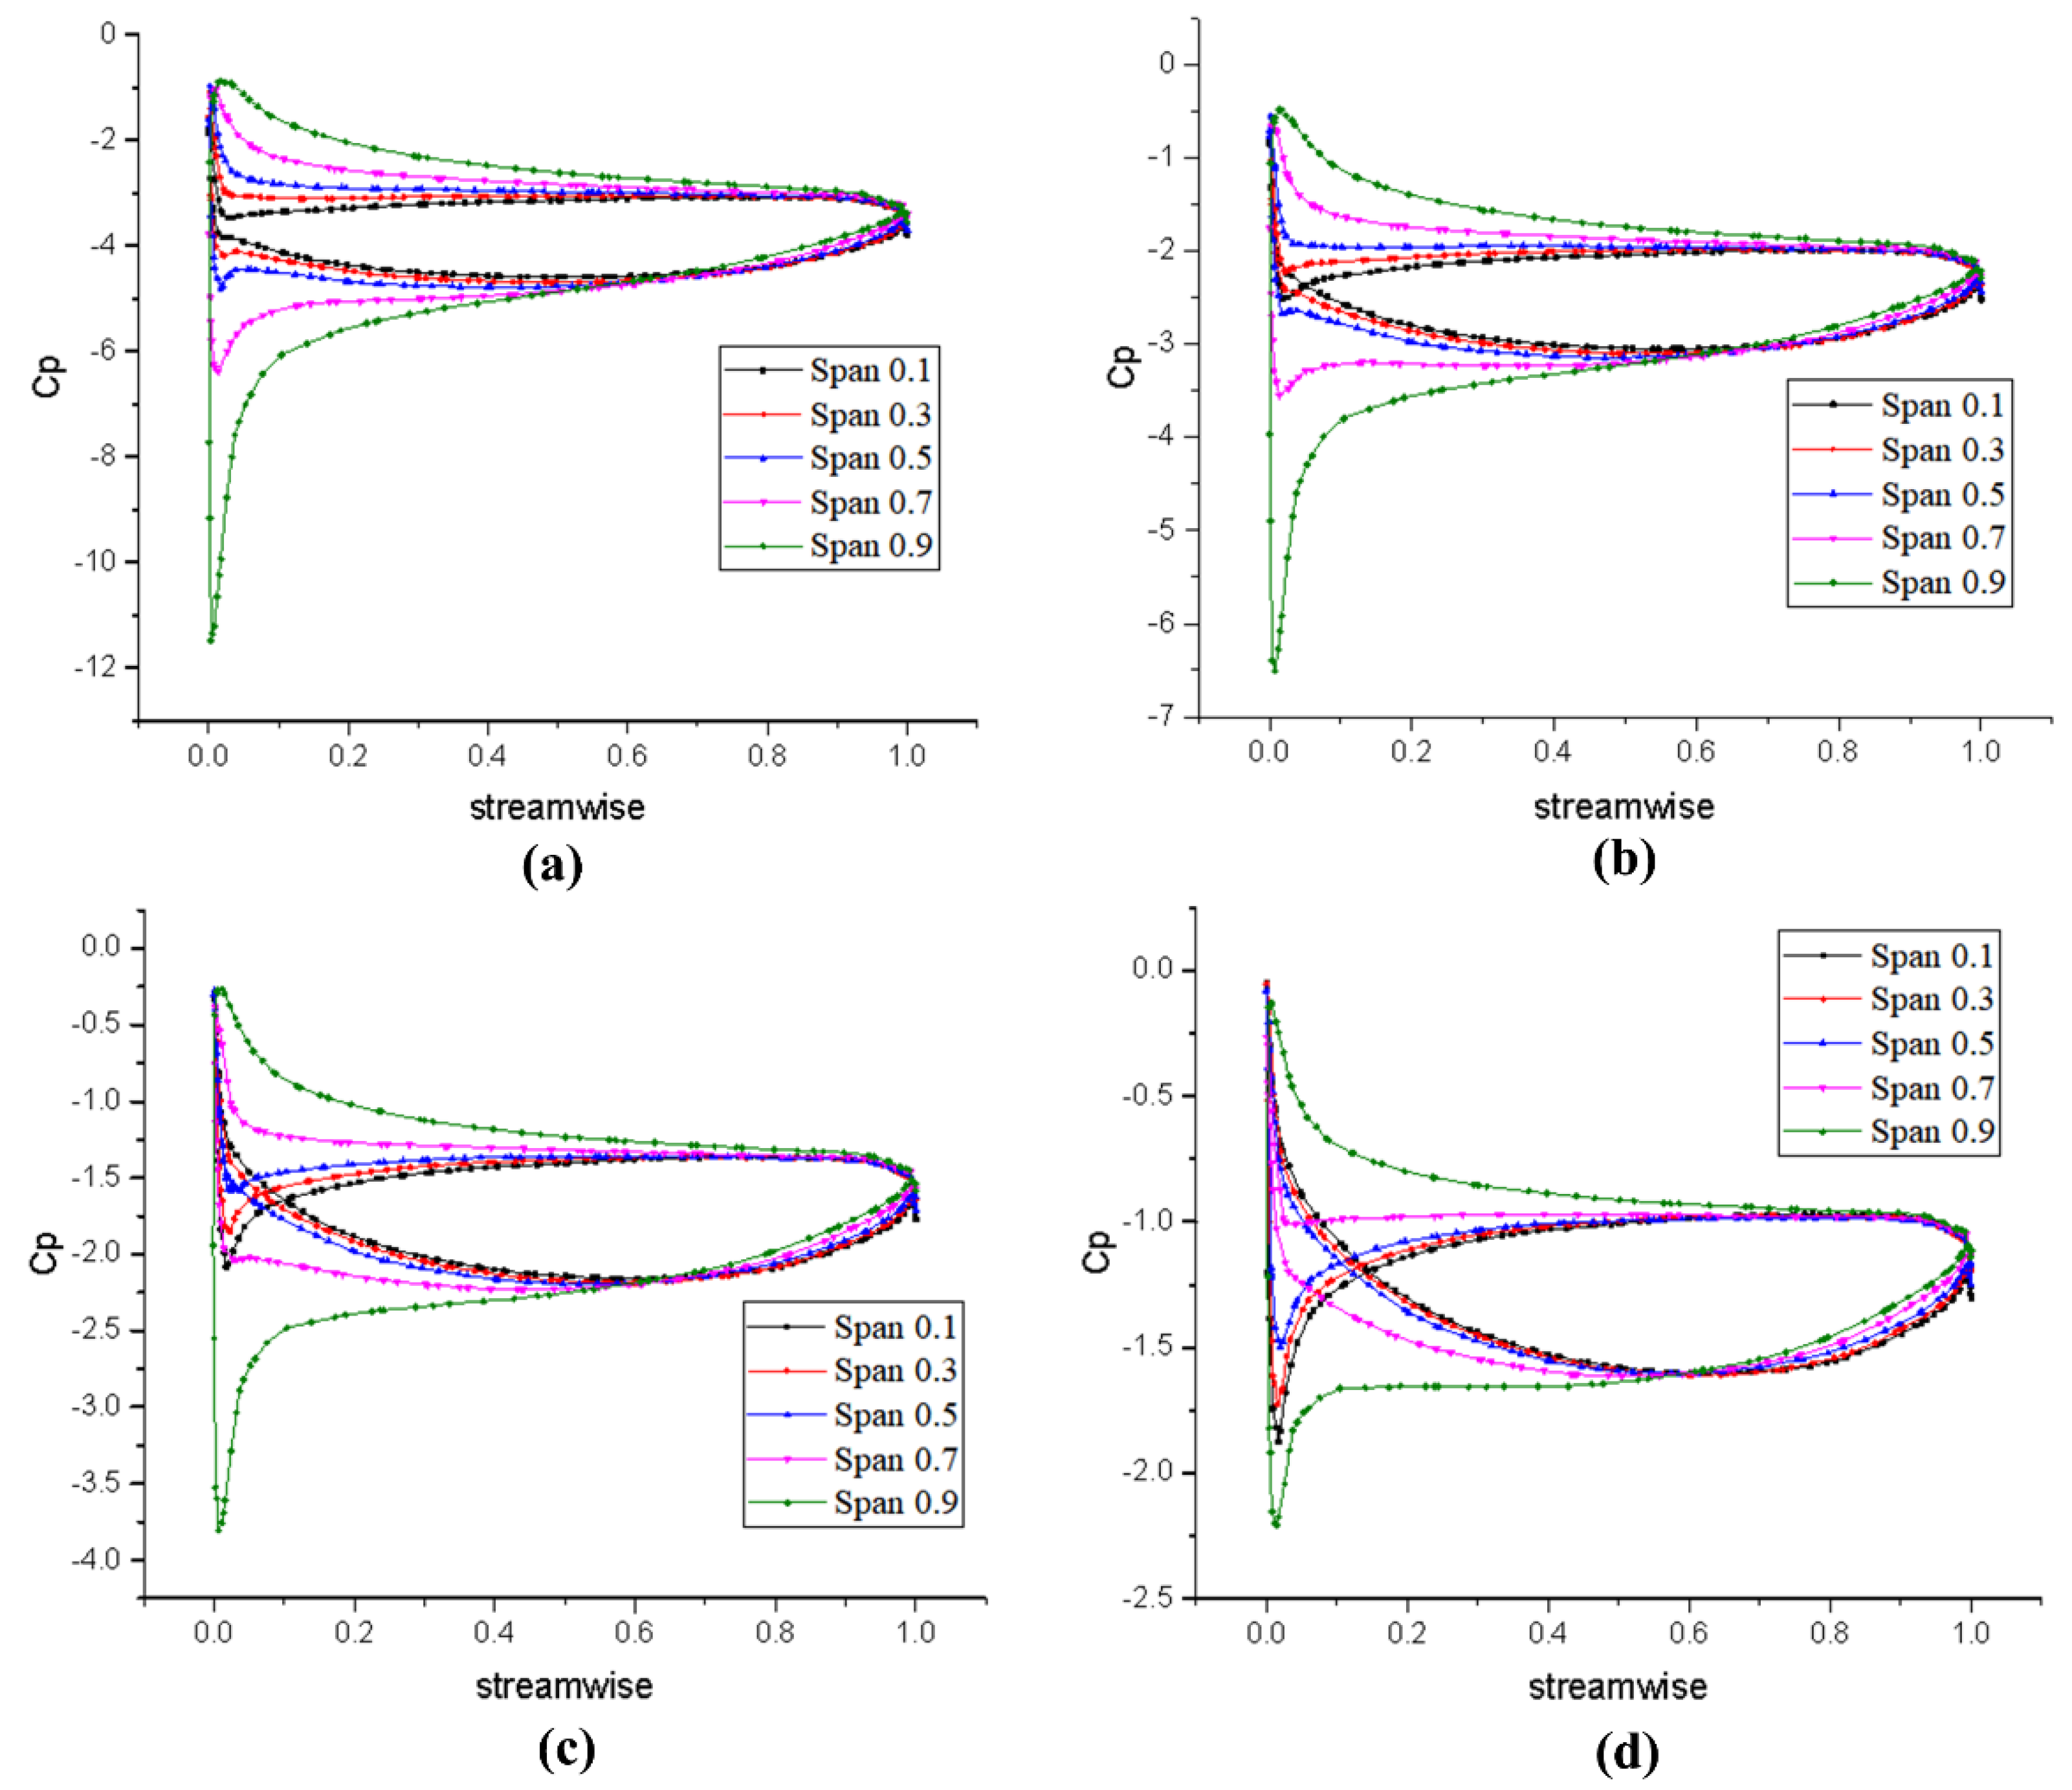
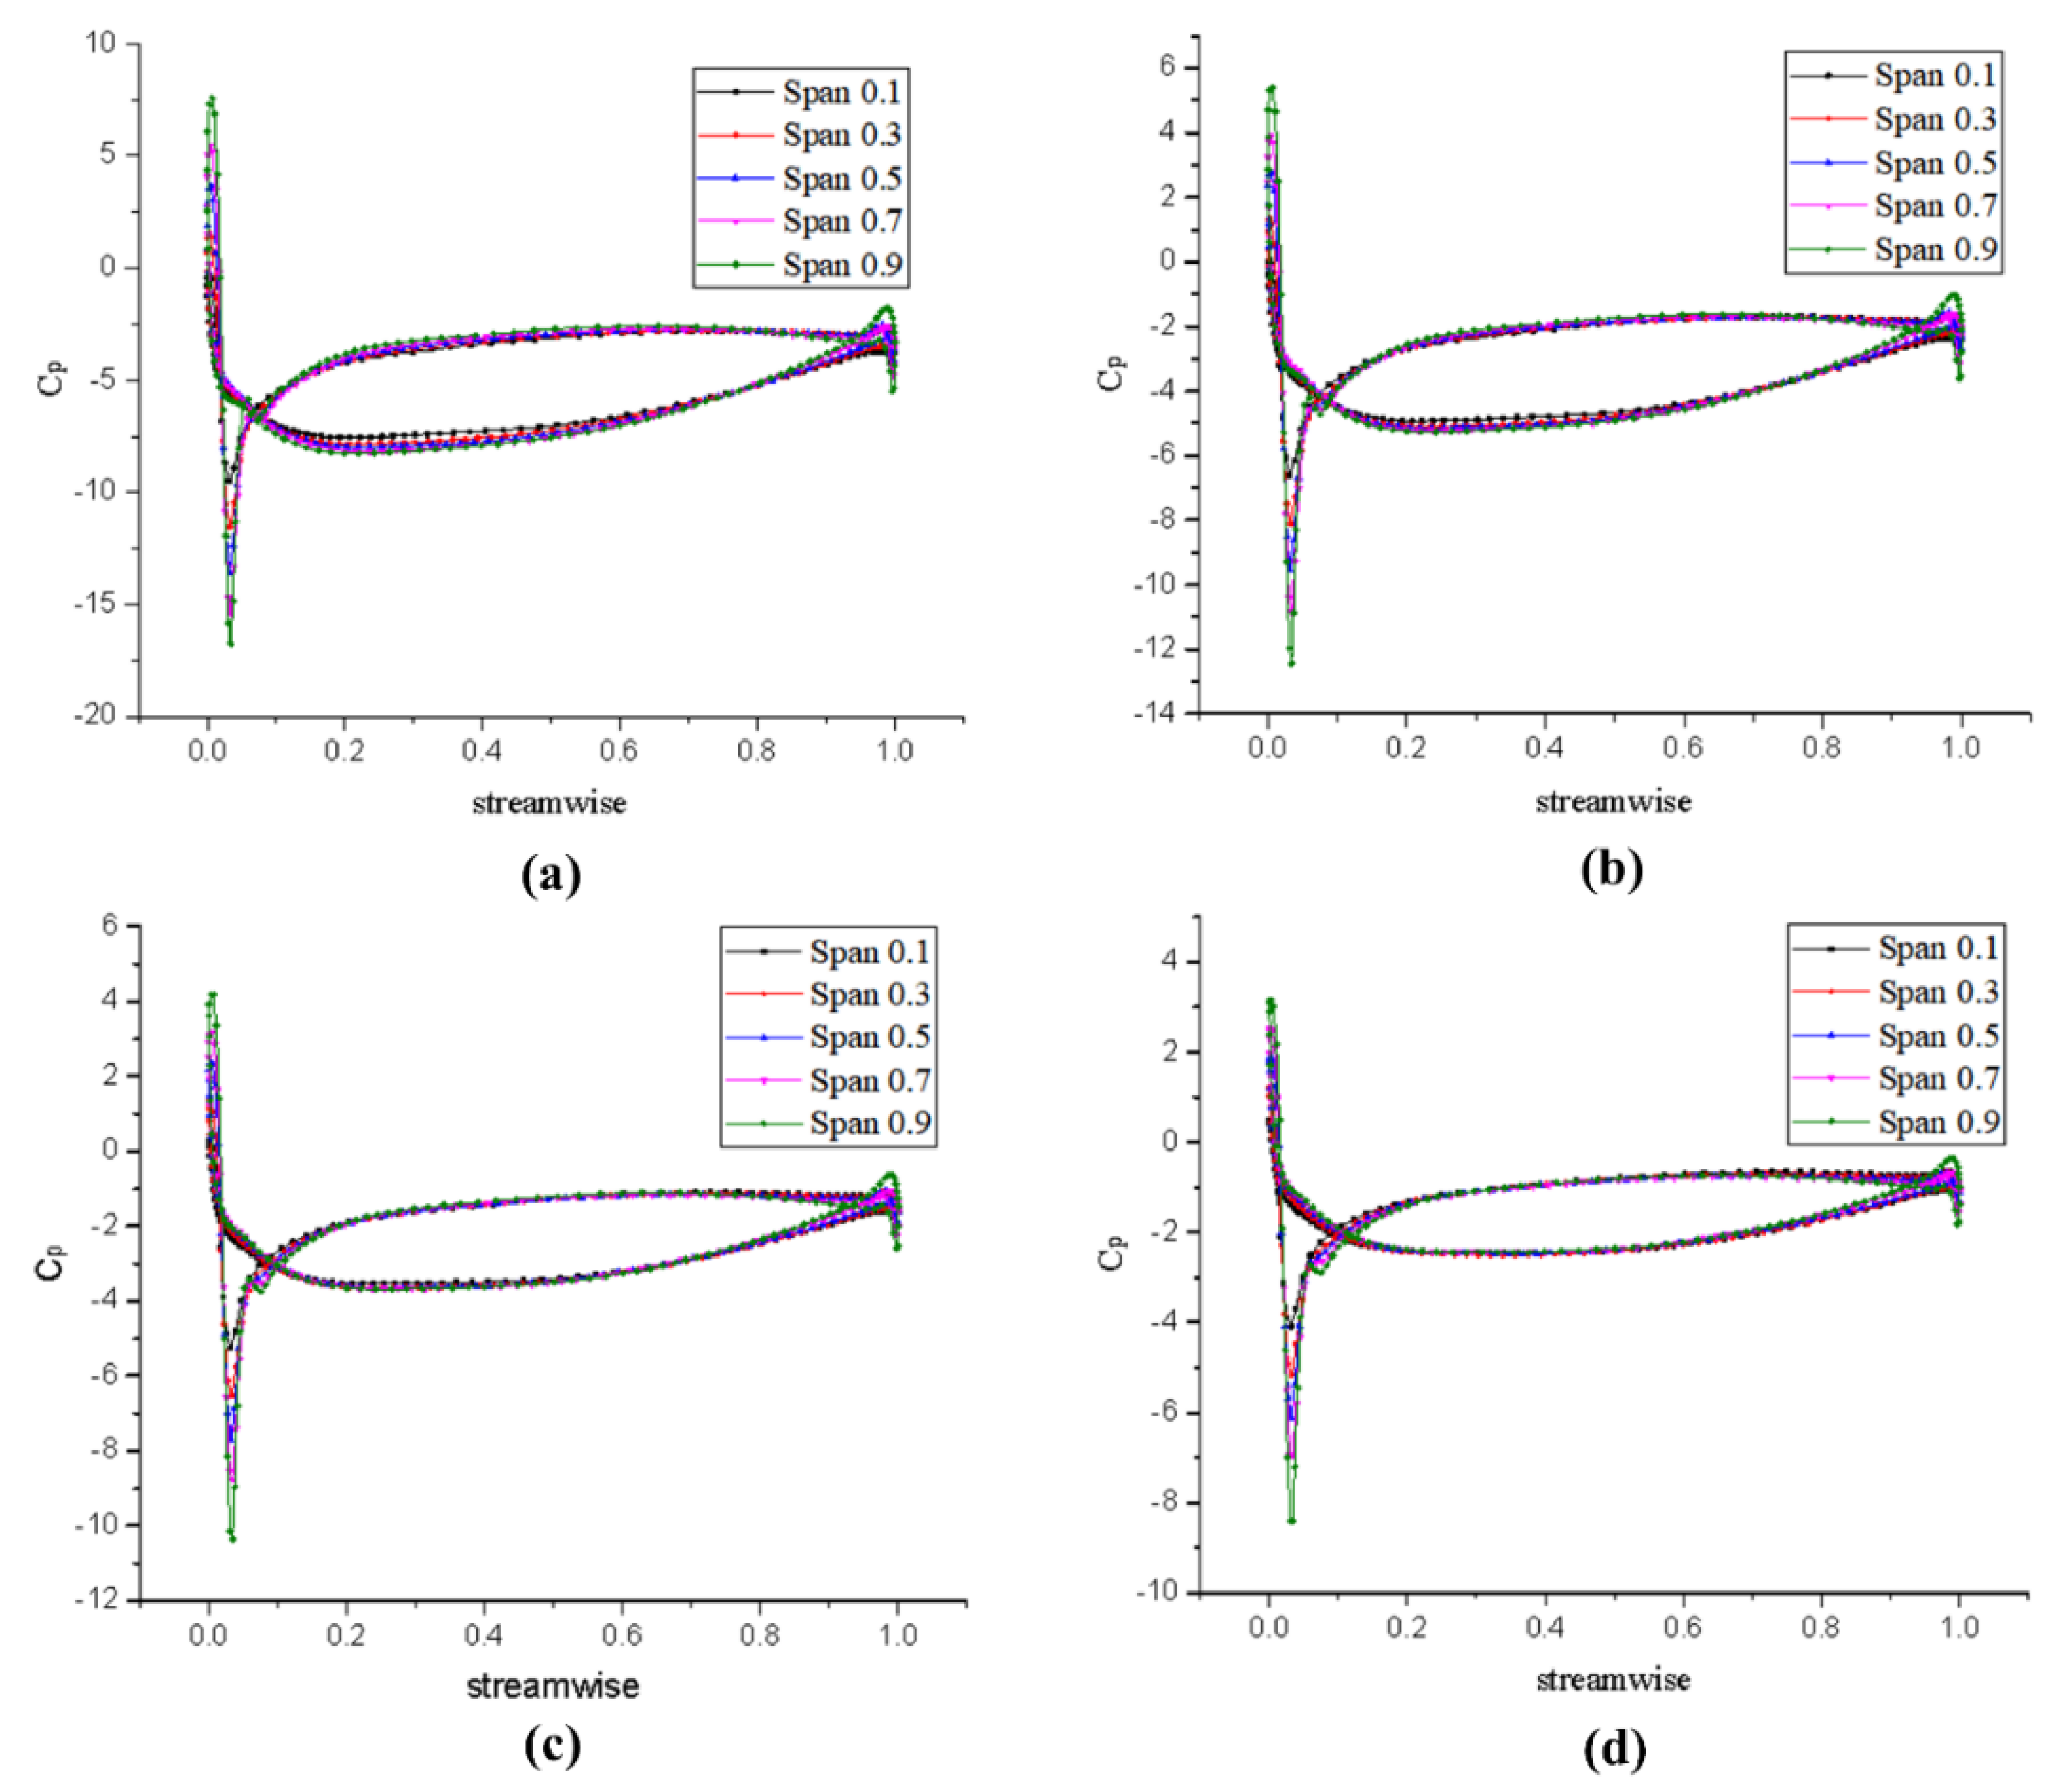
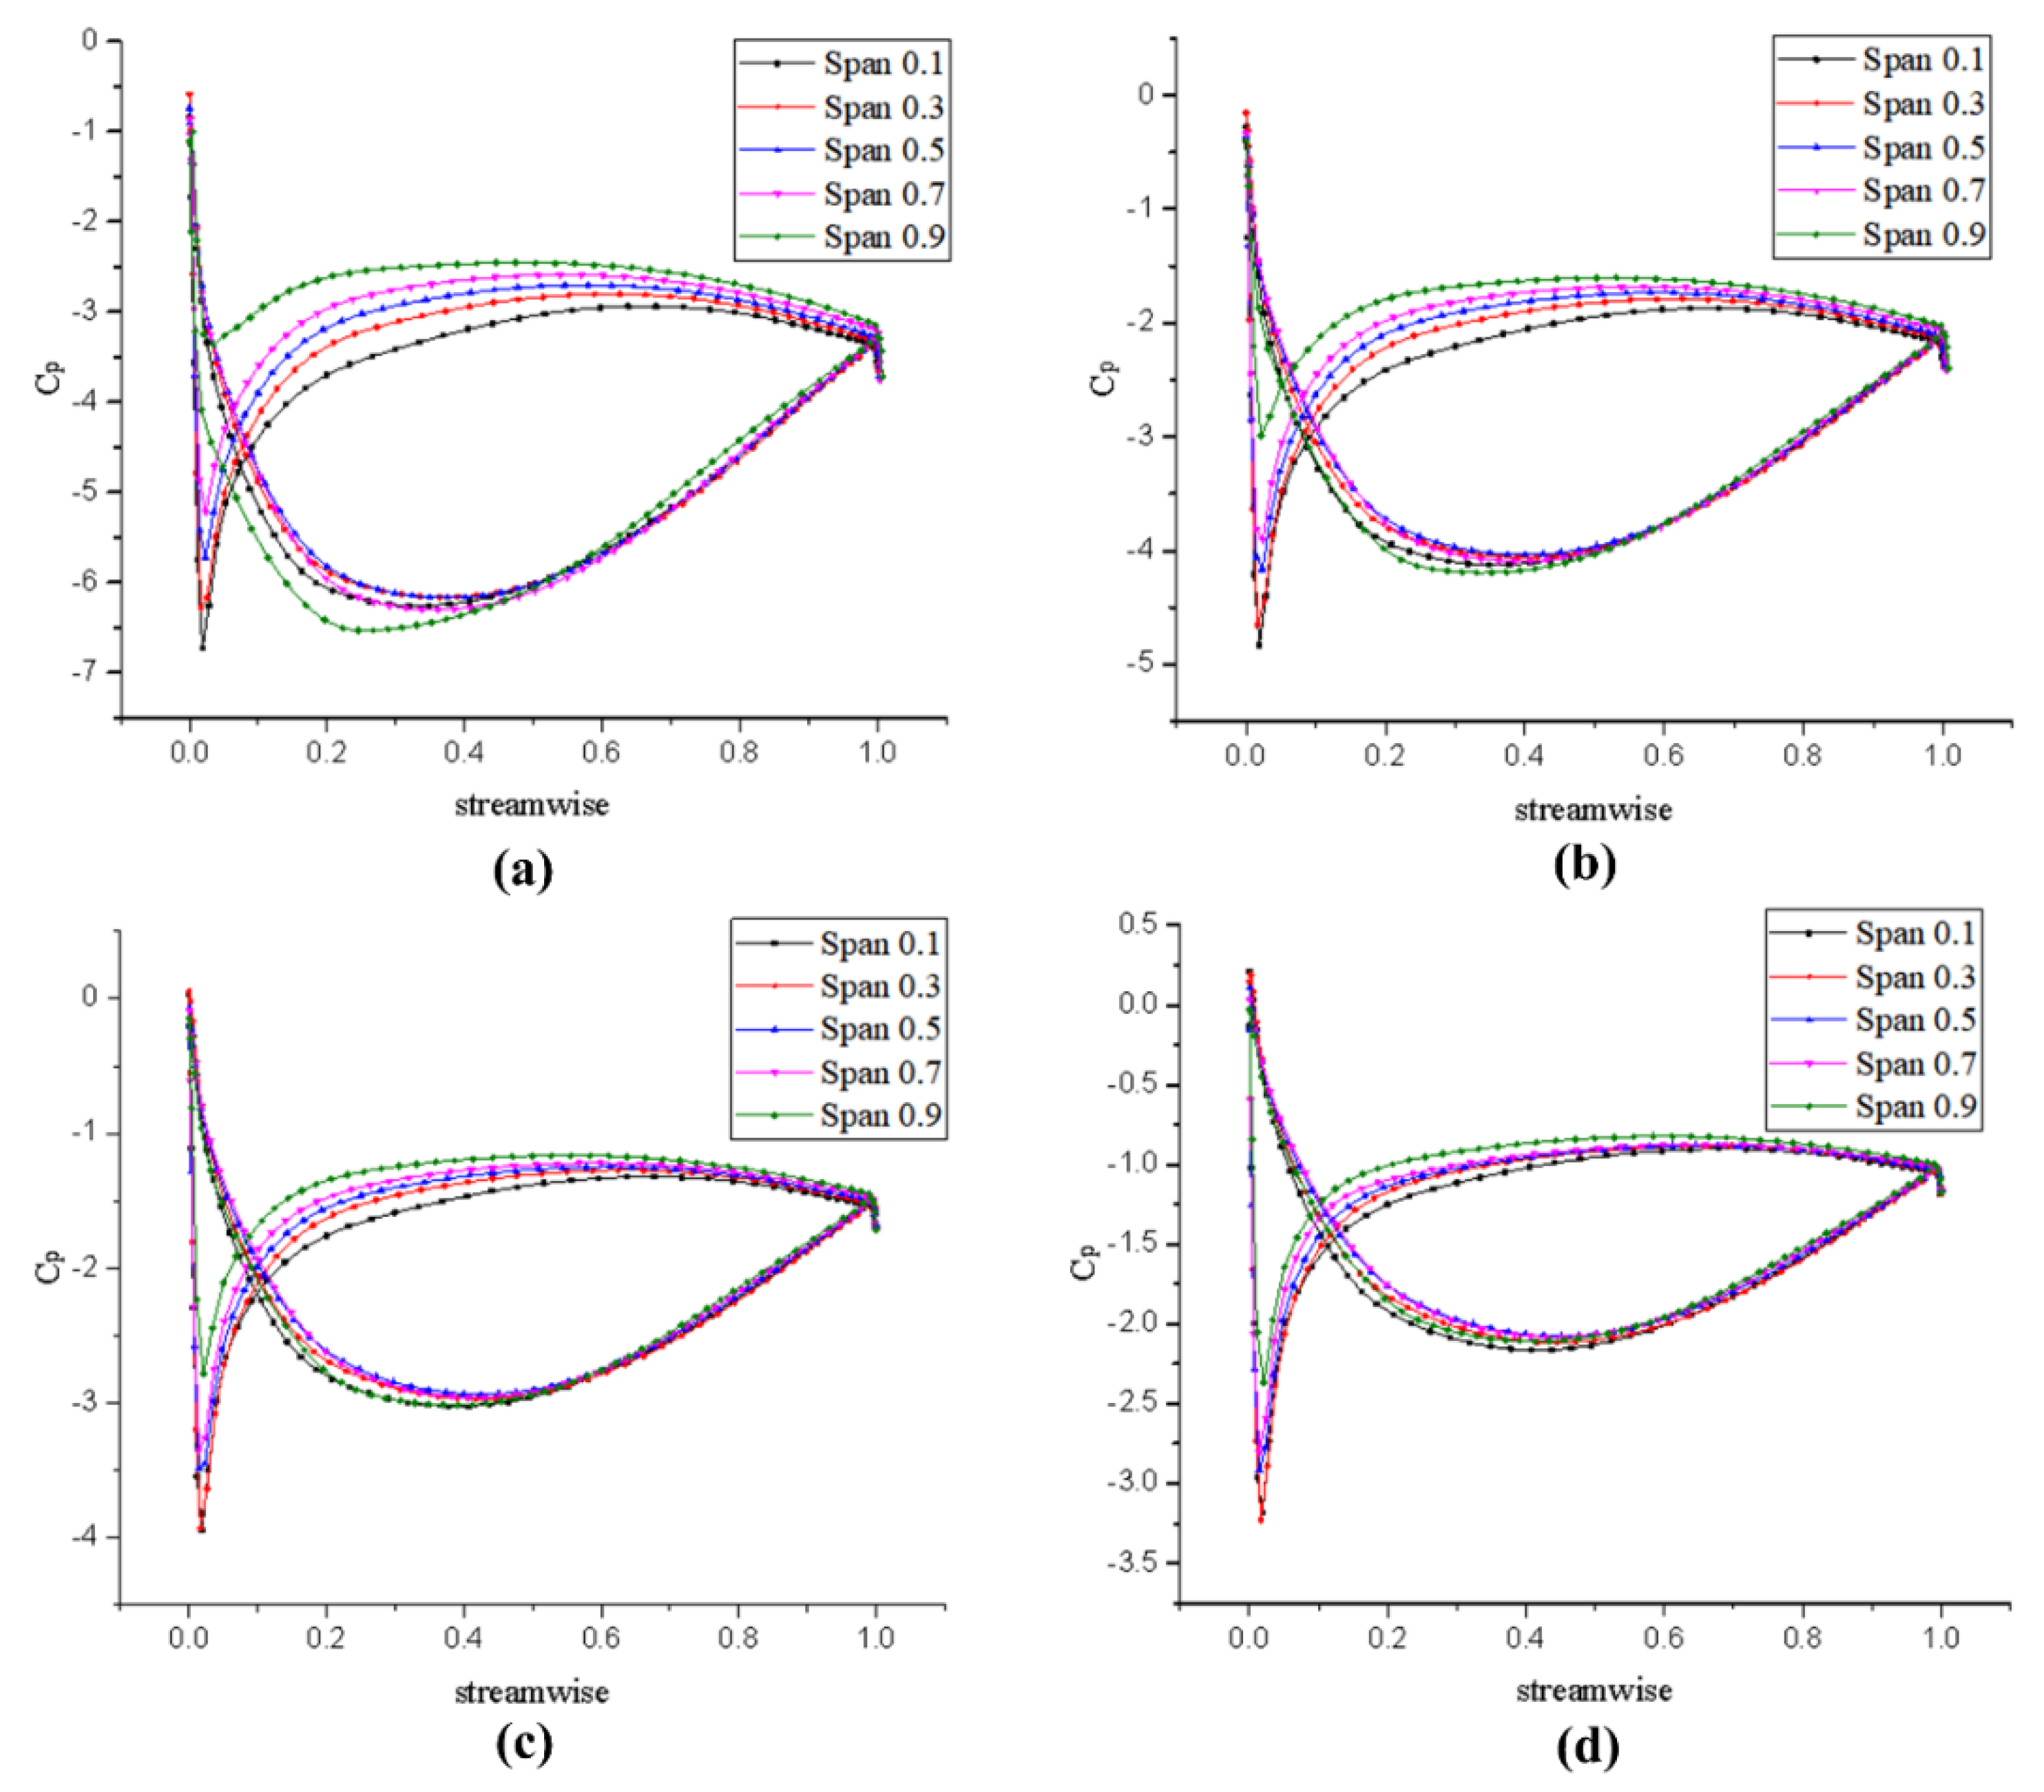
Next, it is necessary to compare and analyze the pressure distribution of the models designed by different design methods. To research the pressure characteristics in the internal flow field of pump-jet propeller, the chordal pressure distribution of the pump-jet propulsion blades was analyzed. Figure 16 and Figure 17 show the chordal pressure coefficient distribution at different radii of the rotor designed by the two methods; meanwhile, Figure 18 and Figure 19 show the pressure coefficient at different radii of the stator. In these figures, the horizontal coordinate streamwise represents the distance between the position of the pressure point after the dimensionless treatment and the blade inlet edge, where 0 represents the position of the blade inlet edge and 1 is the position of the blade outlet edge. The other symbol span is the dimensionless radius of the cylindrical section representing the ratio of different radius to maximum radius [44]. The ordinate Cp in the figure represents the pressure coefficient at a certain position, which is defined as
C p = p p 1 2 ρ U 2
where p represents the local pressure, and P represents the far-field reference pressure. Please note that the blade load represents the pressure difference between the suction surface and the pressure surface of the blade at the same position [44].
Overall, the pattern is basically the same at different advance coefficients, which shows that there is relatively stable internal flow within this range. Comparing the pressure distribution of the rotor and the stator, it is found that the pressure gradient of the rotor is more obvious than that of the stator, indicating that the blade pressure load is more concentrated at the rotor. According to Figure 16 and Figure 17, the chordal pressure coefficient distribution of the rotor shows that the rotor has obvious pressure gradient changes at the inlet and outlet edges, and the difference between the pressure surface and the suction surface at the inlet edge is relatively large. At nearly 50% of the chord, there is also a significant difference at the outlet edge; it can be found from the following that this area is prone to cavitation. The rest of the pressure distribution is relatively gentle, specifically, the pressure gradient is small and the blade load is small.
For the stator, it can be seen from Figure 18 and Figure 19 that the pressure distribution on the pump-jet stator blade surface is similar to that of the rotor. There are evident pressure gradient changes at the inlet and outlet sides and the difference between the pressure surface and the suction surface is relatively large, indicating that there is a heavy load in this area. The pressure distribution in the remaining middle part is more uniform. It can also be found that the pressure load of the stator blades is mainly distributed in the large span, which is much smaller than that of the rotor blades. It implies that the stator converts part of the tangential velocity into part of the axial velocity, and the flow merges with the mainstream near the outlet edge.
By comparing the two design methods of the pump-jet propulsion, it can be found that the rotor blades designed by the lifting method have a smaller pressure difference between the inlet edge pressure surface and the suction surface at the inlet edge, indicating that the blade load designed by the lifting method is smaller than that of the lifting-line method. Moreover, the difference between the pressure coefficient curves along the spanwise direction is relatively small, i.e., the pressure distribution from the hub to the blade tip is more uniform. With the further increase of the axial distance, the pressure curve is more gradual, indicating that the acceleration effect of the blade designed by the lifting method on the mainstream is not as good as that designed by the lifting-line method. The thrust and torque generated by propulsion designed by the lifting method are smaller than the lifting-line method, but the pressure distribution is more uniform. Furthermore, the work produced by the blade is more uniform and the fluid, after acceleration, merges the mainstream well. However, as the advance coefficient increases, the performance of the blade designed by the lifting method is not as stable as the lifting-line method, indicating that the former rotor blades are more suitable for medium and low sailing speeds. From the perspective of the stator, the stator blades load at the inlet edge designed by the lifting method is smaller, and the low-pressure area is larger than that of the lifting-line method.
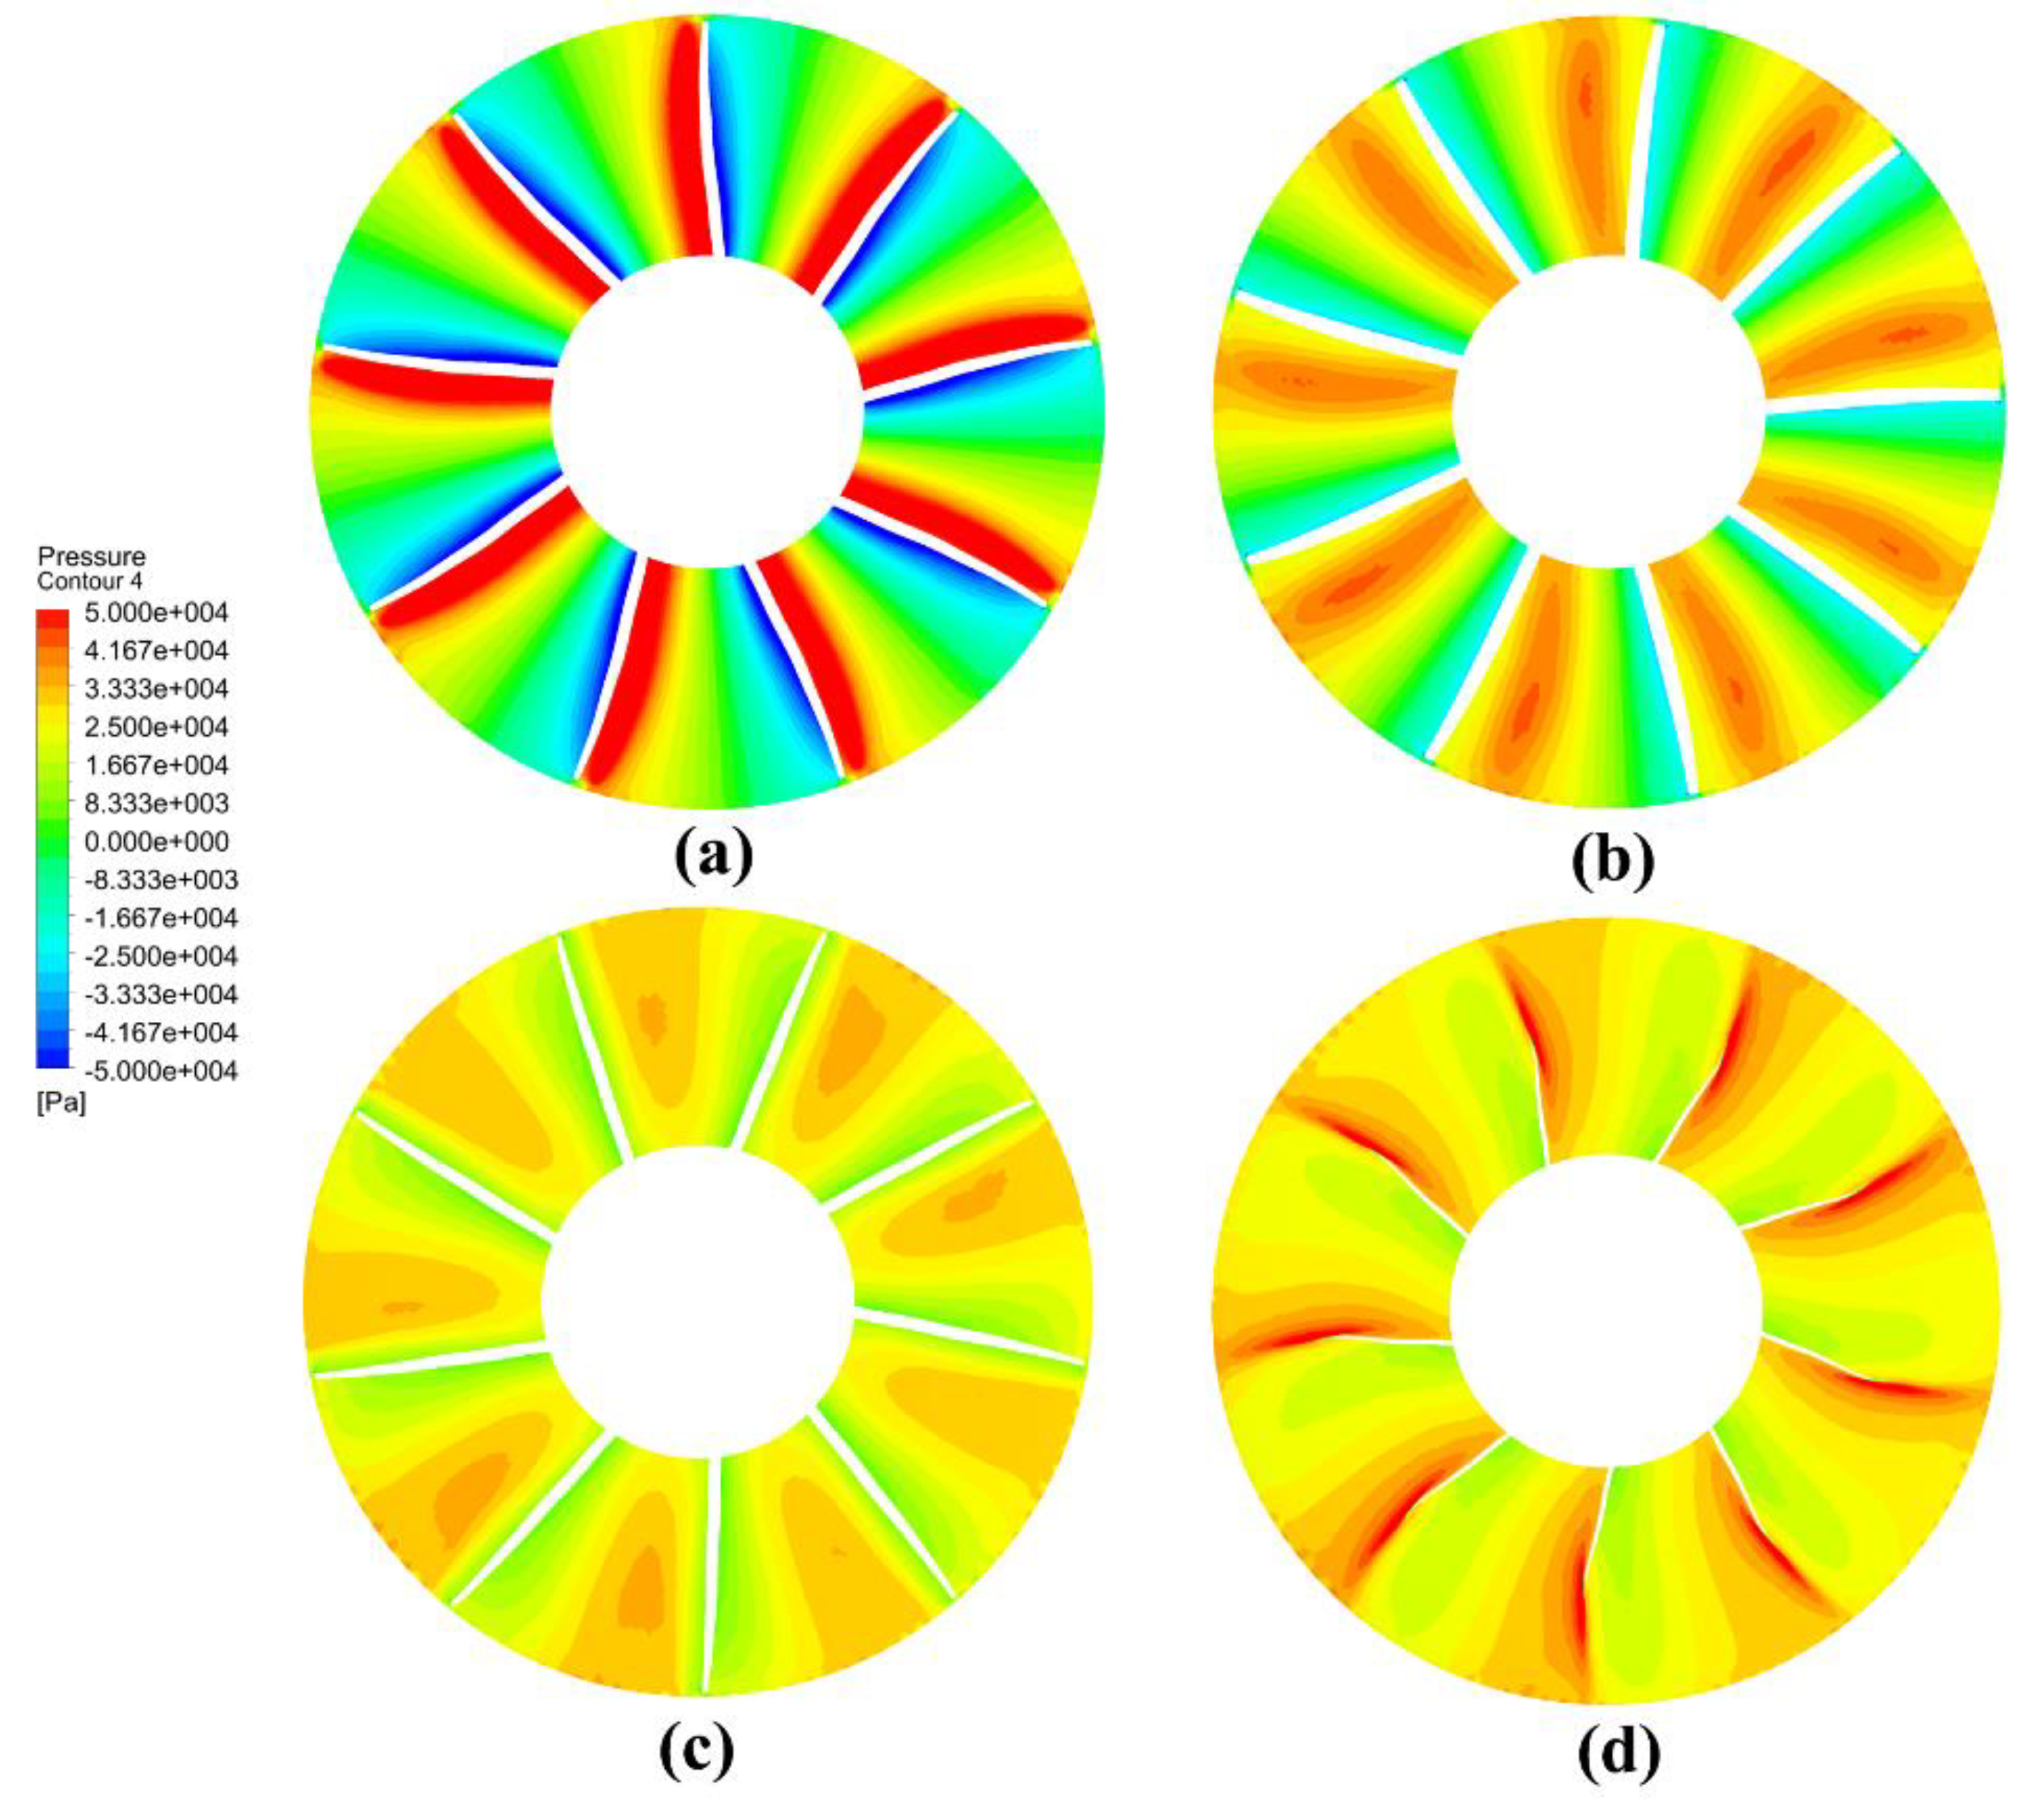
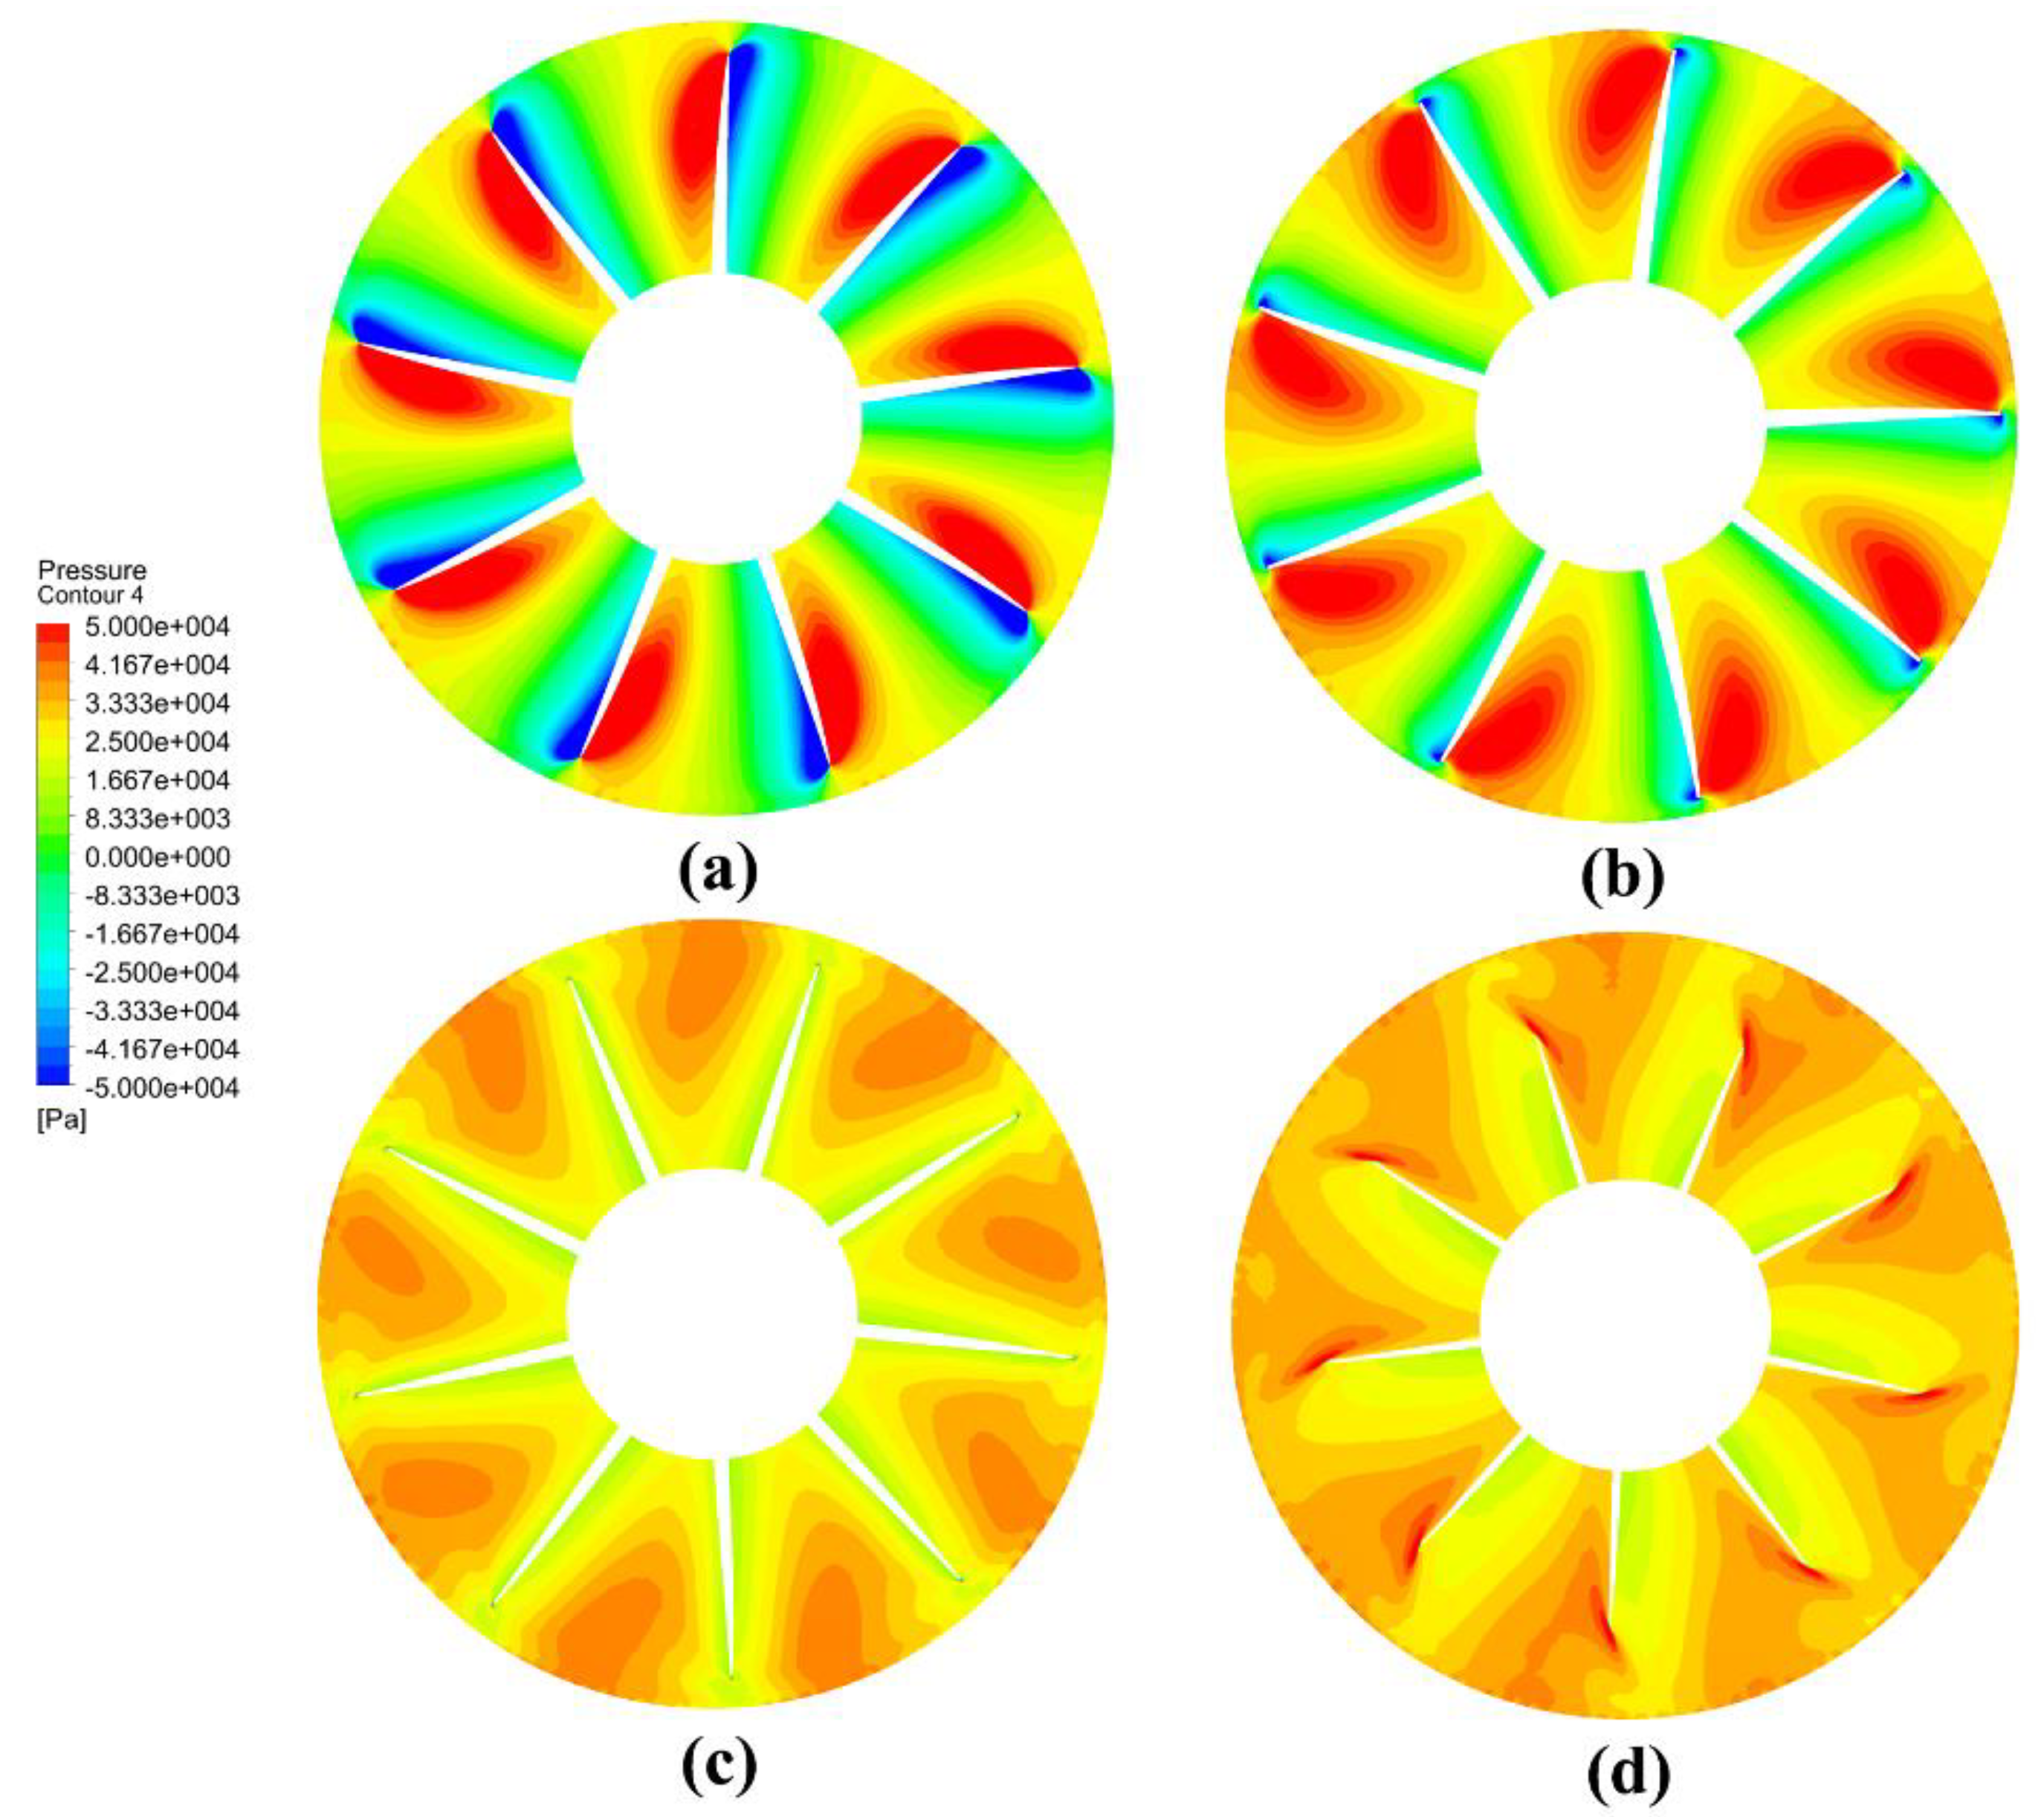
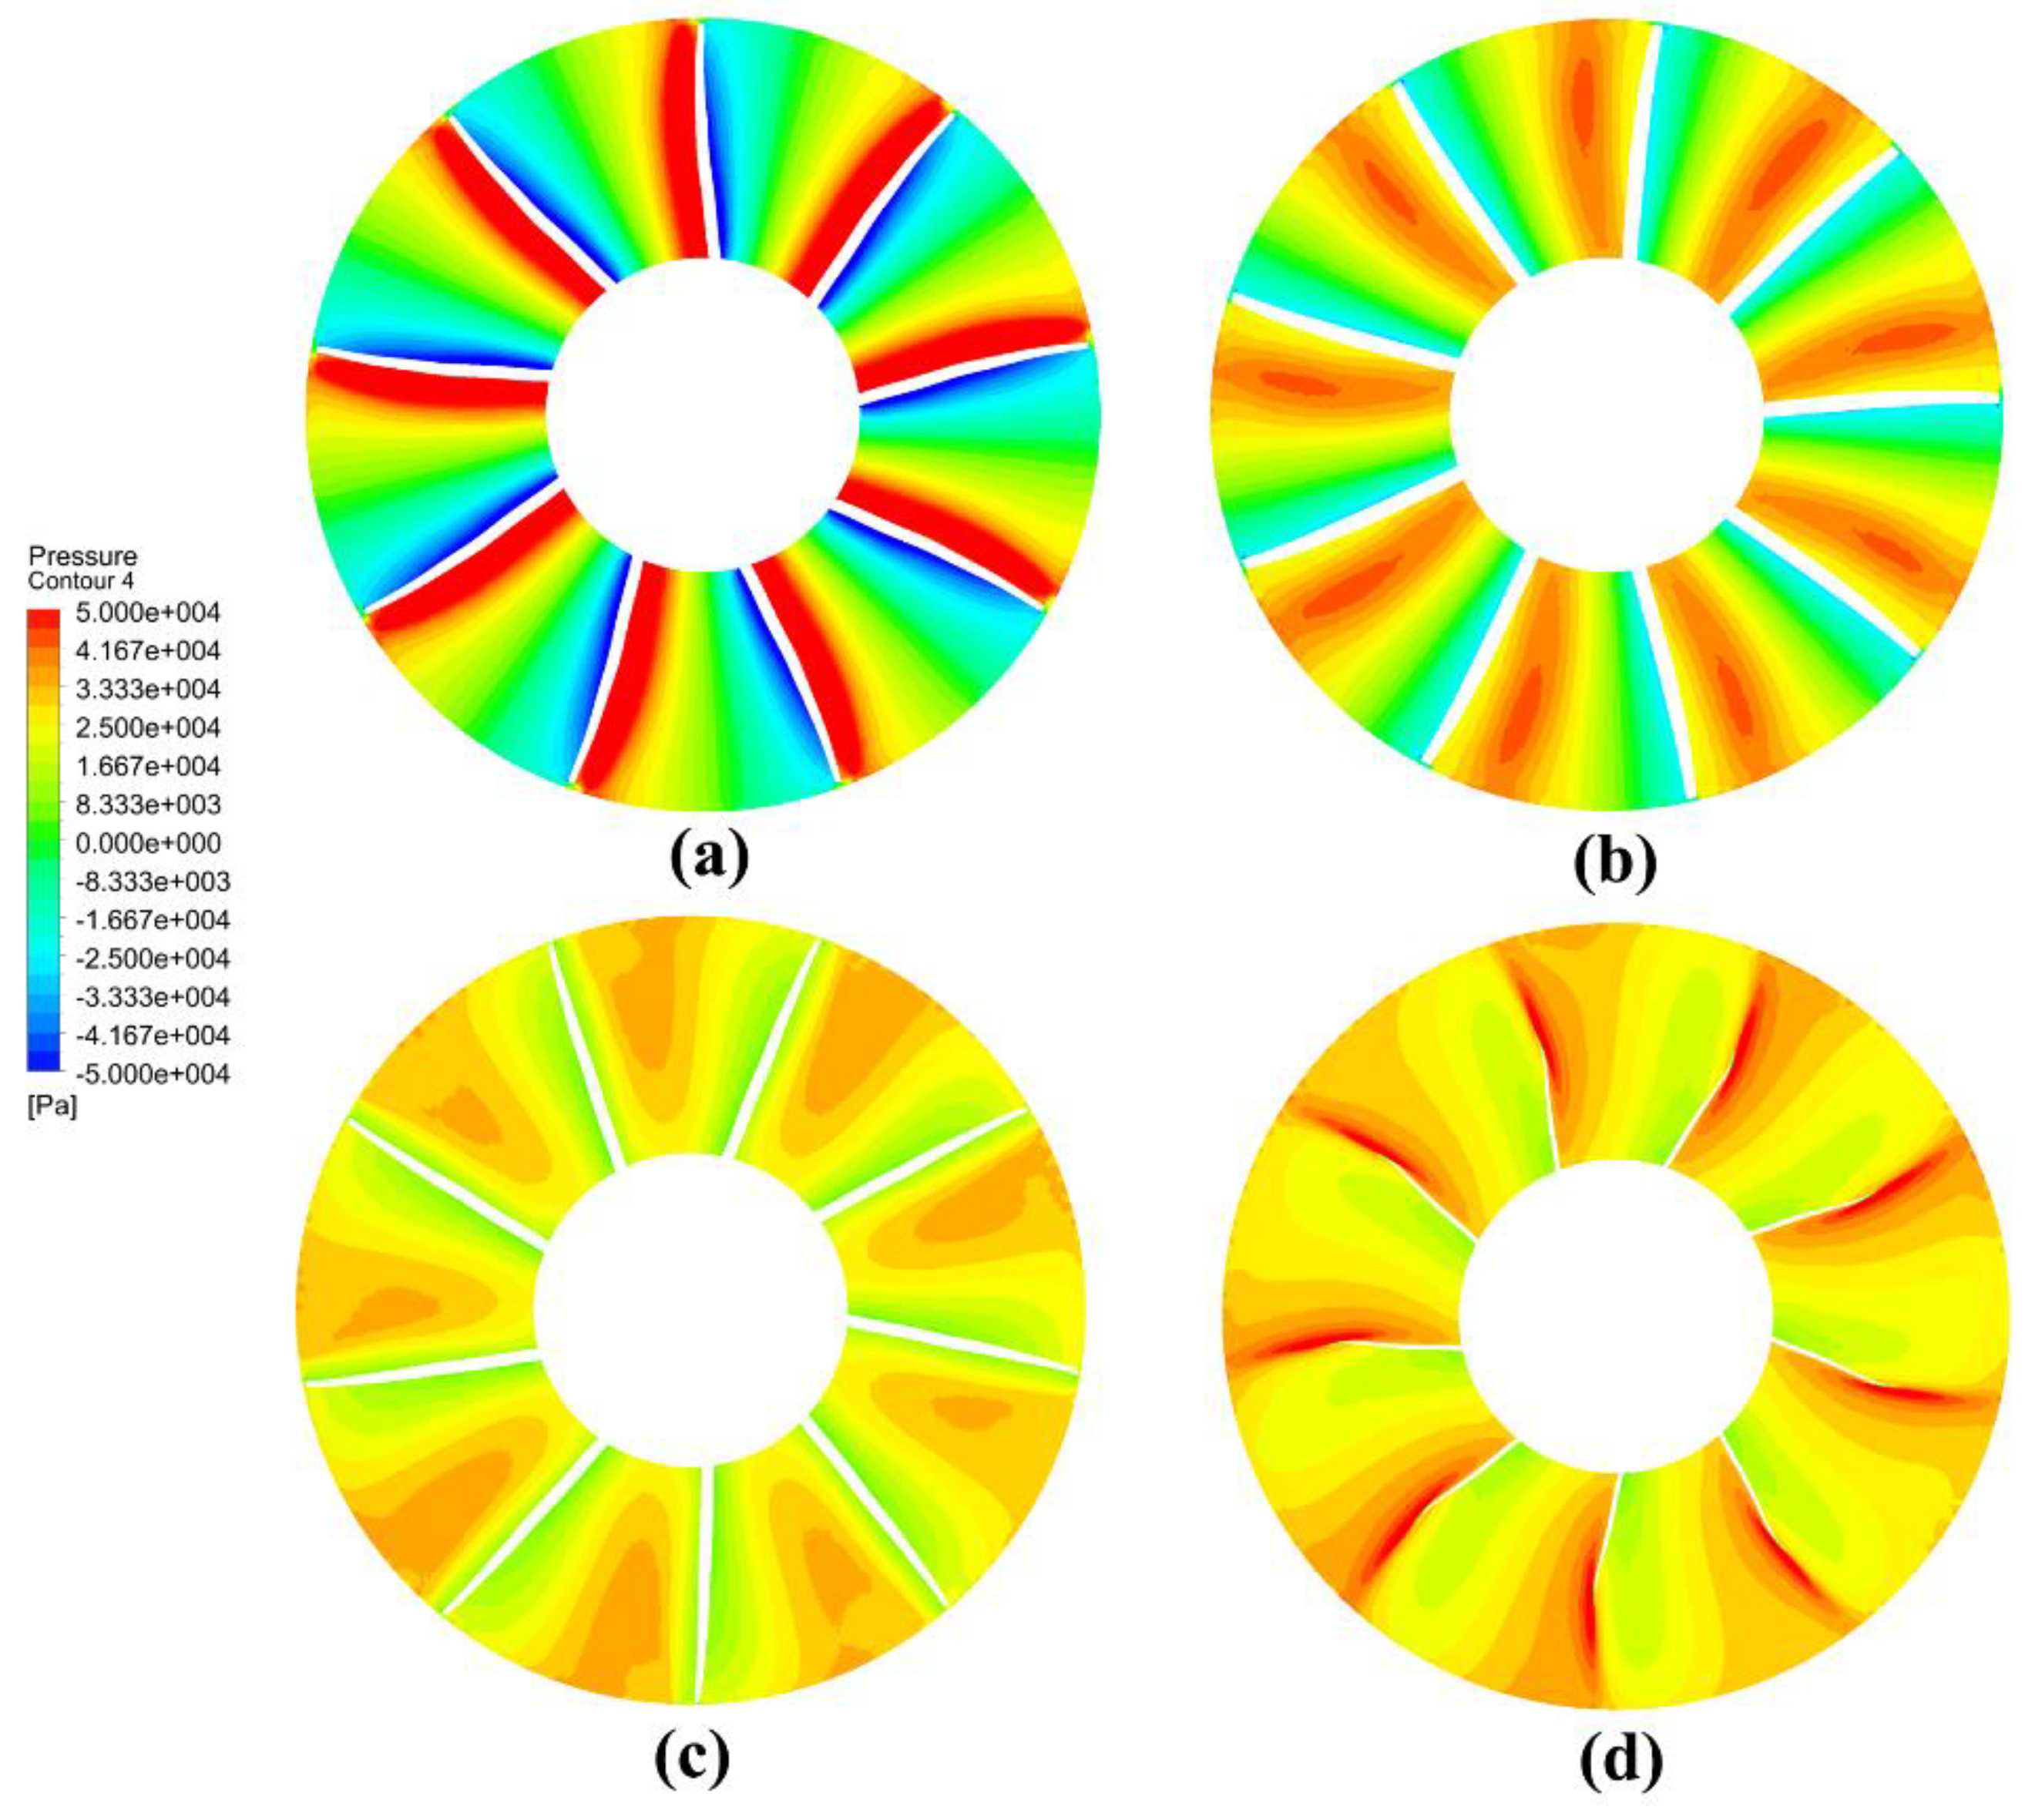
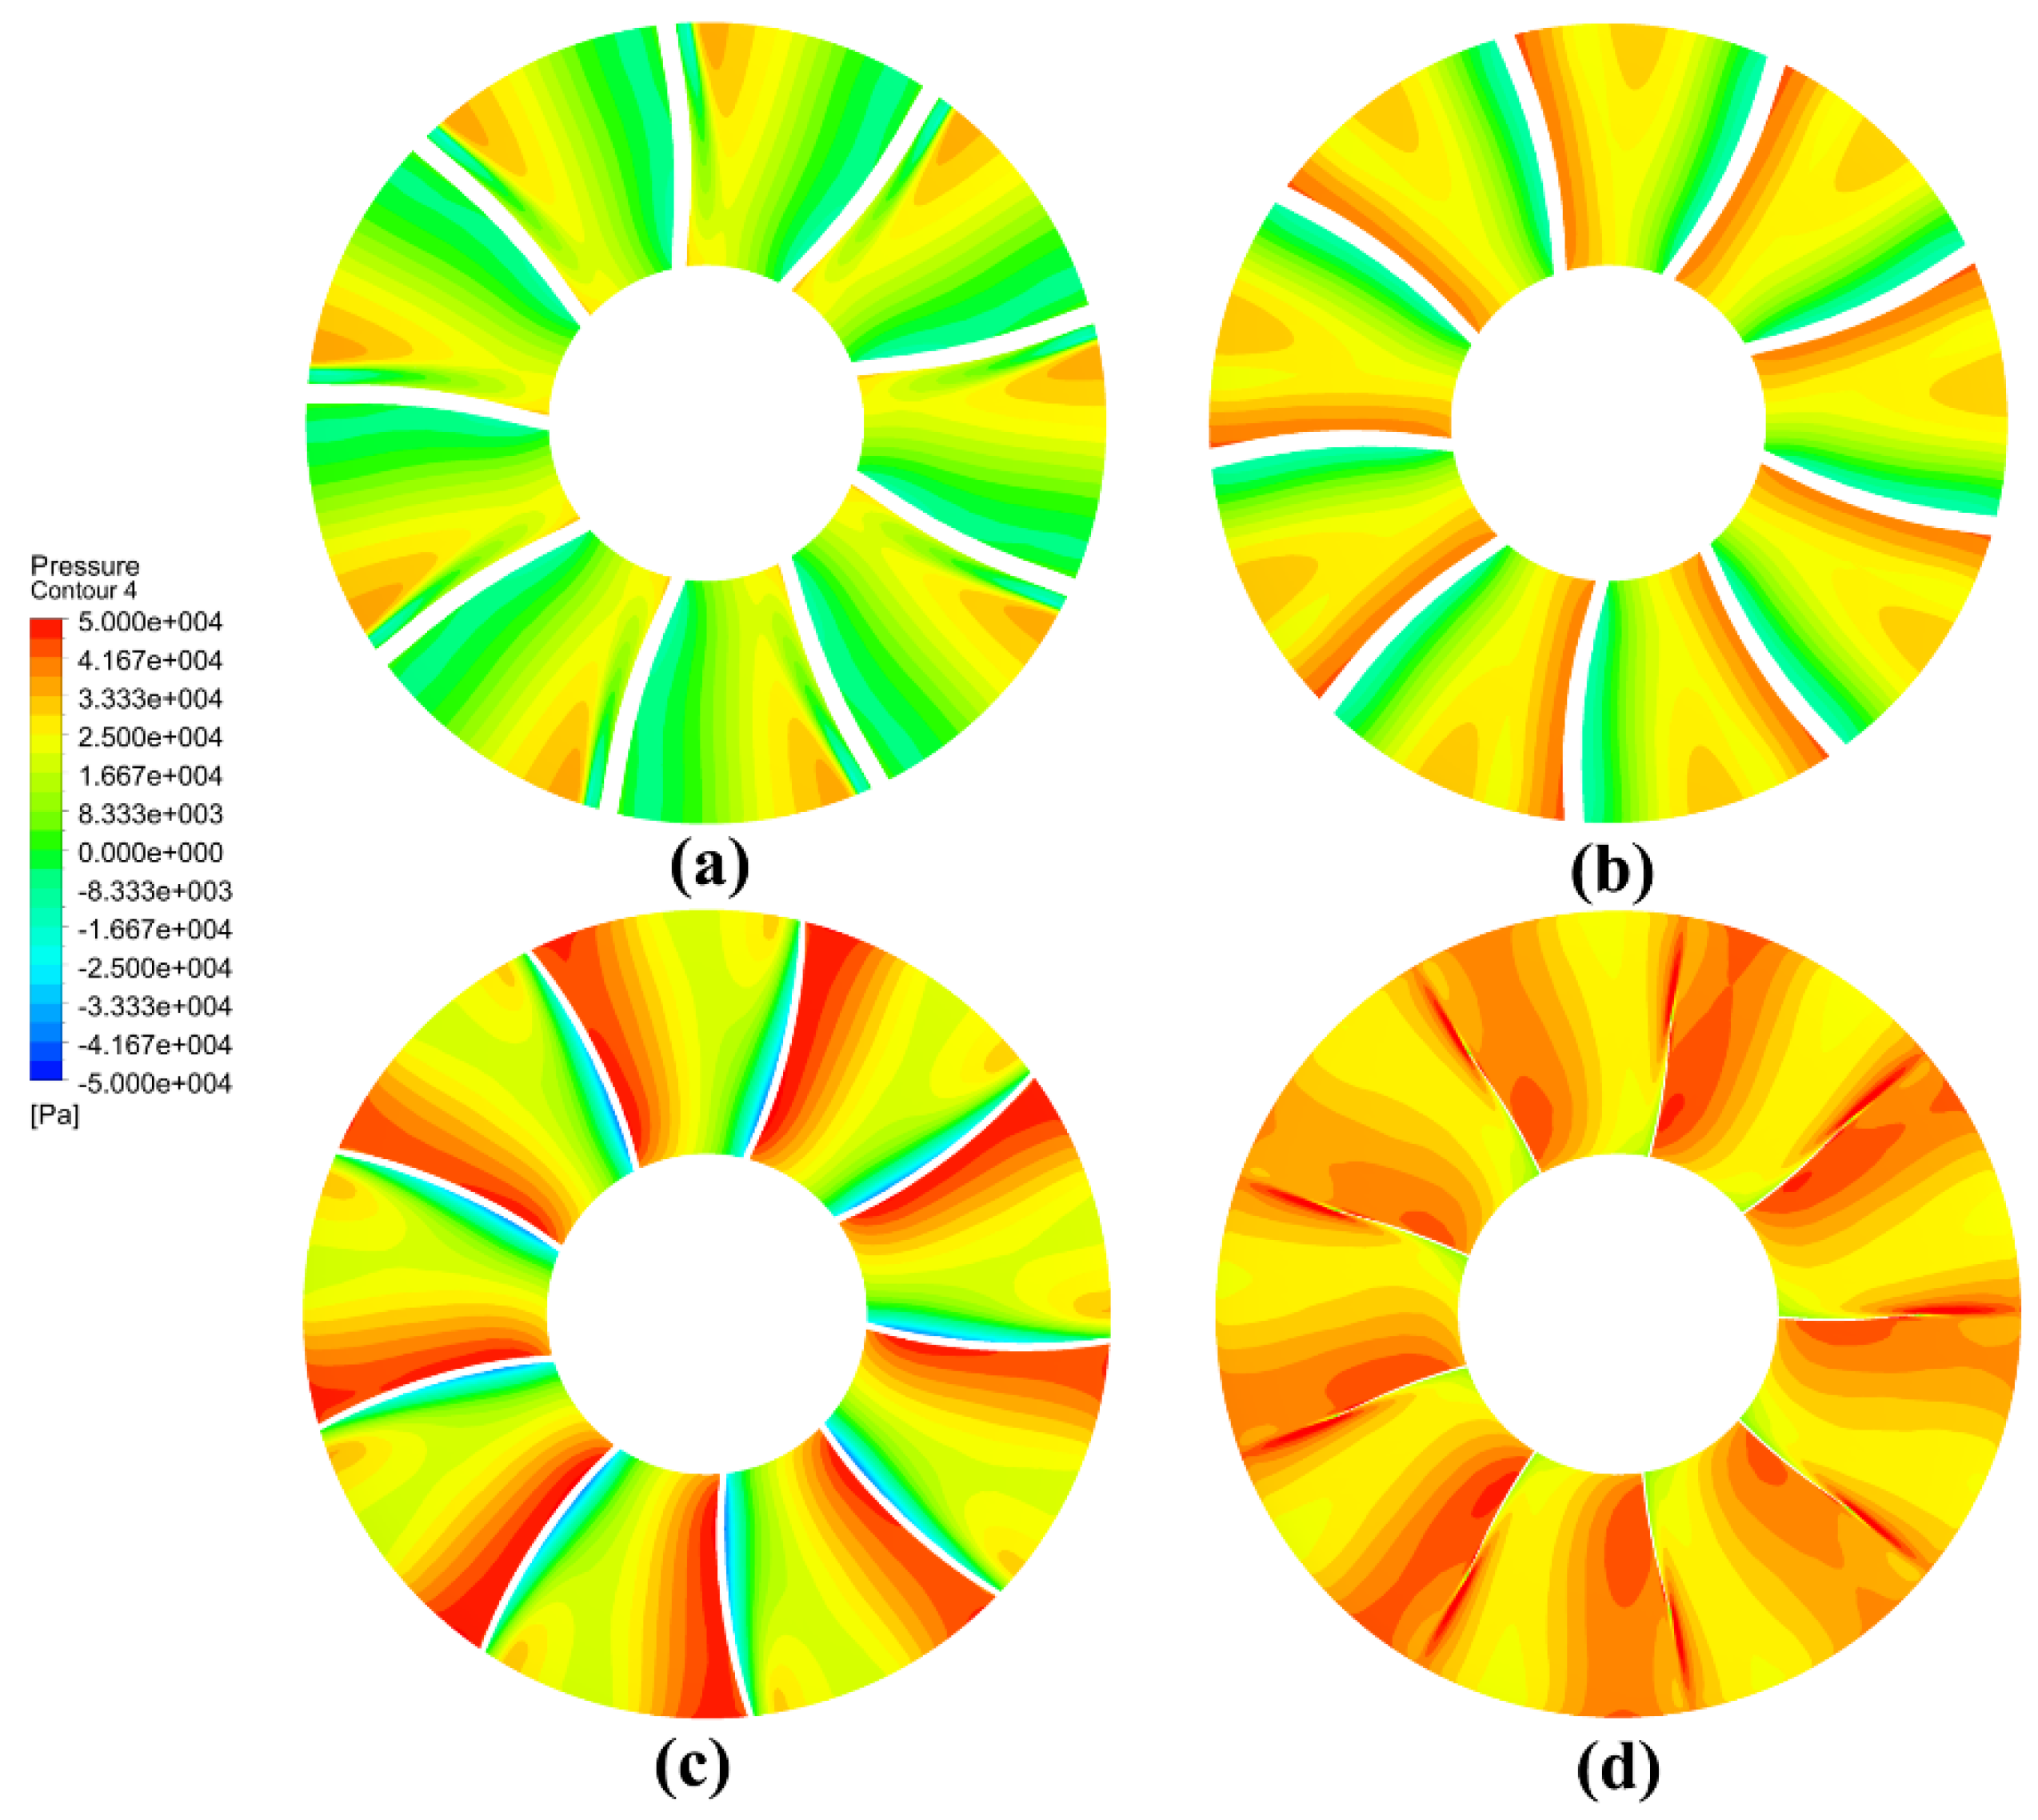
The cross-sectional pressure contour at different axial distances in the rotor are shown in Figure 20 and Figure 21, and the cross-sections of the selected areas are all vertical on the axis of rotation. At the rotor inlet, the fluid is accelerated by the pressure surface, so the pressure is higher than that of the suction side. As the fluid reaches the central position of the rotor, the high-pressure area expands to the middle of the channel, and the pressure near the suction surface goes up with the reduced low-pressure area. When the fluid approaches the exit of the rotor, the high-pressure area is reduced, while the magnitude is larger, with the highest pressure near the suction surface.
Comparing Figure 20 and Figure 21, it is found that at the rotor inlet, the low-pressure area of the pump-jet designed by the lifting method is slightly smaller than that of the lifting-line method, and the high-pressure area is larger. As the fluid flows to the rotor middle section, the overall pressure level has risen, but the high-pressure area of the blade designed by the lifting-line method is larger than that designed by the lifting method, while the low-pressure area is also slightly larger with lower pressure. At the rotor outlet, the entire blade channel designed by the lifting-line method is basically the high-pressure area, but the periodicity is relatively weak. The above phenomena show that the acceleration effect of the rotor blade designed by the lifting-line method is more evident with the greater generated thrust. By contrast, the entrance of the blade designed by the lifting method is less prone to cavitation, and the fluid accelerated in the channel is better converged, leading to a more stable and uniform flow.
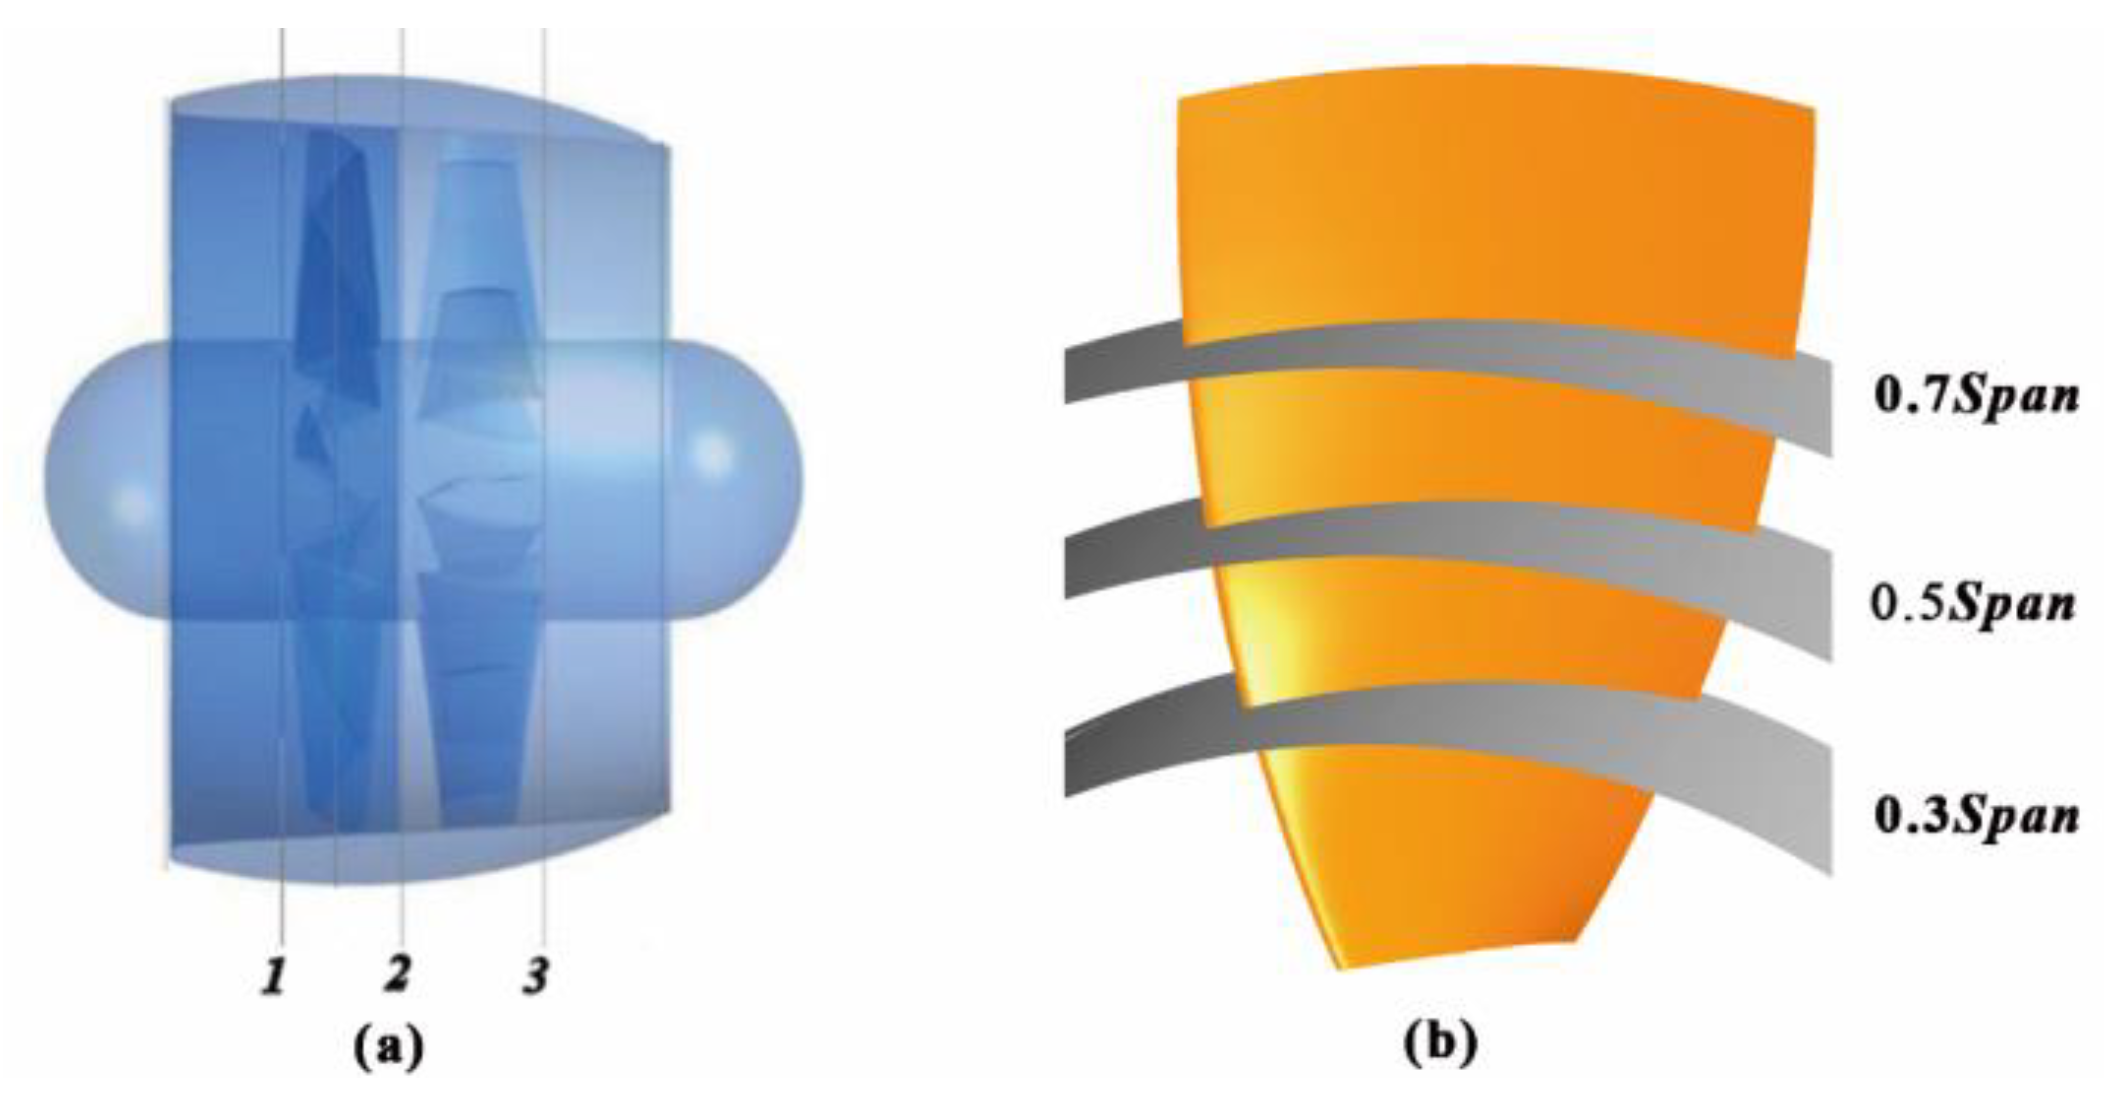
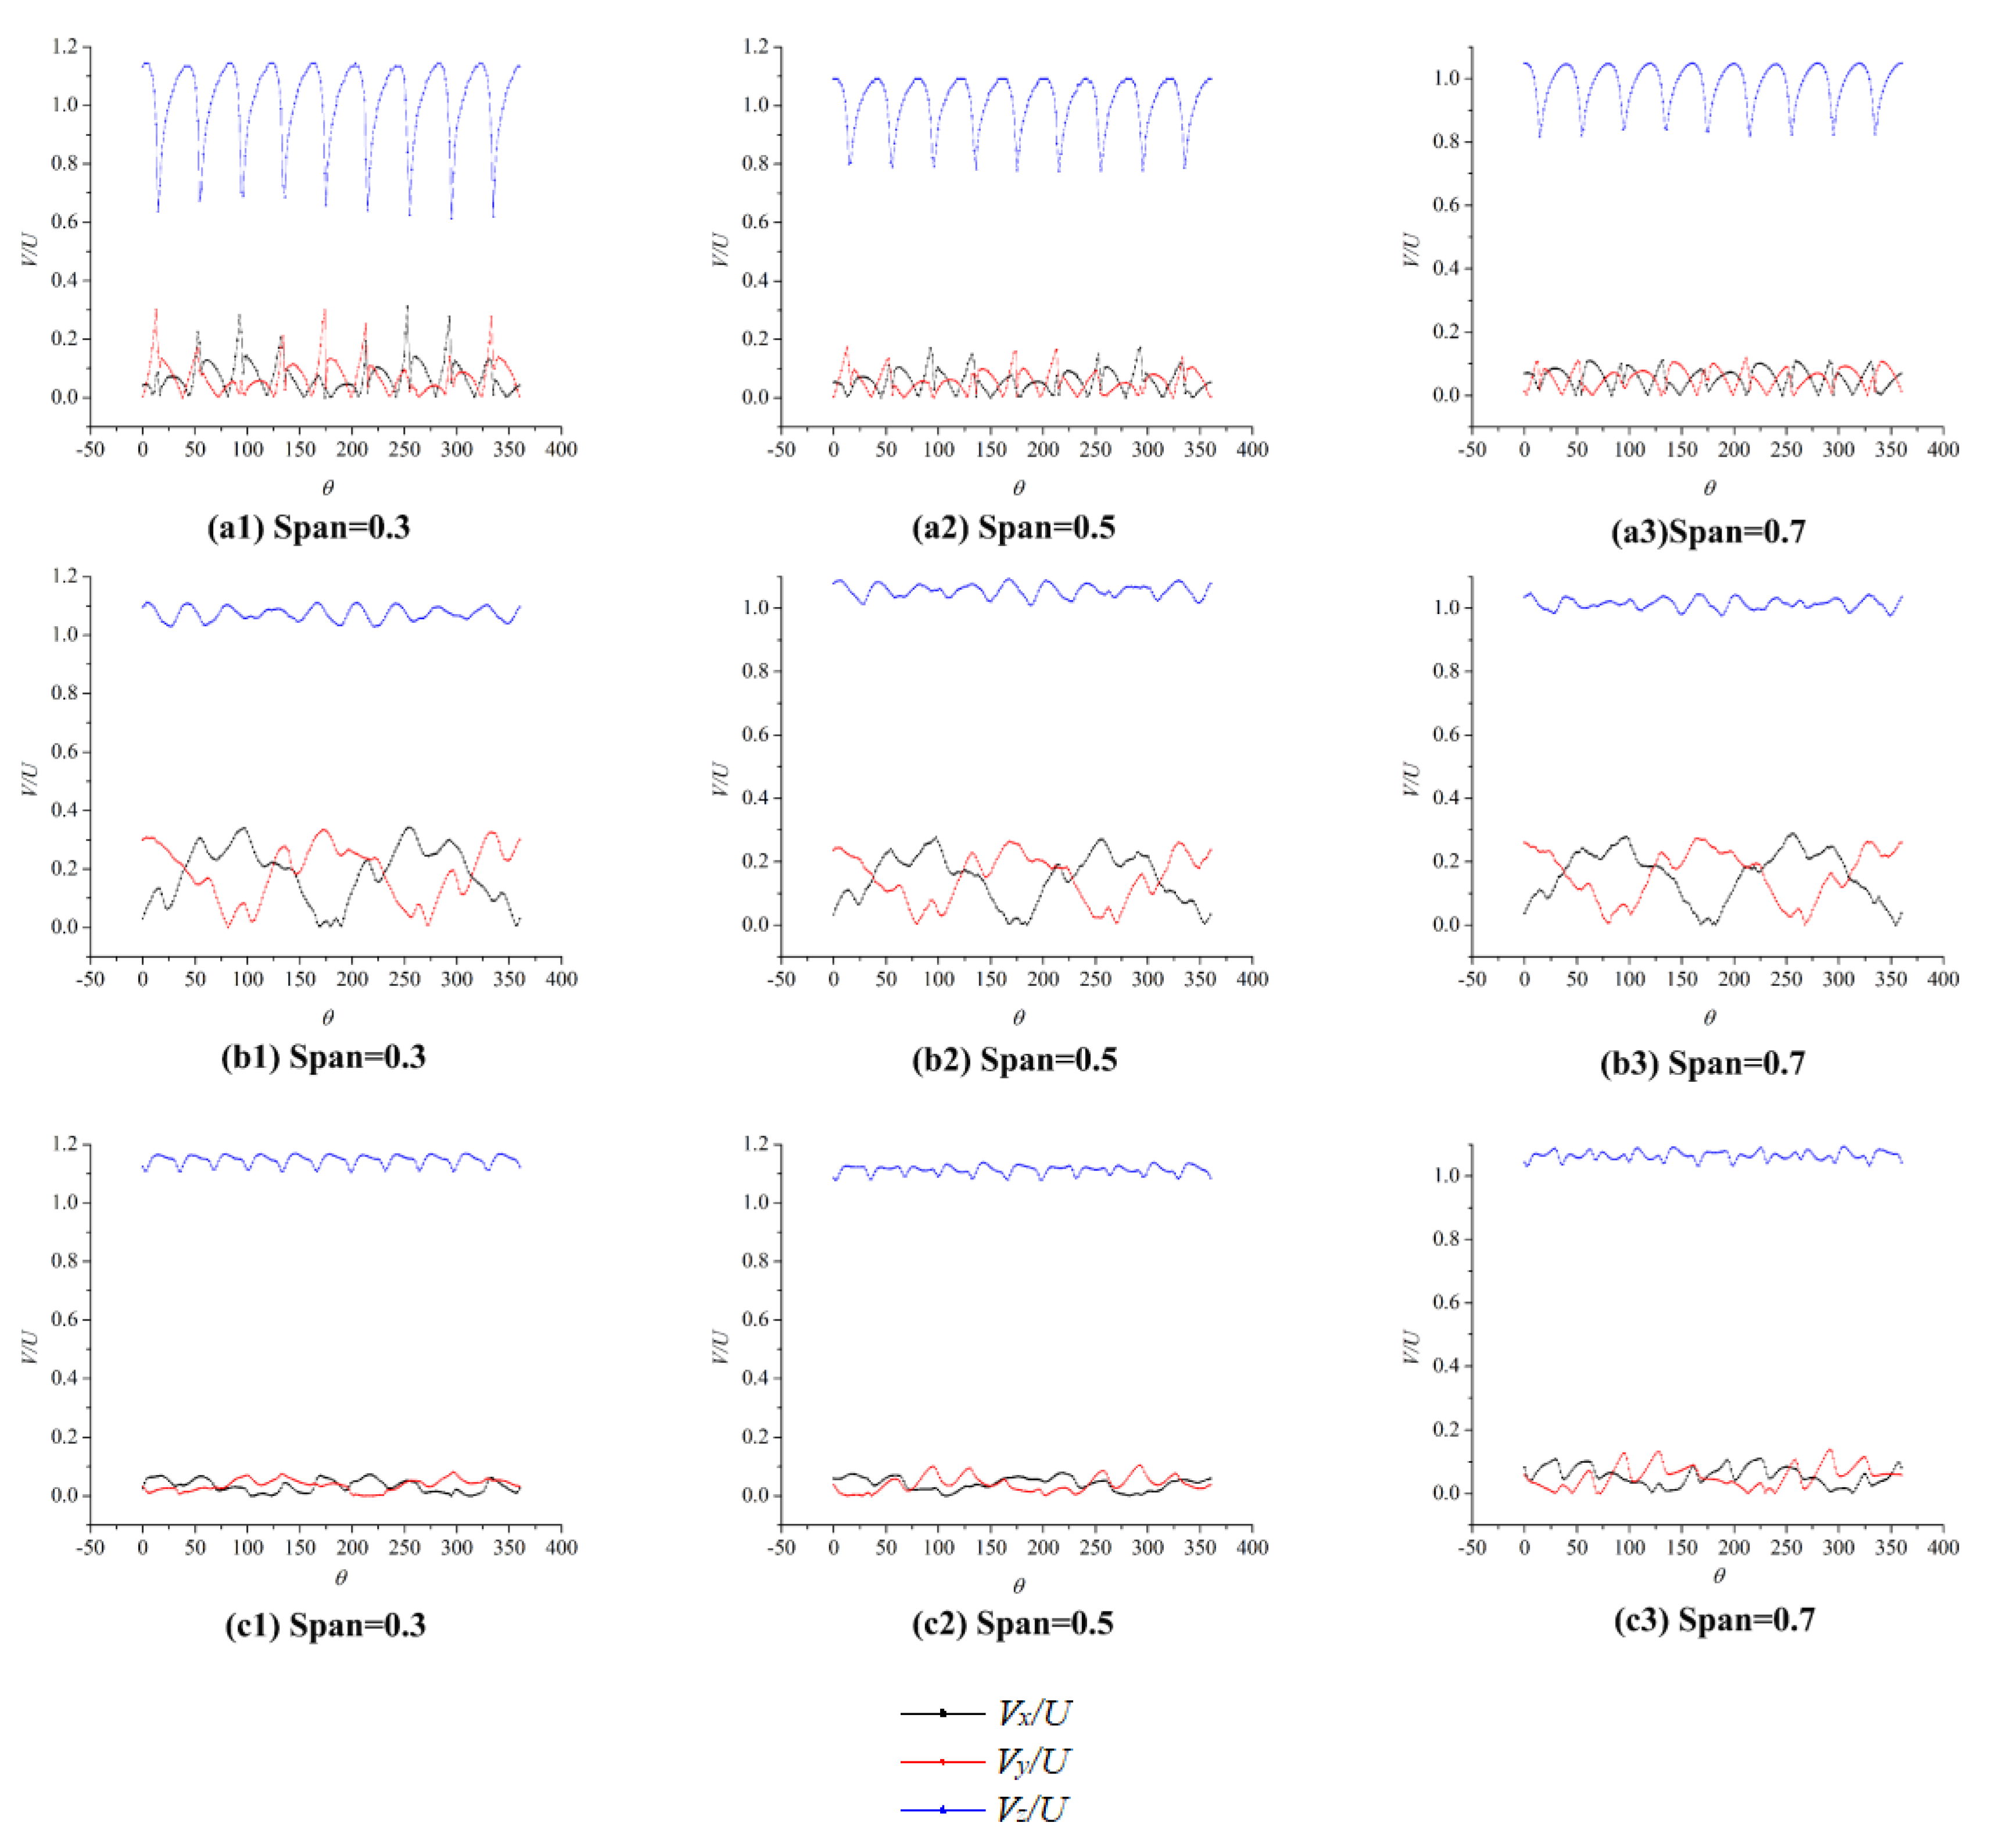
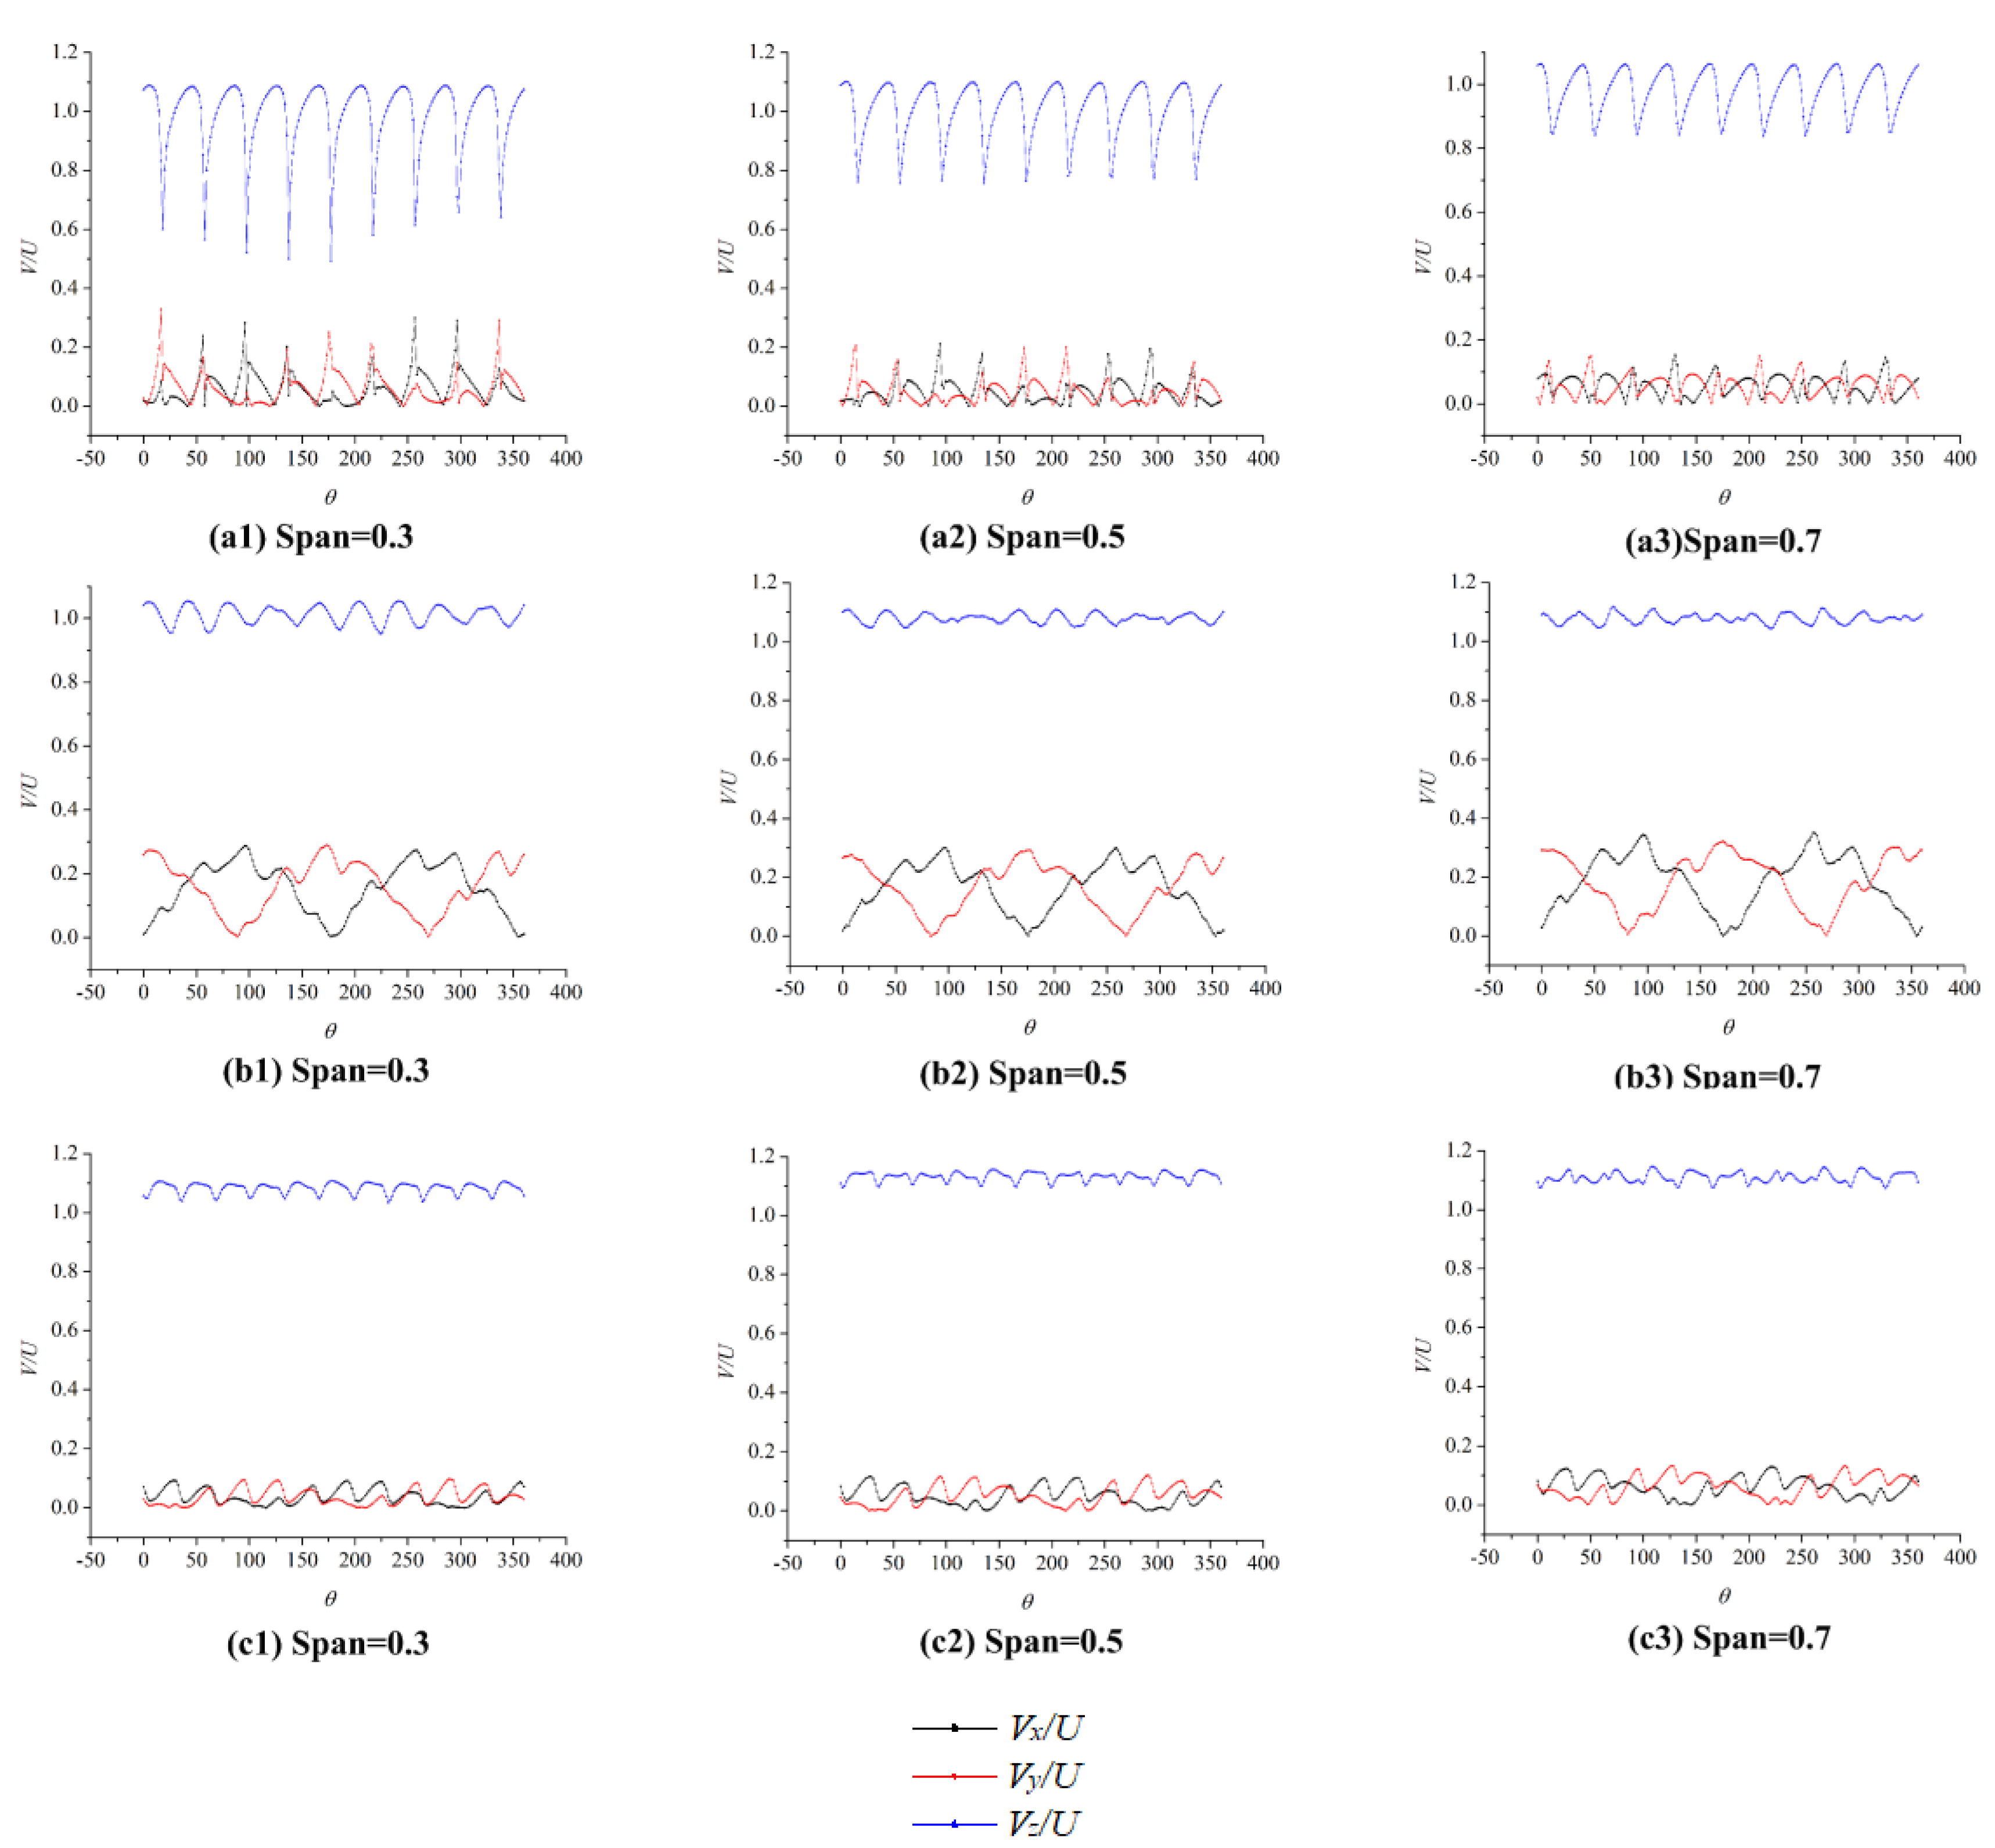
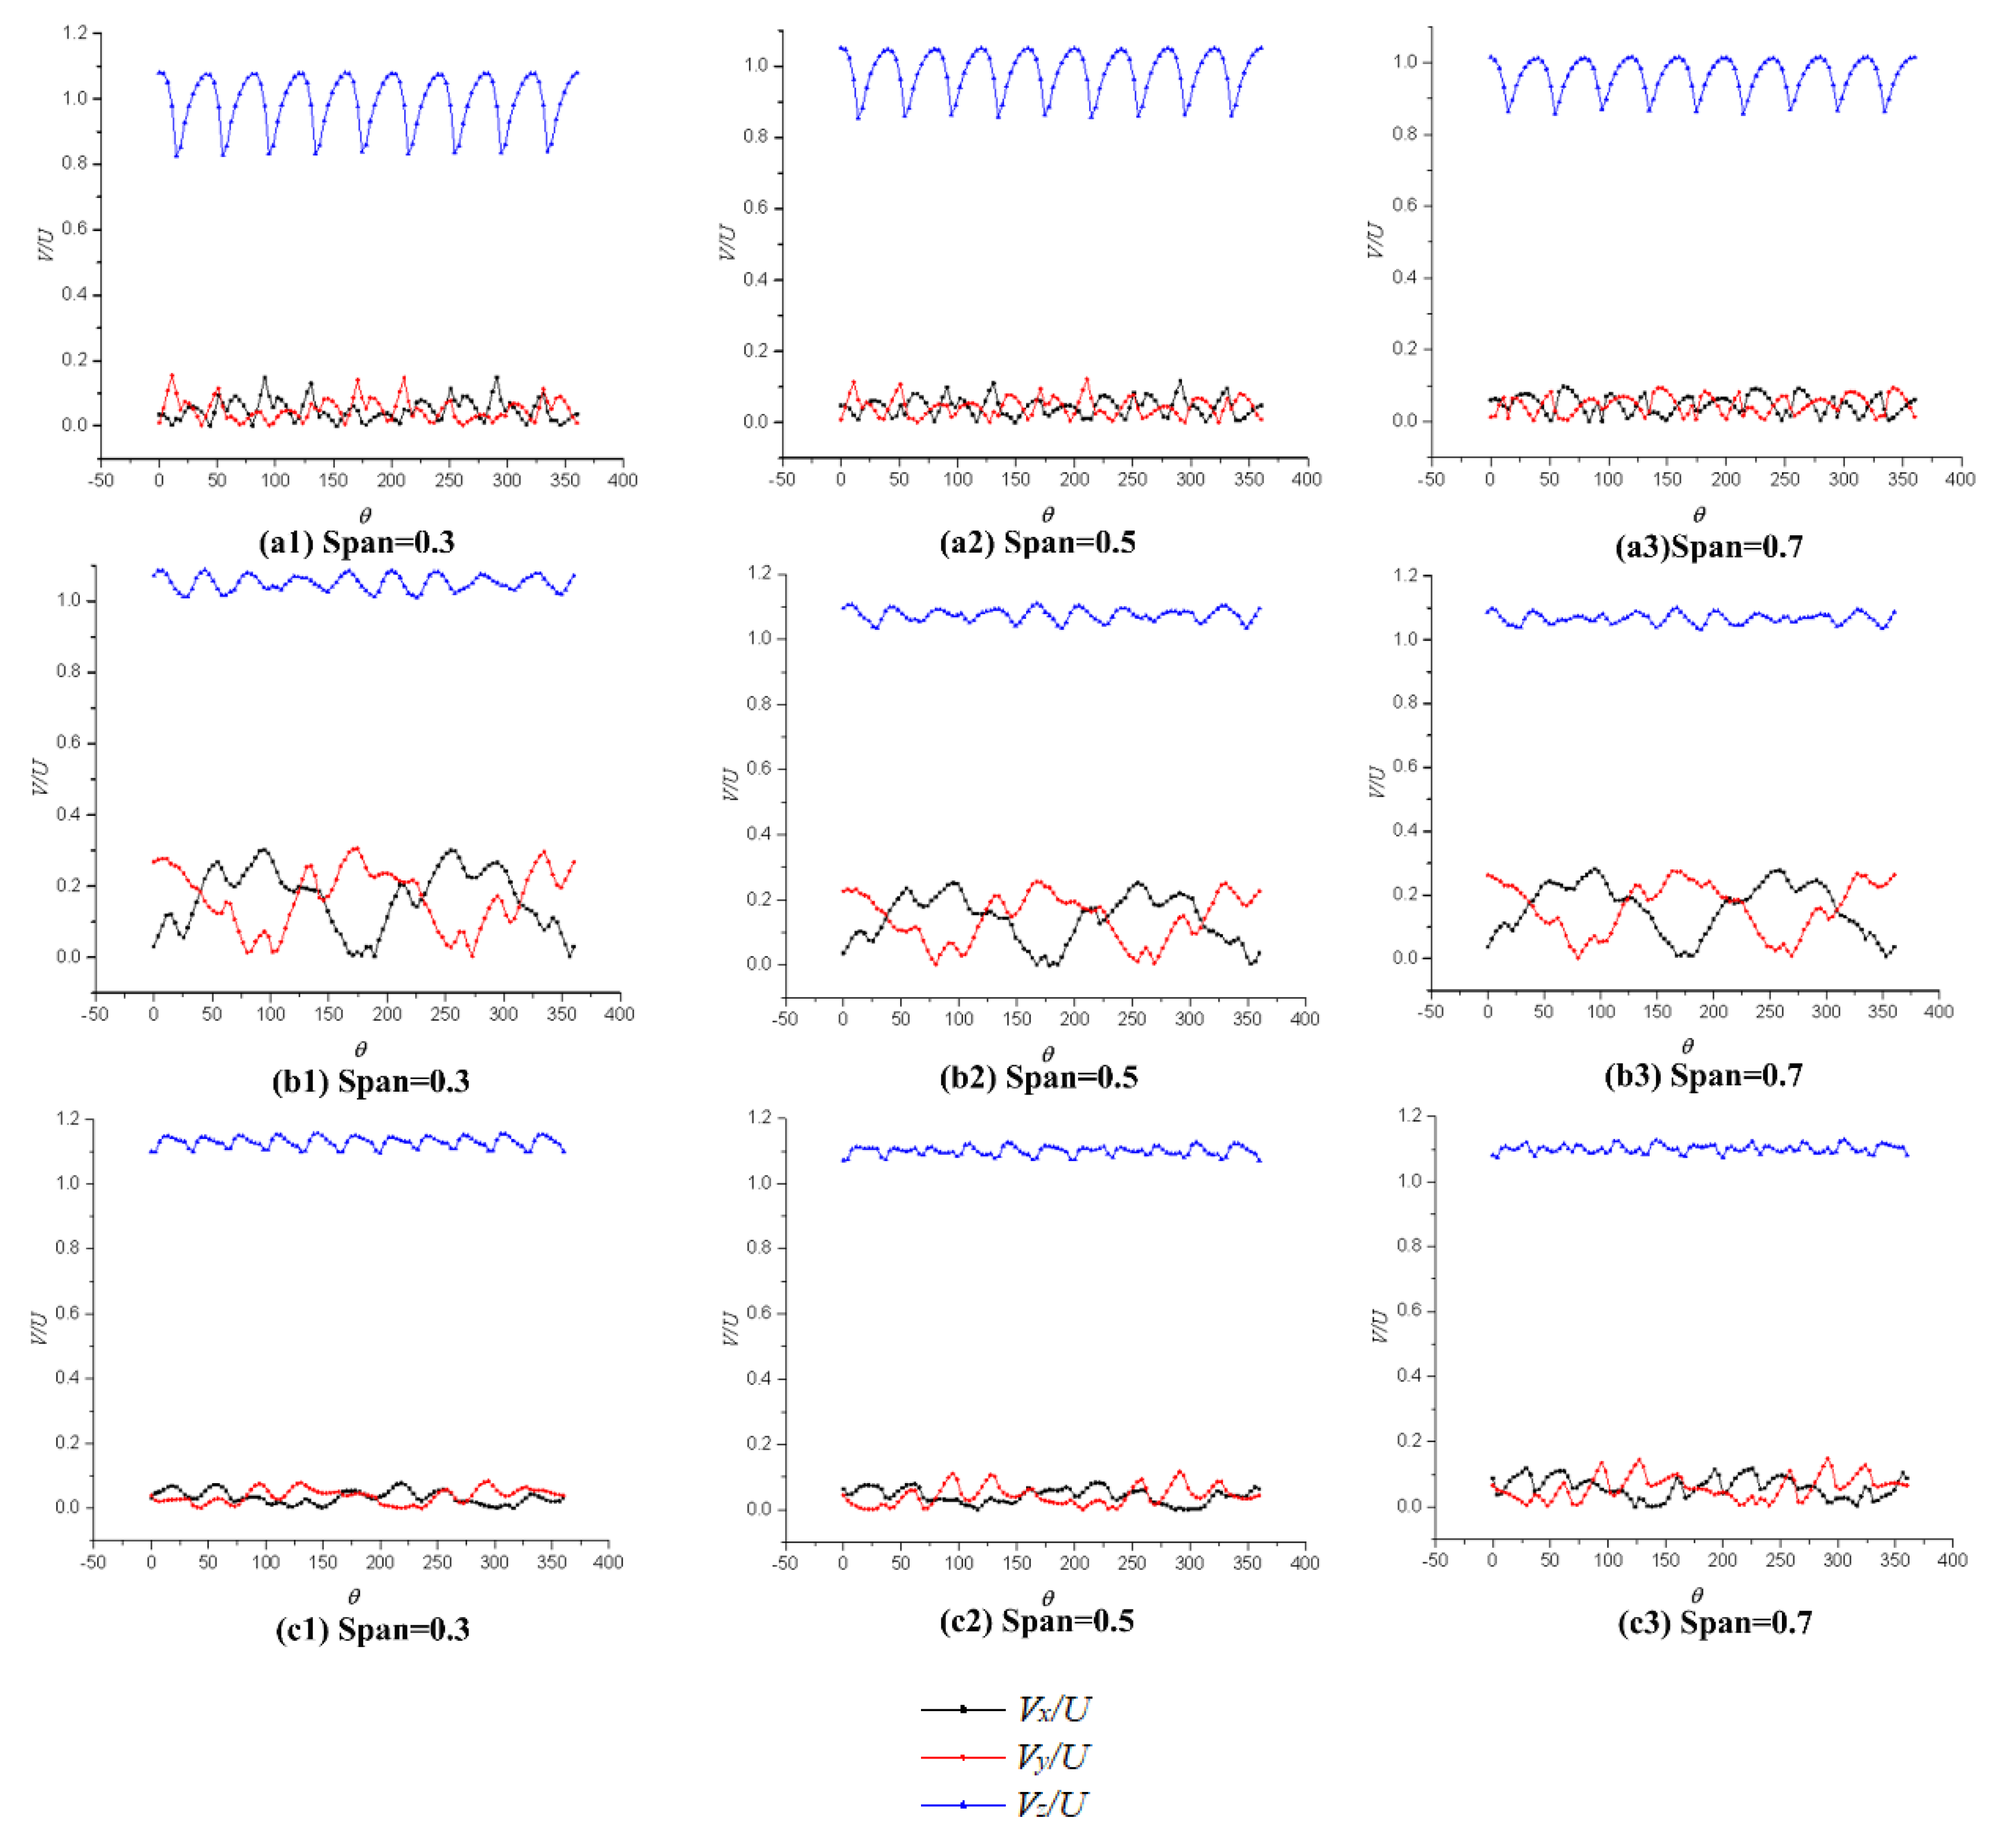
To research the velocity variation pattern, three spanwise and streamwise positions were selected to analyze the flow property indicated in Figure 22. Figure 23 and Figure 24 show the circumferential distribution of the velocity components (tangential, radial, and axial) at different axial positions in the pump-jet thruster channel at a free-stream speed U of 10m/s. In Figure 23 and Figure 24, Vx/U, Vy/U, and Vz/U are the dimensionless parameters of tangential velocity, radial velocity, and axial velocity, respectively. As shown in Figure 23 and Figure 24, each velocity component at the rotor inlet shows a periodic oscillation distribution with peaks and valleys whose number is the same as the number of blades. The amplitude of the axial velocity oscillation and the velocity value is larger and the distribution is more uniform. When axial positions are between the rotor and stator, the value of the axial velocity component is larger, especially in the position where the span is large, while the flow is more uniform and the fluctuation becomes smaller. At the stator exit, the fluid is further accelerated in the channel and the axial velocity increases, but the tangential and radial velocities decrease significantly. The number of peaks and valleys also become inconsistent with the stator blades number.
Comparing Figure 23 with Figure 24, it can be concluded that the axial velocity fluctuation trend is similar at the rotor inlet. By contrast with axial velocity, the fluctuation of the tangential and radial velocity components is relatively smaller. When the fluid flows to the position between the rotor and stator, the axial velocity of the model designed by the lifting method is relatively small, and the peak value of the tangential and radial velocity are also smaller, implying that the rotor blade designed by the lifting method has a lower acceleration effect, but its energy loss is relatively smaller. In addition, the mainstream is more uniform and stable. At the position of the pump-jet outlet, the model designed by the lifting-line method has a greater velocity in all three directions with a more complicated internal flow field, while the turbulent kinetic energy of the lifting-line method is also greater.

4.1.2. Optimized Pump-Jet Model Performance

To better design the pump-jet propeller suitable for medium and small underwater vehicles, the model designed by the lifting method was optimized, with rotor hub ratio being changed from 0.4 to 0.45, the rotor placement angle being changed from 64.9° to 69.66°, the tip clearance being changed from 1 to 1.9 mm, the gap of rotor-stator increasing from 26.8 to 33.49 mm, and the stator placement angle being changed from 77° to 82°. The hydraulic performance curves before and after optimization are shown in Figure 25. It can be seen from the figure that after optimization, the thrust coefficient and efficiency curve shift towards the direction of high speed as a whole, and the optimal operating point is also slightly shifted. The efficiency drop at high advance coefficient is slightly slower, which makes the high-efficiency range broader.
After the optimization, the new pump-jet thruster performance has an evident improvement. To make the improvement clearer to understand, we analyzed the pressure and velocity distribution characteristics.
The chordal pressure distribution of the rotor and stator blades after optimization is shown in Figure 26 and Figure 27. Compared to the optimized pressure coefficient distribution in the two figures, the basic pattern remains the same. From the curves of the pump-jet before optimization, the comparison shows that the overall pressure coefficient of the rotor blade remains stable. Due to the change of the installation angle, the pressure difference between the pressure surface and the suction surface at the inlet edge is slightly reduced so that the blade load is reduced. Above all, it indicates that it is less prone to cavitation after optimization at the inlet edge. On the suction side, the pressure drop is relatively smaller at the outlet edge, indicating that the energy loss at the outlet is smaller. On the pressure surface, the overall pressure is greater than before, and the peak pressure near the inlet edge and the outlet edge is larger. The phenomenon is more obvious at the tip of the blade, indicating that the optimized blade has a stronger effect on the fluid rotation acceleration and produces a greater thrust. With the increase of the advance coefficient, the pressure reduction on the pressure surface is lower than the model before optimization, especially at higher advance coefficient where the pressure distribution at different cylinder radii is more close, implying that the optimized pump-jet propulsion has a relatively increased thrust at higher speeds.
Compared to the pump-jet before optimization, the difference between the suction surface and the pressure surface at the inlet edge increases, indicating that the stator blades are optimized compared to the outlet edge. As a result, cavitation is less likely to occur after optimization. On the suction surface of the stator blade, the pressure at the inlet edge is increased, indicating that the fluid coming out of the rotor has a higher velocity, and the energy obtained is greater. On the pressure surface, the increased pressure indicates that the stator reduces the rotor rotational kinetic energy converting it into higher pressure energy. Therefore, the axial velocity generated is relatively higher.
Figure 28 shows the axial pressure distribution in the rotor channel. Referring to performance before optimization, it can be seen that the optimized pump-jet propeller increases the high-pressure area among the pressure surface at the inlet and middle section. What is more, the low-pressure area of the suction surface is significantly reduced, indicating that the pump-jet is less prone to occurring cavitation after the optimization. In addition, the effect of accelerating the fluid rotation is more evident with the increasing function of the fluid. When the fluid reaches the rotor outlet (streamwise = 0.7 and streamwise = 0.9), the average pressure in the optimized blade channel is higher, which maintains a certain periodicity, implying that the rotor blades increase the acceleration of the fluid after the optimization, so that the fluid energy gained is higher.
Figure 29 shows the circumferential distribution of the velocity components in each direction of the pump-jet propulsion at different axial positions after optimization. Compared to the model before optimization, it can be found that the axial velocity pulsation at the front of the rotor (streamwise = 1.5) is more stable, and the tangential and radial velocities are relatively small, so that the fluid flows in the rotor is more uniform. When the fluid is in the middle of the rotor and the stator, the axial velocity component is greater, which indicates that the rotor has a more obvious acceleration effect on the fluid in the channel, so that the fluid obtains more energy leading to a greater axial velocity, especially at the blade tip. The peak values of tangential velocity Vx and the radial velocity Vy are smaller than that before optimization, which shows that the optimized internal flow field becomes more stable and the turbulent kinetic energy is smaller. At the outlet position, the radial and tangential velocity of the pump-jet is lower after optimization, and the axial velocity component is larger, indicating that the propulsion produces a larger thrust and more effective for fluid work.

4.2. Analysis of Pump-Jet Performance by Inverse Design Method

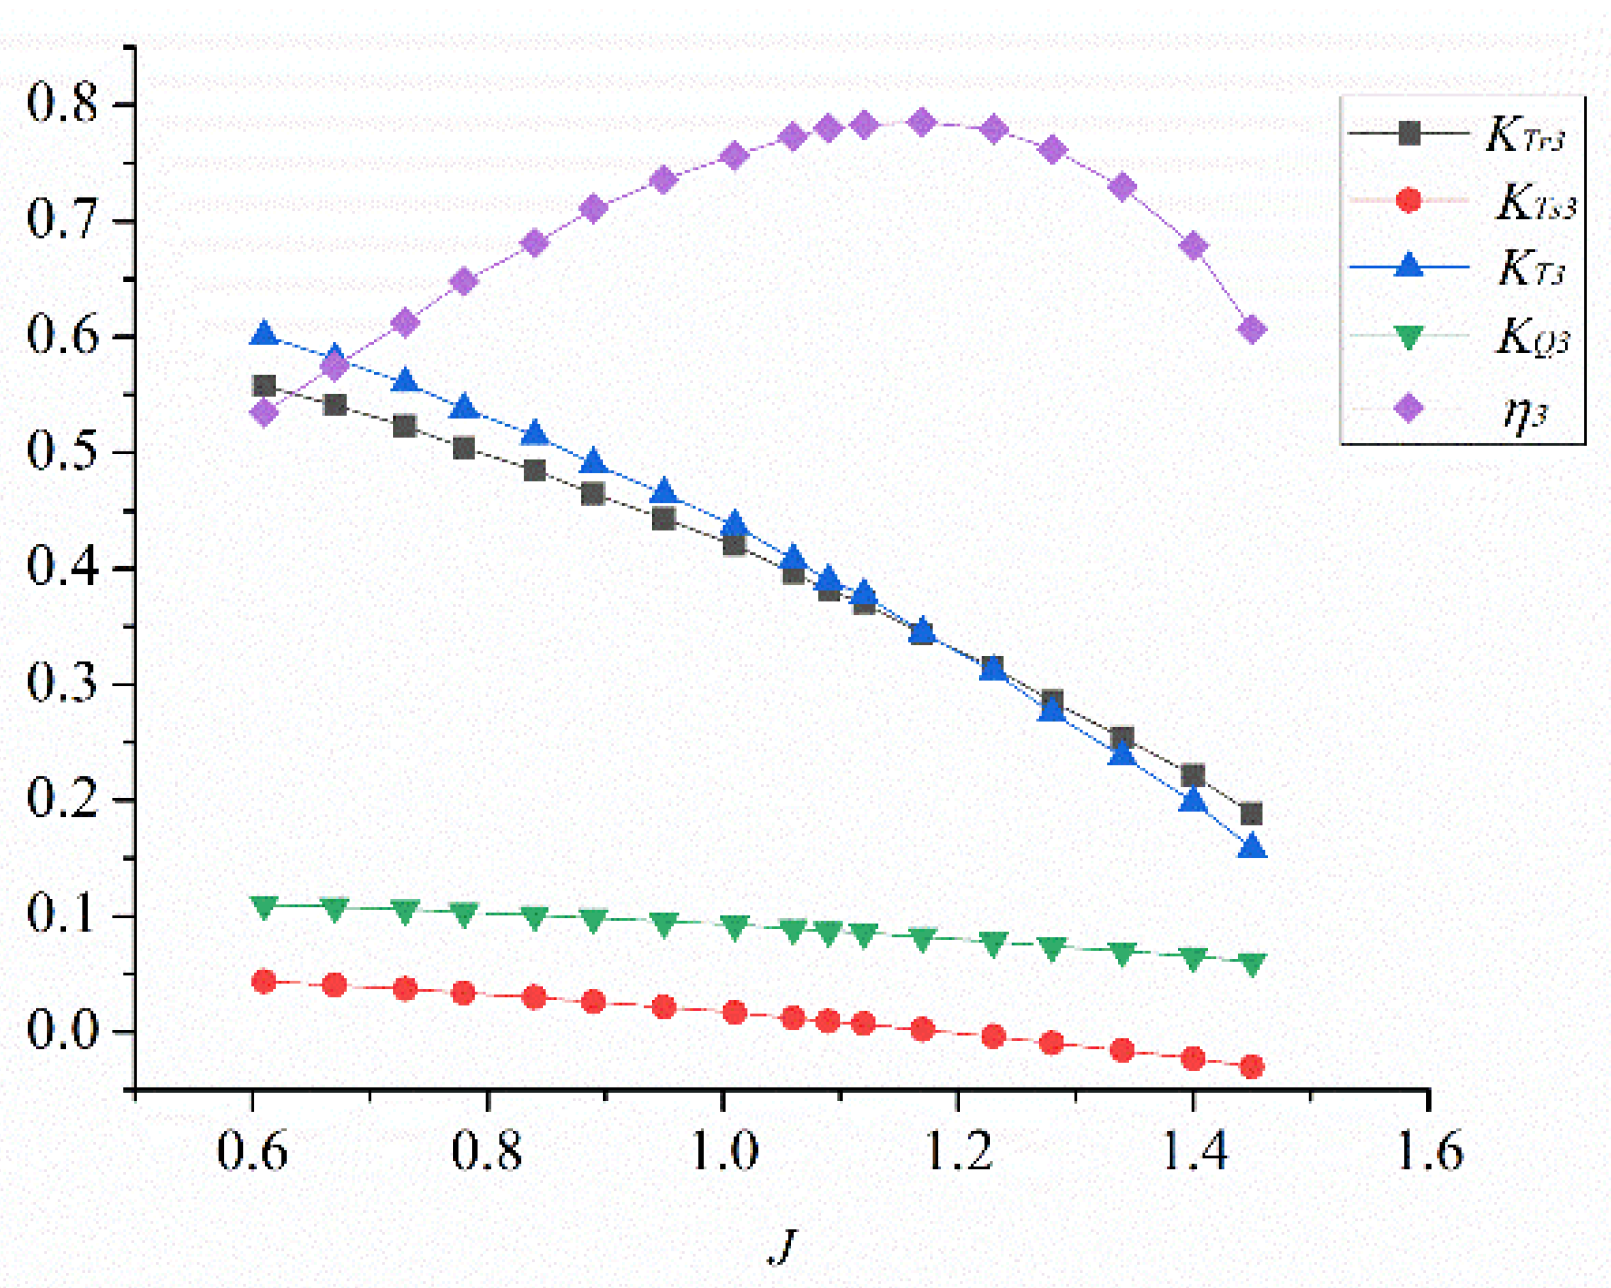
According to the numerical simulation results of the model obtained by the inverse design method, the hydrodynamic performance curves are shown in Figure 30. Compared to the optimal model, it is found that the regular pattern of the overall hydrodynamic performance curve remains unchanged. As the advance coefficient increases, the efficiency curve first increases and then decreases slowly, with the thrust coefficient curve and the torque coefficient curve decreasing steadily. Based on the model designed before, the highest efficiency of the model designed by the inverse design method is 5.94% larger than that of the optimal model. The optimal operating point is J = 1.17, and the efficiency under most operating conditions is larger than the optimized model that is designed initially by the direct method. The high-efficiency area (defined as efficiency higher than 60%) has been significantly widened, and the efficiency variation trend is more stable at medium speed. The thrust coefficient of the model designed by the inverse design method is greater than that of the model designed by the direct method under different working conditions, while the operating point of the negative thrust of the stator designed by the inverse design method is shifted towards the high advance coefficient direction, which also shows the rotor and stator designed by the method are better matched.
Figure 31 and Figure 32 show the chordal pressure distribution of the pump-jet rotor and stator blades obtained by the inverse design method. Compared to the model optimized by the direct method, the rotor has a relatively larger pressure difference between the inlet and outlet edges of the blade and the suction surface, with the greater blade load and the pressure gradient. The pressure on the pressure surface of the rotor blade is higher and the pressure rises more on the outlet edge. As the advance coefficient increasing, the pressure of the pressure surface decreases more slowly, which indicates that the rotor blades designed in the inverse method have a greater effect on the fluid rotation acceleration with generating bigger thrust. The increase with the advance coefficient makes the thrust reduction smaller. In most areas of the blade, the load on the blade surface is smoother than that of the above-optimized blades, while with different radii, the blade pressure coefficient curve obtained by the inverse design method has a smaller change. Therefore, the blades designed by the inverse design method can accelerate the fluid well so that the fluid can obtain more energy and adapt to a larger range of advance coefficients. After the fluid passes through the blades, the flow rate is higher, and it is better integrated with the mainstream more efficiently.
Compared to the stator before optimization, the difference between the suction surface and the pressure surface of the stator is smaller, indicating that cavitation is less likely to occur. However, the pressure gradient changes much from the inlet edge to the outlet edge, implying that there is more unstable flow in the internal fluid field with a greater kinetic energy.
Figure 33 shows the pressure distribution at different cross-sections in the rotor channel obtained by three-dimensional reverse design. Compared to the optimal pump-jet, at the inlet of the rotor (20% of rotor channel) obtained by the inverse design, the pressure value on the pressure surface side is relatively smaller. However, the pressure value on the suction surface side is larger with the smaller low-pressure area. When the fluid reaches the middle section (at 40% and 70% in the rotor channel), the low-pressure area in the channel is further reduced, and the high-pressure area increases more obviously, especially at 70% of the rotor channel. When the fluid reaches the outlet position (90% of the rotor channel), the overall pressure is higher and most of the area is a high-pressure area. These phenomena show that the overall pressure of the blade channel obtained by the three-dimensional inverse design method is higher, so that the velocity of the fluid is higher and the degree of fusion with the mainstream in the channel is higher. However, as the fluid develops, the periodicity in the channel is weakened, and the internal flow field becomes more complex with its turbulent kinetic energy increasing accordingly.
Compared to the circumferential velocity distributions at different positions of pump-jet by the direct method, it can be seen from Figure 34 that the rotor blades designed by the inverse method have more stable peaks and valleys of the axial velocity at different radii at the inlet, with the higher peak value. When the fluid moves to the middle between the rotor and stator and at the outlet position, the axial velocity is greater. However, its fluctuation is also intense, with the larger peak value of tangential and radial velocity. It shows that the fluid in the channel has a greater velocity after passing through the rotor and obtains more energy. However, the internal flow field becomes more complicated, and the energy loss is relatively large.

5. Conclusions

In this study, the direct and inverse design methods were adopted to model the structure of the pump-jet propulsion. For the direct design method, the lifting method and lifting-line design method are used to compare their hydrodynamic performance with the better performance model chosen to be optimized by Isight. Subsequently, the inverse design method adopting the mutual iteration method to design the pump-jet was applied to construct the pump-jet model. The performance of the pump-jet designed by different methods was obtained by the ANSYS CFX simulation analysis, which has been widely used for the accurate prediction of the fluid machinery in academia [45,46,47]. Through comparative analysis, it is found that
  • For the direct design method, compared to the lifting-line method, the pump-jet propeller designed by lifting method has higher efficiency under the working condition of J < 1.5, which is roughly 5% higher on average, while the range of the high-efficiency operating conditions (η > 60%) of the two methods is similar. The pump-jet designed by the lifting method has a weaker accelerating effect on the mainstream, which produces lower thrust and torque. Moreover, the cavitation is less likely to occur on the blades and the pressure distribution is more uniform, which indicates that the work exerted on the fluid is more uniform and the fluid merges with the mainstream to a greater degree after acceleration so that the matching stator is less prone to cavitation. The turbulent kinetic energy of the internal flow field is also lower. Thus, for small and medium-sized underwater vehicles, the pump-jet designed by the lift method is more suitable.
  • After optimizing, the rotor hub ratio changed from 0.4 to 0.45; The rotor placement angle was changed from 64.9° to 69.66°; The tip clearance was changed from 1 to 1.9 mm; The gap of rotor-stator increased from 26.8 to 33.49 mm. In addition, the stator placement angle increased from 77° to 82°. In terms of the hydrodynamic performance, the weighted average efficiency of the two working conditions J = 1.06 and J = 1.07 is 5.372%, which is higher than that before the optimization. After the optimization, the highest efficiency of the pump-jet increased by 5.14%, with the thrust increasing roughly 224.8 N, while the thrust coefficient and efficiency curve both deviate to the direction of the higher speed, with the optimal working condition point slightly shifting. The efficiency drop is slightly slowed down at a higher advance coefficient, which broadens the high-efficiency range. Moreover, the blade has a stronger effect on fluid rotation and acceleration so that the energy obtained by the fluid is higher, with the thrust relatively increasing at a higher advance coefficient. For the stator part, it is more likely to produce cavitation at the outlet edge than that before optimization, but part of it converts the kinetic energy at the rotor outlet into the high-pressure energy.
  • The pump-jet obtained by the inverse design method has a greater thrust, with the negative thrust generated by the stator shifting to a higher speed at the operating point, implying that the matching of the rotor and stator is better. The maximum efficiency is 78.56%, which is 5.94% higher than that obtained by the direct design method. Furthermore, the high-efficiency range is wider, so that efficiency value is more stable at a medium speed. Compared to the pump-jet obtained by the direct method, the inverse method has a larger effect on the rotation acceleration of the fluid, so that the fluid achieves greater energy, with greater thrust and velocity. As the advance coefficient increases, the adaptive advance speed range is larger. However, the fluid accelerated by the rotor makes the stator flow field more unstable and the turbulent kinetic energy is greater. As the fluid further develops, the periodicity in the channel weakens as the internal flow field becomes more complicated, which indicates that the turbulent kinetic energy is higher, causing relatively larger energy loss. On the whole, the pump-jet obtained by the inverse design method has better balance and anti-cavitation performance, especially at higher speeds.
In summary, for the pump-jet propulsion used in the small and medium-sized underwater vehicles, if the thrust and high efficiency are emphasized, the inverse design method is adopted; otherwise, if the stability and anti-cavitation performance are emphasized, the direct design method should be preferred. For further in-depth research on the topic, due to a lack of the benchmark model for validating the absolute accuracy of the simulation tool, a potentially more complex turbulence model for the CFD simulation can be applied for the performance evaluation of the new pump-jet propulsion model designs [48,49,50].

Author Contributions

Conceptualization, J.Y., L.W., and Y.F.; methodology, Y.Z.; software, Y.Z.; validation, Y.Z. and Y.C.; formal analysis, Y.Z.; investigation, Z.W., W.L., J.X., Z.W., and R.L.; resources, Y.Z.; data curation, Y.Z.; writing—original draft preparation, Y.Z.; writing—review and editing, Y.Z.; visualization, Y.Z., Y.C., and L.W.; supervision, J.Y. and J.Y.; project administration, J.Y.; funding acquisition, J.Y. All authors have read and agreed to the published version of the manuscript.

Funding

This research was funded by the Institute of Fluid Engineering Equipment, National Natural Science Foundation of China (12002137), Natural Science Foundation of Jiangsu Province (Grant No. BK20180879), High-level Talent Research Foundation of Jiangsu University (Grant No. 18JDG012), National Key Research and Development Plan Project (Grant No. 2018YFB0606103), and Construction of Dominant Disciplines in Colleges and Universities and Universities in Jiangsu (PAPD).

Institutional Review Board Statement

Not applicable.

Informed Consent Statement

Not applicable.

Data Availability Statement

Not applicable.

Conflicts of Interest

The authors declare no conflict of interest.

References

  1. Tiankui Wang, D.T. Pump jet propeller-the method of low noise nuclear submarine propulsion. Mod. Mil. 2006, 7, 52–54. [Google Scholar]
  2. Zhao, B.; Yin, S.P.; Gao, Y.; Cai, W.J.; Gao, Z.Y. Study on Noise Generation Mechanism of Flow Interference for Torpedo Pump Jet Propulsor. Torpedo Technol. 2009, 17, 1–4. (In Chinese) [Google Scholar]
  3. Yang, Q.; Wang, Y. Principle and Application of Low Noise Pumpjet Design; Huazhong University of Science and Technology (HUST) Press: Wuhan, China, 2016. (In Chinese) [Google Scholar]
  4. Bontempo, R.; Manna, M. Performance analysis of ducted marine propellers. Part II–Accelerating duct. Appl. Ocean Res. 2018, 75, 153–164. [Google Scholar] [CrossRef]
  5. Bontempo, R.; Cardone, M.; Manna, M. Performance analysis of ducted marine propellers. Part I–Decelerating duct. Appl. Ocean Res. 2016, 58, 322–330. [Google Scholar] [CrossRef]
  6. Henderson, R.E.; McMahon, J.F.; Wislicenus, G.F. A Method for the Design of Pumpjets; Defense Technical Information Center: Fort Belvoir, VA, USA, 1964.
  7. Wu, X. Inspiration from the Developmental Process of US MK48 Series Torpedoes. Torpedo Technol. 2006, 14, 7–9. [Google Scholar]
  8. Chiang, W.L.; Furuya, O. A New Pumpjet Design Theory; Armed Services Technical Information Agency: Washington, DC, USA, 1987.
  9. Korde, U.A. Study of a jet-propulsion method for an underwater vehicle. Ocean Eng. 2004, 31, 1205–1218. [Google Scholar] [CrossRef]
  10. Lu, L. Reaseach on Design and Flow Field Characteristic of the Pumpjet Propulsor. Ph.D. Thesis, Northwestern Polytechnical University, Xi’an, China, 2016. [Google Scholar]
  11. Rao, Z. Numerical Simulation of Hydrodynamical Performance of Pump Jet Propulsor; Shanghai Jiao Tong University: Shanghai, China, 2012. [Google Scholar]
  12. Liu, Y. Study on Design Method of Pump Jet Thruster for Underwater Vehicles. Ph.D. Thesis, Harbin Engineering University, Harbin, China, 2013. [Google Scholar]
  13. Yuan, J.; Chen, Y.; Wang, L.; Fu, Y.; Zhou, Y.; Xu, J.; Lu, R. Dynamic Analysis of Cavitation Tip Vortex of Pump-Jet Propeller Based on DES. Appl Sci. 2020, 10, 5998. [Google Scholar] [CrossRef]
  14. Zhang, M. 3-D inverse design of pumpjet and comparison with opening water performance of original propeller. J. Harbin Eng. Univ. 2017, 38, 690–696. [Google Scholar]
  15. Jin, S. Research on the global parameters selection and design of pumpjet of underwater vehicle. J. Harbin Eng. Univ. 2018, 39, 851–856. [Google Scholar]
  16. Suryanarayana, C. Innovative CAM techniques for propeller manufacture. In Proceedings of the 3rd International Conference on Navy and Ship Building Nowadays(NSN2003), St Petursburg, Russia, 4 June 2003. [Google Scholar]
  17. Ch, S.; Satyanarayana, B.; Ramji, K.; Saiju, A. Experimental evaluation of pumpjet propulsor for an axisymmetric body in wind tunnel. Int. J. Nav. Archit. Ocean Eng. 2010, 2, 24–33. [Google Scholar]
  18. Suryanarayana, C.; Suryanarayana, B.; Ramji, K. Performance evaluation of an underwater body and pumpjet by model testing in cavitation tunnel. Int. J. Nav. Archit. Ocean Eng. 2010, 2, 57–67. [Google Scholar] [CrossRef] [Green Version]
  19. Shirazi, A.T.; Nazari, M.R.; Manshadi, M.D. Numerical and experimental investigation of the fluid flow on a full-scale pump jet thruster. Ocean Eng. 2019, 182, 527–539. [Google Scholar] [CrossRef]
  20. Ivanell, S. Hydrodynamic Simulation of a Torpedo with Pumpjet Propulsion System; Royal Institute of Technology: Stockholm, Sweden, 2001. [Google Scholar]
  21. Fangwei, X.; Rui, X.; Gang, S.; Cuntang, W. Flow characteristics of accelerating pump in hydraulic-type wind power generation system under different wind speeds. Int. J. Adv. Manuf. Tech. 2017, 92, 189–196. [Google Scholar] [CrossRef]
  22. Zhang, N.; Liu, X.; Gao, B.; Wang, X.; Xia, B. Effects of modifying the blade trailing edge profile on unsteady pressure pulsations and flow structures in a centrifugal pump. Int. J. Heat Fluid Flow 2019, 75, 227–238. [Google Scholar] [CrossRef]
  23. Zhang, N.; Yang, M.; Gao, B.; Li, Z.; Ni, D. Investigation of rotor-stator interaction and flow unsteadiness in a low specific speed centrifugal pump. Stroj. Vestn. J. Mech. Eng. 2016, 62, 21–31. [Google Scholar] [CrossRef]
  24. Abomohra, A.E.-F.; Jin, W.; Sagar, V.; Ismail, G.A. Optimization of chemical flocculation of Scenedesmus obliquus grown on municipal wastewater for improved biodiesel recovery. Renew. Energy 2018, 115, 880–886. [Google Scholar] [CrossRef]
  25. Afonaa-Mensah, S.; Wang, Q.; Uzoejinwa, B.B. Optimization of the cost of power generation of an evolving load profile in a solar photovoltaic-integrated power system. Energy Explor. Exploit. 2019, 37, 1388–1407. [Google Scholar] [CrossRef]
  26. Yongphet, P.; Wang, J.; Wang, D.; Mulbah, C. Optimization of operation conditions for biodiesel preparation from soybean oil using an electric field. Biomass Convers. Biorefinery 2020. [Google Scholar] [CrossRef]
  27. Zhao, B.; Wang, Y.; Chen, H.; Qiu, J.; Hou, D. Hydraulic optimization of a double-channel pump’s impeller based on multi-objective genetic algorithm. Chin. J. Mech. Eng. 2015, 28, 634–640. [Google Scholar] [CrossRef]
  28. Wang, W.; Mo, R.; Zhang, Y. Multi-Objective Aerodynamic Optimization Design Method of Compressor Rotor Based on Isight. Procedia Eng. 2011, 15, 3699–3703. [Google Scholar] [CrossRef] [Green Version]
  29. Poli, R.; Kennedy, J.; Blackwell, T. Particle swarm optimization. In Proceedings of the IEEE International Conference on Neural Networks Proceedings, Perth, Australia, 6 August 2002. [Google Scholar]
  30. Luo, X. Calculation and Optimization of the Full Three-Dimensional Inverse Design Method of Francis Turbine Impeller; Beijing University: Beijing, China, 1995. [Google Scholar]
  31. Isight. 5.8.3. September 2013. DS SIMULIA. Available online: http://www.3ds.com/products/simulia/overview/ (accessed on 1 December 2020).
  32. Schweinsberg, K.; Wegner, L. Advantages of complex SQL types in storing XML documents. Future Gener. Comput. Syst. 2017, 68, 500–507. [Google Scholar] [CrossRef]
  33. Xu, J.; Wang, L.; Asomani, N. Improvement of Internal Flow Performance of a Centrifugal Pump-As-Turbine (PAT) by Impeller Geometric Optimization. Mathematics 2020, 8, 1714. [Google Scholar] [CrossRef]
  34. Zangeneh, M.; Bonaiuti, D. On the coupling of inverse design and optimization techniques for the multiobjective, multipoint design of turbomachinery blades. J. Turbomach. 2009, 131, 134149. [Google Scholar]
  35. Guan, X. Modern Pump Theory and Design; China Aerospace Publishing House: Beijing, China, 2011. [Google Scholar]
  36. Ji, B.; Luo, X.-W.; Wu, Y.-L.; Liu, S.-H.; Xu, H.-Y.; Oshima, A. Numerical investigation of unsteady cavitating turbulent flow around a full scale marine propeller. J. Hydrodyn. 2010, 22, 705–710. [Google Scholar] [CrossRef]
  37. Liu, Y.; Hinrichsen, O. Study on CFD-PBM turbulence closures based on k-E, and Reynolds stress models for heterogeneous bubble column flows. Comput. Fluids 2014, 105, 91–100. [Google Scholar] [CrossRef]
  38. Gao, X.; Shi, W.; Shi, Y.; Chang, H.; Zhao, T. DEM-CFD Simulation and Experiments on the Flow Characteristics of Particles in Vortex Pumps. Water 2020, 12, 2444. [Google Scholar] [CrossRef]
  39. Zhan, S.; Yang, J.; Wang, Z.; Zhao, R.; Zheng, J.; Wang, J. CFD Simulation of Effect of Interphase Forces and Turbulence Models on Gas–Liquid Two-Phase Flows in Non-Industrial Aluminum Electrolysis Cells. JOM 2017, 69, 1589–1599. [Google Scholar] [CrossRef]
  40. Zhao, R.; Gosselin, L.; Fafard, M.; Tessier, J.; Ziegler, D.P. Efficiency of pot tightness in reduced pot draft conditions based on multi-length scale CFD simulations. Int. J. Therm. Sci. 2017, 112, 395–407. [Google Scholar] [CrossRef]
  41. Subhas, S.; Saji, V.F.; Ramakrishna, S.; Das, H.N. CFD Analysis of a Propeller Flow and Cavitation. Int. J. Comput. Appl. 2012, 55, 26–33. [Google Scholar]
  42. Rijpkema, D.R.; Vaz, G.N.V.B. Viscous flow computations on propulsors: Verification, validation and scale effects. In Proceedings of the Rina Marine Cfd, London, UK, 22 May 2011. [Google Scholar]
  43. Felli, M.; Camussi, R.; Di Felice, F. Mechanisms of evolution of the propeller wake in the transition and far fields. J. Fluid Mech. 2011, 682, 5–53. [Google Scholar] [CrossRef] [Green Version]
  44. Bonaiuti, D.; Zangeneh, M.; Aartojarvi, R.; Eriksson, J. Parametric design of a waterjet pump by means of inverse design, CFD calculations and experimental analyses. J. Fluids Eng. 2010, 132, 1–15. [Google Scholar] [CrossRef]
  45. Cheng, W.T.; Wu, Y.M.; Li, C.; Ma, G.; Zhang, J. Study of three-dimensional numerical simulation on hydro-brake with baffle. J. Drain. Irrig. Mach. Eng. 2018, 36, 50–54. (In Chinese) [Google Scholar]
  46. Ma, G.F.; Wu, Y.M.; Fang, Y.; Li, C.; Zheng, Y.; Zhang, L. Solid-phase flushing features numerical simulation of three-dimensional multiphase flow in eddy current device. J. Drain. Irrig. Mach. Eng. 2018, 36, 334–339. (In Chinese) [Google Scholar]
  47. Li, Y.; Wu, Z.C.; Tagawa, K.; Feng, F.; Zhang, T.T.; Bai, R.B.; Li, J.Y. Numerical simulation on aerodynamic characteristics of vertical axis wind turbine with eccentric rotor structure. J. Drain. Irrig. Mach. Eng. 2018, 36, 413–419. [Google Scholar]
  48. Zhao, Z.Z.; Qian, S.Y.; Shen, W.Z.; Wang, T.G.; Xu, B.F.; Zheng, Y.; Wang, R.X. Numerical simulation of new variable-pitch strategy for H-type wind turbine. J. Drain. Irrig. Mach. Eng. 2018, 36, 230–236. [Google Scholar]
  49. Gao, X.Q.; Zhang, X.X.; Wang, J.J. Numerical simulation of corrosion inhibitor behavior. J. Drain. Irrig. Mach. Eng. 2017, 35, 50–55. [Google Scholar] [CrossRef]
  50. Yang, Y.; Qiu, T. Numerical simulation of fan nozzle of guide board type cleaning jet flow field. J. Drain. Irrig. Mach. Eng. 2017, 35, 243–247. [Google Scholar] [CrossRef]
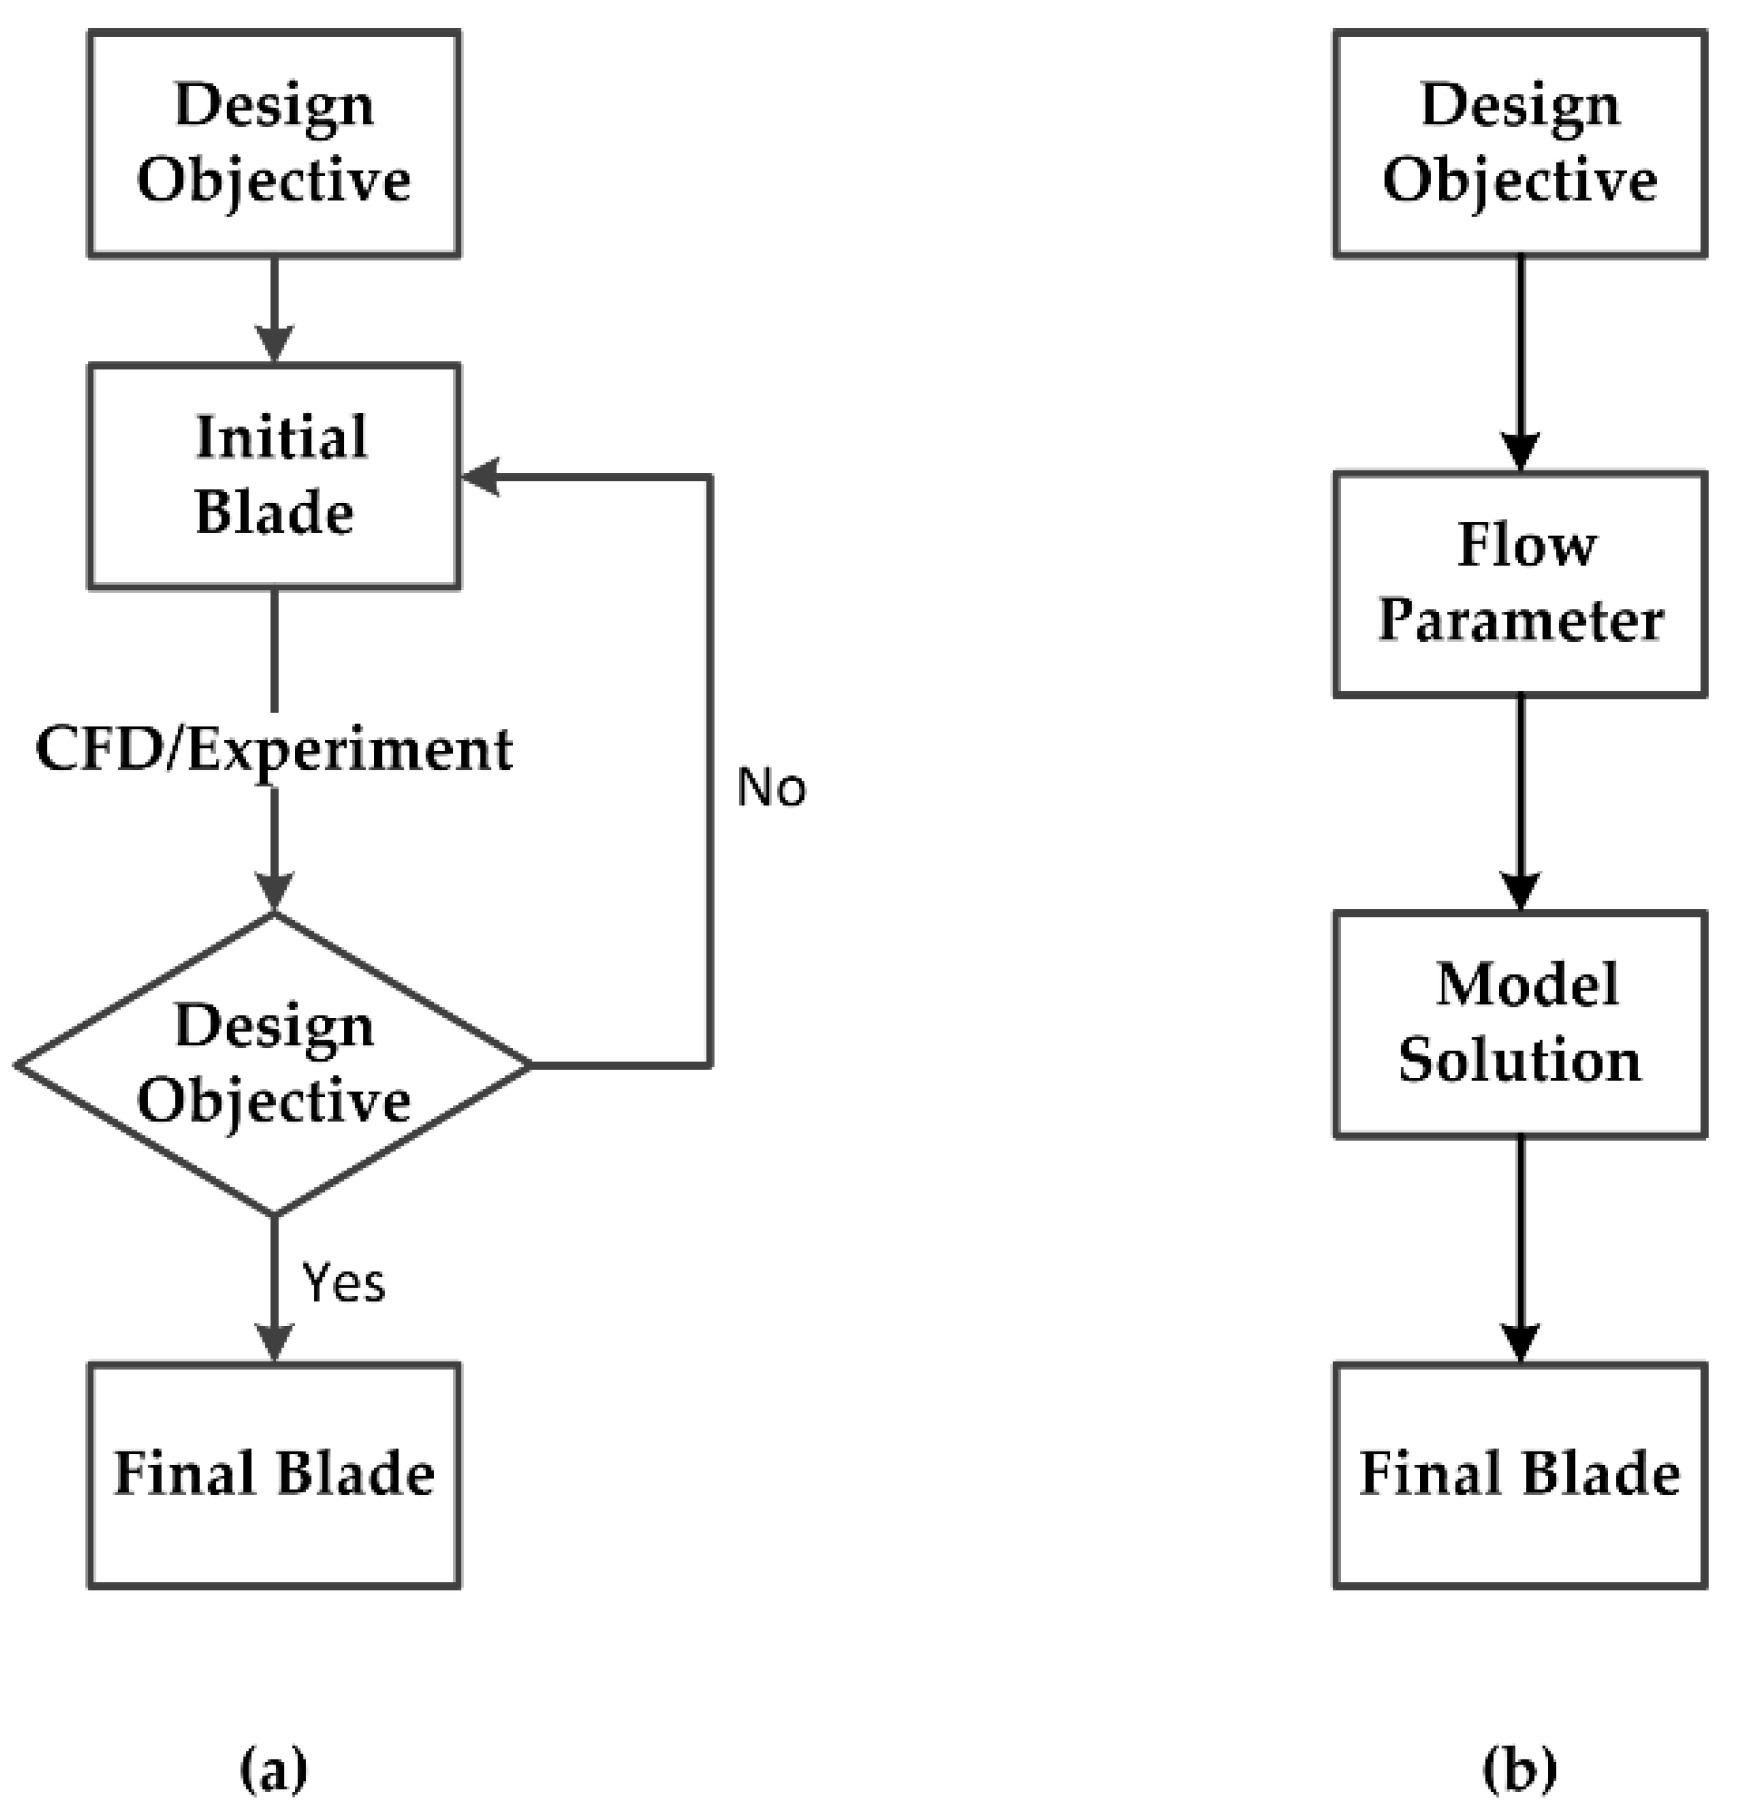
Figure 1. Flowchart of pump-jet design methods: (a) direct method and (b) inverse method.
Mathematics 09 00343 g001
Figure 2. Velocity triangle of the rotor blade.
Mathematics 09 00343 g002
Figure 3. Velocity triangle of the rotor blade profile.
Mathematics 09 00343 g003
Figure 4. Flowchart of rotor design by lifting design method.
Mathematics 09 00343 g004
Figure 5. Force and velocity triangle at the control point on the lifting-line.
Mathematics 09 00343 g005
Figure 6. Establishment of the Isight optimization platform.
Mathematics 09 00343 g006
Figure 7. Load of the rotor and stator blades. (a) Load of the rotor, (b) Load of the stator blades.
Mathematics 09 00343 g007
Figure 8. Pump-jet propulsion model designed by direct method: (a) lifting method; (b) lifting-line method; (c) optimal model.
Mathematics 09 00343 g008
Figure 9. Pump-jet propulsion model designed by the inverse method.
Mathematics 09 00343 g009
Figure 10. Computational domain of pump-jet.
Mathematics 09 00343 g010
Figure 11. Pump-jet propulsion mesh.
Mathematics 09 00343 g011
Figure 12. Computation domain of E779A.
Mathematics 09 00343 g012
Figure 13. Simulation results compared with experiments (J = 0.71).
Mathematics 09 00343 g013
Figure 14. Hydrodynamic performance of pump-jet designed by lifting method and lifting-line method: (a) Lifting method; (b) lifting-line method.
Mathematics 09 00343 g014
Figure 15. Comparison of two design methods hydrodynamic performance.
Mathematics 09 00343 g015
Figure 16. Tangential pressure distribution of the rotor designed by lifting method: (a) v = 7 m/s (J = 0.78), (b) v = 8.5 m/s (J = 0.95), (c) v = 10 m/s (J = 1.12), and (d) v = 11.5 m/s (J = 1.28).
Mathematics 09 00343 g016
Figure 17. Tangential pressure distribution of the rotor designed by lifting-line method: (a) v = 7 m/s (J = 0.78), (b) v = 8.5 m/s (J = 0.95), (c) v = 10 m/s (J = 1.12), and (d) v = 11.5 m/s (J = 1.28).
Mathematics 09 00343 g017
Figure 18. Tangential pressure distribution of stator matched with lifting method: (a) v = 7 m/s (J = 0.78), (b) v = 8.5 m/s (J = 0.95), (c) v = 10 m/s (J = 1.12), and (d) v = 11.5 m/s (J = 1.28).
Mathematics 09 00343 g018
Figure 19. Tangential pressure distribution of stator matched with lifting-line method: (a) v = 7 m/s (J = 0.78), (b) v = 8.5 m/s (J = 0.95), (c) v = 10 m/s (J = 1.12), and (d) v = 11.5 m/s (J = 1.28).
Mathematics 09 00343 g019
Figure 20. Axial section pressure distribution of rotor designed by lifting method: (a) 20% rotor channel, (b) 40% rotor channel, (c) 70% rotor channel, and (d) 90% rotor channel.
Mathematics 09 00343 g020
Figure 21. Axial section pressure distribution of rotor designed by lifting-line method: (a) 20% rotor channel, (b) 40% rotor channel, (c) 70% rotor channel, and (d) 90% rotor channel.
Mathematics 09 00343 g021
Figure 22. Schematic diagram of locations selected: (a) streamwise location and (b) span location.
Mathematics 09 00343 g022
Figure 23. Velocity distribution of pump-jet designed by lifting method (J = 1.12) (a1–a3 are rotor inlet, b1–b3 are between rotor and stator, c1–c3 are stator outlet).
Mathematics 09 00343 g023
Figure 24. Velocity distribution of pump-jet designed by lifting-line method (J = 1.12) (a1–a3 are rotor inlet, b1–b3 are between rotor and stator, c1–c3 are stator outlet).
Mathematics 09 00343 g024
Figure 25. Comparison curves of pump-jet performance before and after optimization.
Mathematics 09 00343 g025
Figure 26. Tangential pressure distribution of rotor after optimization: (a) v = 7 m/s (J = 0.78), (b) v = 8.5 m/s (J = 0.95), (c) v = 10 m/s (J = 1.12), and (d) v = 11.5 m/s (J = 1.28).
Mathematics 09 00343 g026
Figure 27. Tangential pressure distribution of stator after optimization: (a) v = 7 m/s (J = 0.78), (b) v = 8.5 m/s (J = 0.95), (c) v = 10 m/s (J = 1.12), and (d) v = 11.5 m/s (J = 1.28).
Mathematics 09 00343 g027
Figure 28. Axial section pressure distribution of rotor after optimization: (a) 20% rotor channel, (b) 40% rotor channel, (c) 70% rotor channel, and (d) 90% rotor channel.
Mathematics 09 00343 g028
Figure 29. Velocity distribution of pump-jet after optimization (a1–a3 are rotor inlet, b1–b3 are between rotor and stator, c1–c3 are stator outlet).
Mathematics 09 00343 g029
Figure 30. Hydrodynamic performance curves of pump-jet designed by inverse design method.
Mathematics 09 00343 g030
Figure 31. Tangential pressure distribution of rotor designed by inverse design method: (a) v = 7 m/s (J = 0.78), (b) v = 8.5 m/s (J = 0.95), (c) v = 10 m/s (J = 1.12), and (d) v = 11.5 m/s (J = 1.28).
Mathematics 09 00343 g031
Figure 32. Tangential pressure distribution of stator designed by inverse design method: (a) v = 7 m/s (J = 0.78), (b) v = 8.5 m/s (J = 0.95), (c) v = 10 m/s (J = 1.12), and (d) v = 11.5 m/s (J = 1.28).
Mathematics 09 00343 g032
Figure 33. Axial section pressure distribution of rotor designed by inverse design method (a) 20% rotor channel, (b) 40% rotor channel, (c) 70% rotor channel, and (d) 90% rotor channel.
Mathematics 09 00343 g033
Figure 34. Velocity distribution of pump-jet designed by inverse design method (a1–a3 are rotor inlet, b1–b3 are between rotor and stator, c1–c3 are stator outlet).
Mathematics 09 00343 g034
Table 1. Optimization algorithm settings.
ParameterSetting Value
The maximum number of iterations25
Number of particle groups20
Inertia weight0.9
Global increment0.9
Particle increment0.9
Maximum search speed0.1
Run failure threshold1.0 × 1030
Run failure target value1.0 × 1030
Table 2. Optimization parameter.
Optimization VariableInitial ValueUpper and Lower Boundary
Rotor placement angle64.9°[55, 70]
Stator placement angle77°[70, 85]
Rotating stator shaft spacing26.8 mm[16, 36]
Tip clearance1 mm[1, 3]
Hub ratio0.4[0.3, 0.5]
Table 3. The Y+ of rotor and stator part.
PartsY Plus
rotor blades4.5
rotor wall20.5
stator blades2.9
stator wall16.8
Table 4. Dimensionless expression of related physical parameters.
Physical ParameterDefinition
Advance Coefficient J = U / ( n D )
Rotating System Thrust Coefficient K T r = T r / ( ρ n 2 D 4 )
Static System Thrust Coefficient K T s = T s / ( ρ n 2 D 4 )
Rotating System Torque Coefficient K Q r = Q r / ( ρ n 2 D 5 )
Total Thrust Coefficient K T = K T r + K T s
Total Torque Coefficient K Q = K Q r
Propulsion Efficiency η = J 2 π · K T K Q
Table 5. Comparison of different grid numbers for grid independence analysis.
JNumber of GridsKTKQη
1.121,768,6310.2350.062866.58%
2,364,8920.2410.062968.17%
2,873,4350.2340.063164.98%
3,371,0020.2390.063167.37%
3,812,5310.2400.063367.46%
4,371,6560.2410.063567.52%
Publisher’s Note: MDPI stays neutral with regard to jurisdictional claims in published maps and institutional affiliations.