1. Introduction
Tech mining, the adoption of text mining algorithms to retrieve science and technology information, is an abbreviation for “text mining of science & technology information resources” [
1]. Porter and Cunningham [
2] argued that “tech mining” is taking advantage of information regarding evolving technologies to inform technology management. Further, Trumbach et al. [
3] defined tech mining as a method by which a firm can build its knowledge foundation by acquiring an extensive viewpoint of the emerging technology. Lately, Song et al. [
4] defined tech mining as the struggles to derive technological knowledge from technological documents such as patents and publications by using data and text mining techniques [
5].
The main foundation underlying tech mining is that intelligence is a basic prerequisite for effective technology management [
1]. As a particular subdomain of big data analytics, tech mining is becoming particularly prevalent in Future-Oriented Technology Analysis (FTA) studies [
6]. Tech mining aids to obtain technology and market information for science and technology and the future trend [
7].
Tech mining has become widely adopted in the past decade because of the great volume of text data generated in numerous forms such as social networks, health-insurance records, etc. IDC forecasts that the data volume will exceed 175 zettabytes by 2025, up from 33 Zettabytes in 2018, for a compounded annual growth rate of 61 percent [
8]. Patent databases are vital sources of tech mining. Those databases provide sufficient information for innovation, new product development, decision-making and policy definitions in quickly developing economies. Firms ought to mine the prior art as a means of evaluating if their inventions are business feasible. Further, patent mining provides sufficient information design-around patent strategies for patentees and competitors. Engineers may be willing to find whether technical details disclosed in the prior arts can contribute to the solution of some specific technical problem. Policy makers in rapidly developing economies tend to conduct patent analysis as a means of bridging the gap between the current and expected levels of industrial innovation requirements of emerging technologies [
9]. In all the above instances, tech mining of patent databases can provide sufficient information for engineers, management and policy makers.
The information derived from tech mining of patent databases should be precise, delivered timely in a clear format. Such information derivation is feasible only when users are able to extract keywords and recognize and analyze patterns being associated with the patent information. These vital characteristics of contemporary text mining techniques have hence become an essential part of decision-making in the strategic and tactic levels [
10]. Textual data is a typical case of unstructured information, the most basic kind of data which can be created in nearly all situations. Unstructured text can hardly be recognized by computers. Obviously, such volume of text data is a precious source of information and knowledge. Consequently, novel methods and algorithms are urgently required to tackle effectively this surge of text data in a lot of applications [
11].
In recent years, patent analyses have been considered vital tasks by numerous national governments [
12]. Since patent documents contain important results of research, these results are of great significance to applicants. The technical details and relationships disclosed in patent documents can reveal business or technological development trends, allowing companies to gain inspiration from those and develop solutions or formulate investment policies [
13,
14].
Generally speaking, patent analysis uses bibliometric data, including patent number, document type, name, inventor, international patent classification, application date and other information [
15]. Patent data can be analyzed by a variety of techniques. The main path analysis (MPA) is a bibliometric method which can be used to trace the most dominant paths in a citation network of patents and has widely been adopted in tracing the development trajectory of a specific field of technology. During the past two decades, the methods of MPA have widely been adopted in studying the various trajectories of science and technology development. The MPA applied to the citation network can simplify the complex citation network into fewer nodes and links. The most important path can be retained by analyzing the citation network. The MPA applied to patent exploration can analyze the before and after trajectory of patent citation. MPA can also determine the citation relationship between patents [
16].
Even though MPA can derive patent citation relationships, influence relationships among patents and weights associated with specific patents can hardly be derived based on traditional methods, e.g., the search path count (SPC) method of MPA. However, the weight associated with a patent is vital for managerial decisions, e.g., defining research and development (R&D) and patent aggregation strategies. Therefore, defining a novel analytic framework which can derive citation networks for some specific science or technology, take advantage of MPA to trace the most important paths in a citation network, and derive the most influential and important patents in the citation network being retrieved will be very important, whether from the aspect of academic research or industrial applications. Nevertheless, to the best of our knowledge, no prior work has tried to cross the research gap. Consequently, the authors want to design a novel analytic framework to derive the influence relationships among the patents and the influence weight associated with the patents in the main paths.
The analytic framework consists of MPA, the decision-making trial and evaluation laboratory (DEMATEL), and the DEMATEL based analytic network process (DANP). The proposed MPA based DANP framework can be used to derive patent citation relationships by MPA, influence relationships by DEMATEL and influence weights of patents for a specific technology by the DANP. Empirical cases based on the patent mining results from the database of the United States Patent and Trademark Office (USPTO) will be used to justify the practicability of the proposed analytic framework. The proposed MPA-based DANP framework can be used to derive patent citation relationships, influence relationships and influence weights of patents for a specific technology. Two empirical cases, a simple main path from Chuang et al. [
17], and results of tech mining of nanowire field effect transistors (NWFETs) will be used to demonstrate the feasibility of the proposed analytic framework. The analytic results of empirical research can be used as a basis for infringement evaluation, patent designing around and innovation.
The paper is organized as follows: In
Section 2, literature on tech mining, patent mining and citation analysis will be reviewed.
Section 3 introduces the MPA, the DEMATEL and the DANP. Two empirical cases will be demonstrated in
Section 4.
Section 5 discusses practical and managerial implications and advances in research methods, as well as limitations and future research possibilities. Finally,
Section 6 concludes the whole work.
2. Tech Mining and Citation Analytics
The majority of efforts of data mining is to mine information from structured databases. However, the utility of data mining techniques for real world applications is still very limited. With the aim of crossing the research gap, text mining techniques emerged as rather innovative techniques, which have been advanced for retrieving knowledge from unstructured text databases. Text mining is the procedure of looking for or retrieving the valuable information from the text data. Patent citation data comprise rich information for investigating intangible knowledge flows among cited patents and citing patents, which have become a dominant indicator for the provision of correlation amongst technological innovations [
18]. Patent citation information has also become the most vital and elementary indicator to evaluate the influences of those patents. In this Section, the concepts and past works on tech mining will first be reviewed. Then, citation analytics will be reviewed. State of the art in
Section 2 is also summarized in
Table 1, which includes papers in which the tech mining issues were addressed.
Text mining is a novel domain which intends to cross the research gap of information overload by integrating techniques of data mining, machine learning, natural language processing, information retrieval and knowledge management [
19]. Text mining methods enable the analyses and contextualization of huge amounts of information [
3]. These methods include retrieving information from textual data and mining the text to derive rules and patterns [
3]. In the case of tech mining, the texts analyzed are mainly science and technology databases [
3,
20].
According to Porter [
21], the fundamental features in tech mining consist of the model(s) of technological innovation procedure, future-oriented methods for analyzing technology, R&D data, data treatment, analytics, information representation, innovation indicators and the well-informed R&D management. Tech mining enables an analyst to recognize the researchers, major trends, major sources of technical information and evolving or unfamiliar research that may intersect functional interests using lists, matrices, maps and trends retrieved from databases of science and technology information [
22], e.g., Compendex, Inspec or Medline, which comprise of publications on early-stage research [
3]. Additionally, patent databases contain sufficient technological and business information; consequently, patent analyses have long been recognized as a valuable tool for technology management and techno-economic analyses [
23]. Other than the above-mentioned sources of information, government information [
3] which contains the supports of technological information can also be adopted to find future trends of technological innovation [
22]. The trends of evolving technologies can also be recognized by governmental funding of some specific technology [
24].
Tech mining can be used as a knowledge supplement to improve the relationship with external entities, and it can also be used as a method to acquire external knowledge in the absence of such a relationship [
3]. Tech mining can also be used to identify possible partners according to complements or skills required by the focal firm. By constructing the domain knowledge base of the enterprise, the absorptive capacity of the enterprise is improved, thereby improving the general learning ability of the enterprise [
3]. Even though external relationships are a major learning method that can prevent companies from wasting R&D budgets in “reinventing the wheel,” unnecessary reliance on external resources may harm the company’s internal competences. This reduction of internal competences may lead to the weakening of its core competitiveness, resulting in competitive disadvantages [
25]. Therefore, an equilibrium should be sustained among the usage of inside and exterior resources and uses of information [
3].
Patent information is a vital component of tech mining requiring particular techniques, especially in searching and in understanding of legal intellectual property related issues (e.g., patentability, grounds for claims, infringement) [
2]. Patent databases are most frequently used for analyses because of the big data size and ease of access [
4]. According to Chiavetta and Porter [
26], patent analysis is one of the four major tools for tech mining. During the past years, patents have already been adopted widely in various fields. According to the recent work by Madani and Weber [
10], patent mining advanced tech mining from the aspects of information retrieval, pattern recognition and pattern analysis [
4].
The evaluation and selection of patent citations are far more cautious than the citations in academic works. This phenomenon is mainly due to the recognition of citations related to the examination of patents by patent examiners [
27]. The focus of the search process is to retrieve related prior art to confirm the novelty and patentability of a specific invention. Prior-art exploration is essential for citation analysis because citation analyses refer to patents and non-patent literature in the search report.
Conventionally, technological knowledge flows were retrieved based on patent citation information by using the statistics of patent numbers and that of citations [
28]. Nevertheless, these approaches are limited in providing partial information regarding to technological knowledge flow [
29]. Therefore, scholars have proposed many methods to examine the flow of technical knowledge more comprehensively [
18]. In order to master the whole process of technology knowledge transfer or diffusion, various scholars (e.g., [
29,
30,
31,
32,
33,
34]) recognize the necessity of researching the relationship between patent citations from the perspective of network and explore the data of patent citations in combination with network theory [
18].
The research efforts of citation network analysis were initiated by Garfield et al. [
35]. The work used Asimov’s history of deoxyribonucleic acid (DNA) [
36] to demonstrate the feasibility of citation network analysis and argued that the method can demonstrate a high-degree of concurrence among the interpretation of events by an historian and the citation relationship between these events [
37]. Later, Garner [
38] introduced potential uses of graph theory in analyzing citation networks. Hummon and Doreian [
37,
39,
40,
41] further advanced the methods of citation network analysis by proposing three important indices: the node pair projection count (NPPC), search path link count (SPLC) and search path nodes pair (SPNP) methods. These three indices can be adopted to calculate weights associated with arcs in a citation network. They can also help pinpoint the dominant path(s) of a citation network [
37]. The analytic method is the main-path analysis.
Other vital advantages of patent citations include the capability to trace spillovers and technological trajectories [
33,
42]. Early studies used citation information to derive the degree of knowledge spillover between regions, industries, companies and technological interactions [
43,
44]. The received patent citation information can reveal the technical importance, applicability of the patent and the ability of the inventor to benefit from his invention, that is, the appropriability of the patent [
45,
46].
Table 1.
A summary of definitions regarding to the mining of text and technology.
Table 1.
A summary of definitions regarding to the mining of text and technology.
| Definitions | Source |
|---|
| Text mining is a novel domain which intends to cross the research gap of information overload by integrating techniques of data mining, machine learning, natural language processing, information retrieval and knowledge management. | Feldman and Sanger [19] |
| Text mining methods enable the analyses and contextualization of huge amounts of information. These methods include retrieving information from textual data and mining the text to retrieve rules and patterns | Trumbach et al. [3] |
| Tech mining, the adoption of text mining algorithms to retrieve science and technology information, is an abbreviation for “text mining of science & technology information resources”. | Porter [1] |
| The fundamental features in tech mining consist of the model(s) of technological innovation procedure, future-oriented methods for analyzing technology, R&D data, data treatment, analytics, information representation, innovation indicators and the well-informed R&D management | Porter [21] |
| Tech mining enables an analyst to recognize the researchers, major trends, major sources of technical information and evolving or unfamiliar research that may intersect functional interests using lists, matrices, maps and trends retrieved from databases of science and technology information [22], e.g., Compendex, Inspec or Medline, which comprise of publications on early-stage research [3]. | Watts and Porter [22] |
| Patent databases contain sufficient technological and business information; consequently, patent analyses have long been recognized as a valuable tool for technology management and techno-economic analyses [23]. | Yoon and Park [23] |
| Government information which contains the supports of technological information can also be adopted to find future trends of technological innovation [22]. | Watts and Porter [22] |
| The trends of evolving technologies can also be recognized by governmental funding of some specific technology [24]. | Tanabe and Watanabe [24] |
| Tech mining can be used as a knowledge supplement to improve the relationship with external entities, and it can also be used as a method to acquire external knowledge in the absence of such a relationship [3]. | Trumbach et al. [3] |
| By constructing the domain knowledge base of the enterprise, the absorptive capacity of the enterprise is improved, thereby improving the general learning ability of the enterprise [3]. | Trumbach et al. [3] |
| Patent information is a vital component of tech mining requiring particular techniques, especially in searching and in understanding of legal intellectual property related issues (e.g., patentability, grounds for claims, infringement) [2]. | Porter and Cunningham [2] |
| Patent databases are most frequently used for analyses because of the big data size and ease of access [4]. | Song et al. [4] |
| Patent analysis is one of the four major tools for tech mining. | Chiavetta and Porter [26] |
| Patent mining advanced tech mining from the aspects of information retrieval, pattern recognition and pattern analysis [4]. | Song et al. [4] and Madani and Weber [10] |
| Conventionally, technological knowledge flows were retrieved based on patent citation information by using the statistics of patent numbers and that of citations [28]. | Jaffe and Trajtenberg [28] |
| In order to master the whole process of technology knowledge transfer or diffusion, various scholars (e.g., [29,30,31,32,33,34]) recognize the necessity of researching the relationship between patent citations from the perspective of network, and explore the data of patent citations in combination with network theory [18]. | Choe et al. [18] |
3. Research Methods
During the past decades, MPA has been widely adopted in driving main paths in the citation network of academic works or patents. The DEMATEL and/or ANP based analytic works are becoming popular in tackling various MCDM problems. In this Section, the advantages and possible research gaps associated with these methods will be introduced. Then, MPA, DEMATEL, ANP and DANP will be introduced to serve as a basis for defining the novel MPA based DANP framework.
MPA has been widely adopted to tackle the development trajectory of science and technology for decades. During the past two decades, the methods of MPA have successfully derived the most important paths in citation networks of science and technology journals or patents. However, the influence relationships among the academic works and the importance associated with these academic works cannot be derived based on MPA. However, these influence relationships and their importance are vital for academic research and real-world decisions.
Numerous multiple criteria decision making (MCDM) methods have been developed in the past few decades. One of the most well-known methods for deriving the weights associated with an MCDM problem is the analytic network process (ANP). The ANP was proposed by Saaty in the 1990s [
47] to break the assumptions of criteria independences of the analytic hierarchy process (AHP) [
48], an earlier method for weight derivations which was also proposed by Saaty also in the 1970s. By considering the dependency of aspects and criteria, the ANP provides a more realistic solution of weights to complex MCDM problems, with feedback and influence relationships inside the structure of decision problems. Even though the ANP can derive more realistic solutions than traditional MCDM methods which assume independency among aspects and criteria, the analytic process based on the ANP is very trivial. Usually, numerous iterations of questionnaire collections are required for surveying opinions from experts. A structure of the decision problem should be constructed before the application of the ANP by using methods such as Interpretive Structural Modelling (ISM) [
49] or DEMATEL [
50]. Then, the pairwise comparisons of the importance versus each criterion and weight can be derived based on another iteration of the questionnaire. Collection of questionnaires is time-consuming. Sometimes, the same group of experts may not be willing to fill in two or more iterations of questionnaires. Thus, inconsistencies always occur.
DEMATEL is a comprehensive analytic method for deriving the causal relationships among aspects or criteria belonging to a decision-making problem. DEMATEL was developed by Gabus and Fontela [
50] in the 1970s to construct complex causal relationships among numerous world problems. The graph-theory-based model has been widely used in modelling various decision-making problems, which include the configuration of innovation policy portfolio(s) (e.g., [
9]), operations management (e.g., [
51,
52]), education and learning (e.g., [
53,
54,
55,
56]), engineering (e.g., [
57]), medical devices (e.g., [
58,
59]), big data analytics (e.g., [
60]) and other social problems (e.g., [
61]). Compared with other methods (e.g., the ISM), which can structure decision-making problems based on the existence or non-existence of influence relationships between criteria or aspects, DEMATEL can consider the extent of influences between criteria or aspects. For example, the 5-Point Likert Scale or 10-point rating scales are usually adopted by scholars in rating the influences between criteria or aspects. Thus, compared with other structure modeling methods such as ISM, DEMATEL is apparently a more reasonable method. Even though DEMATEL has been widely adopted during the past two decades, it can only derive influence relationships. Other methods such as the ANP are still needed for deriving weights associated with aspects or criteria.
Due to the above-mentioned shortcoming of stand-alone MPA, DEMATEL and the ANP, an integrated framework consisting of MPA and the DANP will be very helpful for deriving influence relationships among the literature or patents in a citation network and the weights associated with each literature or patents. The influence relationships and weights can further serve as the basis for management decisions. Thus, these methods will be defined in this section and serve as a basis for developing the MPA-based DANP framework. The first sub-section introduces MPA. Then, the DEMATEL method will be introduced to derive the influence relationships among the patents based on the citation relationships derived using the SPC of MPA. Following that, the DANP method will be introduced. The influence weights associated with each patent will be derived accordingly.
3.1. MPA
Hummon and Dereian [
39] first proposed the methods for MPA by using citation information to trace the core concepts in a specific science or technology domain. The concept of MPA are grounded on the assumption that knowledge flows from earlier works being cited to novel publications citing these prior works. The MPA methods are based on the network theory, where the scientific or technological publications are considered as nodes of a network while citations link knowledge flows amongst nodes.
The analytic process of the MPA method is usually divided into two phases. Phase 1 derives the traversal count associated with each edge of the citation network. The second phase searches the network for the edge(s) with the highest traversal count based on the traversal counts derived in the first step. The importance of every citation is measured by calculating the total times an edge connecting two patents or technical works has been traversed by exhausting the search from a set of initiation nodes to another set of termination nodes. Numerous algorithms have been proposed to traverse the citation network and derive the traversal counts, where the NPPC, SPLC, SPNP and SPC [
37,
39] are the most popular methods. These counts are similar, but minor discrepancies exist amongst these methods (refer to
Table 2).
Numerous previous works mentioned that these algorithms yield similar results [
37,
63,
64]. For instance, the work by Chuang et al. [
17] adopted the SPC, SPLC and SPNP algorithms to trace journal papers related to medical tourism; the analytic results mentioned that these methods generate almost the same outcomes except that the SPC algorithm comprises an extra node. Batagelj [
37] also recommended the adoption of the SPC method as the primary choice. Therefore, in this work, we derive the main paths based on the SPC method according to Batagelj [
37] as follows. Further, the Pajek program [
65,
66] will be adopted to derive the main path based on the SPC algorithm.
In a given set of units
(patents, academic works, reports, etc.), a citing relation
can be defined as
cites
, where a citation network
can be defined. Given a relation
the inverse relation can be denoted as
where
.
defines the set of successors of unit
. In case that
is acyclic,
is acyclic, too. That is, the network
cites
, is a network which is similar to
. Given
as the identity relation on
and
is the transitive closure of relation
. Then
is acyclic if and only if
. The relation
is the transitive and reflexive closure of relation
[
37].
One of the methods to analyze a citation network is to derive the importance associated with each arc. These importance values will be adopted to derive the vital substructures in the network. In this work, the NPPC and SPLC methods [
39,
40] of allocating weights to arcs will be adopted. In the NPPC method,
. In the SPLC method,
is equivalent to the total amount of every possible search-paths through the network originating from an origin node through the arc
[
39]. For the search path node pair (SPNP) method,
—accounts for all connected vertex pairs along the paths through the arc
[
37,
39].
To derive the SPLC and SPNP weights, a related SPC method is introduced, where the weights
sum the amount of various paths from
to
through the arc
. To derive
two auxiliary quantities are introduced: let
represents the number of various
paths, and
means the amount of numerous
paths. Every
path
containing the arc
can be exclusively expressed in the form
, where
is a
path and
is a
path. Since each pair
of
paths decide a corresponding
path, it follows
, where:
The above equations form the basis for deriving the weights
after the topological sort of the network [
67] we can derive, using the above relations in topological order. The counters
are adopted as SPC weights
[
37].
According to Kirchoff’s node law, the total flow through the citation network is equivalent to
. That is, for each node
in a citation network in the standard form, both the incoming flow as well as the outgoing flow are equivalent to
. Therefore, the weights can be derived by using
. If
is a minimal arc-cut-set,
[
37].
3.2. DEMATEL
The analytic process of DEMATEL can be formulated below according to Tzeng and Huang [
51], Yang et al. [
68], Huang et al. [
57] and Huang et al. [
60]. Based on the SPC number associated with each path, which is retrieved with the MPA method, the influence relations of unit
on unit
, denoted as
in the initial direct relation matrix (IDRM) can be retrieved, where a unit can be a patent, an article, a book, a work, etc. The initial influence relationship matrix can be defined as:
where
is the number of units. After that, the normalized DRM can be derived by a multiplication of the IDRM with a factor
, i.e.,
where:
The total relation matrix (TRM),
, can be calculated by using Equation (4) as follows:
where
is the identity matrix.
After that, the row-sum and column-sum vectors of the TRM can be derived as and , respectively. The influence relation map (IRM) which demonstrates all the aspects, criteria and the causal relations can be derived. Here, and represent the horizontal and vertical axis of the IRM, respectively.
3.3. ANP Method
In this section, concepts of the ANP are summarized based on Saaty’s earlier work [
69] and Yang et al. [
70]. In the very beginning, an unweighted supermatrix can be formulated according to pairwise-comparison of elements. The initial supermatrix
of column eigenvectors will be constructed based on pairwise comparison matrices of elements (refer Equation (5)), where
stands for the
cluster and
stands for the
criterion belonging to the
cluster.
(refer to Equation (6)) belonging to the supermatrix
is a principal eigenvector of the elements belonging to the
component of the network on an element in the
component. Furthermore, if the
cluster does not impact the
cluster, then
.
While the supermatrix is constructed, the weighted supermatrix can be calculated by normalizing every column. After that, the weighted supermatrix is raised to limiting powers according to Equation (7). The global priority vector or called weights can thus be derived.
Furthermore, when cyclicity-effects can be found in the supermatrix, more than one limiting supermatrix is available. Consequently, the Cesaro sum can be formulated using the following equation by taking the limit of the mean of a sequence of
of these powers of the supermatrix according to Equation (8):
The Cesaro sum is essential for deriving the weight associated with every one criterion. The average priority weights can be derived by using the mean of the limiting supermatrix, where Wj denotes the jth limiting supermatrix.
3.4. DANP
DANP, an analytic technique integrating DEMATEL and ANP, was proposed by Prof. Gwo-Hshiung Tzeng [
71,
72,
73] in the 2000s. The DANP method that transforms the TRM being calculated by DEMATEL into the supermatrix of the ANP (refer Equations (5) and (6)), can reduce the time needed for structure derivations. Here, the process of the DANP method is summarized below, based on [
57,
60].
Let
be equal to the transposed matrix of
(refer Equation (4) derived in
Section 3.2. That is,
. The
can be divided into
submatrices (refer Equation (4)), according to the number of aspects (
) to which the criteria or patents belong. In other words,
The submatrices can be denoted as:
where
and
.
and
denotes the numbers of criteria (patents or publications in this work) which are included in the
ith aspect,
, and the
jth aspect,
, respectively. Then, every column of the submatrix,
, should further be normalized by:
The normalized submatrix of
can be formulated as:
The normalized TRM,
, can serve as the unweighted supermatrix,
, according to Equations (5) and (6). To derive the weighted supermatrix, the values of the elements belonging to each submatrix
that belongs to the matrix
can be summed and filled into the matrix:
in which
aggregates every element of the submatrix
. Then, the matrix
can further be normalized by Equation (14) as follows:
by normalizing each column to unity as follows, where:
The weighted supermatrix,
, can thus be calculated by multiplying the transposed matrix,
, to
, i.e.,
Then, the weighted supermatrix can be calculated by raising the weighted supermatrix to its limiting powers, or The global priority vectors can be calculated as a result, plus the weights companied with every objective.
3.5. Overview of the Analytic Framework
In general, the analytic framework consists of five stages. First, the scope of patent mining and the patent database to be mined should be defined. Then, the citation network will be derived. After that, main paths belonging to the citation network will be retrieved using MPA. DEMATEL will be adopted to calculate the causal relationships among the patents belonging to the main path. Finally, the influence weights accompanying every patent will be calculated by using the DANP. The process is demonstrated in
Figure 1.
4. Empirical Study
In this Section, two empirical cases will be adopted to demonstrate the feasibility of the proposed MPA based DANP method. At first, a simple example based on the main path derived by Chuang et al. [
17] will be demonstrated. Then, in
Section 4.2, an empirical study based on the tech mining of NWFET patent, a novel semiconductor device which has been adopted in the fabrication of advanced integrated circuits, will be introduced to demonstrate the feasibility of the proposed MPA based MCDM framework.
4.1. An Illustration of the Proposed Framework Based on an Simple Case
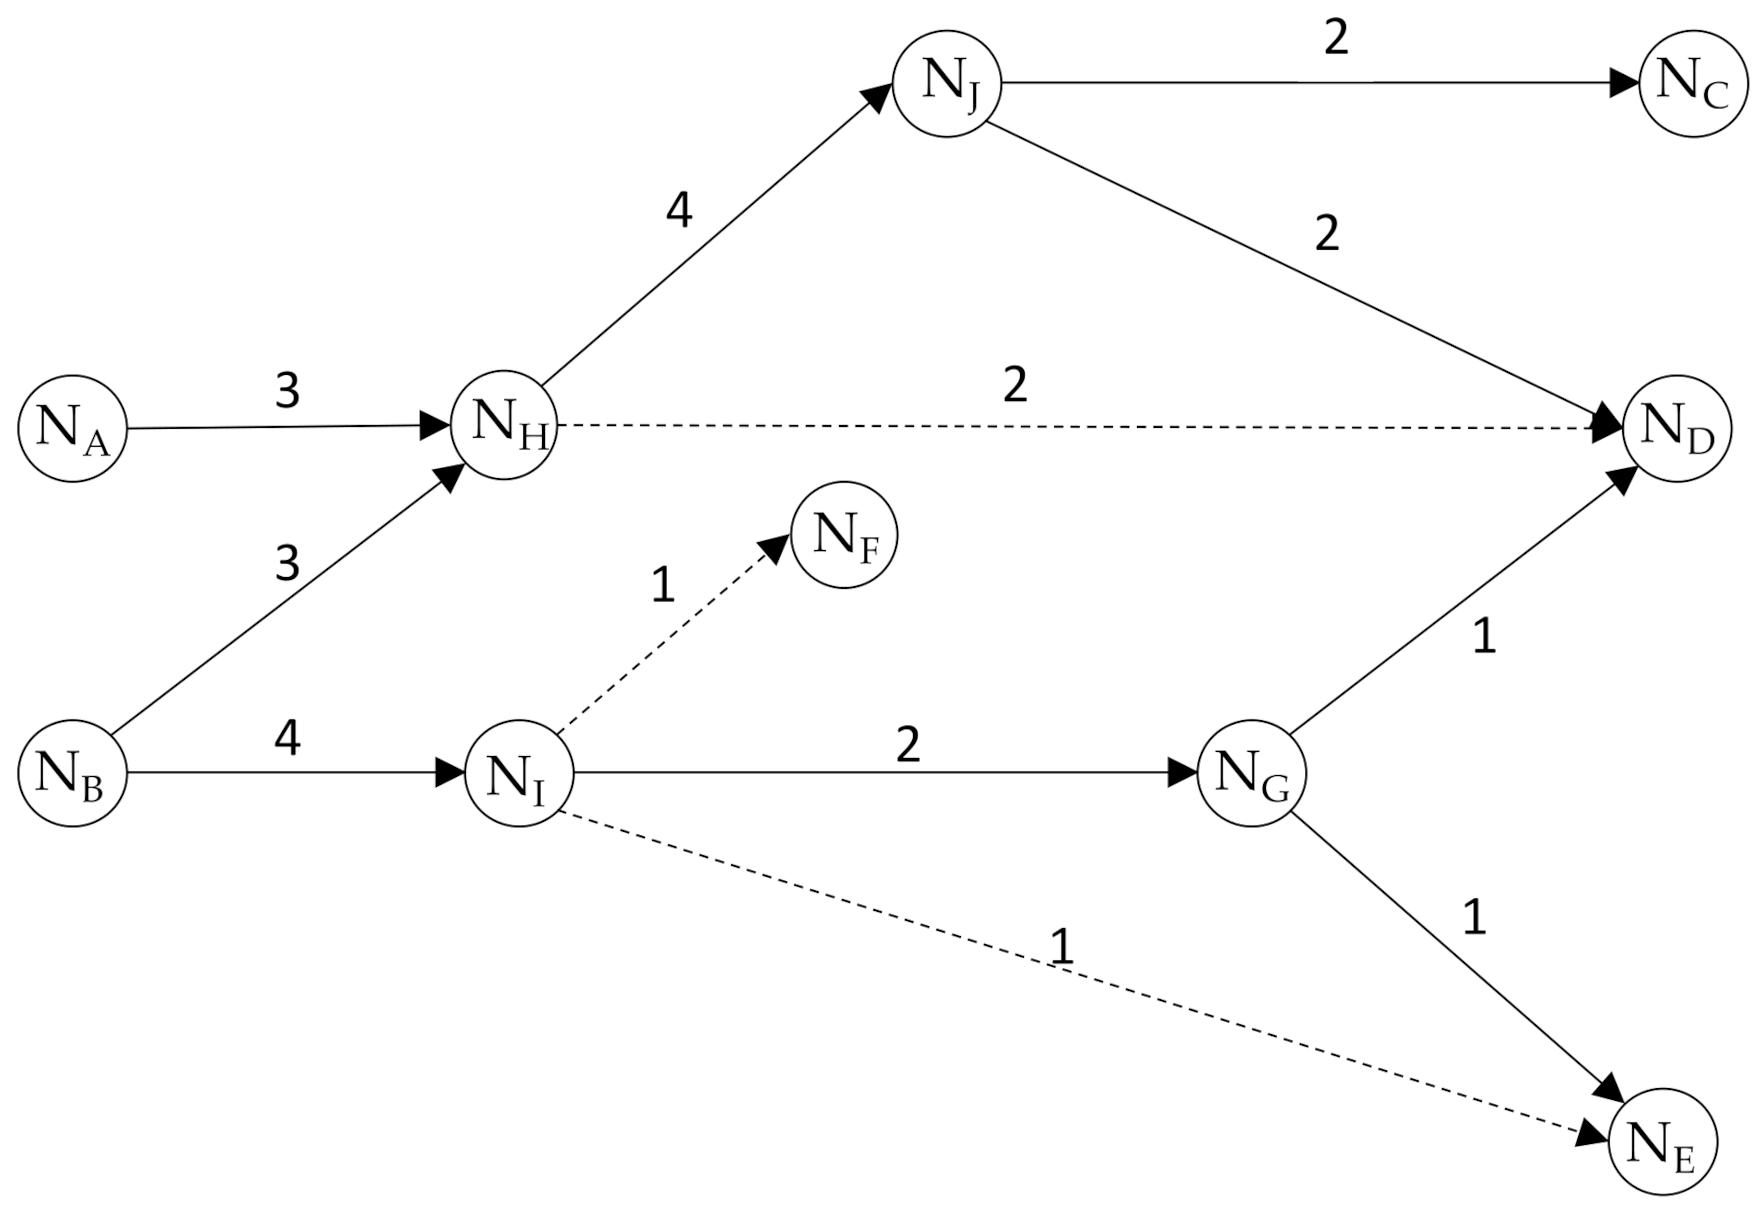
At first, a simple example from Chuang et al. [
17] (refer
Figure 2) was adopted as a case to verify the practicability of the designed novel analytic framework. In this work, an example network adapted from [
17] is introduced to demonstrate how SPCs for every citation link are derived. In a citation network, a ‘source’ node is one cited but citing no others; a ‘sink’ node is one which cites others but is not cited; an ‘intermediate’ node cites others and is also cited by others. That is, source nodes originate knowledge while sink nodes are the end points of knowledge diffusion. The sample network has two sources,
and
, and four sinks,
,
,
and
. Generally speaking, numerous paths are possible for going from a source to a sink. If every single path from both source nodes to the four sink nodes will be derived, the SPC method can be adopted. The SPC value of a link is defined as the number of every link traversed. The method assumes that the larger the SPC value is, the more important the link’s role is in transmitting the knowledge. In this example, the main path is based on the two most important links,
→
and
→
[
17].
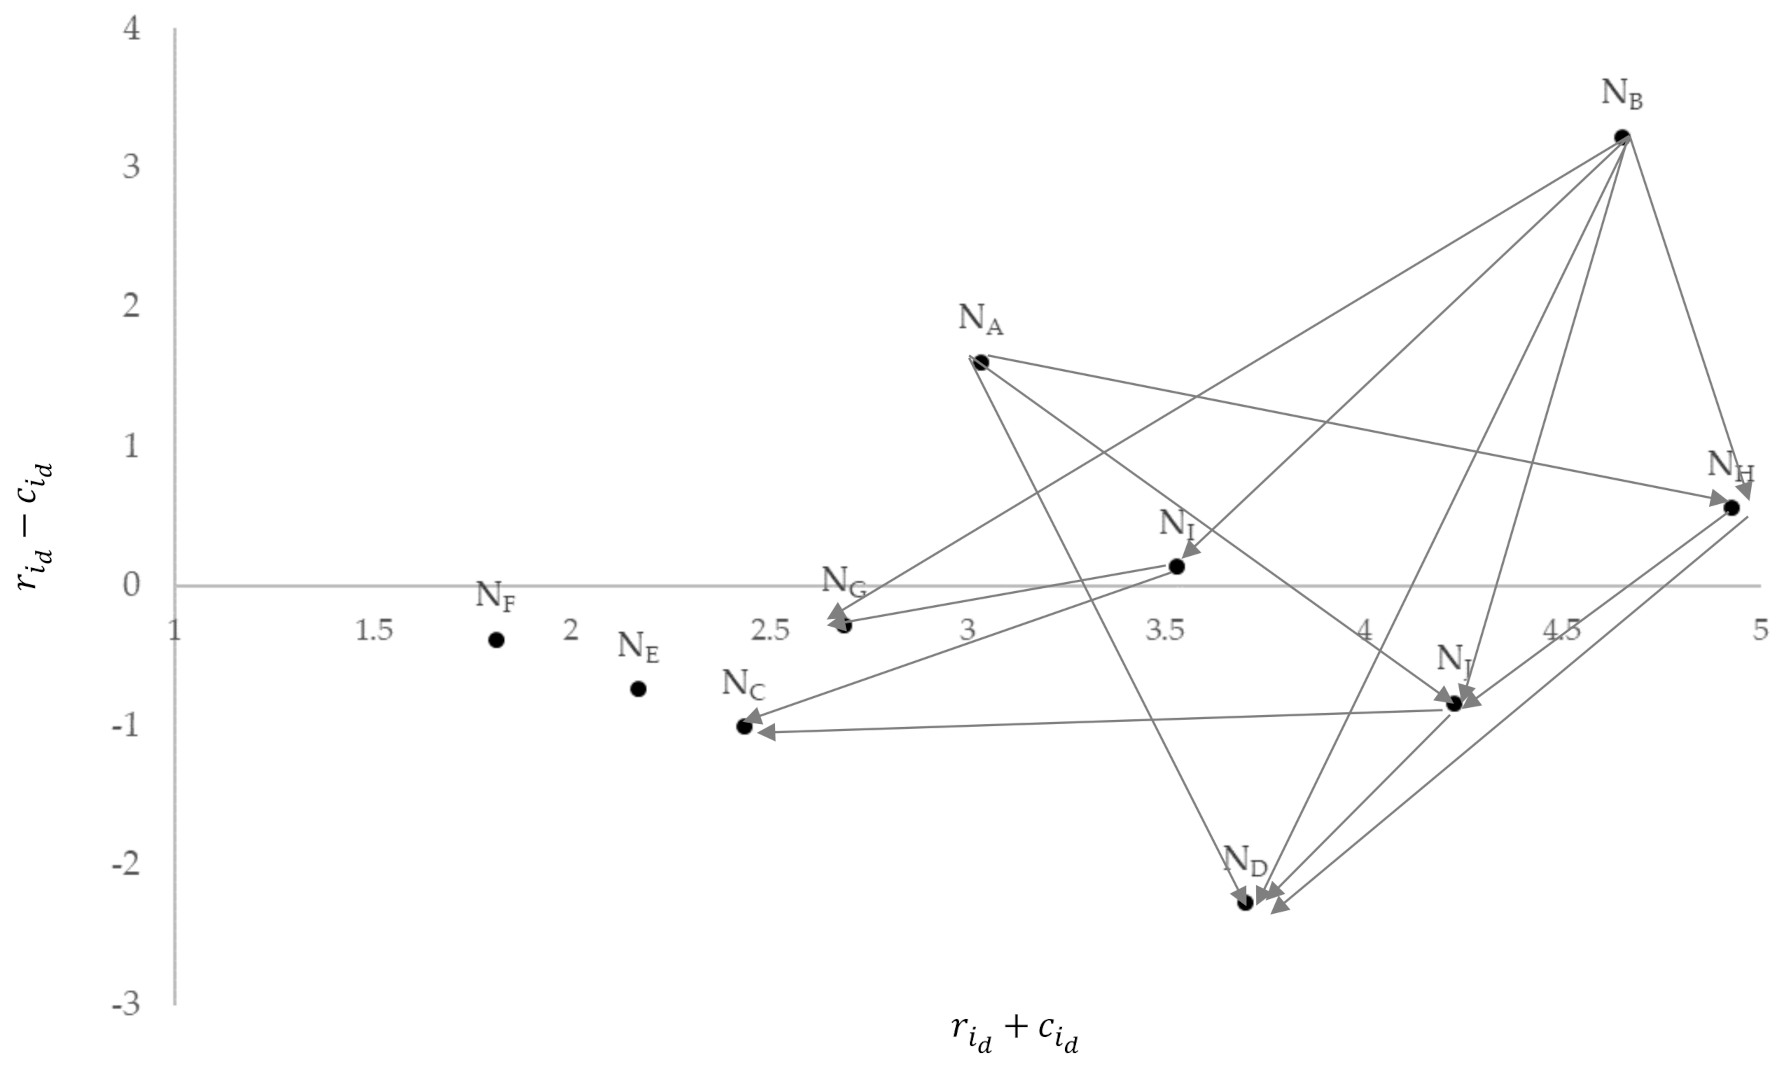
After the derivations of the SPC values associated with each linkage, the DEMATEL method will be introduced to derive the influence relationships. At first, the IDRM
is derived as follows in
Table 3. Then, the TRM can be derived as follows in
Table 4. After that, the IRM (refer
Figure 3) can be derived according to
Section 3.2. A threshold (
) is defined so that only the most significant elements in
, i.e., those elements with total relation values (
) greater than the threshold, are demonstrated. Here,
and
are the average and standard deviation values of the matrix
. The
,
, weight and rank can also be derived accordingly and demonstrated in
Table 5 according to
Section 3.3. Based on the analytic results, the
,
,
,
and
are the more important publications because the influence weights associated with these five publications are the highest. Further, the
,
and
are the more influential works that mainly influenced other journal papers.
4.2. An Empirical Study Based on Tech Mining of NWFET Patent Data
In this section, an empirical study based on the tech mining of patents of NWFET will be used to demonstrate the feasibility of the MPA based DANP. At first, two keywords, “Nanowire Field Effect Transistor” and “NWFET”, were adopted to retrieve related patents. Then, U.S. patents were retrieved from the USPTO database by using the Global Patent Search System [
74]. The database of USPTO was mined because the database is one of the most abundant patent databases in the world. The mining of U.S. patents can assure the more accurate observation of technological trends. The tech mining methods are summarized below in
Table 6.
Based on the text mining results in June 2021, 387 patents were retrieved from the database of USPTO. Including all the 387 patents and the patents cited, a total of 4118 patents can be derived. The main path of the patent citation network can be derived by utilizing the MPA methods used by the Pajek program [
65,
66]. In
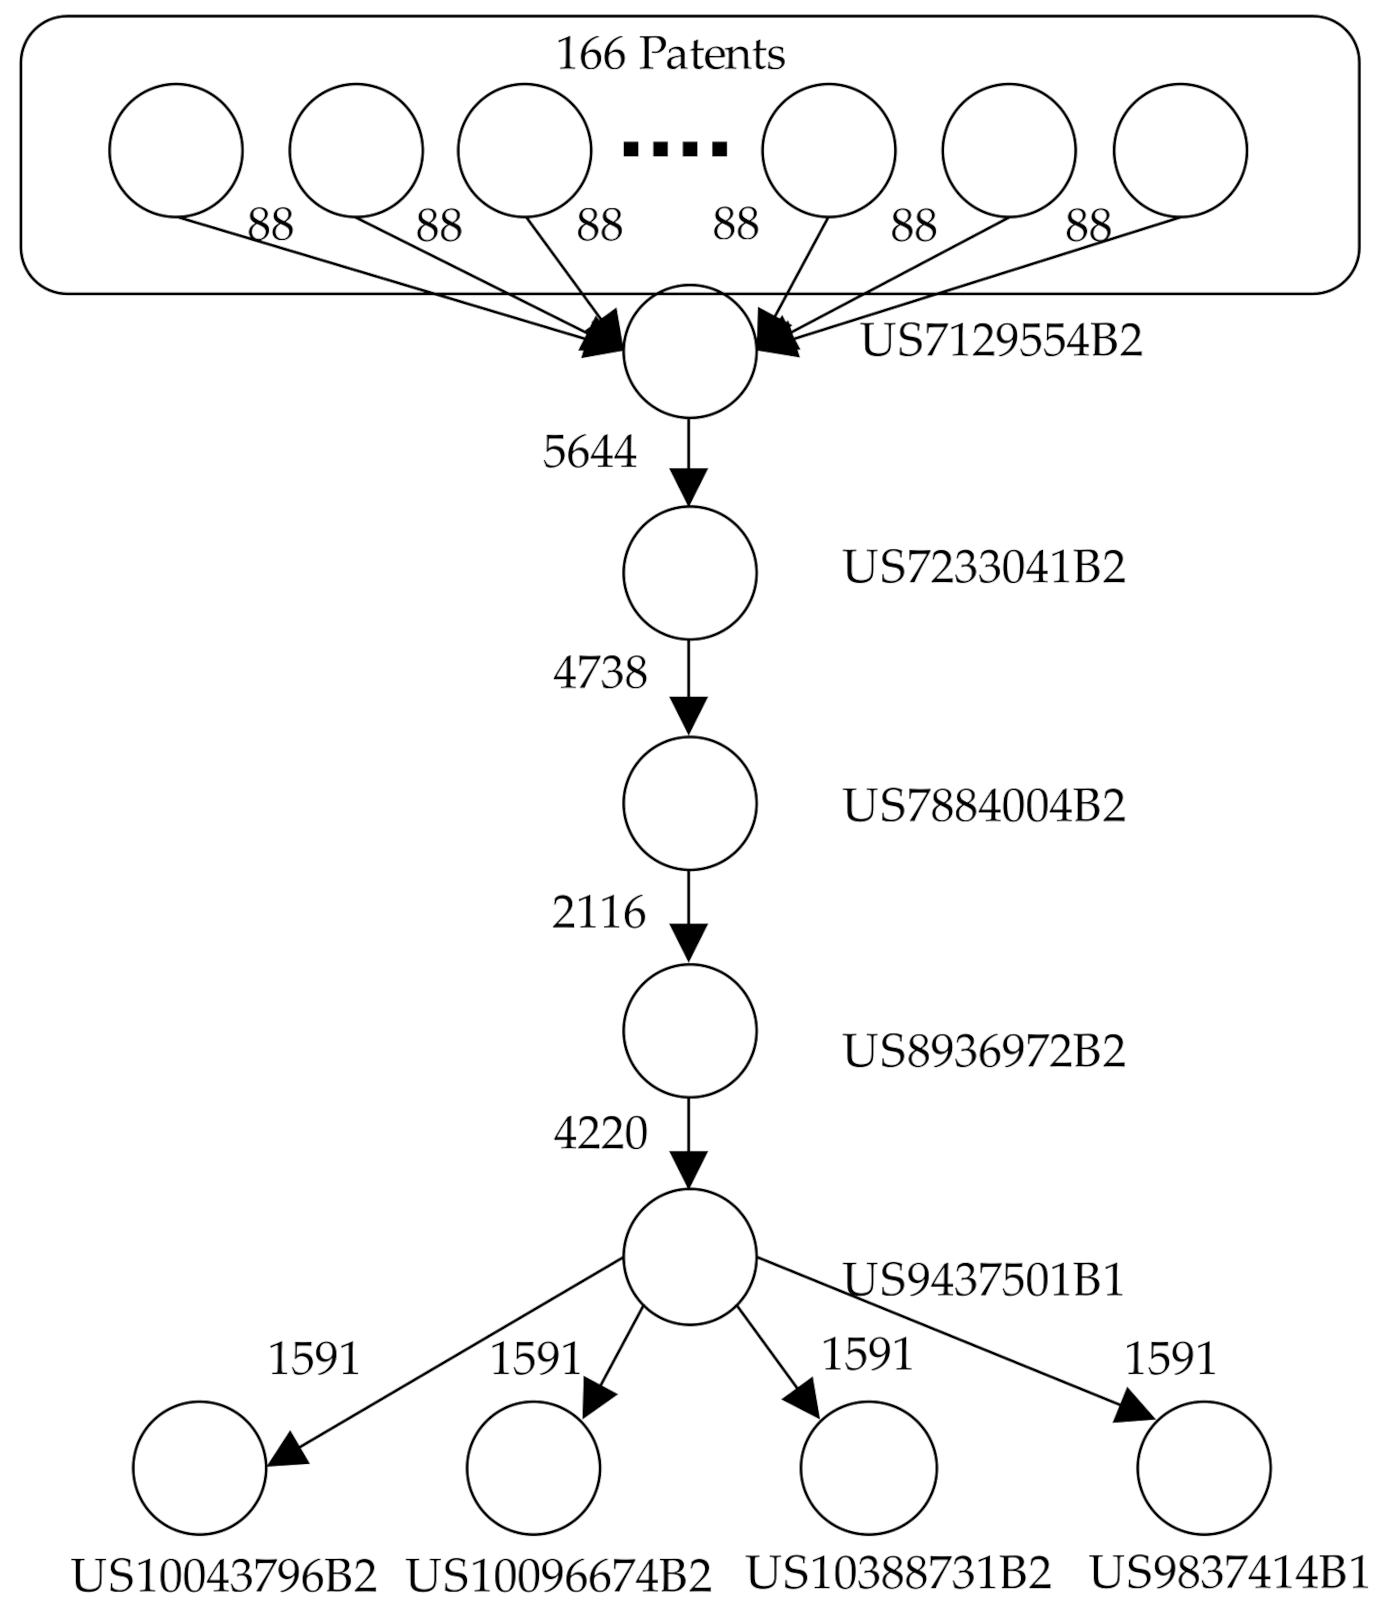
Figure 4, there are 175 patents in the main path, where 166 patents are the source nodes, 5 patents are the intermediate nodes and 4 patents are the sink nodes. The SPC values associated with the paths are summarized in
Table 7 below.
From the diagram of the main path, it is obvious that most of the patents (166 patents) are cited by the first intermediate node, US07129554B2. This patent was proposed by President and Fellows of Harvard College (U.S.) in 2006, and it is named nanosensors. The second intermediate node is US07233041B2, which was proposed by Nanosys, Inc. (U.S.) in 2007. The third intermediate node is US07884004B2, which was proposed by IBM in 2011. The fourth intermediate node is US08936972B2, which was proposed by IBM and its R&D engineers in 2015. The fifth intermediate node is US09437501B1, which was proposed by IBM and GlobalFoundries in 2016.
In addition, there are four sink nodes, which are all citing the fifth intermediate node (US09437501B1). The following description will, respectively, introduce them. The first sink node is US09837414B1, which was proposed by IBM in 2017. The second sink node was US10043796B2, which was proposed by Qualcomm in 2018. The third sink node is US10096674B2, which is proposed by IBM and GlobalFoundries in 2018. The fourth sink node is US10388731B2, which proposed by IBM and GlobalFoundries in 2019. As we can see, the third and fourth sink node share the same patent name, “Stacked nanowire device width adjustment by gas cluster ion beam (GCIB)”, and the applicants are the same firms. Yet, these patents were published in different years. The two patents share the same name because these are the results of the same technique by the same R&D team.
After the derivation of the main path, the DEMATEL will be used to derive the influence relationships among each pair of cited and citing patents. The patents cited will be placed in the rows. The patents citing other patents will be placed in the columns. First, the SPC values associated with the 175 patents included in the main path will be analyzed by DEMATEL. To fulfill this purpose, the first step is to fill the data into the matrix. The SPC values derived by the MPA will be filled into the initial data matrix
. For the global main path demonstrated in
Figure 4, the SPC value associated with each path will be transformed into the Likert’s five-point scale. The values greater than the average of the five-point scales, 158.358, will be transformed to a 5. The rest of the SPC values less than 158.358 will be transformed to a 1. For those non-existing influence relationships, for example, the influence relationship from the patent US10043796 to patent US9437501, a very small number (
) will be filled into the matrix
to assure the total influence relation matrix
and the limiting supermatrix in DANP can be derived correctly. Those influence relationships are unavailable because there is no possibility for patents granted recently (e.g., the US10043796B2 which was granted in 2016) to influence patents which have already been granted (e.g., the US9437501B1 which was granted in 2015). Furthermore, except for the 9 patents (US7129554B2, US7233041B2, US7884004B2, US8936972B2, US9437501B1, US10043796B2, US10096674B2, US10388731B2 and US9837414B1) in the lower part of
Figure 4, the other 166 patents play equal roles in the global main path. So, we just name these 166 patents as patents 10, 11, …, 175 in
Table 8. These patents can be exchanged with each other. The results of DEMATEL and DANP will be the same.
According to the evaluation scale, this complete matrix
(refer
Table 8) then is required to become the normalized matrix
. Last but not least, the normalized matrix needs to transform in order to acquire the total impact relationship matrix
(refer
Table 9). According to
(
Table 10) and the matrix
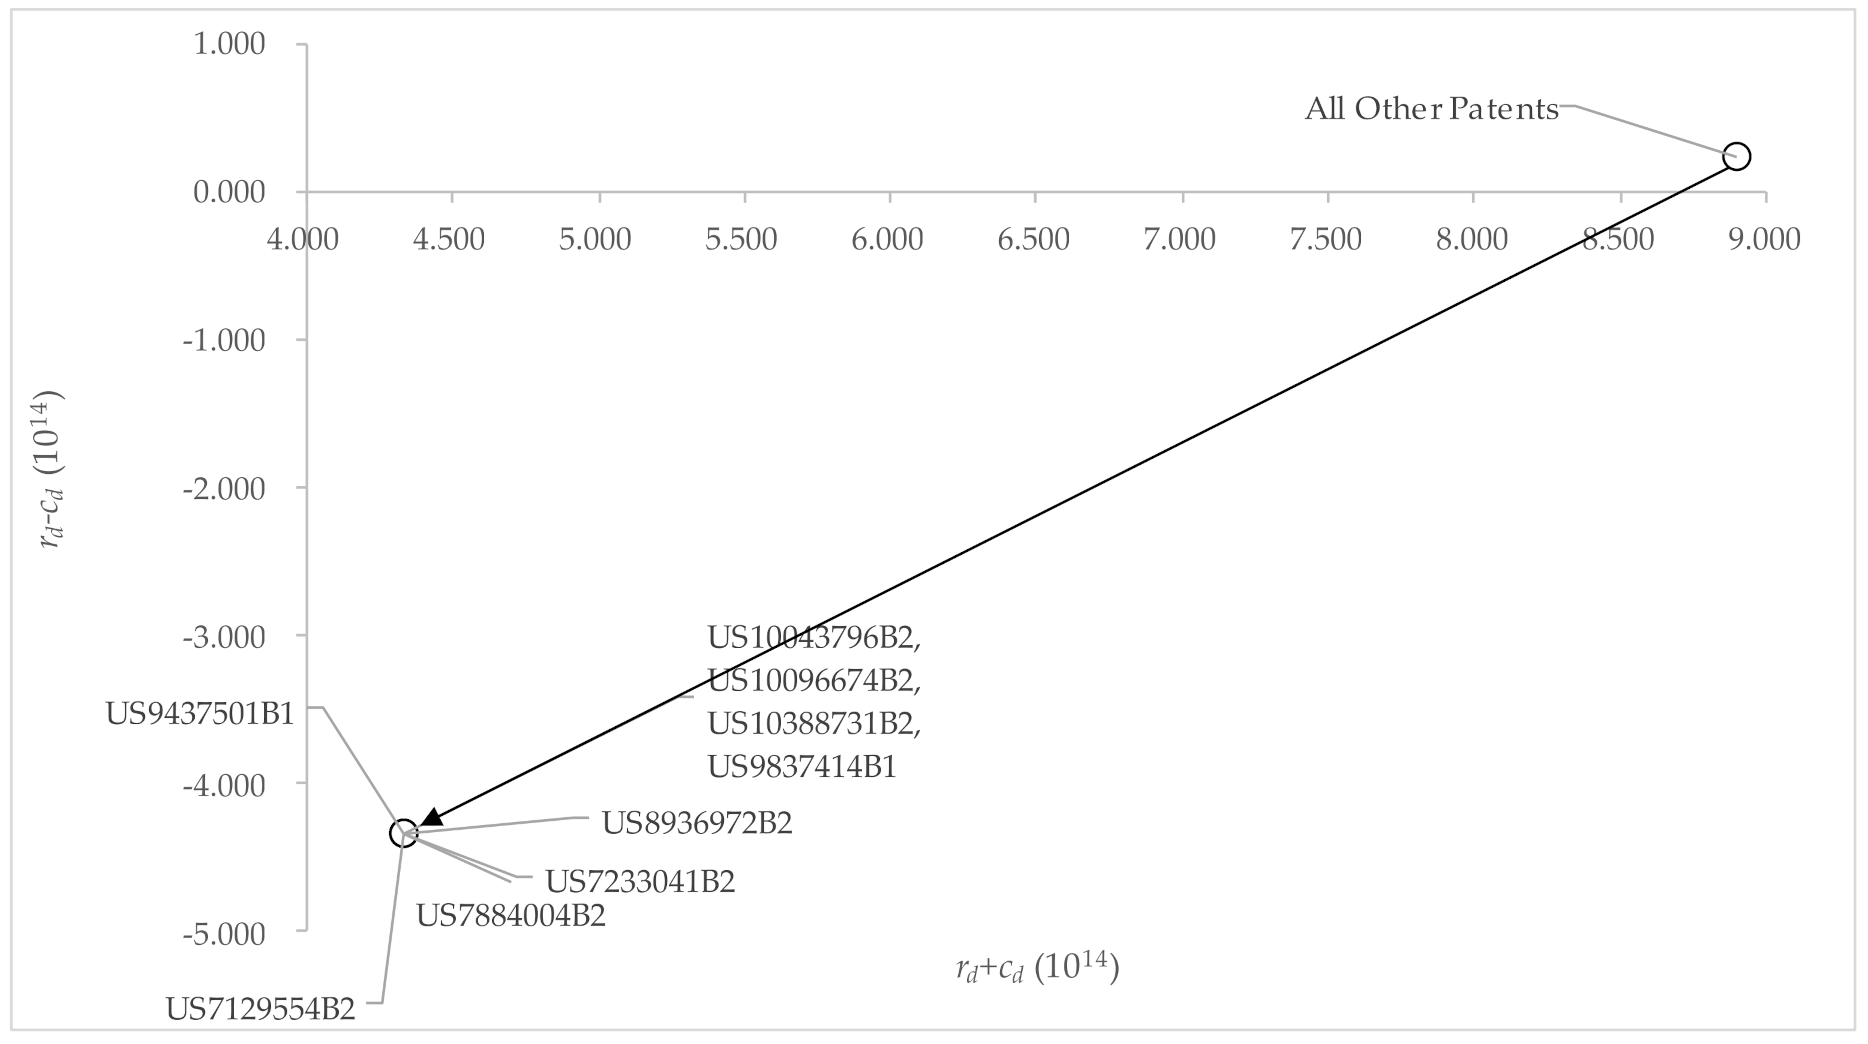
, the impact relationship map is well-constructed. The influence relationship map (IRM) diagram is constructed by the
, with the
on the vertical axis, and the
on the horizontal axis, as shown in
Figure 5.
After deriving the IRM, the weights associated with the 175 patents will be derived. To derive the weight of these 175 patents, it is first necessary to adopt
(refer
Table 9), which is derived by using the DEMATEL introduced in
Section 3.2. Then, the matrix
is transposed based on the definition of DANP. The weighted supermatrix
(refer
Table 11) can be derived accordingly. Based on the weighted supermatrix, the weight versus each patent (
) can be derived accordingly.
5. Discussion
In this Section, the managerial and practical implications of tech mining results will first be discussed. Then, advances in research methods will be discussed. Limitations and future research possibilities will be discussed in the final sub-section.
5.1. Managerial Implications
The proposed methods and the analytic results are very meaningful from the aspect of management. The important and influential patents can be grouped as a patent portfolio. For the less important or more influenced patents, those firms which play the role of followers of some specific technology can try to develop similar technology by designing around these technologies. Appropriate techniques should be selected. R&D roadmaps should be defined. For the important and influential patents, the ones belonging to the 166 “other patents” in the IRM in
Figure 5 are typical cases. The identification of most influential patents can contribute to both patent licensor and licensee. From the aspect of the licensor, the derivations of the most influential patents will be crucial for the appropriate valuation of a patent portfolio. A portfolio containing the patents in the main path and the patent with higher influences is much more valuable. Indeed, the value of a patent portfolio without important patents is less valuable. From the aspect of the licensee, since the number of patents inside the portfolio can be very large and cannot be developed in a very short period of time, licensing the whole portfolio of patents from one or some industry leaders can be feasible and very practical to fulfill the goal of time-to-market. The viewpoint is consistent with past works. For example, Schoppe and Pekar [
75] believe that a patent portfolio is an ideal starting point for firms that want to introduce new products or expand business areas. If the new product area is too far away from the company’s core business, it can license patents to non-competitors, thereby generating royalties.
The viewpoint is consistent with the earlier work by Orr [
76]. According to Orr [
76], patent aggregation, whether through practical or non-practical entities, seems to be an odd strategy at first glance; buyers often purchase or license patent portfolios without evaluating the strength of most of the single patents in the portfolio. Meanwhile, these buyers never have the intention of practicing the technology behind the patent. In particular, since it is difficult to assess the scope and validity of any specific patent claim, an aggregated patent portfolio provides a stronger patent status than the sum of its patent parts—a kind of “super patent” [
77]. As a result, practicing entities have entered a virtual “arms race” under which they seek to build a portfolio that prevents possible infringement claims by demonstrating their ability to file strong infringement counterclaims, thus encouraging potential infringement claims. The complainant cross-authorizes or resolves the dispute instead of resorting to expensive and potentially destructive litigation [
76,
78].
5.2. Practical Implicaitons—The Trajectory of NWFET Technology
From the results of
Section 4.2, there are much valuable data and information, which are worth further discussion. Firstly, we can focus on the target patent data from the 387 collected patents shrinking to 175 patents by the MPA. From
Figure 4, we can obtain the trajectory of NWFET patent technology. As there are five intermediate nodes throughout the main path, they are the key patents that provide the development trend.
The first intermediate node is US07129554B2. This patent is proposed by President and Fellows of Harvard College (US) in 2006, and it is named “nanosensors”. This patent cites 166 NWFET-related patents to form a new technique. The second intermediate node is US07233041B2, which is proposed by Nanosys, Inc. (US) in 2007. We can see that NWFET technology has gradually moved from the labs in the university to private enterprise. The third intermediate node is US07884004B2, which is proposed by IBM in 2011. From this patent, we know that it is entering the era of nano scale FET. The fourth intermediate node is US08936972B2, which is proposed by IBM and its R&D engineers in 2015. From this patent, we can say that IBM has firstly seized the opportunity of this nanowire field. The fifth intermediate node is US09437501B1, which is proposed by IBM and GlobalFoundries in 2016. Based on the five patents belonging to the intermediate nodes in the main path, the trajectory clearly demonstrates the path from the R&D of a higher-education institute (Harvard College) to development by industrial firms (IBM and GlobalFoundries).
From the discussion of the intermediate nodes mentioned above, the following discussion focuses on the 4 sink nodes of the NWFET patents that are shown in the main path diagram (refer
Figure 4). These 4 patents all cite the same patent, “US09437501B1”, which is the patent of the fifth intermediate node form the main path. Starting from the first sink node, the US09837414B1 patent was proposed by IBM in 2017.
The second sink node is US10043796B2, which is proposed by QUALCOMM in 2018. As we can see, the patent citing company has changed to Qualcomm, one of the U.S.-based leading fabless integrated circuit design houses focusing on wireless and cellular phone chips. It seems that Qualcomm has advanced the nanowire technology and may design novel devices for the next generation telecommunications chips based on the NWFET.
The third sink node is US10096674B2, which is proposed by IBM and GlobalFoundries in 2018. Global Foundries is the fourth largest semiconductor foundry manufacturer. This shows that NWFET has been considered or adopted by the semiconductor foundry providers to fabricate chips for customers, which include design houses, integrated device manufacturers and system houses.
The fourth sink node is US10388731B2, which is proposed by IBM and GlobalFoundries in 2019. As we can see, the third and fourth sink nodes share the same patent name and the applicants are the same companies, but the patents are published in different years. The patent also implies the continuous development of the NWFET by semiconductor foundry providers (i.e., IBM and Global Foundries) that may fabricate advanced integrated circuits based on the NWFET.
In general, the history of NWFET development is brief. However, the semiconductor has been adopted by fabless integrated circuit design house(s) and semiconductor foundry providers. In order to fulfill the growing needs for the efficacy of the semiconductor chip, it is important that the technology has been developed for high capacity and efficient performance. In addition, the fabrication process has been scaled to a few digits in nanometer. We can see that the fifth intermediate node that IBM developed has a great influence on the developing on the nanowire related development. According to the technology development trajectory based on the main path, the NWFET techniques have been advanced from the fundamental method for nanowire device fabrication to techniques to improve efficiency, power consumption and device shrinkage.
5.3. Advances in Research Method
Patent analytics in general and the MPA, in particular, have widely been adopted to derive the trajectory of technology development in the past. Based on the conventional methods of patent analytics, the importance associated with each patent and the influence of a specific patent on others can mainly be observed from the aspect of SPC numbers or similar indicators. Based on the authors’ limited knowledge, no scholars have tried to derive the importance of a patent from the aspect of MPA. Further, how a patent can influence others was seldom investigated. In this work, a novel MPA based MCDM analytic framework was proposed. The proposed method can derive the importance of every patent from the aspect of r + c and r–c in a decision-making problem. The influence relationships between every pair of patents and the weight versus each patent can also be derived.
The proposed analytic framework advanced the citation network analysis. The weights associated with each patent, and the influence relationships provide practitioners with a straightforward understanding of the most influential and crucial patents. Those important patents can serve as the basis for decision-making by both patent licensor and licensee. Patent aggregation and pricing strategies can be defined accordingly. Meanwhile, the influence relationships can provide a straightforward graphical demonstration of the influence relationships among the patents. Accordingly, an R&D roadmap can be defined further.
Finally, the integration of DEMATEL with MPA advanced the research method of DEMATEL. Specifically, the SPC number derived by the MPA will be filled into the initial data matrix
to change the traditional applications of DEMATEL, which neglected the time factor. In the case of feeding SPC numbers into the initial data matrix, the patent grant time should be considered. Therefore, the traditional assumption of the five-point Likert scale is not applicable for this kind of problem. The authors assumed a very small number for those non-existing influence relationships to derive the results. Based on the authors’ limited knowledge, very few or no scholars tried to do so in the past. Those publications which are time-dependent or in sequences can be seen everywhere. (For example, numerous works have been published after the proposal of DEMATEL by Gabus and Fontela [
50] in the 1970s. Those works published in 2021 cannot influence the original work by Gabus and Fontela [
50]). The integration with those time-dependent criteria also advanced the research method and introduced further possibilities of the application of a widely adopted method.
5.4. Limitations and Future Possibilities
This research has a few notable limitations. Firstly, the results were derived from the USPTO database. The United States is the leading country in semiconductor technology and the largest market of electronics products in the world. Except for trade secrets, most inventors will apply patents of semiconductor in the United States. However, there could be some technological innovations which were patented in the patent office of other economies, e.g., the European Union, China, Japan, South Korea and Taiwan. Meanwhile, for some firms, their unique and advanced technologies are not patented or published for fear that other competing firms can replicate or design around the patent(s). As a result, these advanced techniques will not be included in this research. Finally, although the main path demonstrated in the second empirical case successfully demonstrated the feasibility of the proposed analytic framework, the topology of the main path (refer
Figure 4) is really too simple to demonstrate every scenario for the possible applications of the proposed MPA based DANP framework.
Therefore, future research is needed to address these limitations. The patent databases from other countries can be mined. The main paths with more complicated topology derived by novel MPA algorithms (e.g., the global key route main path methods proposed by Liu and Lu [
16]) should be further investigated to demonstrate the feasibility of the proposed analytic framework. Further, the definitions of patent portfolio, patent aggregation and pricing strategies should be improved. Meanwhile, the influence relationships can serve as a good foundation for developing technology roadmaps further. Finally, introducing the incoming flow and outgoing flow and other indicators of social networks inside the citation network into the DEMATEL and DANP may derive different implications. However, the citation network is different from the social network. The relationships inside the social network exist concurrently, while for the citation network, the patents were applied at different time slots. Thus, the role of bridging nodes in the social network is not applicable in the patent citation network. How such relationships influence the technology development is worth further investigation.
From the aspect of graph theory and visualization, several possibilities can be explored in the future. First, the concepts of fuzzy graph can be introduced. Zadeh [
6] mentioned that specific application problems in the real world could include imprecise description or fuzziness; therefore, fuzzy set is appropriate for resolving these issues [
79]. The development of fuzzy set theory has advanced the concept of fuzzy graph [
79,
80]. New algorithms can be developed for deriving the fuzzy MPA. Meanwhile, the fusion of the fuzzy main path with fuzzy MCDM methods such as fuzzy DEMATEL and fuzzy DANP will be very reasonable since very few or no scholar have tried to explore the uncertainties associated with patent mining results. However, the aspect is very important because nobody can ensure their patent mining results can cover every patent related to some specific technological innovation, e.g., the NWFETs. Thus, the introduction of fuzzy MCDM and fuzzy graph theory will bring new lights for patent analytics in the future.
Finally, from the aspect of visualization, a citation network which consists of a large number of patents or publications cannot be visualized easily. Appropriate strategies to filter less important paths and/or nodes and leave the most dominant ones or partition the graph (e.g., [
81]) will be very helpful for clearly demonstrating the citations. Moreover, choosing dense-areas which pass specific threshold-value of connectedness will also be feasible. 3D illustrations can be another alternative [
82] to help better demonstrate the citation network. Finally, novel visualization models (e.g., the causality technique being proposed by Nazarov [
83]) will bring new directions for visualization of the analytic results.
6. Conclusions
In general, tech mining and the mining of patents have already played a dominant role in exploring databases related to the emergence of new technology. MPA based methods have already been adopted widely by scholars and brought meaningful insights into the technological innovations. However, the MPA based methods were seldom adopted by practitioners. In this work, a novel DANP based on the MPA can cross the research gap and bring new insights. At first, the most important and influential patents can be derived based on the proposed analytic framework. The identifications of those patents are crucial, whether from the aspects of licensors or licensees. The retrieved patents can be adopted as the portfolio, and the derived portfolio can serve as the basis for the licensors’ pricing strategy definitions. The more important the patents are, the higher the prices can be. For the licensee, evaluating the most important patents can serve as the basis for patent aggregation and designing-around methods. The derivations of weights associated with the patents and the influence relationships can serve as the basis for patent aggregations in the future.
Based on the empirical case study results, the patents, which include US10043796, US10096674, US10388731, US9837414, US9437501, US8936972, US7884004, US7233041 and US7129554, are the U.S. patents on the recently developed NWFETs. The trajectory clearly demonstrates the path from the R&D of a higher education institute to development by industrial firms, including the semiconductor foundry and fabless design house. Even though those patents boast the highest SPC values, they are less influential. Appropriate design around strategies will be critical for semiconductor companies in the related field. R&D plans and technology roadmaps can be defined accordingly.
In general, the proposed analytic framework advances the research of both MPA and the MCDM. The framework can be adopted by research institutes and high technology firms. Patent aggregation, designing around and R&D strategies can be defined accordingly. In the future, new algorithms can be developed for deriving the fuzzy MPA. Meanwhile, integration frameworks of the fuzzy MPA with fuzzy MCDM methods can be proposed. These novel frameworks can resolve the uncertainties associated with patent mining results. Novel techniques can be introduced to visualize the very complicated patent citation network, which contains thousands of nodes. Moreover, the patent selection and technology roadmapping techniques can be integrated and applied in resolving real world management problems. The proposed framework can also be adopted by researchers and practitioners, whether they are in the field of technology management, semiconductor engineering or another field of emerging technology.


