
Fuzzy Ensemble of Multi-Criteria Decision Making Methods for Heating Energy Transition in Danish Households


Abstract
:1. Introduction
1.1. Motivation
1.2. Novelties
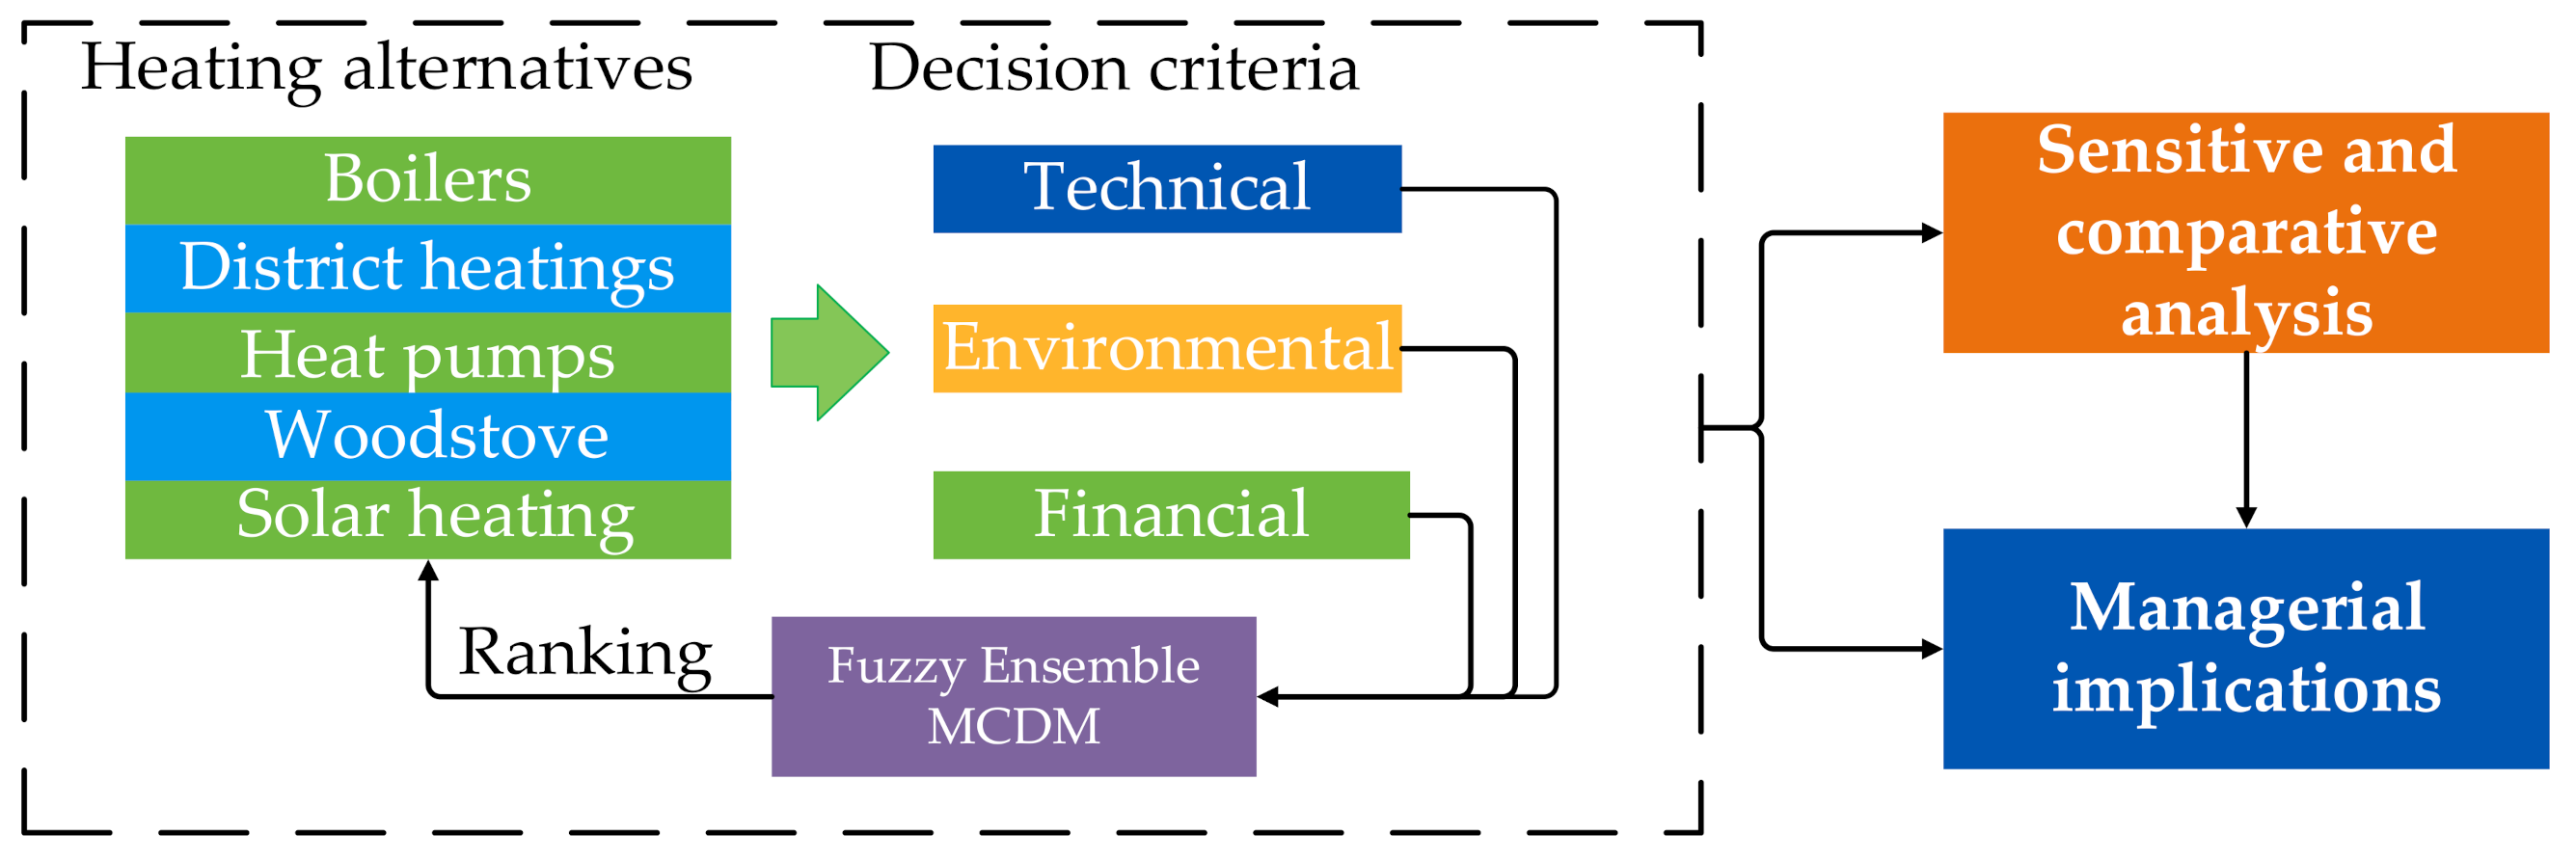
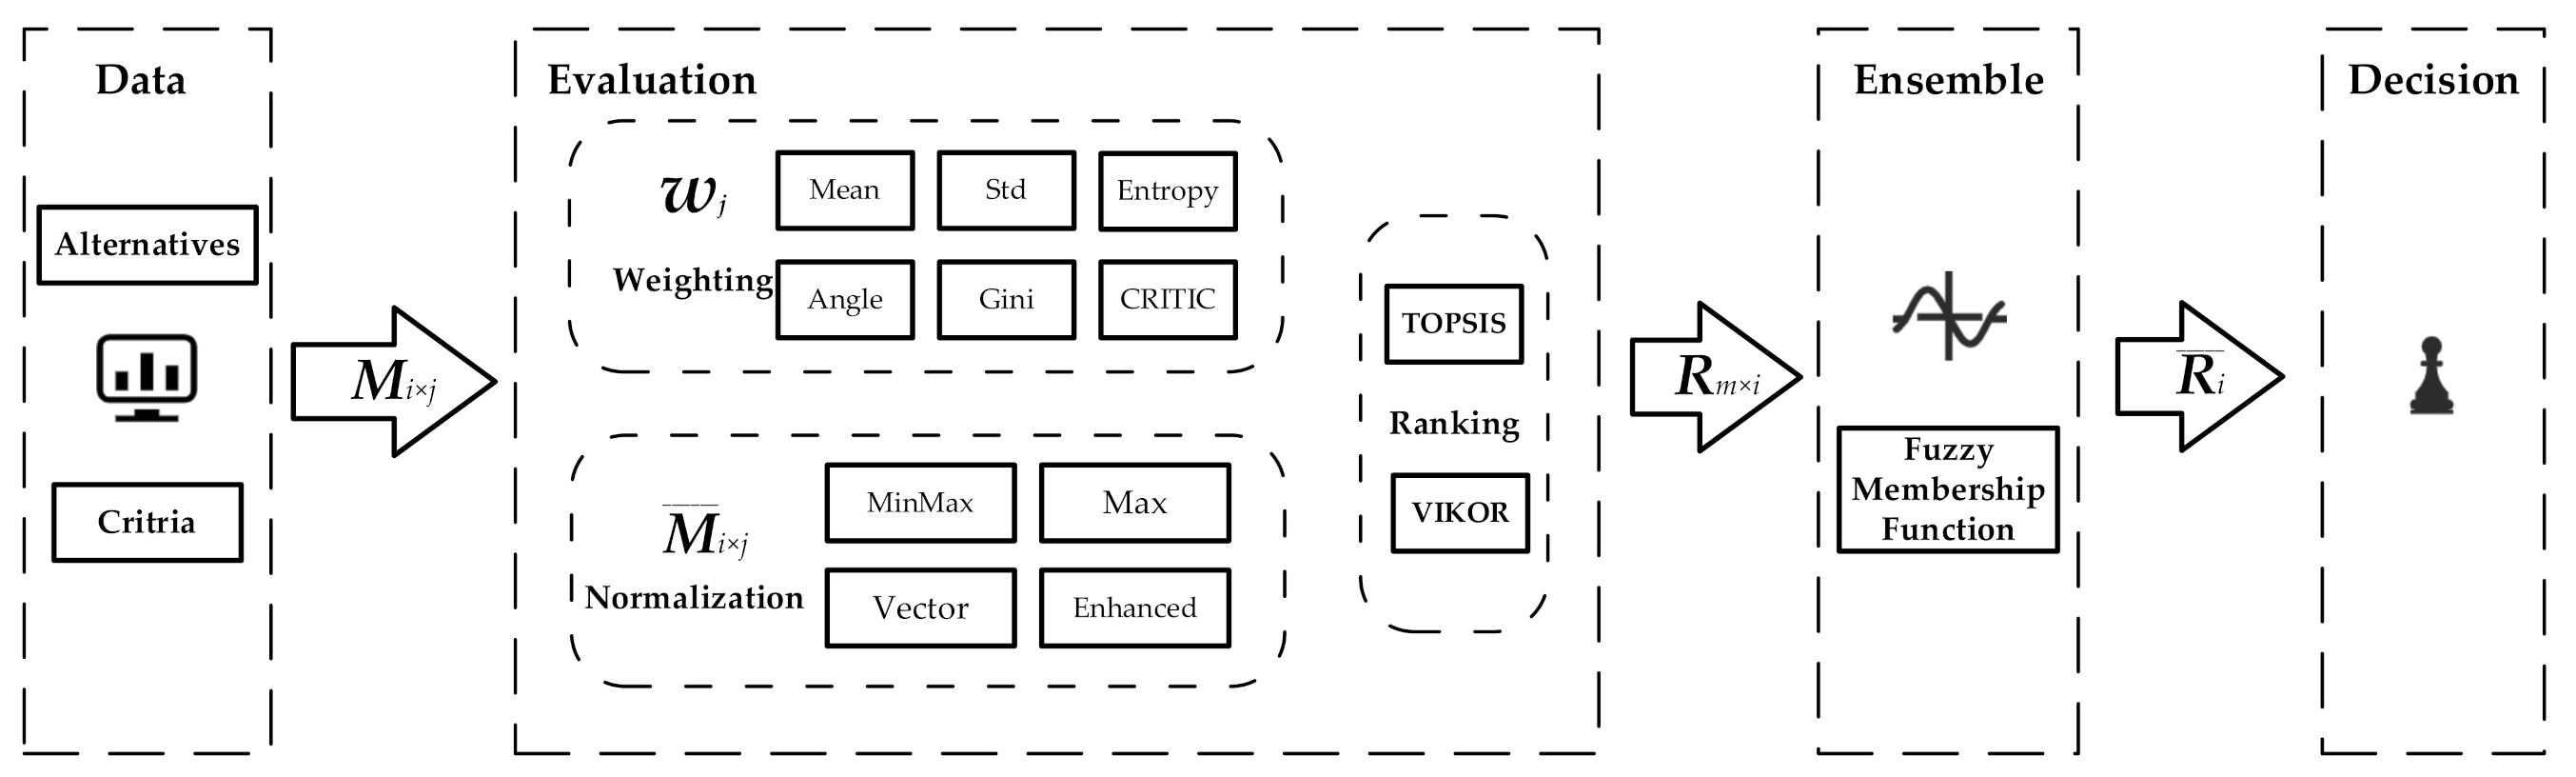
2. Methods
2.1. Multi-Criteria Decision Making
2.2. Ensemble
2.3. Pseudocode
| Algorithm 1 Pseudocode for the proposed fuzzy ensemble MCDM approach | |
| 1: | m ← 0, r ← a vector filled with 0 |
| 2: | for each f ∈ F = {Mean, Entropy, Std, CRITIC, Angle, Gini} |
| 3: | do w(f) ←) |
| 4: | for each g ∈ G = {MinMax, Max, Vector, Enhanced} |
| 5: | do M(g) ←) |
| 6: | for each h ∈ H = {TOPSIS, VIKOR} |
| 7: | do V(f,g,h) ← h(w(f),M(g)) |
| 8: | m++ |
| 9: | R(m) ← rank(V(f,g,h)) |
| 10: | while m ≠ 0 |
| 11: | do Rf (m) ← fuzzy(R(m)) |
| 12: | m-- |
| 13: | r = r + Rf(m) |
| 14: | ← rank(r) |
3. Empirical Results
3.1. Alternatives
3.1.1. Boilers
3.1.2. District Heating
3.1.3. Heat Pumps
3.1.4. Woodstove
3.1.5. Solar Heating
3.2. Criteria
3.3. Empirical Data
3.4. Weighting and Normalization Matrices
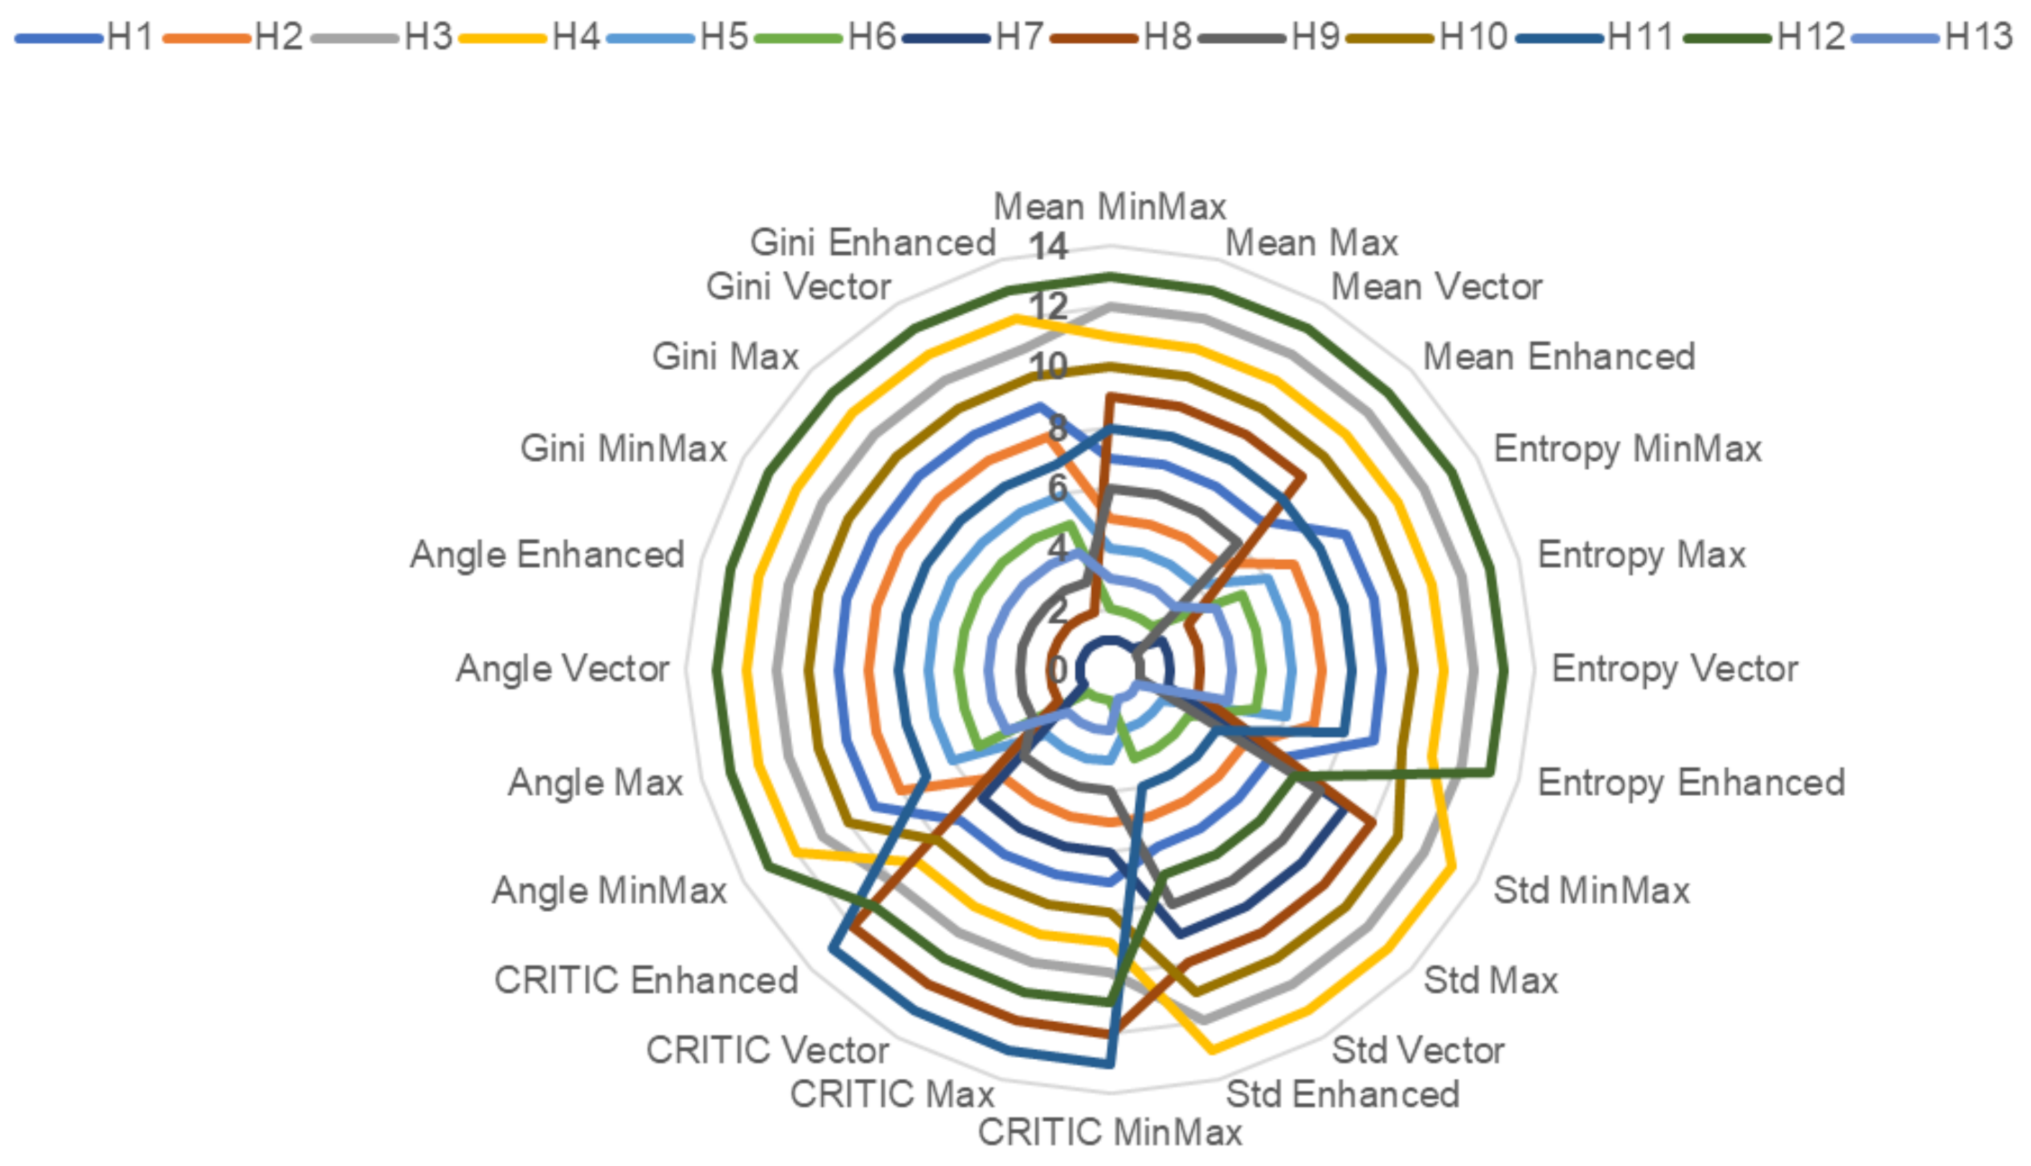
3.5. MCDM Ranking Results and Analysis
Sensitive Analysis to v in VIKOR
3.6. Ensemble Results
3.6.1. Sensitive Analysis with or without High Variance Weight
3.6.2. Sensitive Analysis to the Fuzzy Ensemble Method
4. Discussion
4.1. Comparative Analysis
4.2. Managerial Implications
5. Conclusions
Author Contributions
Funding
Institutional Review Board Statement
Informed Consent Statement
Data Availability Statement
Acknowledgments
Conflicts of Interest
Appendix A

| Minmax | H1 | H2 | H3 | H4 | H5 | H6 | H7 | H8 | H9 | H10 | H11 | H12 | H13 |
|---|---|---|---|---|---|---|---|---|---|---|---|---|---|
| T1 | 0.0000 | 0.0000 | 0.0000 | 0.0000 | 0.0000 | 0.0000 | 0.0000 | 0.0000 | 0.0000 | 0.0000 | 0.7778 | 0.7778 | 1.0000 |
| T2 | 0.0000 | 0.0000 | 0.0000 | 0.0000 | 0.0000 | 0.0000 | 0.0000 | 0.0000 | 0.0000 | 0.0000 | 1.0000 | 1.0000 | 0.3000 |
| T3 | 0.8511 | 0.8298 | 0.8723 | 0.8723 | 0.8298 | 0.8298 | 0.3617 | 0.4043 | 0.2979 | 0.5745 | 0.0000 | 0.8936 | 1.0000 |
| T4 | 0.3846 | 0.3846 | 0.3846 | 0.3846 | 0.0000 | 0.0000 | 0.6923 | 1.0000 | 0.3846 | 0.5385 | 1.0000 | 0.3846 | 0.0000 |
| T5 | 0.0000 | 0.0000 | 0.3333 | 1.0000 | 0.0000 | 0.0000 | 0.0000 | 0.0000 | 0.0000 | 0.0000 | 0.0000 | 0.8333 | 0.0000 |
| T6 | 0.4048 | 0.4048 | 0.4048 | 0.4048 | 0.0000 | 0.0000 | 0.6429 | 1.0000 | 0.4048 | 0.5952 | 0.9286 | 0.5714 | 0.0000 |
| E1 | 0.2680 | 0.0160 | 1.0000 | 1.0000 | 0.0280 | 0.0280 | 0.3720 | 0.3920 | 0.3400 | 0.4400 | 0.2440 | 1.0000 | 0.0000 |
| E2 | 0.1736 | 0.0035 | 0.4861 | 0.4861 | 0.0035 | 0.0035 | 0.0104 | 0.0104 | 0.0069 | 0.0104 | 0.0069 | 1.0000 | 0.0000 |
| E3 | 0.5778 | 0.2267 | 0.7778 | 0.7778 | 0.0522 | 0.0522 | 0.2100 | 0.2200 | 0.1911 | 0.2667 | 0.1367 | 1.0000 | 0.0000 |
| E4 | 0.0000 | 0.0080 | 0.0160 | 0.0160 | 0.0016 | 0.0016 | 0.0008 | 0.0008 | 0.0008 | 0.0016 | 0.0008 | 1.0000 | 0.0000 |
| E5 | 0.0000 | 0.1333 | 0.5333 | 0.5333 | 0.0667 | 0.0667 | 0.8400 | 0.8933 | 0.7733 | 1.0000 | 0.5467 | 0.5333 | 0.0000 |
| E6 | 1.0000 | 0.6680 | 0.0000 | 0.0000 | 0.0351 | 0.0351 | 0.1552 | 0.1619 | 0.1417 | 0.1808 | 0.0999 | 0.0000 | 0.0000 |
| F1 | 0.5410 | 0.2787 | 0.4590 | 0.5738 | 0.0492 | 0.0000 | 0.9672 | 0.5902 | 1.0000 | 0.9344 | 0.0328 | 0.1803 | 0.3115 |
| F2 | 0.1268 | 0.1127 | 0.0986 | 0.2113 | 0.0986 | 0.0986 | 0.5070 | 0.5070 | 1.0000 | 0.5915 | 0.0141 | 0.0000 | 0.1127 |
| F3 | 0.0000 | 0.3333 | 1.0000 | 0.0000 | 0.5000 | 0.5000 | 0.0000 | 0.0000 | 0.0000 | 0.3333 | 0.0000 | 0.2667 | 0.0000 |
| F4 | 0.5843 | 0.5843 | 1.0000 | 0.8313 | 0.5000 | 0.1687 | 0.0000 | 0.0000 | 0.0000 | 0.0000 | 0.0000 | 0.0000 | 0.2108 |
| F5 | 0.3584 | 0.3767 | 0.8361 | 1.0000 | 0.0000 | 0.0214 | 0.7153 | 0.8416 | 0.6523 | 0.8837 | 0.2941 | 0.2803 | 0.0293 |
| F6 | 0.5364 | 0.3985 | 0.5441 | 0.5441 | 1.0000 | 1.0000 | 0.9962 | 0.9962 | 0.9962 | 0.9962 | 0.9962 | 0.2874 | 0.0000 |
| F7 | 1.0000 | 1.0000 | 1.0000 | 1.0000 | 1.0000 | 1.0000 | 0.1860 | 0.3488 | 0.0000 | 1.0000 | 1.0000 | 1.0000 | 1.0000 |
| Max | H1 | H2 | H3 | H4 | H5 | H6 | H7 | H8 | H9 | H10 | H11 | H12 | H13 |
|---|---|---|---|---|---|---|---|---|---|---|---|---|---|
| T1 | 0.0000 | 0.0000 | 0.0000 | 0.0000 | 0.0000 | 0.0000 | 0.0000 | 0.0000 | 0.0000 | 0.0000 | 0.7000 | 0.7000 | 0.9000 |
| T2 | 0.0000 | 0.0000 | 0.0000 | 0.0000 | 0.0000 | 0.0000 | 0.0000 | 0.0000 | 0.0000 | 0.0000 | 1.0000 | 1.0000 | 0.3000 |
| T3 | 0.8163 | 0.7959 | 0.8367 | 0.8367 | 0.7959 | 0.7959 | 0.3469 | 0.3878 | 0.2857 | 0.5510 | 0.0000 | 0.8571 | 0.9592 |
| T4 | 0.2000 | 0.2000 | 0.2000 | 0.2000 | 0.0000 | 0.0000 | 0.3600 | 0.5200 | 0.2000 | 0.2800 | 0.5200 | 0.2000 | 0.0000 |
| T5 | 0.0000 | 0.0000 | 0.3333 | 1.0000 | 0.0000 | 0.0000 | 0.0000 | 0.0000 | 0.0000 | 0.0000 | 0.0000 | 0.8333 | 0.0000 |
| T6 | 0.6269 | 0.6269 | 0.6269 | 0.6269 | 0.3731 | 0.3731 | 0.7761 | 1.0000 | 0.6269 | 0.7463 | 0.9552 | 0.7313 | 0.3731 |
| E1 | 0.2680 | 0.0160 | 1.0000 | 1.0000 | 0.0280 | 0.0280 | 0.3720 | 0.3920 | 0.3400 | 0.4400 | 0.2440 | 1.0000 | 0.0000 |
| E2 | 0.1736 | 0.0035 | 0.4861 | 0.4861 | 0.0035 | 0.0035 | 0.0104 | 0.0104 | 0.0069 | 0.0104 | 0.0069 | 1.0000 | 0.0000 |
| E3 | 0.5778 | 0.2267 | 0.7778 | 0.7778 | 0.0522 | 0.0522 | 0.2100 | 0.2200 | 0.1911 | 0.2667 | 0.1367 | 1.0000 | 0.0000 |
| E4 | 0.0000 | 0.0080 | 0.0160 | 0.0160 | 0.0016 | 0.0016 | 0.0008 | 0.0008 | 0.0008 | 0.0016 | 0.0008 | 1.0000 | 0.0000 |
| E5 | 0.0000 | 0.1333 | 0.5333 | 0.5333 | 0.0667 | 0.0667 | 0.8400 | 0.8933 | 0.7733 | 1.0000 | 0.5467 | 0.5333 | 0.0000 |
| E6 | 1.0000 | 0.6680 | 0.0000 | 0.0000 | 0.0351 | 0.0351 | 0.1552 | 0.1619 | 0.1417 | 0.1808 | 0.0999 | 0.0000 | 0.0000 |
| F1 | 0.6056 | 0.3803 | 0.5352 | 0.6338 | 0.1831 | 0.1408 | 0.9718 | 0.6479 | 1.0000 | 0.9437 | 0.1690 | 0.2958 | 0.4085 |
| F2 | 0.1733 | 0.1600 | 0.1467 | 0.2533 | 0.1467 | 0.1467 | 0.5333 | 0.5333 | 1.0000 | 0.6133 | 0.0667 | 0.0533 | 0.1600 |
| F3 | 0.0000 | 0.3333 | 1.0000 | 0.0000 | 0.5000 | 0.5000 | 0.0000 | 0.0000 | 0.0000 | 0.3333 | 0.0000 | 0.2667 | 0.0000 |
| F4 | 0.5843 | 0.5843 | 1.0000 | 0.8313 | 0.5000 | 0.1687 | 0.0000 | 0.0000 | 0.0000 | 0.0000 | 0.0000 | 0.0000 | 0.2108 |
| F5 | 0.4161 | 0.4328 | 0.8508 | 1.0000 | 0.0899 | 0.1094 | 0.7409 | 0.8558 | 0.6836 | 0.8941 | 0.3576 | 0.3450 | 0.1166 |
| F6 | 0.5364 | 0.3985 | 0.5441 | 0.5441 | 1.0000 | 1.0000 | 0.9962 | 0.9962 | 0.9962 | 0.9962 | 0.9962 | 0.2874 | 0.0000 |
| F7 | 1.0000 | 1.0000 | 1.0000 | 1.0000 | 1.0000 | 1.0000 | 0.1860 | 0.3488 | 0.0000 | 1.0000 | 1.0000 | 1.0000 | 1.0000 |
| Vector | H1 | H2 | H3 | H4 | H5 | H6 | H7 | H8 | H9 | H10 | H11 | H12 | H13 |
|---|---|---|---|---|---|---|---|---|---|---|---|---|---|
| T1 | 0.6867 | 0.6867 | 0.6867 | 0.6867 | 0.6867 | 0.6867 | 0.6867 | 0.6867 | 0.6867 | 0.6867 | 0.9060 | 0.9060 | 0.9687 |
| T2 | 0.6912 | 0.6912 | 0.6912 | 0.6912 | 0.6912 | 0.6912 | 0.6912 | 0.6912 | 0.6912 | 0.6912 | 1.0000 | 1.0000 | 0.7839 |
| T3 | 0.8892 | 0.8769 | 0.9015 | 0.9015 | 0.8769 | 0.8769 | 0.6060 | 0.6306 | 0.5690 | 0.7291 | 0.3967 | 0.9138 | 0.9754 |
| T4 | 0.7211 | 0.7211 | 0.7211 | 0.7211 | 0.6514 | 0.6514 | 0.7769 | 0.8327 | 0.7211 | 0.7490 | 0.8327 | 0.7211 | 0.6514 |
| T5 | 0.0000 | 0.0000 | 0.2481 | 0.7442 | 0.0000 | 0.0000 | 0.0000 | 0.0000 | 0.0000 | 0.0000 | 0.0000 | 0.6202 | 0.0000 |
| T6 | 0.2561 | 0.2561 | 0.2561 | 0.2561 | 0.1525 | 0.1525 | 0.3171 | 0.4086 | 0.2561 | 0.3049 | 0.3903 | 0.2988 | 0.1525 |
| E1 | 0.1387 | 0.0083 | 0.5175 | 0.5175 | 0.0145 | 0.0145 | 0.1925 | 0.2028 | 0.1759 | 0.2277 | 0.1263 | 0.5175 | 0.0000 |
| E2 | 0.1416 | 0.0028 | 0.3965 | 0.3965 | 0.0028 | 0.0028 | 0.0085 | 0.0085 | 0.0057 | 0.0085 | 0.0057 | 0.8156 | 0.0000 |
| E3 | 0.3441 | 0.1350 | 0.4632 | 0.4632 | 0.0311 | 0.0311 | 0.1251 | 0.1310 | 0.1138 | 0.1588 | 0.0814 | 0.5956 | 0.0000 |
| E4 | 0.0000 | 0.0080 | 0.0160 | 0.0160 | 0.0016 | 0.0016 | 0.0008 | 0.0008 | 0.0008 | 0.0016 | 0.0008 | 0.9997 | 0.0000 |
| E5 | 0.0000 | 0.0644 | 0.2578 | 0.2578 | 0.0322 | 0.0322 | 0.4060 | 0.4318 | 0.3738 | 0.4833 | 0.2642 | 0.2578 | 0.0000 |
| E6 | 0.8002 | 0.5345 | 0.0000 | 0.0000 | 0.0281 | 0.0281 | 0.1242 | 0.1296 | 0.1134 | 0.1447 | 0.0799 | 0.0000 | 0.0000 |
| F1 | 0.2767 | 0.1737 | 0.2445 | 0.2896 | 0.0837 | 0.0644 | 0.4440 | 0.2960 | 0.4569 | 0.4311 | 0.0772 | 0.1351 | 0.1866 |
| F2 | 0.1179 | 0.1088 | 0.0997 | 0.1723 | 0.0997 | 0.0997 | 0.3627 | 0.3627 | 0.6801 | 0.4171 | 0.0453 | 0.0363 | 0.1088 |
| F3 | 0.0000 | 0.2489 | 0.7467 | 0.0000 | 0.3734 | 0.3734 | 0.0000 | 0.0000 | 0.0000 | 0.2489 | 0.0000 | 0.1991 | 0.0000 |
| F4 | 0.3558 | 0.3558 | 0.6089 | 0.5062 | 0.3045 | 0.1027 | 0.0000 | 0.0000 | 0.0000 | 0.0000 | 0.0000 | 0.0000 | 0.1284 |
| F5 | 0.1877 | 0.1953 | 0.3839 | 0.4512 | 0.0406 | 0.0494 | 0.3343 | 0.3861 | 0.3084 | 0.4034 | 0.1613 | 0.1556 | 0.0526 |
| F6 | 0.1887 | 0.1402 | 0.1914 | 0.1914 | 0.3517 | 0.3517 | 0.3504 | 0.3504 | 0.3504 | 0.3504 | 0.3504 | 0.1011 | 0.0000 |
| F7 | 1.0000 | 1.0000 | 1.0000 | 1.0000 | 1.0000 | 1.0000 | 0.4365 | 0.5492 | 0.3077 | 1.0000 | 1.0000 | 1.0000 | 1.0000 |
| Enhanced | H1 | H2 | H3 | H4 | H5 | H6 | H7 | H8 | H9 | H10 | H11 | H12 | H13 |
|---|---|---|---|---|---|---|---|---|---|---|---|---|---|
| T1 | 0.9043 | 0.9043 | 0.9043 | 0.9043 | 0.9043 | 0.9043 | 0.9043 | 0.9043 | 0.9043 | 0.9043 | 0.9787 | 0.9787 | 1.0000 |
| T2 | 0.9065 | 0.9065 | 0.9065 | 0.9065 | 0.9065 | 0.9065 | 0.9065 | 0.9065 | 0.9065 | 0.9065 | 1.0000 | 1.0000 | 0.9346 |
| T3 | 0.9660 | 0.9612 | 0.9709 | 0.9709 | 0.9612 | 0.9612 | 0.8544 | 0.8641 | 0.8398 | 0.9029 | 0.7718 | 0.9757 | 1.0000 |
| T4 | 0.9175 | 0.9175 | 0.9175 | 0.9175 | 0.8660 | 0.8660 | 0.9588 | 1.0000 | 0.9175 | 0.9381 | 1.0000 | 0.9175 | 0.8660 |
| T5 | 0.9077 | 0.9077 | 0.9385 | 1.0000 | 0.9077 | 0.9077 | 0.9077 | 0.9077 | 0.9077 | 0.9077 | 0.9077 | 0.9846 | 0.9077 |
| T6 | 0.9178 | 0.9178 | 0.9178 | 0.9178 | 0.8618 | 0.8618 | 0.9507 | 1.0000 | 0.9178 | 0.9441 | 0.9901 | 0.9408 | 0.8618 |
| E1 | 0.9070 | 0.8750 | 1.0000 | 1.0000 | 0.8765 | 0.8765 | 0.9202 | 0.9228 | 0.9162 | 0.9289 | 0.9040 | 1.0000 | 0.8730 |
| E2 | 0.9235 | 0.9077 | 0.9524 | 0.9524 | 0.9077 | 0.9077 | 0.9084 | 0.9084 | 0.9080 | 0.9084 | 0.9080 | 1.0000 | 0.9074 |
| E3 | 0.9504 | 0.9091 | 0.9739 | 0.9739 | 0.8886 | 0.8886 | 0.9072 | 0.9084 | 0.9050 | 0.9138 | 0.8986 | 1.0000 | 0.8825 |
| E4 | 0.9163 | 0.9170 | 0.9177 | 0.9177 | 0.9165 | 0.9165 | 0.9164 | 0.9164 | 0.9164 | 0.9165 | 0.9164 | 1.0000 | 0.9163 |
| E5 | 0.8588 | 0.8776 | 0.9341 | 0.9341 | 0.8682 | 0.8682 | 0.9774 | 0.9849 | 0.9680 | 1.0000 | 0.9360 | 0.9341 | 0.8588 |
| E6 | 1.0000 | 0.9684 | 0.9050 | 0.9050 | 0.9083 | 0.9083 | 0.9197 | 0.9204 | 0.9184 | 0.9221 | 0.9145 | 0.9050 | 0.9050 |
| F1 | 0.9352 | 0.8981 | 0.9236 | 0.9398 | 0.8657 | 0.8588 | 0.9954 | 0.9421 | 1.0000 | 0.9907 | 0.8634 | 0.8843 | 0.9028 |
| F2 | 0.9083 | 0.9068 | 0.9053 | 0.9172 | 0.9053 | 0.9053 | 0.9482 | 0.9482 | 1.0000 | 0.9571 | 0.8964 | 0.8950 | 0.9068 |
| F3 | 0.9007 | 0.9338 | 1.0000 | 0.9007 | 0.9503 | 0.9503 | 0.9007 | 0.9007 | 0.9007 | 0.9338 | 0.9007 | 0.9272 | 0.9007 |
| F4 | 0.9544 | 0.9544 | 1.0000 | 0.9815 | 0.9452 | 0.9089 | 0.8904 | 0.8904 | 0.8904 | 0.8904 | 0.8904 | 0.8904 | 0.9135 |
| F5 | 0.9044 | 0.9071 | 0.9756 | 1.0000 | 0.8510 | 0.8542 | 0.9576 | 0.9764 | 0.9482 | 0.9827 | 0.8948 | 0.8928 | 0.8554 |
| F6 | 0.8750 | 0.8378 | 0.8771 | 0.8771 | 1.0000 | 1.0000 | 0.9990 | 0.9990 | 0.9990 | 0.9990 | 0.9990 | 0.8079 | 0.7304 |
| F7 | 1.0000 | 1.0000 | 1.0000 | 1.0000 | 1.0000 | 1.0000 | 0.6698 | 0.7358 | 0.5943 | 1.0000 | 1.0000 | 1.0000 | 1.0000 |
| Weighting | Evaluation | Normalization | H1 | H2 | H3 | H4 | H5 | H6 | H7 | H8 | H9 | H10 | H11 | H12 | H13 |
|---|---|---|---|---|---|---|---|---|---|---|---|---|---|---|---|
| Mean | TOPSIS | MinMax | 7 | 4 | 12 | 11 | 3 | 1 | 6 | 9 | 5 | 10 | 8 | 13 | 2 |
| Mean | TOPSIS | Max | 9 | 4 | 12 | 11 | 3 | 2 | 5 | 7 | 6 | 10 | 8 | 13 | 1 |
| Mean | TOPSIS | Vector | 10 | 8 | 12 | 11 | 7 | 5 | 1 | 4 | 6 | 9 | 3 | 13 | 2 |
| Mean | TOPSIS | Enhanced | 9 | 4 | 11 | 12 | 2 | 1 | 3 | 5 | 6 | 7 | 10 | 13 | 8 |
| Mean | VIKOR | MinMax | 7 | 5 | 12 | 11 | 4 | 2 | 1 | 9 | 6 | 10 | 8 | 13 | 3 |
| Mean | VIKOR | Max | 7 | 5 | 12 | 11 | 4 | 2 | 1 | 9 | 6 | 10 | 8 | 13 | 3 |
| Mean | VIKOR | Vector | 7 | 5 | 12 | 11 | 4 | 2 | 1 | 9 | 6 | 10 | 8 | 13 | 3 |
| Mean | VIKOR | Enhanced | 7 | 5 | 12 | 11 | 4 | 2 | 1 | 9 | 6 | 10 | 8 | 13 | 3 |
| Entropy | TOPSIS | MinMax | 8 | 6 | 12 | 11 | 7 | 5 | 3 | 4 | 2 | 10 | 9 | 13 | 1 |
| Entropy | TOPSIS | Max | 8 | 6 | 12 | 11 | 7 | 5 | 3 | 4 | 2 | 10 | 9 | 13 | 1 |
| Entropy | TOPSIS | Vector | 10 | 9 | 12 | 11 | 7 | 5 | 2 | 3 | 1 | 8 | 6 | 13 | 4 |
| Entropy | TOPSIS | Enhanced | 10 | 8 | 11 | 12 | 6 | 5 | 3 | 4 | 2 | 7 | 9 | 13 | 1 |
| Entropy | VIKOR | MinMax | 9 | 7 | 12 | 11 | 6 | 5 | 2 | 3 | 1 | 10 | 8 | 13 | 4 |
| Entropy | VIKOR | Max | 9 | 7 | 12 | 11 | 6 | 5 | 2 | 3 | 1 | 10 | 8 | 13 | 4 |
| Entropy | VIKOR | Vector | 9 | 7 | 12 | 11 | 6 | 5 | 2 | 3 | 1 | 10 | 8 | 13 | 4 |
| Entropy | VIKOR | Enhanced | 9 | 7 | 12 | 11 | 6 | 5 | 2 | 3 | 1 | 10 | 8 | 13 | 4 |
| Std | TOPSIS | MinMax | 6 | 5 | 12 | 13 | 2 | 3 | 9 | 10 | 8 | 11 | 4 | 7 | 1 |
| Std | TOPSIS | Max | 6 | 5 | 12 | 13 | 2 | 3 | 9 | 10 | 8 | 11 | 4 | 7 | 1 |
| Std | TOPSIS | Vector | 6 | 5 | 12 | 13 | 3 | 2 | 8 | 10 | 7 | 11 | 4 | 9 | 1 |
| Std | TOPSIS | Enhanced | 6 | 5 | 11 | 12 | 3 | 2 | 8 | 9 | 7 | 10 | 4 | 13 | 1 |
| Std | VIKOR | MinMax | 6 | 5 | 12 | 13 | 2 | 3 | 9 | 10 | 8 | 11 | 4 | 7 | 1 |
| Std | VIKOR | Max | 6 | 5 | 12 | 13 | 2 | 3 | 9 | 10 | 8 | 11 | 4 | 7 | 1 |
| Std | VIKOR | Vector | 6 | 5 | 12 | 13 | 2 | 3 | 9 | 10 | 8 | 11 | 4 | 7 | 1 |
| Std | VIKOR | Enhanced | 6 | 5 | 12 | 13 | 2 | 3 | 9 | 10 | 8 | 11 | 4 | 7 | 1 |
| CRITIC | TOPSIS | MinMax | 7 | 4 | 12 | 11 | 3 | 1 | 6 | 8 | 5 | 9 | 10 | 13 | 2 |
| CRITIC | TOPSIS | Max | 8 | 6 | 12 | 11 | 3 | 2 | 5 | 7 | 4 | 10 | 9 | 13 | 1 |
| CRITIC | TOPSIS | Vector | 10 | 8 | 12 | 11 | 7 | 6 | 1 | 3 | 2 | 9 | 5 | 13 | 4 |
| CRITIC | TOPSIS | Enhanced | 9 | 7 | 10 | 12 | 2 | 1 | 3 | 5 | 4 | 6 | 11 | 13 | 8 |
| CRITIC | VIKOR | MinMax | 7 | 5 | 10 | 9 | 3 | 1 | 6 | 12 | 4 | 8 | 13 | 11 | 2 |
| CRITIC | VIKOR | Max | 7 | 5 | 10 | 9 | 3 | 1 | 6 | 12 | 4 | 8 | 13 | 11 | 2 |
| CRITIC | VIKOR | Vector | 7 | 5 | 10 | 9 | 3 | 1 | 6 | 12 | 4 | 8 | 13 | 11 | 2 |
| CRITIC | VIKOR | Enhanced | 7 | 5 | 10 | 9 | 3 | 1 | 6 | 12 | 4 | 8 | 13 | 11 | 2 |
| Angle | TOPSIS | MinMax | 10 | 8 | 12 | 11 | 7 | 5 | 1 | 3 | 2 | 9 | 6 | 13 | 4 |
| Angle | TOPSIS | Max | 10 | 8 | 12 | 11 | 7 | 6 | 1 | 3 | 2 | 9 | 5 | 13 | 4 |
| Angle | TOPSIS | Vector | 10 | 9 | 12 | 11 | 7 | 6 | 1 | 2 | 3 | 8 | 4 | 13 | 5 |
| Angle | TOPSIS | Enhanced | 10 | 9 | 11 | 12 | 5 | 1 | 2 | 4 | 7 | 8 | 6 | 13 | 3 |
| Angle | VIKOR | MinMax | 9 | 8 | 11 | 12 | 6 | 5 | 1 | 2 | 3 | 10 | 7 | 13 | 4 |
| Angle | VIKOR | Max | 9 | 8 | 11 | 12 | 6 | 5 | 1 | 2 | 3 | 10 | 7 | 13 | 4 |
| Angle | VIKOR | Vector | 9 | 8 | 11 | 12 | 6 | 5 | 1 | 2 | 3 | 10 | 7 | 13 | 4 |
| Angle | VIKOR | Enhanced | 9 | 8 | 11 | 12 | 6 | 5 | 1 | 2 | 3 | 10 | 7 | 13 | 4 |
| Gini | TOPSIS | MinMax | 10 | 8 | 11 | 12 | 7 | 6 | 1 | 3 | 2 | 9 | 5 | 13 | 4 |
| Gini | TOPSIS | Max | 10 | 8 | 12 | 11 | 7 | 6 | 1 | 3 | 2 | 9 | 5 | 13 | 4 |
| Gini | TOPSIS | Vector | 10 | 9 | 11 | 12 | 7 | 6 | 1 | 3 | 2 | 8 | 4 | 13 | 5 |
| Gini | TOPSIS | Enhanced | 10 | 9 | 11 | 12 | 7 | 5 | 2 | 3 | 6 | 8 | 4 | 13 | 1 |
| Gini | VIKOR | MinMax | 9 | 8 | 11 | 12 | 6 | 5 | 1 | 2 | 3 | 10 | 7 | 13 | 4 |
| Gini | VIKOR | Max | 9 | 8 | 11 | 12 | 6 | 5 | 1 | 2 | 3 | 10 | 7 | 13 | 4 |
| Gini | VIKOR | Vector | 9 | 8 | 11 | 12 | 6 | 5 | 1 | 2 | 3 | 10 | 7 | 13 | 4 |
| Gini | VIKOR | Enhanced | 9 | 8 | 11 | 12 | 6 | 5 | 1 | 2 | 3 | 10 | 7 | 13 | 4 |
References
- IPCC. Summary for Policymakers. In Global Warming of 1.5°C. An IPCC Special Report on the Impacts of Global Warming of 1.5 °C Above Pre-Industrial Levels and Related Global Greenhouse Gas Emission Pathways, in the Context of Strengthening the Global Response to the Threat of Climate Change, Sustainable Development, and Efforts to Eradicate Poverty; Masson-Delmotte, V., Zhai, P., Pörtner, H.-O., Roberts, D., Skea, J., Shukla, P.R., Pirani, A., Moufouma-Okia, W., Péan, C., Pidcock, R., et al., Eds.; World Meteorological Organization: Geneva, Switzerland, 2018; 32p. [Google Scholar]
- Ramaswami, A.; Tong, K.; Canadell, J.G.; Jackson, R.B.; Stokes, E.; Dhakal, S.; Finch, M.; Jittrapirom, P.; Singh, N.; Yamagata, Y.; et al. Carbon Analytics for Net-Zero Emissions Sustainable Cities. Nat. Sustain. 2021, 4, 460–463. [Google Scholar] [CrossRef]
- Salvia, M.; Reckien, D.; Pietrapertosa, F.; Eckersley, P.; Spyridaki, N.A.; Krook-Riekkola, A.; Olazabal, M.; Hurtado, S.D.G.; Simoes, S.G.; Geneletti, D.; et al. Will Climate Mitigation Ambitions Lead to Carbon Neutrality? An Analysis of the Local-Level Plans of 327 Cities in the EU. Renew. Sustain. Energy Rev. 2021, 135, 110253. [Google Scholar] [CrossRef]
- Esteves, G.R.T.; Bastos, B.Q.; Cyrino, F.L.; Calili, R.F.; Souza, R.C. Long Term Electricity Forecast: A Systematic Review. Procedia Computer Science. 2015, 55, 549–558. [Google Scholar] [CrossRef] [Green Version]
- International Energy Agency. World Energy Investment 2020; IEA: Paris, France, 2020; Available online: https://www.iea.org/reports/world-energy-investment-2020 (accessed on 29 August 2021).
- The Danish Government. Folketinget Klimaaftale for Energi Og Industr mv. 2020. 2020. Available online: https://fm.dk/media/18085/klimaaftale-for-energi-og-industri-mv-2020.pdf (accessed on 29 August 2021).
- The Danish Government. Klimaplan for en Grøn Affaldssektor og Cirkulær Økonomi. 2020. Available online: https://www.regeringen.dk/media/9591/aftaletekst.pdf (accessed on 29 August 2021).
- Martinopoulos, G.; Papakostas, K.T.; Papadopoulos, A.M. A Comparative Review of Heating Systems in EU Countries, Based on Efficiency and Fuel Cost. Renew. Sustain. Energy Rev. 2018, 90, 687–699. [Google Scholar] [CrossRef]
- Sayegh, M.A.; Jadwiszczak, P.; Axcell, B.P.; Niemierka, E.; Bryś, K.; Jouhara, H. Heat Pump Placement, Connection and Operational Modes in European District Heating. Energy Build. 2018, 166, 122–144. [Google Scholar] [CrossRef]
- Mahmoud, M.; Ramadan, M.; Naher, S.; Pullen, K.; Olabi, A.G. The Impacts of Different Heating Systems on the Environment: A Review. Sci. Total Environ. 2021, 766, 142625. [Google Scholar] [CrossRef]
- Li, X.; Lyu, W.; Ran, S.; Wang, B.; Wu, W.; Yang, Z.; Jiang, S.; Cui, M.; Song, P.; You, T.; et al. Combination Principle of Hybrid Sources and Three Typical Types of Hybrid Source Heat Pumps for Year-Round Efficient Operation. Energy 2020, 193, 116772. [Google Scholar] [CrossRef]
- Mäki, E.; Kannari, L.; Hannula, I.; Shemeikka, J. Decarbonization of a District Heating System with a Combination of Solar Heat and Bioenergy: A Techno-Economic Case Study in the Northern European Context. Renew. Energy 2021, 175, 1174–1199. [Google Scholar] [CrossRef]
- Adfærdsanalyse af evidas kunder udarbejdet af/kl.7. Gaskundernes forventninger til deres fremtidige opvarmning. 2021. Available online: https://ipaper.ipapercms.dk/HMNNaturgas/evida/analysegaskundernes-forventninger-til-deres-fremtidige-opvarmning (accessed on 29 August 2021).
- Siksnelyte, I.; Zavadskas, E.K.; Streimikiene, D.; Sharma, D. An Overview of Multi-Criteria Decision-Making Methods in Dealing with Sustainable Energy Development Issues. Energies 2018, 11, 2754. [Google Scholar] [CrossRef] [Green Version]
- Stojčić, M.; Zavadskas, E.K.; Pamučar, D.; Stević, Ž.; Mardani, A. Application of MCDM Methods in Sustainability Engineering: A Literature Review 2008–2018. Symmetry 2019, 11, 350. [Google Scholar] [CrossRef] [Green Version]
- Siksnelyte-Butkiene, I.; Zavadskas, E.K.; Streimikiene, D. Multi-Criteria Decision-Making (MCDM) for the Assessment of Renewable Energy Technologies in a Household: A Review. Energies 2020, 13, 1164. [Google Scholar] [CrossRef] [Green Version]
- Janssen, R. On the Use of Multi-Criteria Analysis in Environmental Impact Assessment in The Netherlands. J. Multi-Criteria Decis. Anal. 2001, 10, 101–109. [Google Scholar] [CrossRef]
- Zhang, C.; Wang, Q.; Zeng, S.; Baležentis, T.; Štreimikienė, D.; Ališauskaitė-Šeškienė, I.; Chen, X. Probabilistic Multi-Criteria Assessment of Renewable Micro-Generationtechnologies in Households. J. Clean. Prod. 2019, 212, 582–592. [Google Scholar] [CrossRef]
- Wimmler, C.; Hejazi, G.; de Fernandes, E.O.; Moreira, C.; Connors, S. Multi-Criteria Decision Support Methods for Renewable Energy Systems on Islands. J. Clean Energy Technol. 2015, 3, 185–195. [Google Scholar] [CrossRef] [Green Version]
- Rigo, P.D.; Rediske, G.; Rosa, C.B.; Gastaldo, N.G.; Michels, L.; Júnior, A.L.N.; Siluk, J.C.M. Renewable Energy Problems: Exploring the Methods to Support the Decision-Making Process. Sustainability 2020, 12, 10195. [Google Scholar] [CrossRef]
- Mardani, A.; Jusoh, A.; Zavadskas, E.K.; Cavallaro, F.; Khalifah, Z. Sustainable and Renewable Energy: An Overview of the Application of Multiple Criteria Decision Making Techniques and Approaches. Sustainability 2003, 7, 13947–13984. [Google Scholar] [CrossRef] [Green Version]
- Hadian, S.; Madani, K. A System of Systems Approach to Energy Sustainability Assessment: Are All Renewables Really Green? Ecol. Indic. 2015, 52, 194–206. [Google Scholar] [CrossRef]
- Sagi, O.; Rokach, L. Ensemble Learning: A Survey. Wiley Interdiscip. Rev. Data Min. Knowl. Discov. 2018, 8, e1249. [Google Scholar] [CrossRef]
- Aytekin, A. Comparative Analysis of the Normalization Techniques in the Context of MCDM Problems. Decis. Mak. Appl. Manag. Eng. 2021, 4, 1–25. [Google Scholar] [CrossRef]
- Odu, G.O. Weighting Methods for Multi-Criteria Decision Making Technique. J. Appl. Sci. Environ. Manag. 2019, 23, 1449–1457. [Google Scholar] [CrossRef] [Green Version]
- Urošević, K.; Gligorić, Z.; Miljanović, I.; Beljić, Č.; Gligorić, M. Novel Methods in Multiple Criteria Decision-Making Process (MCRAT and RAPS)-Application in the Mining Industry. Mathematics 2021, 9, 1980. [Google Scholar] [CrossRef]
- Opricovic, S.; Tzeng, G.H. Compromise Solution by MCDM Methods: A Comparative Analysis of VIKOR and TOPSIS. Eur. J. Oper. Res. 2004, 156, 445–455. [Google Scholar] [CrossRef]
- Mon, D.L.; Cheng, C.H. Fuzzy System Reliability Analysis for Components with Different Membership Functions. Fuzzy Sets Syst. 1994, 64, 145–157. [Google Scholar] [CrossRef]
- Danish Energy Agency. Technology Data for Heating Installations Guideline; Danish Energy Agency: København, Denmark, 2021; Available online: https://ens.dk/sites/ens.dk/files/Analyser/technology_data_catalogue_for_individual_heating_installations.pdf (accessed on 29 August 2021).
- Varmepumper|Energistyrelsen. Available online: https://sparenergi.dk/forbruger/varme/varmepumper (accessed on 29 August 2021).
- Samfundsoekonomiske_beregningsforudsaetninger_for_energipriser_og_emissioner_2019. Available online: https://ens.dk/sites/ens.dk/files/Analyser/samfundsoekonomiske_beregningsforudsaetninger_for_energipriser_og_emissioner_2019.pdf (accessed on 29 August 2021).
- Data, Tabeller, Statistikker Og Kort Energistatistik 2019. Available online: https://ens.dk/sites/ens.dk/files/Statistik/energistatistik2019_dk-webtilg.pdf (accessed on 29 August 2021).
- Energi- Og CO₂-Regnskabet|Energistyrelsen. Available online: https://sparenergi.dk/offentlig/vaerktoejer/energi-og-co2-regnskabet (accessed on 29 August 2021).
- Energimærkning Boliger|Energistyrelsen. Available online: https://sparenergi.dk/forbruger/boligen/energimaerkning-boliger (accessed on 29 August 2021).
- Bekendtgørelse Om Tilskud Til Energibesparelser Og Energieffektiviseringer i Bygninger Til Helårsbeboelse. Available online: https://www.retsinformation.dk/eli/lta/2021/525#id26bbf930-5196-4240-810d-f94df9dbc0ff (accessed on 29 August 2021).
- Shekhovtsov, A.; Salabun, W. A Comparative Case Study of the VIKOR and TOPSIS Rankings Similarity. Procedia Comput. Sci. 2020, 176, 3730–3740. [Google Scholar] [CrossRef]
- Chang, J.-F.; Lai, C.-J.; Wang, C.-N.; Hsueh, M.-H.; Nguyen, V.T. Mathematics Fuzzy Optimization Model for Decision-Making in Supply Chain Management. Mathematics 2021, 9, 312. [Google Scholar] [CrossRef]
- Yang, Y.; Ren, J.; Solgaard, H.S.; Xu, D.; Nguyen, T.T. Using Multi-criteria Analysis to Prioritize Renewable Energy Home Heating Technologies. Sustain. Energy Technol. Assess. 2018, 29, 36–43. [Google Scholar] [CrossRef]


| Weighting Method | Equation | |
|---|---|---|
| Mean | ||
| Std | ||
| Entropy | ||
| CRITIC | ||
| Angle | ||
| Gini | ||
| Normalization Method | Target: max | Target: min |
| MinMax | ||
| Max | ||
| Vector | ||
| Enhanced | ||
| Notation | Definition |
|---|---|
| Alternatives set | |
| Criteria set | |
| criterion weight | |
| alternative’s score vector | |
| criterion’s score vector | |
| alternative criterion score | |
| Standard deviation of a dataset | |
| after normalization | |
| n | Criteria number |
| Correlation coefficient | |
| after normalization | |
| after normalization |
| Heating Alternatives | ID |
|---|---|
| Oil boiler | H1 |
| Gas boiler | H2 |
| Biomass boiler (auto) | H3 |
| Biomass boiler (manual) | H4 |
| District heating (indirect) | H5 |
| District heating (direct) | H6 |
| Heat pump (air to water) | H7 |
| Heat pump (air to water, low-price product) | H8 |
| Heat pump (ground source) | H9 |
| Heat pump (gas-hybrid) | H10 |
| Heat pump (air-to-air) | H11 |
| Woodstove | H12 |
| Solar heating | H13 |
| Dimension | Criteria | Measurement | ID | Target | Source |
|---|---|---|---|---|---|
| Technical | Expected covered space heating demand | share | T1 | max | [29] |
| Expected covered hot tap water demand | share | T2 | max | [29] | |
| Annual average heat efficiency | net heat/fuel consumption | T3 | max | [29] | |
| Technical economic lifespan | years | T4 | max | [29] | |
| Time spends on manual maintenance | hours/y | T5 | min | [29] | |
| Noise | dB | T6 | min | [29,30] | |
| Environmental | SO2 emission | g/GJ | E1 | min | [29,31,32] |
| PM2.5 emission | g/GJ | E2 | min | [29,31,32] | |
| NOx emission | g/GJ | E3 | min | [29,31,32] | |
| CH4 emission | g/GJ | E4 | min | [29,31,32] | |
| N2O emission | g/GJ | E5 | min | [29,31,32] | |
| CO2 emission | kg/GJ | E6 | min | [31,32,33] | |
| Financial | Nominal equipment investment | k€ | F1 | min | [29] |
| Nominal install investment | k€ | F2 | min | [29] | |
| Nominal additional investment | k€ | F3 | min | [29] | |
| Fixed electricity cost | €/y | F4 | min | [29] | |
| Fixed operating and maintenance cost | €/y | F5 | min | [29] | |
| Fuel cost | €/GJ | F6 | min | [31,34] | |
| Subsidy | k€ | F7 | max | [35] |
| Criteria | H1 | H2 | H3 | H4 | H5 | H6 | H7 | H8 | H9 | H10 | H11 | H12 | H13 |
|---|---|---|---|---|---|---|---|---|---|---|---|---|---|
| T1 | 1.0 | 1.0 | 1.0 | 1.0 | 1.0 | 1.0 | 1.0 | 1.0 | 1.0 | 1.0 | 0.3 | 0.3 | 0.1 |
| T2 | 1.0 | 1.0 | 1.0 | 1.0 | 1.0 | 1.0 | 1.0 | 1.0 | 1.0 | 1.0 | 0.0 | 0.0 | 0.7 |
| T3 | 0.9 | 1.0 | 0.8 | 0.8 | 1.0 | 1.0 | 3.2 | 3.0 | 3.5 | 2.2 | 4.9 | 0.7 | 0.2 |
| T4 | 20.0 | 20.0 | 20.0 | 20.0 | 25.0 | 25.0 | 16.0 | 12.0 | 20.0 | 18.0 | 12.0 | 20.0 | 25.0 |
| T5 | 0.0 | 0.0 | 20.0 | 60.0 | 0.0 | 0.0 | 0.0 | 0.0 | 0.0 | 0.0 | 0.0 | 50.0 | 0.0 |
| T6 | 42.0 | 42.0 | 42.0 | 42.0 | 25.0 | 25.0 | 52.0 | 67.0 | 42.0 | 50.0 | 64.0 | 49.0 | 25.0 |
| E1 | 6.7 | 0.4 | 25.0 | 25.0 | 0.7 | 0.7 | 9.3 | 9.8 | 8.5 | 11.0 | 6.1 | 25.0 | 0.0 |
| E2 | 5.0 | 0.1 | 14.0 | 14.0 | 0.1 | 0.1 | 0.3 | 0.3 | 0.2 | 0.3 | 0.2 | 28.8 | 0.0 |
| E3 | 52.0 | 20.4 | 70.0 | 70.0 | 4.7 | 4.7 | 18.9 | 19.8 | 17.2 | 24.0 | 12.3 | 90.0 | 0.0 |
| E4 | 0.0 | 1.0 | 2.0 | 2.0 | 0.2 | 0.2 | 0.1 | 0.1 | 0.1 | 0.2 | 0.1 | 125.0 | 0.0 |
| E5 | 0.0 | 1.0 | 4.0 | 4.0 | 0.5 | 0.5 | 6.3 | 6.7 | 5.8 | 7.5 | 4.1 | 4.0 | 0.0 |
| E6 | 74.1 | 49.5 | 0.0 | 0.0 | 2.6 | 2.6 | 11.5 | 12.0 | 10.5 | 13.4 | 7.4 | 0.0 | 0.0 |
| F1 | 4.3 | 2.7 | 3.8 | 4.5 | 1.3 | 1.0 | 6.9 | 4.6 | 7.1 | 6.7 | 1.2 | 2.1 | 2.9 |
| F2 | 1.3 | 1.2 | 1.1 | 1.9 | 1.1 | 1.1 | 4.0 | 4.0 | 7.5 | 4.6 | 0.5 | 0.4 | 1.2 |
| F3 | 0.0 | 2.0 | 6.0 | 0.0 | 3.0 | 3.0 | 0.0 | 0.0 | 0.0 | 2.0 | 0.0 | 1.6 | 0.0 |
| F4 | 9.7 | 9.7 | 16.6 | 13.8 | 8.3 | 2.8 | 0.0 | 0.0 | 0.0 | 0.0 | 0.0 | 0.0 | 3.5 |
| F5 | 174.9 | 181.9 | 357.6 | 420.3 | 37.8 | 46.0 | 311.4 | 359.7 | 287.3 | 375.8 | 150.3 | 145.0 | 49.0 |
| F6 | 14.0 | 10.4 | 14.2 | 14.2 | 26.1 | 26.1 | 26.0 | 26.0 | 26.0 | 26.0 | 26.0 | 7.5 | 0.0 |
| F7 | 0.0 | 0.0 | 0.0 | 0.0 | 0.0 | 0.0 | 3.5 | 2.8 | 4.3 | 0.0 | 0.0 | 0.0 | 0.0 |
| Criteria | Mean | Std | Entropy | CRITIC | Angle | Gini |
|---|---|---|---|---|---|---|
| T1 | 0.0526 | 0.0011 | 0.0033 | 0.0542 | 0.0279 | 0.0188 |
| T2 | 0.0526 | 0.0012 | 0.0804 | 0.0601 | 0.0307 | 0.0200 |
| T3 | 0.0526 | 0.0046 | 0.0086 | 0.0520 | 0.0483 | 0.0447 |
| T4 | 0.0526 | 0.0139 | 0.0007 | 0.0669 | 0.0154 | 0.0126 |
| T5 | 0.0526 | 0.0679 | 0.0804 | 0.0538 | 0.0818 | 0.0911 |
| T6 | 0.0526 | 0.0437 | 0.0014 | 0.0491 | 0.0212 | 0.0180 |
| E1 | 0.0526 | 0.0308 | 0.0804 | 0.0511 | 0.0550 | 0.0551 |
| E2 | 0.0526 | 0.0289 | 0.0804 | 0.0481 | 0.0776 | 0.0849 |
| E3 | 0.0526 | 0.0955 | 0.0804 | 0.0467 | 0.0544 | 0.0536 |
| E4 | 0.0526 | 0.1127 | 0.0804 | 0.0480 | 0.0943 | 0.1012 |
| E5 | 0.0526 | 0.0089 | 0.0804 | 0.0496 | 0.0483 | 0.0478 |
| E6 | 0.0526 | 0.0728 | 0.0804 | 0.0546 | 0.0730 | 0.0755 |
| F1 | 0.0526 | 0.0070 | 0.0049 | 0.0493 | 0.0370 | 0.0345 |
| F2 | 0.0526 | 0.0068 | 0.0103 | 0.0438 | 0.0530 | 0.0488 |
| F3 | 0.0526 | 0.0060 | 0.0804 | 0.0533 | 0.0678 | 0.0728 |
| F4 | 0.0526 | 0.0194 | 0.0804 | 0.0610 | 0.0633 | 0.0685 |
| F5 | 0.0526 | 0.4441 | 0.0061 | 0.0451 | 0.0392 | 0.0371 |
| F6 | 0.0526 | 0.0295 | 0.0804 | 0.0568 | 0.0322 | 0.0271 |
| F7 | 0.0526 | 0.0052 | 0.0804 | 0.0566 | 0.0796 | 0.0882 |
| v | H1 | H2 | H3 | H4 | H5 | H6 | H7 | H8 | H9 | H10 | H11 | H12 | H13 |
|---|---|---|---|---|---|---|---|---|---|---|---|---|---|
| 0.05 | 9 | 7 | 12 | 13 | 6 | 5 | 1 | 4 | 3 | 10 | 8 | 11 | 2 |
| 0.1 | 9 | 7 | 13 | 12 | 6 | 4 | 1 | 5 | 3 | 10 | 8 | 11 | 2 |
| 0.15 | 9 | 7 | 13 | 12 | 6 | 4 | 1 | 5 | 3 | 10 | 8 | 11 | 2 |
| 0.2 | 9 | 7 | 13 | 12 | 6 | 4 | 1 | 5 | 3 | 10 | 8 | 11 | 2 |
| 0.25 | 9 | 7 | 13 | 12 | 6 | 4 | 1 | 5 | 3 | 10 | 8 | 11 | 2 |
| 0.3 | 9 | 7 | 13 | 12 | 6 | 4 | 1 | 5 | 3 | 10 | 8 | 11 | 2 |
| 0.35 | 9 | 7 | 11 | 12 | 6 | 4 | 1 | 5 | 3 | 10 | 8 | 13 | 2 |
| 0.4 | 9 | 7 | 12 | 11 | 6 | 4 | 1 | 5 | 3 | 10 | 8 | 13 | 2 |
| 0.45 | 9 | 7 | 12 | 11 | 6 | 3 | 1 | 5 | 4 | 10 | 8 | 13 | 2 |
| 0.5 | 9 | 7 | 12 | 11 | 6 | 3 | 1 | 5 | 4 | 10 | 8 | 13 | 2 |
| 0.55 | 9 | 7 | 12 | 11 | 6 | 3 | 1 | 5 | 4 | 10 | 8 | 13 | 2 |
| 0.6 | 9 | 7 | 12 | 11 | 5 | 3 | 1 | 6 | 4 | 10 | 8 | 13 | 2 |
| 0.65 | 9 | 7 | 12 | 11 | 5 | 3 | 1 | 6 | 4 | 10 | 8 | 13 | 2 |
| 0.7 | 9 | 7 | 12 | 11 | 5 | 3 | 1 | 6 | 4 | 10 | 8 | 13 | 2 |
| 0.75 | 9 | 7 | 13 | 11 | 5 | 3 | 1 | 6 | 4 | 10 | 8 | 12 | 2 |
| 0.8 | 9 | 7 | 13 | 11 | 5 | 3 | 2 | 6 | 4 | 10 | 8 | 12 | 1 |
| 0.85 | 9 | 6 | 12 | 11 | 5 | 2 | 4 | 7 | 3 | 10 | 8 | 13 | 1 |
| 0.9 | 9 | 6 | 12 | 11 | 4 | 2 | 5 | 7 | 3 | 10 | 8 | 13 | 1 |
| 0.95 | 9 | 6 | 12 | 11 | 3 | 2 | 5 | 8 | 4 | 10 | 7 | 13 | 1 |
| 1 | 9 | 5 | 12 | 11 | 3 | 2 | 6 | 8 | 4 | 10 | 7 | 13 | 1 |
| H1 | H2 | H3 | H4 | H5 | H6 | H7 | H8 | H9 | H10 | H11 | H12 | H13 | |
|---|---|---|---|---|---|---|---|---|---|---|---|---|---|
| With std | 9 | 8 | 12 | 11 | 6 | 3 | 1 | 5 | 4 | 10 | 7 | 13 | 2 |
| Without std | 9 | 7 | 12 | 11 | 6 | 4 | 1 | 5 | 3 | 10 | 8 | 13 | 2 |
| Variables | Value | H1 | H2 | H3 | H4 | H5 | H6 | H7 | H8 | H9 | H10 | H11 | H12 | H13 |
|---|---|---|---|---|---|---|---|---|---|---|---|---|---|---|
| Fuzzy_y1 | 0.6 | 9 | 7 | 12 | 11 | 5 | 3 | 1 | 6 | 4 | 10 | 8 | 13 | 2 |
| 0.7 | 9 | 7 | 12 | 11 | 5 | 3 | 1 | 6 | 4 | 10 | 8 | 13 | 2 | |
| 0.8 | 9 | 8 | 12 | 11 | 5 | 3 | 1 | 6 | 4 | 10 | 7 | 13 | 2 | |
| 0.9 | 9 | 8 | 12 | 11 | 6 | 3 | 1 | 5 | 4 | 10 | 7 | 13 | 2 | |
| 0.99 | 9 | 8 | 12 | 11 | 6 | 3 | 1 | 5 | 4 | 10 | 7 | 13 | 2 | |
| 0.999 | 9 | 8 | 12 | 11 | 6 | 3 | 1 | 5 | 4 | 10 | 7 | 13 | 2 | |
| Fuzzy_y2 | 0.01 | 9 | 8 | 12 | 11 | 6 | 3 | 1 | 5 | 4 | 10 | 7 | 13 | 2 |
| 0.04 | 9 | 8 | 12 | 11 | 6 | 3 | 1 | 5 | 4 | 10 | 7 | 13 | 2 | |
| 0.07 | 9 | 8 | 12 | 11 | 6 | 3 | 1 | 5 | 4 | 10 | 7 | 13 | 2 | |
| 0.1 | 9 | 8 | 12 | 11 | 6 | 3 | 1 | 5 | 4 | 10 | 7 | 13 | 2 | |
| 0.13 | 9 | 8 | 12 | 11 | 5 | 3 | 1 | 6 | 4 | 10 | 7 | 13 | 2 | |
| 0.16 | 9 | 7 | 12 | 11 | 5 | 3 | 1 | 6 | 4 | 10 | 8 | 13 | 2 | |
| 0.19 | 9 | 7 | 12 | 11 | 5 | 3 | 1 | 6 | 4 | 10 | 8 | 13 | 2 | |
| Fuzzy_y3 | 0 | 9 | 8 | 12 | 11 | 6 | 3 | 1 | 5 | 4 | 10 | 7 | 13 | 2 |
| 0.02 | 9 | 8 | 12 | 11 | 6 | 3 | 1 | 5 | 4 | 10 | 7 | 13 | 2 | |
| 0.04 | 9 | 8 | 12 | 11 | 6 | 3 | 1 | 5 | 4 | 10 | 7 | 13 | 2 | |
| 0.06 | 9 | 8 | 12 | 11 | 6 | 3 | 1 | 5 | 4 | 10 | 7 | 13 | 2 | |
| 0.08 | 9 | 8 | 12 | 11 | 6 | 3 | 1 | 5 | 4 | 10 | 7 | 13 | 2 | |
| 0.1 | 13 | 8 | 12 | 11 | 6 | 3 | 1 | 5 | 4 | 10 | 7 | 9 | 2 |
Publisher’s Note: MDPI stays neutral with regard to jurisdictional claims in published maps and institutional affiliations. |
© 2021 by the authors. Licensee MDPI, Basel, Switzerland. This article is an open access article distributed under the terms and conditions of the Creative Commons Attribution (CC BY) license (https://creativecommons.org/licenses/by/4.0/).
Share and Cite
Wen, Q.; Yan, Q.; Qu, J.; Liu, Y. Fuzzy Ensemble of Multi-Criteria Decision Making Methods for Heating Energy Transition in Danish Households. Mathematics 2021, 9, 2420. https://doi.org/10.3390/math9192420
Wen Q, Yan Q, Qu J, Liu Y. Fuzzy Ensemble of Multi-Criteria Decision Making Methods for Heating Energy Transition in Danish Households. Mathematics. 2021; 9(19):2420. https://doi.org/10.3390/math9192420
Chicago/Turabian StyleWen, Qianyun, Qiyao Yan, Junjie Qu, and Yang Liu. 2021. "Fuzzy Ensemble of Multi-Criteria Decision Making Methods for Heating Energy Transition in Danish Households" Mathematics 9, no. 19: 2420. https://doi.org/10.3390/math9192420
APA StyleWen, Q., Yan, Q., Qu, J., & Liu, Y. (2021). Fuzzy Ensemble of Multi-Criteria Decision Making Methods for Heating Energy Transition in Danish Households. Mathematics, 9(19), 2420. https://doi.org/10.3390/math9192420