Article

Methodology to Calibrate the Dissection Properties of Aorta Layers from Two Sets of Experimental Measurements

by
Itziar Ríos-Ruiz
1,*,
Myriam Cilla
1,2,3,
Miguel A. Martínez
1,3 and
Estefanía Peña
1,3,*
1
Applied Mechanics and Bioengineering, Aragón Institute of Engineering Research (I3A), University of Zaragoza, 50018 Zaragoza, Spain
2
Centro Universitario de la Defensa, Academia General Militar, 50090 Zaragoza, Spain
3
CIBER de Bioingeniería, Biomateriales y Nanomedicina (CIBER-BBN), 50018 Zaragoza, Spain
*
Authors to whom correspondence should be addressed.
Mathematics 2021, 9(14), 1593; https://doi.org/10.3390/math9141593
Submission received: 31 May 2021 / Revised: 25 June 2021 / Accepted: 2 July 2021 / Published: 7 July 2021
(This article belongs to the Special Issue Numerical Simulation in Biomechanics and Biomedical Engineering)

Abstract

:
Aortic dissection is a prevalent cardiovascular pathology that can have a fatal outcome. However, the mechanisms that trigger this disease and the mechanics of its progression are not fully understood. Computational models can help understand these issues, but they need a proper characterisation of the tissues. Therefore, we propose a methodology to obtain the dissection parameters of all layers in aortic tissue via the computational modelling of two different delamination tests: the peel and mixed tests. Both experimental tests have been performed in specimens of porcine aorta, where the intima-media and media-adventitia interfaces, as well as the medial layer, were dissected. These two tests have been modelled using a cohesive zone formulation for the separating interface and a hyperelastic anisotropic material model via an implicit static analysis. The dissection properties of each interface have been calibrated by reproducing the force-displacement curves obtained in the experimental tests. The values of peak and mean force of the experiments were fitted with an error below 10 % . With this methodology, we intend to contribute to the development of reliable numerical tools for simulating aortic dissection and aortic aneurysm rupture.

1. Introduction

According to the World Health Organization, cardiovascular disease, the treatment of which results in a major economic burden, remains the principal cause of mortality and morbidity worldwide [1]. Among all, aortic dissection and aortic aneurysm rupture are acute life threatening events. Aortic dissection usually begins with an intimal tear in the wall, followed by a fissure in a radial direction. The crack then advances into the medial layer, or between the media and the adventitia, causing the separation of the wall layers and creating a false lumen through which blood can flow [2]. Aortic aneurysms lead to Stanford type A dissections—affecting the ascending aorta—or type B dissections—affecting the descending thoracic aorta [3]. The fissure of the intima that leads to dissection of the ascending aorta is usually located a few centimetres above the coronary arteries, while those leading to dissection of the descending aorta are located a few centimetres below the left subclavian artery [4]. Therefore, it is a location specific disease and its study should consider the particular biomechanical environment and properties of each site. In addition to the above pathologies, a trauma of the thoracic aorta during traffic accidents can initiate the dissection process or cause an instantaneous rupture. Mortality estimates suggest that 20% of cases of Type A acute aortic dissection die before reaching the hospital [5]. There is about 1% mortality per hour within the first 48 h upon arrival [5] and postoperative survival at 1 year postdischarge after surgical repair is evaluated at 96.1% [6].
Existing studies in the literature have investigated the dissection of aortic media, but mechanical investigations of arterial wall delamination of the layer interfaces and the numerical simulations have been limited. Sommer et al. [7] worked on understanding the mechanisms of fissure propagation during aortic dissection. To do so, they performed uniaxial tension tests in the radial direction to study the dissection strength throughout the lamellae of the vessels and medial layer peeling tests to obtain the fracture energy required for fracture propagation, both from healthy human abdominal aortas. The same group also investigated the mechanical properties of the aneurysmal media and dissected human thoracic aortas, including the less studied dissection behaviour in shear mode or mode II [8]. Pasta et al. [9] investigated the dissection properties of non-aneurysmal and aneurysmal human ascending thoracic aortas and Angouras et al. [10] analysed the dissection properties of aneurysmal ascending thoracic aortas. Both groups also performed microstructure-based models of ascending thoracic aortic aneurysms to further characterise and understand the pathological process [11,12]. Manopoulos et al. [13] characterised the mechanical properties of specimens from ascending aortas after type A dissection. Amabili et al. [14] investigated the mechanical properties of the dissected layers of one single human aneurysmal aorta after chronic Type A (Stanford) dissection. Leng et al. [15] quantified the energy release rate of the medial layer of a porcine abdominal aorta via two delamination experiments: the mixed-mode delamination experiment and the “T”-shaped delamination experiment. All these studies analysed the dissection properties of the medial layer for porcine or humans, but not the dissection properties of the intima-media or media-adventitia interfaces, which are necessary to understand crack propagation along the arterial wall. Recently, FitzGibbon and McGarry [16] presented an experimental technique to generate and characterise mode II crack initiation and propagation on excised ascending bovine aorta. Regarding the numerical simulations, several studies have analysed the behaviour of arterial tissue under delamination mode I [15,17,18] or mixed mode along the medial layer [15,16], but few investigations have focused on comparing the contributions of these two failure modes to the process of delamination of the layer interfaces. In each case, a cohesive zone (CZ) formulation has been used to model the propagation of tissue crack. Gasser and Holzapfel [17] used a cohesion law within the extended finite element (FE) method to simulate the controlled peeling (dissection) experiments by Sommer et al. [7]. Subsequently, Ferrara and Pandolfi [18] applied an anisotropic cohesion law to reproduce the anisotropic behavior observed in the peeling tests. Noble et al. [19] computationally investigated arterial perforation or dissection by an external body. Leng et al. [15] used a CZ model to simulate the arterial wall delamination under shear mode-dominated failure and the opening “T”-shaped delamination modes. Recently, FitzGibbon and McGarry [16] calibrated the mode II fracture energy based on measurement of crack propagation rates by a CZ model. However, a methodology to combine “T”-shaped and mixed delamination experiments with CZ models in order to fit the normal delamination properties for media and interface layers has not been presented yet in the literature.
Therefore, the aim of this paper is to provide a computational framework to analyse the normal delamination properties in order to gain a more in-depth understanding of the possible mechanisms leading to these fatal events. Using data taken from “T”-shaped (also known as peel) and mixed delamination experiments, together with a FE model that includes a CZ formulation to model interface properties, we estimate the normal failure properties of the medial and interface layers of the descending thoracic aorta. We are motivated by the need for reliable numerical tools for simulating aortic dissection and aortic aneurysm rupture.

2. Materials and Methods

All the specimens used in the experimental testing were obtained from one healthy porcine aorta harvested post-mortem. The 45 kg, 3.5 months old female pig was sacrificed for a different study that does not interfere with the aorta or the circulatory system. The elastic properties of the arteries were fitted from uniaxial tensile tests. The dissection properties among different layers in the aorta were calibrated via two dissection tests: the peel and the mixed tests.

2.1. Experiments

From a proximal porcine descending thoracic aorta, a total of seven 5 × 20 mm strips were cut in each longitudinal and circumferential directions, all of them located in a close position. One sample from each direction was used to characterise the elastic properties of the aorta by means of uniaxial tension tests. The other 12 samples were divided into two sets of 6 samples, one for the peeling test and the other for the mixed test. The specimens were dissected throughout each different arterial layer, i.e., intima-media (IM), media-adventitia (MA) and within the media (M).
Simple uniaxial tension tests were performed in a high precision drive Instron Microtester 5548 system using a 10 N load cell. A non-contact Instron 2663-281 video-extensometer was used to measure the strain during the tests. Three loading and unloading stress levels were performed (60, 120 and 240 kPa uniaxial stress) at 30%/min of strain rate. Five preconditioning cycles at all load levels were applied. The engineering stress (first Piola Kirchhoff stress tensor P ) was computed as P i = F i t i w i , where F i is the load registered by the Instron machine and t i and w i are the initial thickness and width of each strip in circumferential and longitudinal directions. Only the elastic properties of the tissue were considered, therefore only the experimental data at the second loading level (120 kPa) after preconditioning was considered. For further details about the uniaxial tests, see Peña et al. [20].
For the dissection tests, an initial incision of around 5 mm was performed in each strip, facilitating the separation of the layers of interest. This selective incision was carefully performed with the aid of magnifying eyeglasses, which facilitated the perception of the different layers. In the peel test, each separated part of the specimen was pulled away by clamps. These clamps moved in opposite directions at a speed of 1 mm/min each, separating the layers of the specimen in the direction normal to the interface plane. These tests were carried out in an Instron BioPulsTM low-force planar-biaxial Testing System. In the mixed test, the intimal side of the strip was glued to a clamp plate and fixed during the test and therefore only the other flap was gripped in a moving clamp. This clamp moved at a speed of 1 mm/min almost parallel to the fixed and not-yet delaminated interface, via the high precision drive Instron Microtester 5548 system.
The experiments were approved by the Ethical Committee for Animal Research of the University of Zaragoza and all procedures were carried out in accordance with the “Principles of Laboratory Animal Care” (86/609/EEC Norm).

2.2. Elastic Properties of Aortic Tissue

The Gasser-Ogden-Holzapfel (GOH) model presented by Gasser et al. [21] is used to reproduce the elastic response of the aorta tissue. This model proposed by the application of a generalised structure tensor H = κ 1 + ( 1 3 κ ) M 0 (where 1 is the identity tensor and M 0 = m 0 m 0 is a structure tensor defined using unit vector m 0 to specify the mean orientation of fibres) is considered. The strain energy function (SEF) of the GOH model is as follows:
Ψ = μ I 1 3 + i = 4 , 6 k 1 2 k 2 e x p k 2 E ^ i } 1 ,
where I 1 = t r C ¯ represents the first invariant of the Cauchy-Green tensor ( C = F T F ), F is the deformation gradient [22] and
E ^ i = κ I 1 + ( 1 3 κ ) I i 1 i = 4 , 6
where
I 4 = λ θ 2 cos 2 ( θ ) + λ z 2 sin 2 ( θ ) , I 6 = λ θ 2 cos 2 ( θ ) + λ z 2 sin 2 ( θ ) .
In this equation, I 1 represents the first invariant of the Cauchy-Green tensor [22], μ > 0 and k 1 > 0 are stress-like parameters and k 2 > 0 and κ are dimensionless. Here, θ is the orientation angle relative to the circumferential direction. κ [ 0 , 1 / 3 ] is a dispersion parameter (the same for each collagen fibre family).

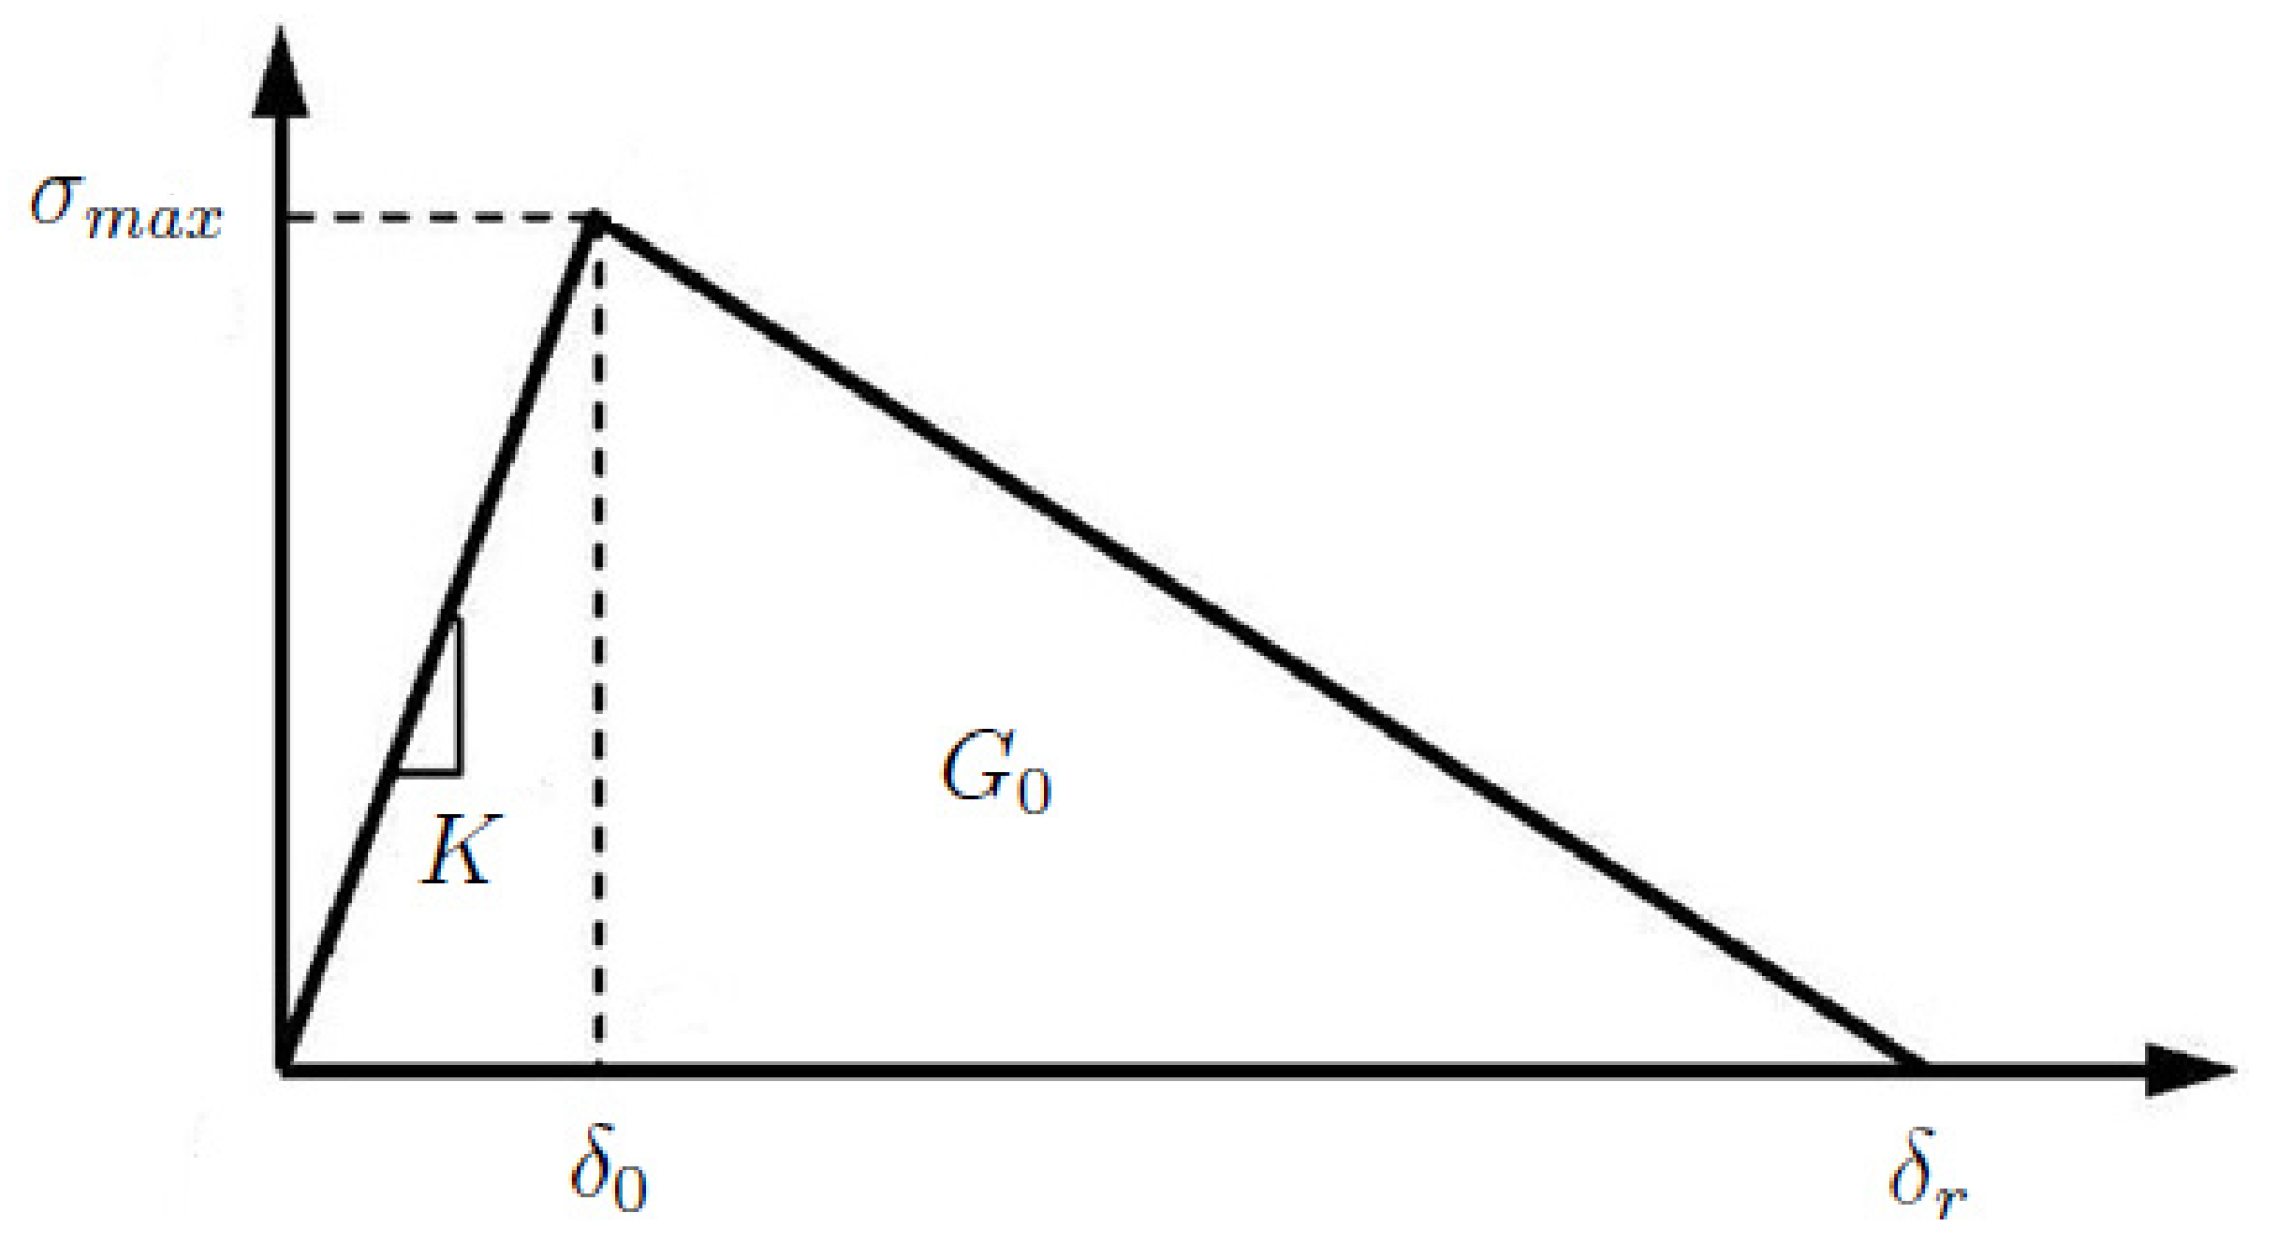
2.3. Fracture Properties of Aortic Tissue

To model the fracture behaviour of the interface between the arterial layers, we propose a Traction Separation Law (TSL) that relates the interfacial traction t (normal and shear) with interfacial displacement δ [23]. The components of the traction stress vector ( τ n , τ s , and τ t ) represent the normal and the two shear tractions along the interface and the related displacements are δ n , δ s , and δ t .
The elastic behavior of the interface is defined by
τ = K n n 0 0 0 K s s 0 0 0 K t t δ = K δ .
A triangular TSL was considered to model cohesive properties of the tissue, see Figure 1. The initial interface displacement δ 0 n , s , t , the tissue maximum strength τ n , s , t m a x and the energy release rate (the energy dissipated by the cohesive zone) G 0 n , s , t define the mechanics of the cohesive zone following
K i i = τ i m a x δ 0 i G 0 i = δ r i · τ i m a x 2 ,
where i = n , s , t .
The evolution of damage can be defined by specifying either the effective displacement at complete failure, δ r n , s , t , related to the effective displacement at the initiation of damage, δ 0 n , s , t , or the energy dissipated due to failure G 0 n , s , t . Damage law is defined in the context of Continuum Damage Mechanics Theory [24]. Damage is assumed to initiate when the maximum nominal stress ratio reaches a value of one
m a x τ n τ n m a x , τ s τ s m a x , τ t τ t m a x = 1 .
D [ 0 , 1 ] is a scalar variable that represents the damage of the material and combines the effects of all the mechanisms. D monotonically progresses from 0 to 1 upon further loading after the initiation of damage. In the context of linear softening, the evolution of the damage variable, D, is computed as
D = δ m f ( δ m m a x δ m 0 ) δ m m a x ( δ m f δ m 0 ) ,
where δ m is computed as
δ m = δ n 2 + δ s 2 + δ t 2 ,
and δ m f is the displacement at complete failure relative to the displacement at damage initiation, δ m 0 , and δ m m a x refers to the maximum value of the displacement reached during the loading history. The Macaulay brackets ( x = 0 if x < 0 or x = x if x > 0 ) are used to enforce that there is no damage initiation at pure compressive deformation or stress.
Finally, the stress of the traction-separation model is computed according to
τ n = ( 1 D ) τ n if τ n > 0 τ n otherwise
τ s = ( 1 D ) τ s
τ t = ( 1 D ) τ t
where τ n , τ s and τ t are the effective stress components of the undamaged material computed by the elastic traction-separation law.

2.4. Methodology to Calibrate the Failure Properties from Experimental Measurements

The elastic properties of the aorta were fitted with the uniaxial tension tests data by using a Nelder and Mead type minimisation algorithm [25] defining the objective function χ 2 = Σ i = 1 n P θ θ P θ θ Ψ i 2 + P z z P z z Ψ i 2 using HyperFit software. (www.hyperfit.wz.cz, accessed on 31 March 2021). The tissue was assumed incompressible [26], i.e., det ( F ) = λ 1 λ 2 λ 3 = 1 , where F represents the deformation gradient tensor and λ i , i = 1 , 2 , 3 , the stretches in the principal directions. P θ θ and P z z are the First Piola-Kirchhoff (engineering) stress data obtained from the tests, and P θ θ Ψ = Ψ iso λ θ and P z z Ψ = Ψ iso λ z are the First Piola-Kirchhoff stresses for the ith point for a homogeneous pure uniaxial state Ψ . The normalised root mean square error, ε [ 0 , 1 ] , was computed for the fitting of the material model, following
ε = χ 2 n q ϖ ,
where ϖ = i = 1 n P i n is the mean value of the measured engineering stresses, n is the number of data points, q is the number of parameters of the SEF and, therefore, n q represents the number of degrees of freedom.
The normal values of cohesive properties δ 0 n , δ r n , τ n m a x , K n n and G 0 n were calibrated by an iterative fitting of the experimental measurements of the peeling and mixed tests. In each iteration, the values of peak and mean force of the computational modelling were compared to the experimental data until their difference was below 10%.

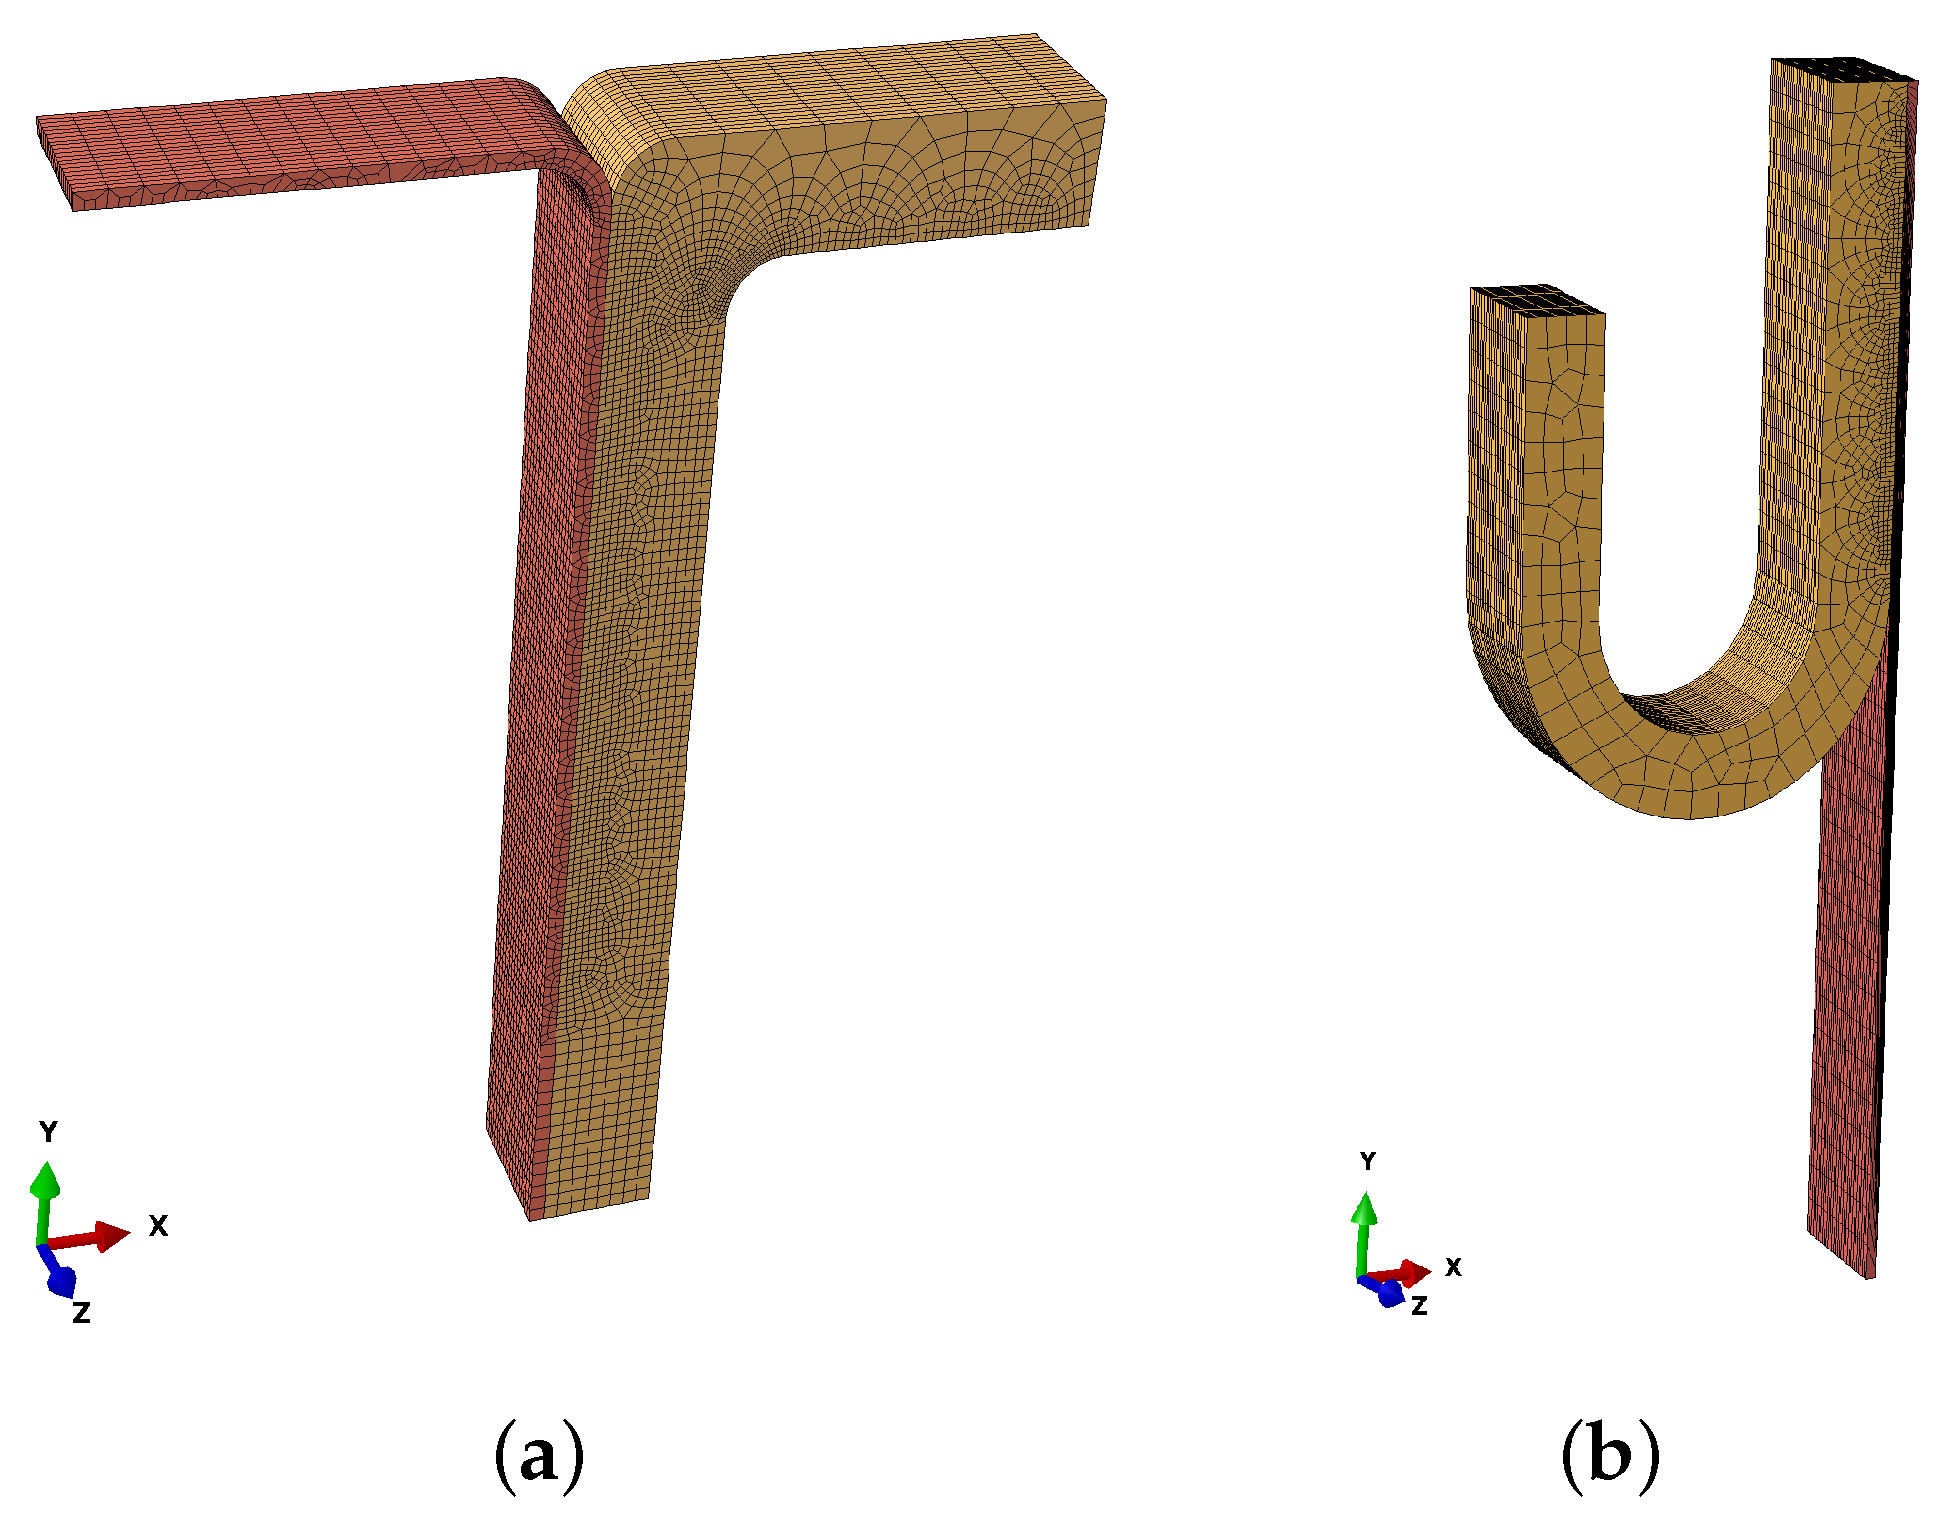
2.5. Numerical Implementation

The peel and mixed tests were used to identify the normal cohesive material parameters that model purely normal failure at the interface of IM, MA and M ( δ 0 n , δ r n , τ n m a x , K n n and G 0 n ). A cohesive zone was introduced in the interface to analyse, where tissue delamination was expected. A refined mesh in this contact area was needed in order to obtain appropriate results. A TSL was postulated [27], see Figure 1. The FE geometry was specific for each experimental strip. The total thickness of the specimens was measured and the ratio of thickness per layer was obtained from Peña et al. [20]. The corresponding interfaces were defined with the cohesive contact model previously presented and the models were meshed with hybrid eight-node linear bricks (C3D8H), see Figure 2. A mesh sensitivity analysis was performed in both models to achieve the compromise between accuracy and computational time. The dimensions and number of elements of each specimen are included in Table 1. The symmetry of the problem was taken into account and only half of the width of the specimens was modelled. The total length of the strips in all models was of 20 mm.
Regarding the boundary conditions, in the peel test, the non-separated end of the strip was fixed to avoid its movement as solid rigid, and in both flaps at the other end the same displacement was imposed in opposite directions, causing delamination at the interface of the layer. As for the mixed test, the inner surface of the intima of the specimen was fixed and a displacement loading parallel to the strip length was applied to the free end of the other layer, causing the desired delamination at the interface.
The FE model was computed with Abaqus/Standard v6.14. An iterative trial-error procedure was performed to fit the delamination properties of aorta layers. The mechanical data in terms of the load vs. displacement curve from peel and mixed tests was compared in each iteration. The displacements applied in the free surfaces were prescribed and the cohesive properties updated in order to fit the mean force recorded during the tests. The hyperelastic material model was implemented via the in-built material model in Abaqus. The preferred fibre directions were included manually in the input files. A static implicit analysis was carried out for all models, as the strips are pulled apart slow enough to exclude inertial effects.

3. Results

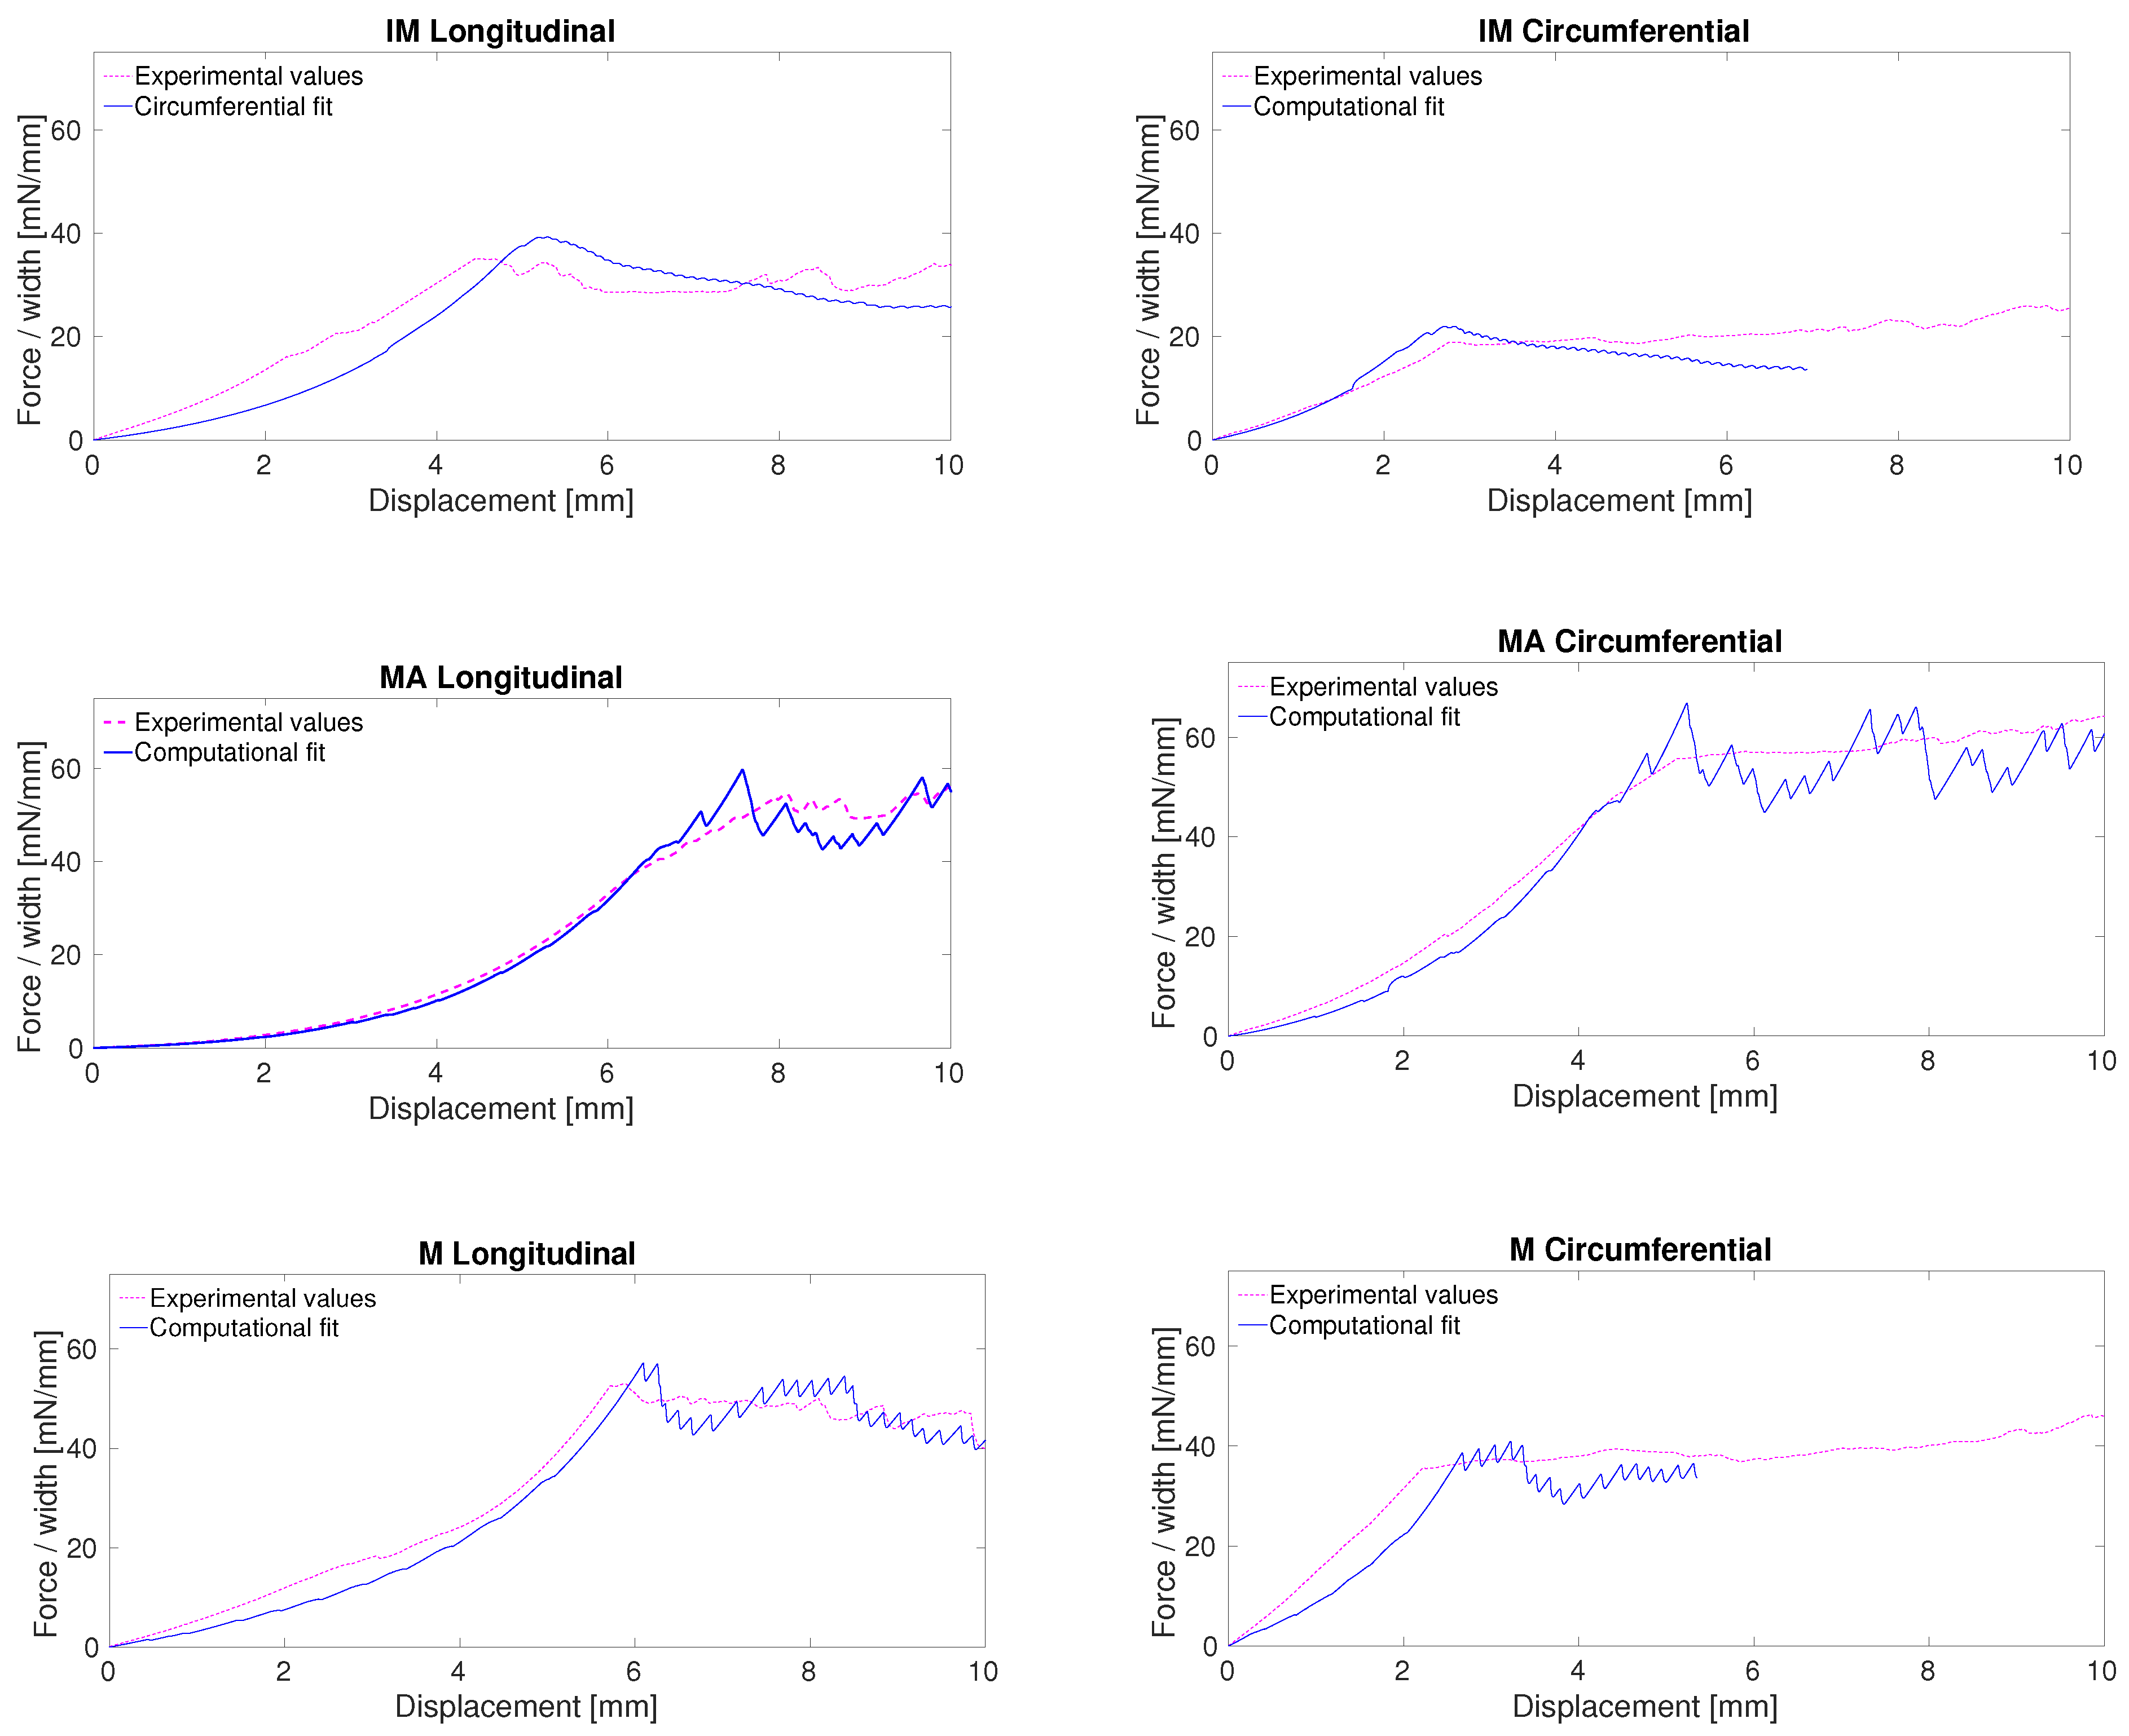
3.1. Elastic Properties of Aortic Tissue

The elastic mechanical data obtained by uniaxial tests experiments in each direction—longitudinal and circumferential—were fitted using the SEF represented in (1). The material constants resulting from the fitting to the SEF are shown in Table 2. The low value obtained of ε = 0.0652 demonstrates the goodness of the fitting.
Plots of the fitted stress-stretch behaviour for the longitudinal and circumferential directions, together with the underlying experimental data are depicted in Figure 3 for the constitutive law in (1).

3.2. Fracture Properties of Aortic Tissue

Several iterations were needed to identify the sets of constants ( τ n m a x , K n n and G 0 n ) that minimise the differences between the value of load vs. displacement curve obtained by the experimental peel and mixed tests and that obtained by the FE model. These parameters are presented in Table 3 and Table 4. The ranges of force achieved in the simulation could mostly be fitted by modifying the damage parameters τ n m a x and G 0 n . The parameter related to the cohesive behaviour K n n had a reduced impact in the level of force and was found to account for the convergence of the models.
In comparison with the experimental peel data of the interfaces intima-media, media-adventitia and media, the simulation using the fitted parameters is in good agreement with results with an error below 10 % , see Figure 4. The initial elastic part of the curves is well reproduced in all cases except for the MA separation in the circumferential direction. This part of the tests is mainly affected by the modelling of the material and the preferred fibre directions. Due to convergence issues, this test could not be computed for a clamp displacement of more than 2 mm per side. Damage properties shown in Table 3 are consistently lower in the circumferential direction than in the longitudinal direction in each interface. This is in accordance with the dissection in the circumferential direction reportedly being easier, as it can propagate separating lamellar layers and not tearing them [7]. Furthermore, damage properties are notably smaller in the dissection within the medial layer compared to the dissection of both interfaces. The cohesive behaviour K n n is similar in all cases.
In comparison with the experimental mixed data of the interfaces intima-media, media-adventitia and media, the simulation using the fitted parameters is in good agreement with results with an error below 10 % , see Figure 5. In this case, the initial elastic part of the curves is well reproduced in all cases. The modelling of the mixed test allowed for higher convergence, up to 10 mm of clamp displacement. All fitted parameters in this test shown in Table 4 are consistently higher than those obtained for the simulation of the peel test. The dissection of the IM provided the lowest damage parameters, in accordance with this separation presenting the lowest dissection forces. For the IM and M dissections, the longitudinal direction presented higher values in its properties than the circumferential direction. The effective displacement at complete failure, δ r n , is of around 0.1 mm in all cases. The cohesive behaviour K n n is the same in all cases, except for the IM separation in the longitudinal direction.

4. Discussion

Aortic dissection is an important cardiovascular pathology and its triggering mechanism and development mechanics are not fully comprehended. In particular, the delamination properties of aortic tissue, which could provide insight into the development of this disease, have been sparsely studied. To contribute to this field, in this study, we have numerically reproduced two tissue dissection tests—the peel and mixed tests—of porcine aorta specimens. These numerical studies allow obtaining different dissection parameters that characterise the behaviour of the tissue.
The experimental forces to be fitted are predominantly higher in the mixed test than in the peel test, with the exception of the separation of the intima-media in the circumferential direction, in which the mixed test obtained a lower dissection force. The dissection parameters obtained in all simulations of the mixed tests are notably higher—sometimes one order of magnitude—than those obtained in the peel tests. The main parameter that affects the reaction force of the simulations was τ n m a x and therefore is the one that varies most throughout the simulations. Ferrara and Pandolfi [18] had checked the relevant influence of this parameter in the numerical results of a dissection process. The marked difference between the parameters obtained in both types of simulations is not convenient. The small impact of the tangential components of the cohesive model in the mixed test simulations lead to the assumption that not all the damage phenomena are being captured in the simulations, which could lead to these differences. Moreover, the rupture stress obtained in the uniaxial tension tests was of 1090 and 660 kPa for the circumferential and longitudinal directions, respectively. The values of τ n m a x obtained in the mixed test models are more similar to these fracture stresses. This could also imply that the low values of these parameters in the peel test could be due to the specimens experiencing damage in the tissue and not the specific separation of layers.
This study reproduces the results of two different tests which were carried out once in each condition and therefore the numerical results depend completely in the data of only one repetition and do not account for the deviation present in the mechanical testing of biological tissues. However, the objective was not to determine the cohesive properties of the porcine descending aorta, but to develop two computational models that could perform such determination.
When compared to the literature, Leng et al. [15] reproduced computationally these same two tests for the separation of the medial layer of a porcine abdominal aorta. They established a τ n m a x of 440 kPa for both tests, which lies in the same order of magnitude of our results for the peel test. The energy rate they obtain however is higher—220 and 186 mN/mm for the mixed and peel test, respectively.
The complexity of the numerical models here presented entails some convergence issues. The simulation of contact and damage has always been a tricky challenge, even more when combined with hyperelastic anisotropic material models. Carrying out these computations with a static implicit analysis further hinders a full convergence of the models. In order to solve this matter, in future studies, these models are to be defined via a dynamic explicit analysis. As yet another future development, the cohesive model could be modified to include a more real contribution of shear stresses in the dissection properties of the tissue. An anisotropic damage model with a different dependence on the separation direction could probably provide a more uniform fitting for the peel and mixed tests.
This study has provided a calibrated methodology to obtain delamination properties of arteries. The characterisation of these properties is relevant to achieve a better understanding of the mechanical behaviour of vessels in general and of the process of aortic dissection in particular. Furthermore, numerical studies can benefit from this type of data to reproduce with more accuracy the physiology and pathology of the cardiovascular system.

Author Contributions

Conceived and designed the study: M.A.M. and E.P. Development of experiments: I.R.-R. and E.P. Computational implementation of model: I.R.-R. and M.C. Writing, review and editing: I.R.-R., M.C., M.A.M. and E.P. Funding acquisition, M.A.M. and E.P. All authors have read and agreed to the published version of the manuscript.

Funding

This research was funded by the Spanish Ministry of Science and Technology through research projects DPI2016-76630-C2-1-R and PID2019-107517RB-I00 and by the regional Government of Aragón through research project T24-20R and grant IIU/1408/2018.

Data Availability Statement

Not applicable.

Acknowledgments

The authors gratefully acknowledge research support from the University of Zaragoza for the use of the Servicio General de Apoyo a la Investigación-SAI. Part of the work was performed by the ICTS “NANBIOSIS” specifically by the Tissue & Scaffold Characterization Unit (U13), of the CIBER in Bioengineering, Biomaterials & Nanomedicne (CIBER-BBN at the University of Zaragoza). CIBER Actions are financed by the Instituto de Salud Carlos III with assistance from the European Regional Development Fund.

Conflicts of Interest

The authors declare no conflict of interest.

References

  1. World Health Organization. Global Health Estimates 2019: Global Health Estimates: Life Expectancy and Leading Causes of Death and Disability; Technical Report; World Health Organization (WHO): Geneva, Switzerland, 2020. [Google Scholar]
  2. Mikich, M. Dissection of the aorta: A new approach. Heart 2003, 89, 6–8. [Google Scholar] [CrossRef] [PubMed]
  3. Sherifova, S.; Holzapfel, G.A. Biochemomechanics of the thoracic aorta in health and disease. Prog. Biomed. Eng. 2020, 99, 1–17. [Google Scholar]
  4. Elefteriades, J.A. Thoracic aortic aneurysm: Reading enemy’s playbook. J. Biol. Med. 2008, 81, 175–186. [Google Scholar] [CrossRef] [PubMed]
  5. Erbel, R.; Alfonso, F.; Boileau, C.; Dirsch, O.; Eber, B.; Haverich, A.; Rakowski, H.; Struyven, J.; Radegran, K.; Sechtem, U.; et al. Diagnosis and management of aortic dissection: Recommendations of the Task Force in Aortic Dissection. Eur. Heart J. 2001, 22, 1642–1681. [Google Scholar] [CrossRef] [PubMed] [Green Version]
  6. Evangelista, A.; Isselbacher, E.M.; Bossone, E.; Gleason, T.G.; Eusanio, M.D.; Sechtem, U.; Ehrlich, M.P.; Trimarchi, S.; Braverman, A.C.; Myrmel, T.; et al. Insights From the International Registry of Acute Aortic Dissection. Circulation 2018, 137, 1846–1860. [Google Scholar] [CrossRef] [PubMed]
  7. Sommer, G.; Gasser, T.C.; Regitnig, P.; Auer, M.; Holzapfel, G.A. Dissection Properties of the Human Aortic Media: An Experimental Study. J. Biomech. Eng. 2008, 130, 021007. [Google Scholar] [CrossRef]
  8. Sommer, G.; Sherifova, S.; Oberwalder, P.; Dapunt, O.; Ursomanno, P.; De Anda, A.; Griffith, B.; Holzapfel, G.A. Mechanical strength of aneurysmatic and dissected human thoracic aortas at different shear loading modes. J. Biomech. 2016, 49, 2374–2382. [Google Scholar] [CrossRef] [Green Version]
  9. Pasta, S.; Phillippi, J.A.; Gleason, T.G.; Vorp, D.A. Effect of aneurysm on the mechanical dissection properties of the human ascending thoracic aorta. Thoracic Cardiovasc. Surg. 2012, 143, 460–467. [Google Scholar] [CrossRef] [Green Version]
  10. Angouras, D.C.; Kritharis, E.; Sokolis, D. Regional distribution of delamination strength in ascending thoracic aortic aneurysms. J. Mech. Behav. Biomed. Mater. 2019, 98, 58–70. [Google Scholar] [CrossRef]
  11. Pasta, S.; Phillippi, J.A.; Tsamis, A.; D’Amore, A.; Raffa, G.M.; Pilato, M.; Scardulla, C.; Watkins, S.C.; Wagner, W.R.; Gleason, T.G.; et al. Constitutive modeling of ascending thoracic aortic aneurysms using microstructural parameter. Med. Eng. Phys. 2016, 38, 121–130. [Google Scholar] [CrossRef] [Green Version]
  12. Sassani, S.G.; Tsangaris, S.; Sokolis, D.P. Layer- and region-specific material characterization of ascending thoracic aortic aneurysms by microstructure-based models. J. Biomech. 2015, 48, 3757–3765. [Google Scholar] [CrossRef] [PubMed]
  13. Manopoulos, C.; Karathanasis, I.; Kouerinis, I.; Angouras, D.; Lazaris, A.; Tsangaris, S.; Sokolis, D. Identification of regional/layer differences in failure properties and thickness as important biomechanical factors responsible for the initiation of aortic dissections. J. Biomech. 2018, 80, 102–110. [Google Scholar] [CrossRef]
  14. Amabili, M.; Arena, G.O.; Balasubramanian, P.; Breslavsky, I.D.; Cartier, R.; Ferrari, G.; Holzapfel, G.A.; Kassab, A.; Mongrain, R. Biomechanical characterization of a chronic type a dissected human aorta. J. Biomech. 2020, 110, 109978. [Google Scholar] [CrossRef]
  15. Leng, X.; Zhou, B.; Deng, X.; Davis, L.; Lessner, S.M.; Sutton, M.A.; Shazly, T. Experimental and numerical studies of two arterial wall delamination modes. J. Mech. Behav. Biomed. Mater. 2018, 77, 321–330. [Google Scholar] [CrossRef] [PubMed]
  16. FitzGibbon, B.; McGarry, P. Development of a test method to investigate mode II fracture and dissection of arteries. Acta Biomat. 2021, 121, 444–460. [Google Scholar] [CrossRef] [PubMed]
  17. Gasser, T.C.; Holzapfel, G.A. Modeling the propagation of arterial dissection. Eur. J. Mech. Solids 2006, 25, 617–633. [Google Scholar] [CrossRef]
  18. Ferrara, A.; Pandolfi, A. A numerical study of arterial media dissection processes. Int. J. Fract. 2010, 166, 21–33. [Google Scholar] [CrossRef]
  19. Noble, C.; van der Sluis, O.; Voncken, R.M.; Burke, O.; Franklin, S.E.; Lewis, R.; Taylor, Z.A. Simulation of arterial dissection by a penetrating external body using cohesive zone modelling. J. Mech. Behav. Biomed. 2017, 71, 95–105. [Google Scholar] [CrossRef]
  20. Peña, J.A.; Martínez, M.A.; Peña, E. Layer-specific residual deformations and uniaxial and biaxial mechanical properties of thoracic porcine aorta. J. Mech. Behav. Biomed. 2015, 50, 55–69. [Google Scholar] [CrossRef]
  21. Gasser, T.C.; Ogden, R.W.; Holzapfel, G.A. Hyperelastic modelling of arterial layers with distributed collagen fibre orientations. J. R. Soc. Interface 2006, 3, 15–35. [Google Scholar] [CrossRef]
  22. Spencer, A.J.M. Theory of Invariants. In Continuum Physics; Academic Press: New York, NY, USA, 1971; pp. 239–253. [Google Scholar]
  23. Forsell, C.; Gasser, T.C. Numerical simulation of the failure of ventricular tissue due to deeper penetration, the impact of constitutive properties. J. Biomech. 2011, 44, 45–51. [Google Scholar] [CrossRef] [PubMed]
  24. Lemaitre, J. A continuous damage mechanics model for ductile fracture. J. Eng. Mater. Tchnol. 1985, 107, 83–89. [Google Scholar] [CrossRef]
  25. Nelder, J.A.; Mead, R. A simplex method for function minimization. Comput. J. 1965, 7, 308–313. [Google Scholar] [CrossRef]
  26. Carew, T.E.; Vaishnav, R.N.; Patel, D.J. Compressibility of the arterial wall. Circ. Res. 1968, 23, 61–86. [Google Scholar] [CrossRef] [Green Version]
  27. Hernández, Q.; Peña, E. Failure properties of vena cava tissue due to deep penetration during filter insertion. Biomech. Model. Mechanobiol. 2016, 15, 845–856. [Google Scholar] [CrossRef] [PubMed]
Figure 1. Traction Separation Law considered. The cohesive strength σ m a x , the initial (reversible) interface displacement δ 0 and the maximum cohesive displacement, δ r , are parameters to be defined.
Mathematics 09 01593 g001
Figure 2. FE models of delamination experimental tests (a) Peel test and (b) Mixed test. Both models represent the IM separation. The thinner copper-coloured parts represent the intimal layer and the thicker brass-coloured parts, the media and adventitia.
Mathematics 09 01593 g002
Figure 3. Experimental data of uniaxial tension tests and computational fitting obtained with the proposed constitutive law.
Mathematics 09 01593 g003
Figure 4. Correlation between force/width vs. displacement curves and computation of the peel test of the interfaces intima-media, media-adventitia and media for longitudinal and circumferential directions.
Mathematics 09 01593 g004
Figure 5. Correlation between force/width vs. displacement curves and computation of the mixed test of the interfaces intima-media, media-adventitia and media for longitudinal and circumferential directions.
Mathematics 09 01593 g005
Table 1. Dimensions and number of elements of each model.
SpecimenWidth [mm]Thickness [mm]Number of Elements
Peel
test
IM4.01.7050,340
MA4.02.0054,700
M4.02.1057,040
Mixed
test
IM5.01.5725,265
MA4.82.3020,370
M5.02.0027,962
Table 2. Material parameters obtained from the uniaxial stress-stretch curves. Constants μ and k 1 in kPa, θ in degrees, k 2 , κ and ε dimensionless.
μ [kPa] k 1 [kPa] k 2 [ ] κ [ ] θ [ ] R 2 ε
18.0606504.906044.84620.24299350.98930800.0652
Table 3. Normal cohesive material parameters obtained by the fitting of the peel test and used to model normal failure at the interface.
Interface δ 0 n δ r n τ n max K nn G 0 n
[mm][mm][kPa][mN/mm 3 ][mN/mm]
IMLongitudinal0.0230.07023010,0008
Circumferential0.0140.10020014,00010
MALongitudinal0.0190.08618510,0008
Circumferential0.0200.06316080005
MLongitudinal0.0130.09213010,0006
Circumferential0.0100.1008080004
Table 4. Normal cohesive material parameters obtained by the fitting of the mixed test and used to model normal failure at the interface.
Interface δ 0 n δ r n τ n max K nn G 0 n
[mm][mm][kPa][mN/mm 3 ][mN/mm]
IMLongitudinal0.0400.10080020,00040
Circumferential0.0340.07355016,00020
MALongitudinal0.0780.104125016,00065
Circumferential0.0880.107140016,00075
MLongitudinal0.0810.100130016,00065
Circumferential0.0750.100120016,00060
Publisher’s Note: MDPI stays neutral with regard to jurisdictional claims in published maps and institutional affiliations.

