Article

Research on the Factors of Competition in the Green Procurement Processes: A Case Study for the Conditions of Romania Using PLS-SEM Methodology

1
Faculty of Management, Bucharest University of Economic Studies, 010374 Bucharest, Romania
2
Faculty of Business Administration in Foreign Languages, Bucharest University of Economic Studies, 010374 Bucharest, Romania
*
Author to whom correspondence should be addressed.
Mathematics 2021, 9(1), 16; https://doi.org/10.3390/math9010016
Submission received: 26 October 2020 / Revised: 13 December 2020 / Accepted: 21 December 2020 / Published: 23 December 2020
(This article belongs to the Special Issue Mathematical Analysis in Economics and Management)

Abstract

:
In this paper, starting from the conceptual model of the rational behavior theory developed by Icek Ajzen, the authors develop a behavioral model of rational expectations of the managerial decisions in order to determine the influence of the behavior of the undertakings on a competitive environmental market. The data were collected between 1 May 2019–30 June 2019 with the help of a questionnaire addressed to the employees and managers of the companies engaged in the green procurement processes in Romania. The sample volume was 160 and the data was analyzed with partial least square structural equation modeling (PLS-SEM) method and by using the statistical software Smart-PLS 3.2.8. Starting from the relevant economic literature in the field of rational behavior, the article identifies the behavioral indicators that underlie the decision to invest in this market. These indicators are the independent variables that model the impact of rational behavioral theory on managerial decisions. The conclusions of the study confirm the theoretical aspects presented in the article, emphasizing that the managerial decisions based on rational behavior theory are the direct result of the cooperation of several factors, such as the strategic vision, innovation, regulation, and the level of competences of the human factor.

1. Introduction

The threats of the 21st century are perceived, mainly, by the occurrence of climate change, mainly due to the industrial policies applied worldwide. An approach focused on qualitative development, supported by research and innovation projects, in order to improve the quality of environmental factors, commensurate with specific indicators of sustainable development, has a favorable impact, implicitly, on the quality of life, improving environmental conditions and, not last, on the efficiency of resource productivity.
If, on an international level, the degree of awareness of environmental hazards could vary from state to state, depending on the accession to the United Nations Convention on Climate Change, within the European Union (EU), awareness of this theory is reflected in policy developments environment, where the recommendations for introducing environmental provisions in the specifications of the public procurement have become obligatory, through the legislative packages adopted by the European forum.
The basic principles of the free movement of goods, services, capital, and persons are laid down in the Treaty on the Functioning of the European Union. These principles have been used in the field of public procurement, in the form of transparency, competition, equal treatment, proportionality, and mutual recognition, as set out in the case law of the Court of Justice of the European Union. From an international perspective, the European Union applies the provisions of the Agreement on public procurement of the World Trade Organization, as well as bilateral trade agreements concluded with third countries.
Due to environmental policy considerations, the legal criteria for green procurement have been introduced in the last two decades by the European Commission [1], to regulate the internal market. Regarding the terminology of green procurement, these were defined, in the specific legislation, as “products, services or works purchased through specific procedures, which have a reduced impact on the environment” [2]. The public procurement directives [3,4,5], adopted in 2014, allow public authorities to take environmental considerations into account when launching public procurement procedures. Selection rules ensure compliance with environmental protection legislation, by introducing specific criteria, which concern, for example, the efficiency of the product life cycle and sustainable production processes. European legislative packages introduce ambitious goals for public authorities to contract green procurement. At their bottom lines, we find impact studies that evaluated the benefits and costs of different policy options aimed at increasing the quantitative and qualitative level of green procurement in EU Member States. Thus, four policy options were analyzed, equivalent to four scenarios, ranging from a ‘traditional’ approach, to establishing additional coordination and control measures, as a result of understanding the need for large-scale involvement of contracting authorities, including those in Member States with a lower level of absorption of European funds for green procurement. This vision led to the setting of mandatory ceilings for contracting green purchases, imposed on public authorities [6].
Studies done in the Member States of Central and Western Europe indicate an accelerated trend of taking over the sustainable development objectives in the systems of public governance, an example being the case of Italy, which aims to apply the recommendations of sustainable development in the money market, capital, and in the insurance sector [7].
However, the sustainable development indicators for Romania should be compared with those specific to the countries of Central and Eastern Europe, because these states had similar development conditions, at least from the point of view of natural resources, climatic conditions and a history marked by the same challenges, after World War II.
In the last decade, there is an accelerated rhythm of awareness and learning at the national level, reinforced by recent legislative developments in the field. Starting with 2007, the year of EU integration, Romania has adopted the European legislation in the field of public procurement, introducing for the first time the criteria for green procurement. The European regulations, transposed at national level, aim to better include environmental and social responsibility and innovation considerations in the public procurement process.
We refer to the provisions of Law no. 69/25.04.2016 regarding green public procurement, respectively, Order no. 1652/15.10.2018 [8] for the approval of the Guide for green public procurement, which defines the national legal framework in the field of green procurement, which includes the minimum environmental protection demand for certain groups of products and services included in the specifications. To these two regulations, there is added the legislative project regarding the “National Plan for Green Procurement”, which will introduce for the Romanian public institutions and authorities the imperative of green procurement, in a minimum percentage of the total public procurement, in the spirit of sustainable economic thinking. Sustainable development goals, including ‘green procurement’, are important milestones that could underpin the administrative system initiatives.
In Romania, companies could opt for green procurement to reduce their environmental impact. Through the use and commercialization of green products, the companies not only green these activities, but they also transfer this effect to their supplier requesting them green products, and these, instead, could pass their preference for green products to the suppliers, promoting, in this way, sustainable development to a larger scale. Green procurement could be adopted by both public and private companies, in the first case being labeled as green public procurement (GPP). GPP was defined as:
“a process whereby public and semi-public authorities meet their needs for goods, services, works and utilities by seeking and choosing outcomes and solutions that have a reduced impact on the environment throughout their whole life-cycle, as compared to conventional products/solutions. A procurement procedure will be considered as ‘green’ only if it has led to the purchase of a substantively ‘greener’ product and only if the environmental characteristics of this product go beyond what needs to be complied with on the basis of European or national environmental legislation.”
[5]
International authorities, such as the EU, the UN or EU member states, guide sustainable procurement, addressing the three lines of sustainability [4]. In Romania, for example, “The guide for green public procurement that includes the minimum requirements regarding the environmental protection for certain groups of products and services that are required in the specifications” was approved in October 2018 [8]. The GPP guide contains minimum requirements for environmental protection for priority product groups and/or services: new indoor and outdoor furniture, copy and graphic paper, collection, furniture reconditioning services, and reuse services for the furniture at the end of the lifecycle, transport vehicles, food and catering services, IT equipment and office cleaning products and services.
The aim of this study is to develop a behavioral model of rational expectations in the green procurement market, in order to determine the influence of the behavior of the undertakings on a competitive environmental market. To achieve this goal, a partial least square structural equation modeling (PLS-SEM) method was applied and the statistical software Smart-PLS 3.2.8 was used.
This paper is structured as follows. Firstly, we discuss the impact of green procurement on competition as it was reflected in the economic literature. After that, the research hypotheses are presented and tested. The PLS-SEM model is used to analyze the conceptual structural model based on a survey questionnaire. Discussions, limitations of the study, and further research are summarized in the last chapter of the paper.

2. Impact of Green Procurement on Competition, Reflected in the Economic Literature and the Hypotheses Development

The economic literature on modeling the ecological procurement processes according to specific variables, such as competition indicators, highlights, above all, the conceptual side of fundamental research [9].
Green procurement is reflected in the literature from the perspective of environmental factors and management strategies for increasing economic performance [10]. The basis of the green acquisitions’ decisions can be influenced by the degree of knowledge and awareness of the need to reduce the impact on the environment [11], by the specific regulations and the application by the central or local public authorities [12] as well as the size of companies using resource reintegration programs, resulting from exploitation through innovative processes and technologies [13] without the list of these determinants being exhaustive.
Contracting green procurement within public procurement procedures is possible when evaluating bids takes into account both qualitative factors, such as environmental criteria, and quantitative factors, such as the minimum price criterion. In most cases, however, the contracting authority is tempted to evaluate the offers according to the budgetary constraints, which prevail over the qualitative factors. For these reasons, innovative products that reduce the impact on the environment can be subject to public procurement only when the selection criteria exceed the quantitative considerations.
At the same time, the participation of a large number of bidders in the green procurement procedures has the effect of increasing the competitive pressure and, consequently, the decrease of the price related to the bids submitted by the competitors. Therefore, public entities organizing public procurement procedures should be aware of competition regulations.
Green procurement cannot be an effective tool used in environmental policy, if it does not comply with the competition rules, indicating on the risks associated with direct procurement, participating in the procurement procedures of a limited number of bidders and cooperation within the associations participating in auctions. Although they could be justified in certain situations where the value of the contract would be below the legal thresholds for public procurement or would be exempted according to the national law specific to public procurement, the use of non-competitive procurement procedures, such as direct procurement, should be eliminated in all other situations.
Competition is manifested in conducting the selection procedures for green procurement, respectively within the open tender, the restricted auction, the competitive negotiation, the competitive dialogue and the partnership for innovation. The most indicated procedural forms, which offer the advantage of the flexibility to introduce innovative elements with beneficial effects on the environment, are considered the negotiation and the competitive dialogue [14]. Regardless of the procedural advantages offered, the process of purchasing goods, services or works through any of these procedures allows the participation of several suppliers, on a non-discriminatory basis, in conditions of free competition.
Another important aspect in determining the degree of competition, concerns the particularities of the relevant product market.
Depending on the type of product offered, green procurement may be subject to:
  • contracts for the acquisition of goods, in which case the selection of offers will take into account the life cycle of the product, respectively the opportunities for reuse of the goods offered, specific to the circular economy and the impact of the re-use process on the environment;
  • service provision contracts, by contracting the technical expertise in the field of environmental protection, and;
  • works contracts, which should be based on impact studies on the quality of environmental factors.
Thus, given the particularities of green procurement, the complexity of the selection criteria could act as a restrictive barrier for the potential bidders, competitors on the market, which are able to fulfil the requirements requested in the technical specifications. At the same time, the criterion of transparency can induce predictability in the public procurement procedures, which could lead to an alignment of the offers, by presenting the same detailed elements in the technical specifications. The participation of a large number of bidders in the green procurement selection procedures is beneficial for the contracting entities in terms of a reduced price, better quality, and high degree of innovation. By contrast, participation of a relatively small number of bidders or participating in green procurement procedures in association of companies has the potential to restrict competition, if the participants make agreements on the value of their bids, their volume or on other commercial elements that would could make it predictable to win bids in favor of a participant or an association, as a result of engaging in an anti-competitive practice.
Obviously, when the organizers of the procurement procedures are governmental authorities, poor competition would be equivalent to inefficient use of public funds. In this respect, in full agreement with the European regulations, the CJEU jurisprudence, the national Competition Law [15] and the national jurisprudence, the participation with bids tendered through bidding agreements or practices to manipulate the offered price or value is a form of anticompetitive behavior, which violates the competition rules. The specific characteristics of such collusive behavior can be manifested, in particular, when the market is stable, respectively the products or services offered are homogeneous and there are no major fluctuations of the demand on the market for new ecological, innovative products. Therefore, in the absence of specific contextual situations, the general risk associated with anti-competitive behavior on the Romanian market of green procurement can be relatively reduced, considering that, at this moment, the market of green procurement in Romania is present in a dynamic evolution, less predictive, which does not favor the agreements between the participants, the investments related to innovation playing an essential role [16].
The models of sustainable economic governance follow a reduction of the expenses, due to economies of scale, by accumulating several aspects of economic policy, social responsibility, environmental protection, and competition. Practicing these models of conduct on the market gives credibility to the entities, beneficiaries of green purchases, by the high capacity to respond to the needs of the consumer, continuously and determinedly.
In order to perform an economic modeling of the rational behavior in modeling the impact of green procurement on competition, the following six statistical hypotheses, derived from literature, were formulated:
Hypothesis 1 (H1). 
The strategic vision of the companies involved in the green procurement processes has a positive impact on the competition;
Hypothesis 2 (H2). 
Government regulatory policies regarding green procurement have a strong impact on competition;
Hypothesis 3 (H3). 
The level of skills in green procurement has a positive influence on the competition;
Hypothesis 4 (H4). 
The integrated operational management of the companies involved in the procurement processes has a positive impact on the competition;
Hypothesis 5 (H5). 
The social responsibility of the organizations involved in the green procurement processes has a significant impact on the competition;
Hypothesis 6 (H6). 
The degree of innovation of the companies involved in the green procurement processes is strongly correlated with the degree of competition.

3. Econometric Analysis of the Behavioral Model

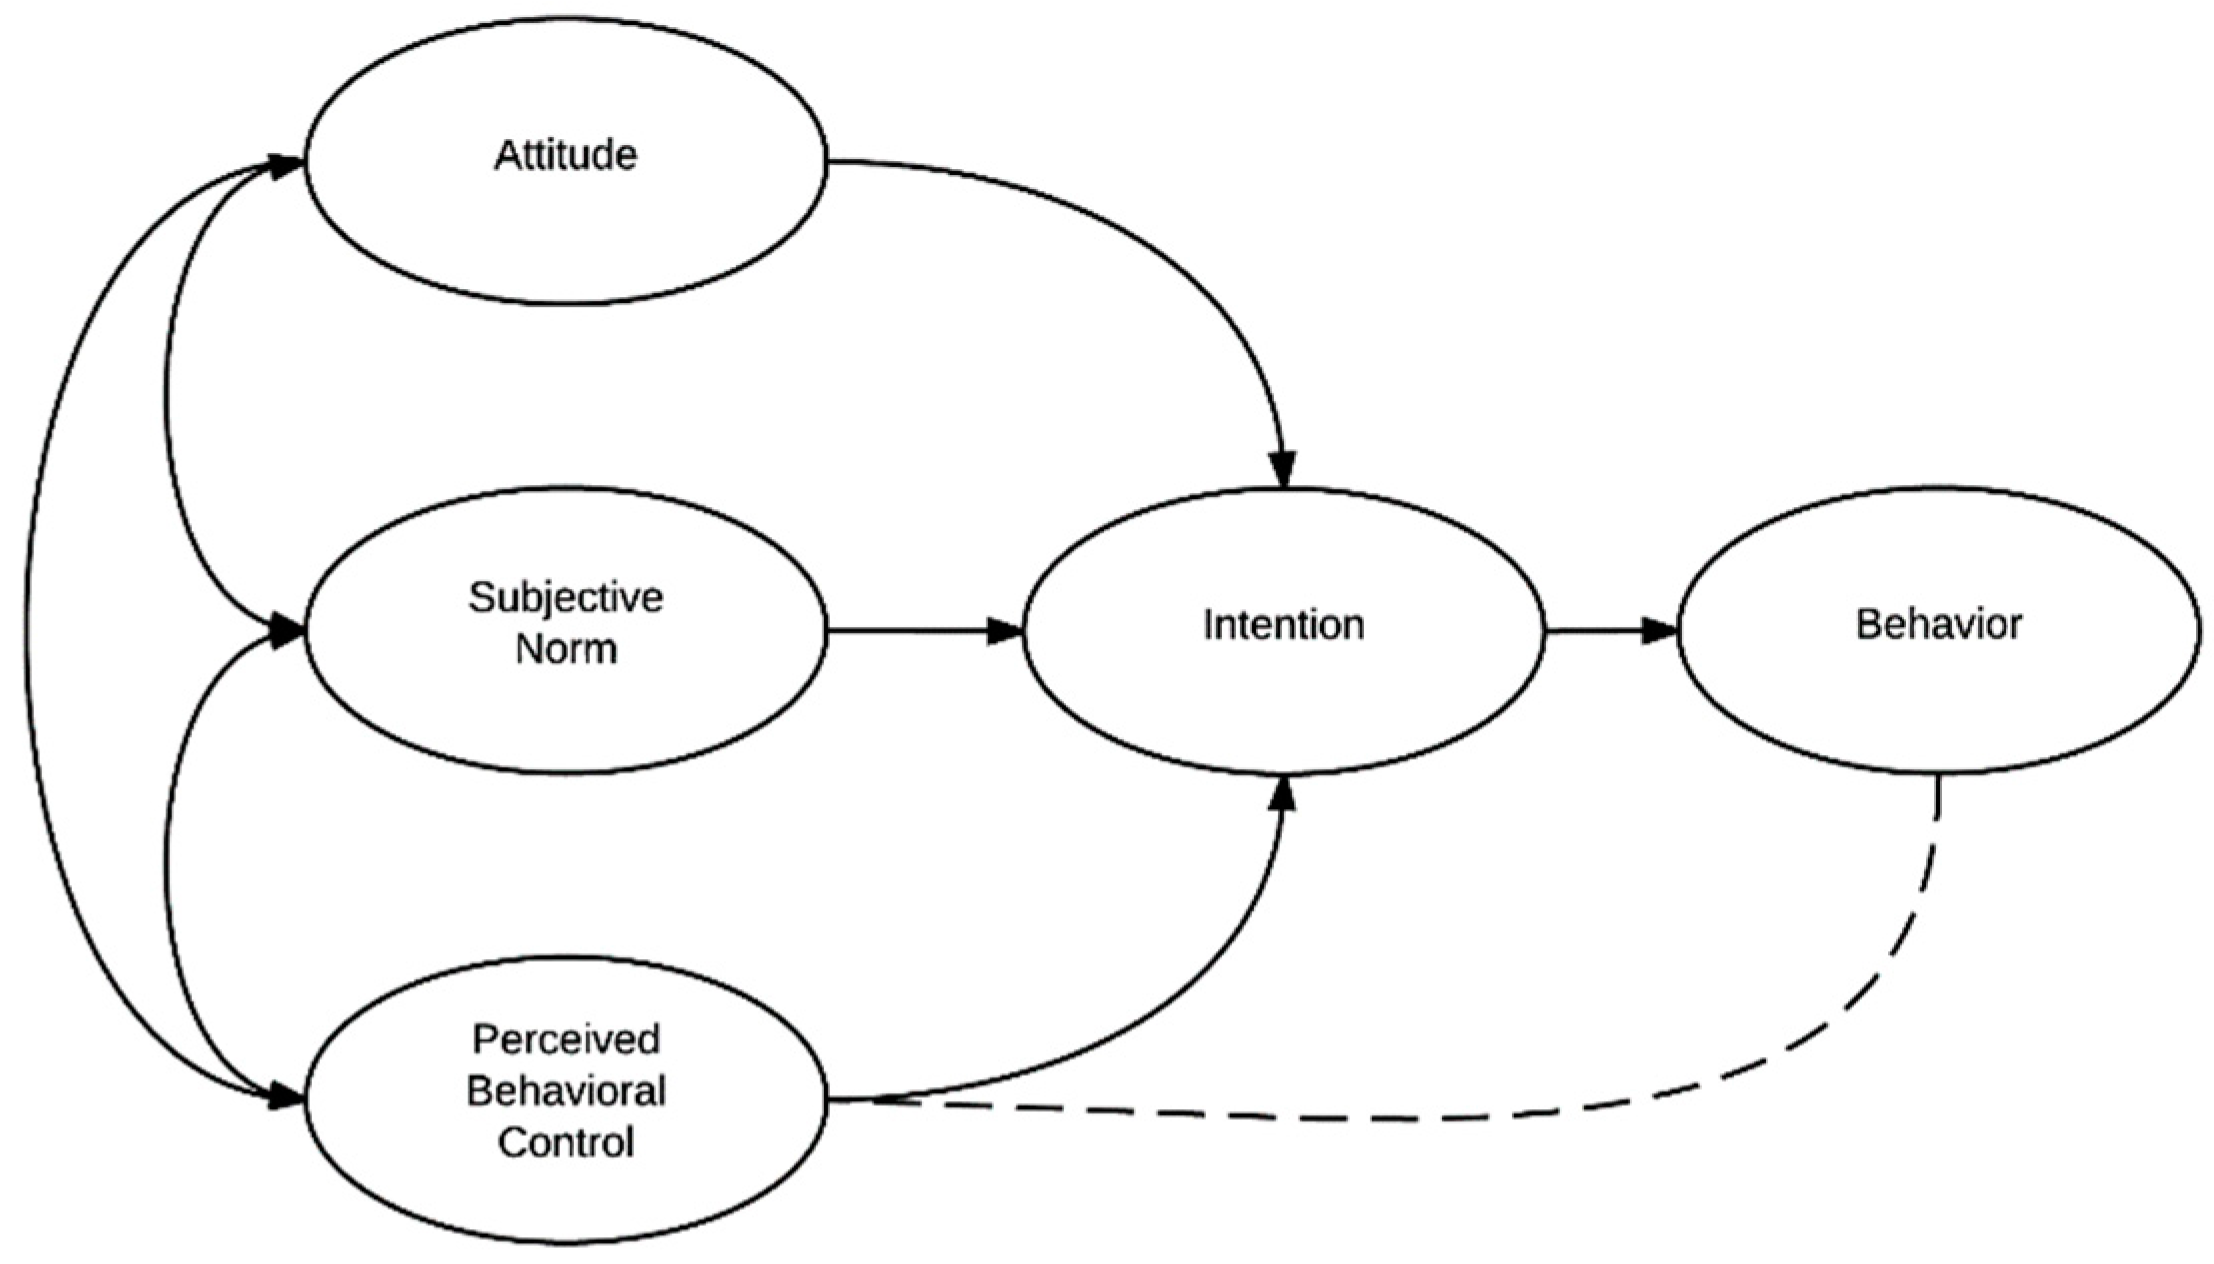
3.1. Theory of Rational Behavior in Economic Modeling

The concept of rational behavior was firstly used in the theory of rational choices by neoclassical economists. Thus, the contribution of the scientist William Stanley Jevons [17] on the theory of marginal value, together with similar findings of economists Carl Menger [18] and Léon Walras [19] marked the opening of a new period in the history of economic thought. According to this theory, the process of selection of each individual is determined by the desire to maximize the objective pursued, regardless of the purpose itself.
Advocates of this type of models, such as representatives of the Chicago School of Economics, argue that reality can be modeled by formulating hypotheses that can be verified by empirical testing [20].
The theory of rational choice has acquired new valences in socio-psychology, an example being conferred by the theory of rational behavior, developed by Icek Ajzen in 1967 (see Figure 1). Individual decisions, extended at the organizational level, assume a certain behavior, which is based on the expected results.
Modeling the economic process, in this context, can introduce specific indicators of sustainable development, in order to maximize them. The decision to invest in ecological projects can be validated by economic modeling based on a set of hypotheses, which will be presented below.

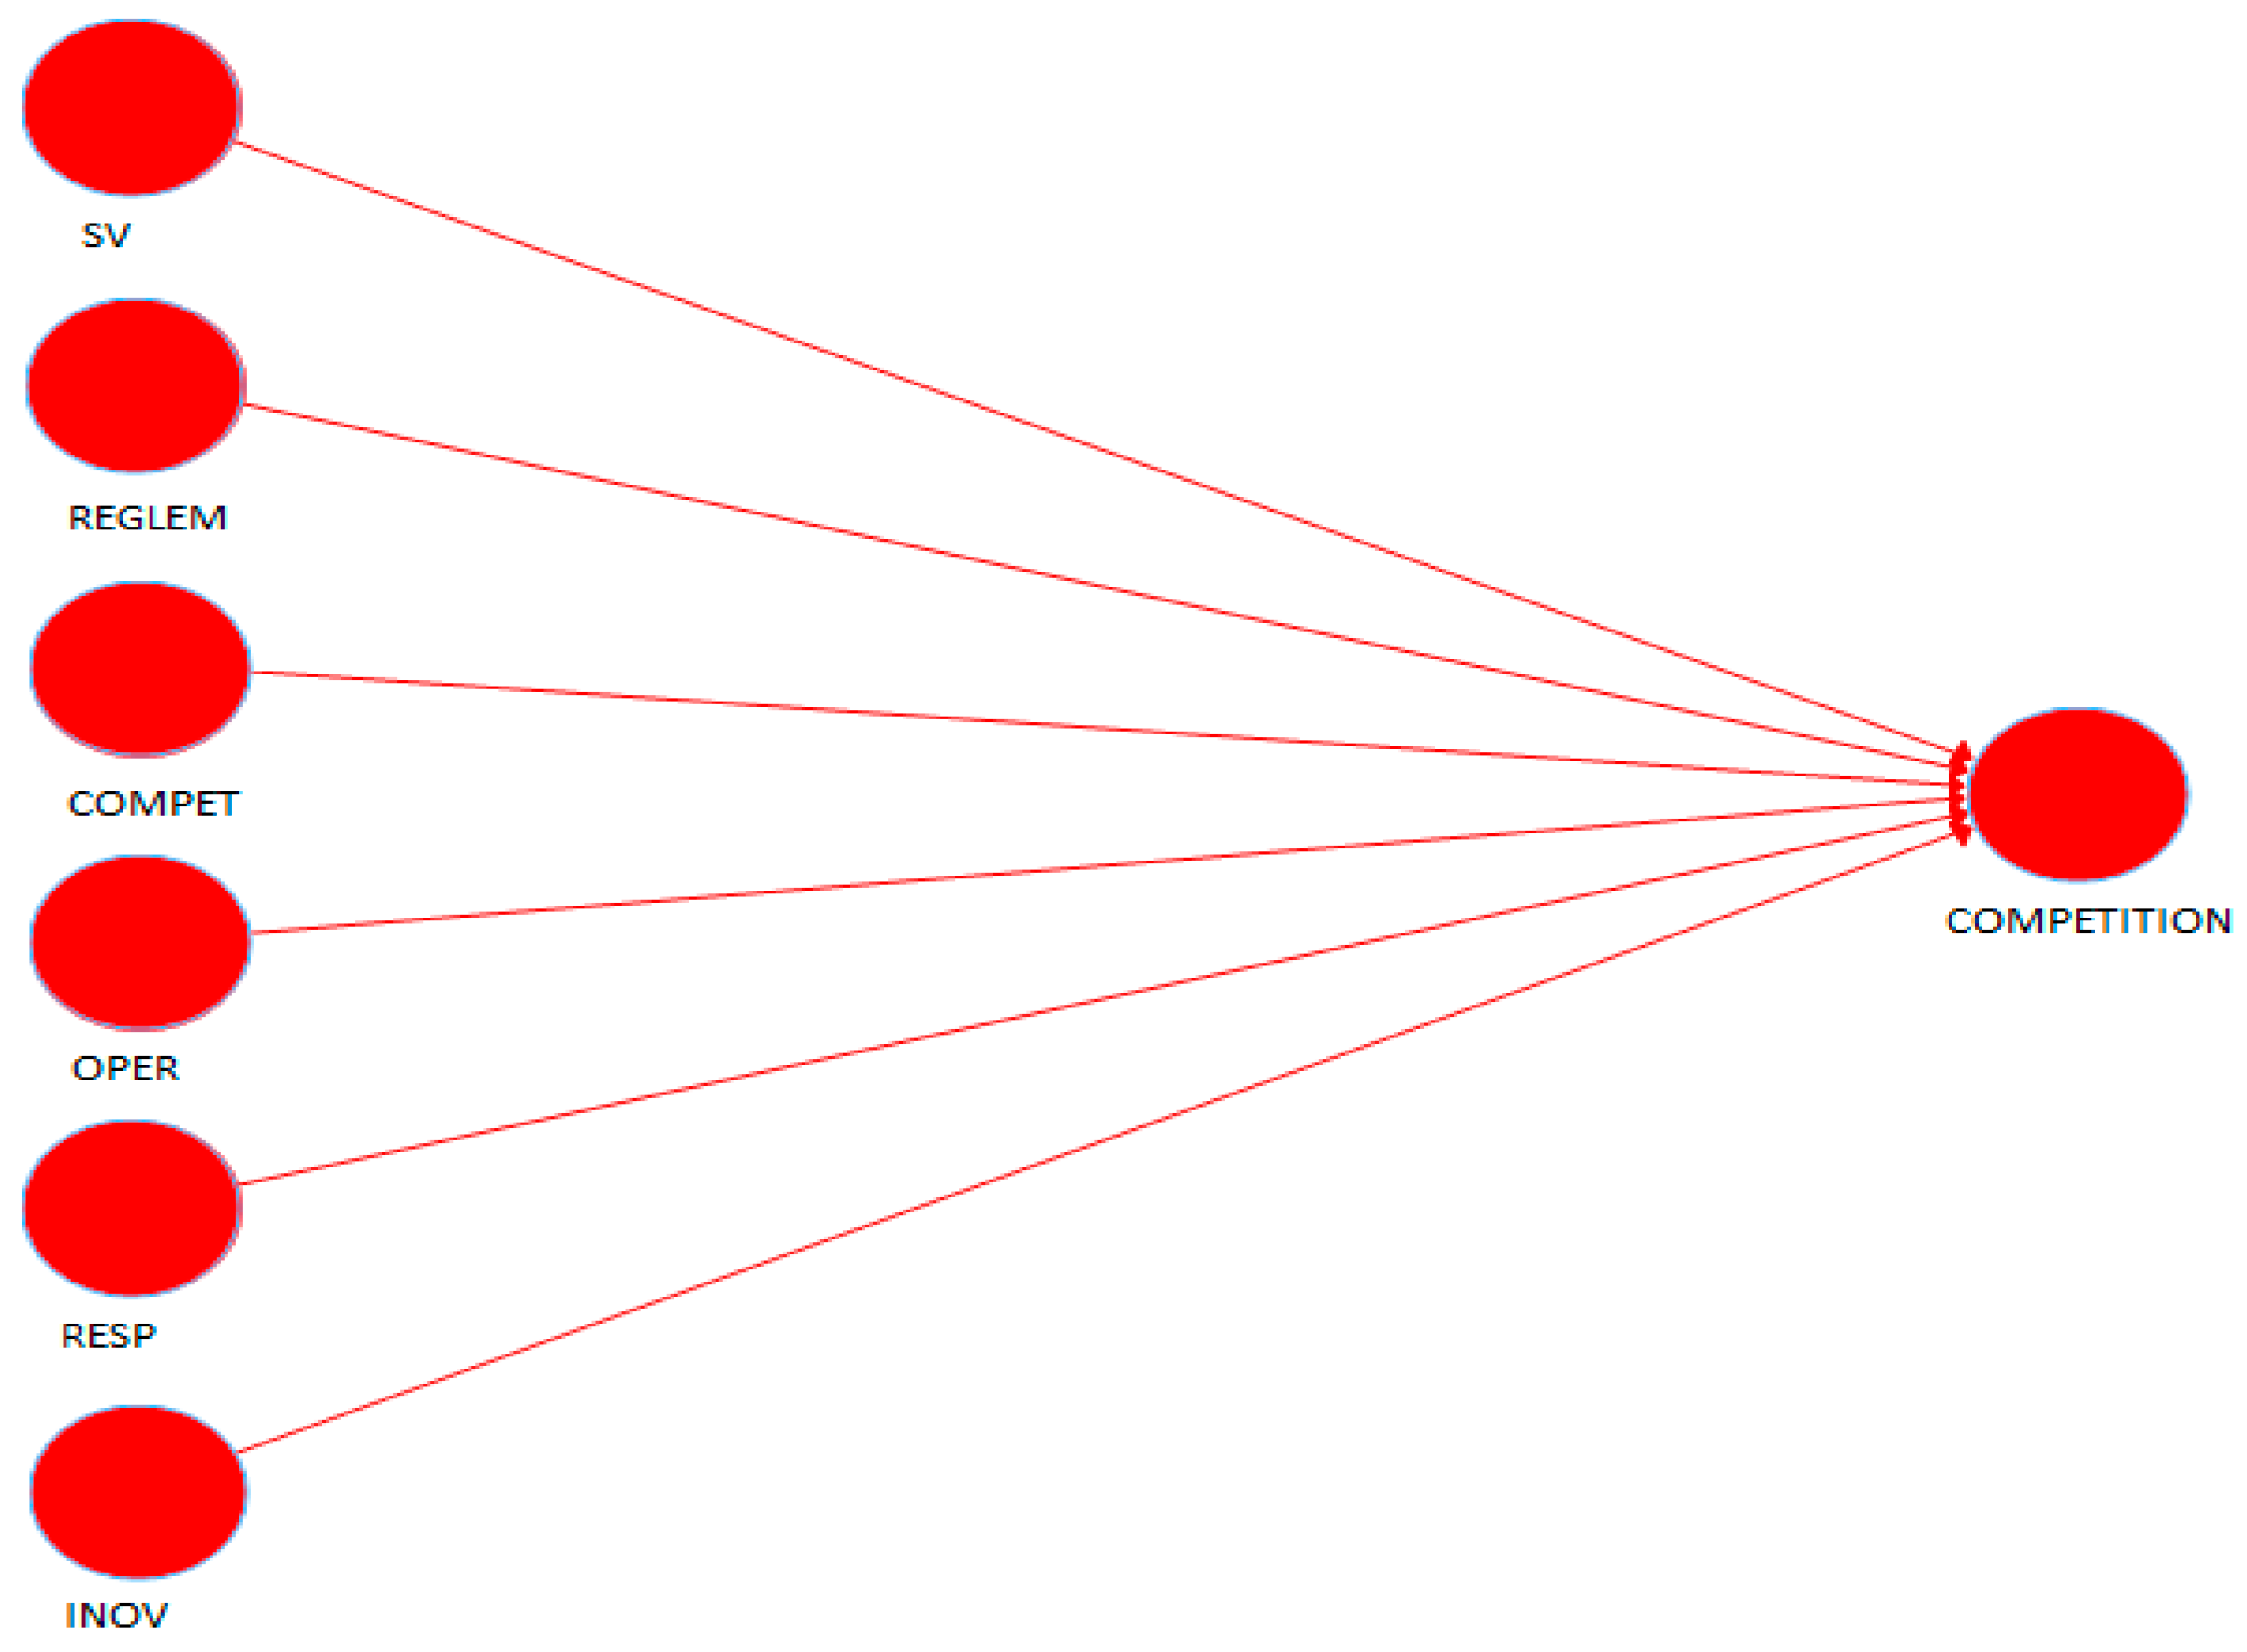
3.2. Research Methodology

The objective of this paper is to validate the conceptual model by quantitative econometric analysis of the data collected from the companies involved in green procurement in Romania. The study also analyzes the impact of the quantitative model, represented by the strategic vision, regulation and the level of competences, the integrated operational management, the social responsibility, and the degree of innovation on the competition.
The data was collected with the help of a questionnaire which was addressed to the managers and employees of the companies that invested in green projects. The companies were selected proportionally to their size. According to [22], the sample volume was calculated by multiplying the number of indicators by a value between 5 and 10. Thus, the sample should be at least 23 (indicators, see Table 1) × 5 = 115 respondents. Thus, data was collected from 150 questionnaires out of which 140 were valid. The answer variants for the questions in the questionnaire were either binary (No = 0, Yes = 1), or using a seven-point Likert scale, where the answer variants ranged from “very little = 1” to “very much = 7 “. The questionnaire has been pre-tested to ensure that the format, language, and order of the questions are appropriate.
In the past decades, for the complex analysis between the latent and observed variables covariance-based structural equation modeling (CB-SEM) method was used. Moreover, by 2010 more scientific papers used CB-SEM instead of PLS-SEM in their analysis. In the past few years, the number of published papers using CB-SEM was overpassed by the number of papers using PLS-SEM [23]. In fact, PLS-SEM is now used in many research papers in statistics, including statistical distributions [24], biostatistics [25], financial statistics and econometrics [26], sample surveys [27], machine learning [28], and time series analysis [29]. Several edited volumes [30,31], textbooks [32,33], and scholarly journals [34,35] illustrate PLS-SEM methodology or purpose extensions of it.
The PLS-SEM method is widely used to research papers which re estimating complex models with several constructs, structural paths and indicator variables without imposing assumptions on the distribution of the data. Moreover, PLS-SEM is an approach of SEM based on causal-prediction estimations of the statistical models [36,37]. Other authors [38,39,40] provide detailed discussions and arguments related to why and when to use PLS-SEM methodology.
The PLS-SEM method was used by many researchers to estimate composite models with several constructs, structural paths, and indicator variables without imposing assumptions on the distribution of the data. Moreover, PLS-SEM is a causal-predictive approach to SEM that underlines prediction in estimating econometric models, whose structures are made to provide causal explanations [41,42]. Hence, the technique overcomes the possible dichotomy between prediction and explanation, which is the foundation for building managerial implications [43]. Consequently, user-friendly statistical software is available that usually require little technical knowledge about the method, such as SmartPLS and PLS-Graph [44,45]. Other authors [46,47] provide more detailed discussions and arguments on when to use and not to use PLS-SEM. The authors conclude that the best situations when to use PLS-SEM are when the path model includes one or more formatively measured constructs, when a small population restricts the sample size, when the structural model is complex and includes many constructs, when the research is based on secondary data, and finally, when distribution of the data has normality issues.
The main advantage of using PLS-SEM is the relaxation of the normal distribution assumptions required for the maximum likelihood method used in estimating models using CB-SEM, and the ability of PLS-SEM to easily estimate more complicated models based on a small sample sizes [48]. When models comprise many items and a large number of constructs, PLS-SEM has solutions for small sample sizes. recent papers [38,49] explain how PLS-SEM provides solutions when other methods, such as CB-SEM do not converge with small sample sizes and complex models. Moreover, many recent studies indicate that the main reason for choosing PLS-SEM methodology is the lack of distributional assumption need [50,51,52].
Given all the above reasoning, we could conclude that PLS-SEM is quite suitable for this research topic, including when the research goal is exploratory research for theoretical development; when the analysis is from a predictive perspective; when the structural model is complex; when the distribution lacks normality; when the study requires a latent variable score for subsequent analysis.
To analyze the impact of green acquisitions on competition, a quantitative analysis based on a survey was carried out, using a questionnaire. The statistical assumptions described above were tested using the partial least square structural equation modeling (PLS-SEM) model, and the data was analyzed using the SmartPLS 3.2.8 statistical software [53]. The main purpose of the quantitative analysis was to study the impact of green procurement on the competition of companies that have invested in green projects.
The model, consisting of the dependent variable and the independent variables described above, leads to the formation of the model (Figure 2). It will be tested and then validated in the next chapter.

4. Model Estimation and Results

Starting from the conceptualized model of rational behavior theory described in the previous chapter, the following six proxy variables were considered success factors regarding the implementation of the model (Table 1): the strategic vision of the companies involved in ecological projects [54], the degree of regulation on green procurement [55], the level of competences [56], the integrated operational management [57], social responsibility [58], and the degree of innovation in the organic production process [59].
The independent variables described in Table 1 will be the latent variables of the model, while the reflexive dependent variable is “the degree of competition”. This is described in Table 2 and is determined by three proxy variables: “The number of competitors on the green procurement market”, “the price offered for the green procurement versus the reference price on the market”, and “the degree of concentration on the green procurement market” [60].
The questionnaires based on which the quantitative analysis was carried out, were addressed to both the management of the companies that built ecological projects, following the participation in the public procurement procedures, starting with the beginning of May 2019 and completed at the end of June of this year. The distribution of the respondents in the sample, depending on the function they hold within the selected company, is the following: Staff (22), Management (118), and Total (140). As it could be seen from the table above, the sample consisted of 140 managers and executives from companies that are involved in environmental projects won through public procurement procedures, which have been interviewed directly, the questionnaire containing 30 questions.
For the data collection, the simple random sampling method was used, between 1 May 2019–30 June 2019, using a questionnaire with both closed and open questions. The main problem in collecting the data was the reluctance of the respondents to complete the questionnaires. The main objectives pursued in carrying out the study were: determining the degree of regulation in the field of green procurement; identification of respondents’ level of knowledge regarding green procurement, based on age, gender, educational level, and respondents’ interests; evaluating the competences of the employees and evaluating the strategic vision, social responsibility, integrated operational management and the degree of innovation in the organic production process.
Before starting the actual analysis of the model, the degree of significance of the variables of the conceptual model will be tested. For this, the Cronbach’s Alpha and Dillon–Golsteins’ ρ coefficients will be calculated and interpreted [61]. Table 3 shows the values of these indicators.
From Table 4 it can be observed that the VIF (variance inflection factor) values of the latent variables are lower than 5. According to [62], it results that there are no problems of collinearity between the independent variables in the model. It can also be observed that the values of the Cronbach’s Alpha and Dillon–Golsteins’ ρ coefficients of the six independent variables have values greater than 0.7. Thus, we can conclude that the independent variables in the model are significant.
The econometric analysis was performed using the PLS-SEM method. It consists of the analysis of two sub-models, respectively the measurement model “outer model” and the structural model “inner model”. The PLS-SEM method was chosen for data analysis in the detriment of other similar methods, such as covariance-based structural equation modeling (CB-SEM), because it is less sensitive to asymmetric distributions, small samples, or the presence of multicollinearity, but, at the same time, it is even more robust [63,64].

4.1. Measurement Models

4.1.1. Construct Validity

Nacaskul [65] states that construct validity must be examined when a latent variable explains a statistically significant part of the variation of its constructs. In Figure 3, we can observe the coefficients related to the variables in the measurement model, obtained using the SEM-PLS equations.
Chin [66] considers that the constructs for which the coefficient values are less than 0.5 should be excluded from the measurement model. As a consequence, from the model we will exclude the variables: vs_4, compet_2, oper_3, and resp_3. After these variables were removed from the model, using the SEM-PLS equations and using the SmartPLS 3.2.8 software, we obtained the second measurement model.
As it can be seen in the Figure 4, the values of all the coefficients of the reflective variables in the model are greater than 0.5, from which it follows that all these coefficients are valid. Thus, the construct validity of the model is confirmed.

4.1.2. Divergent Validity

The divergent validity can be tested using the average variance extracted (AVE) indicator. Fornell and Larker [67] state that if the square root of the correlation coefficient values between the latent variables is smaller than the values of the AVE indicators related to the latent variables, then the discriminant validity is confirmed. In Table 4, these values can be observed.
As we could see in the Table 4, the square roots of the correlation coefficients are lower than the AVE indicator values for all latent variables, which confirms the discriminant validity of the measurement model.

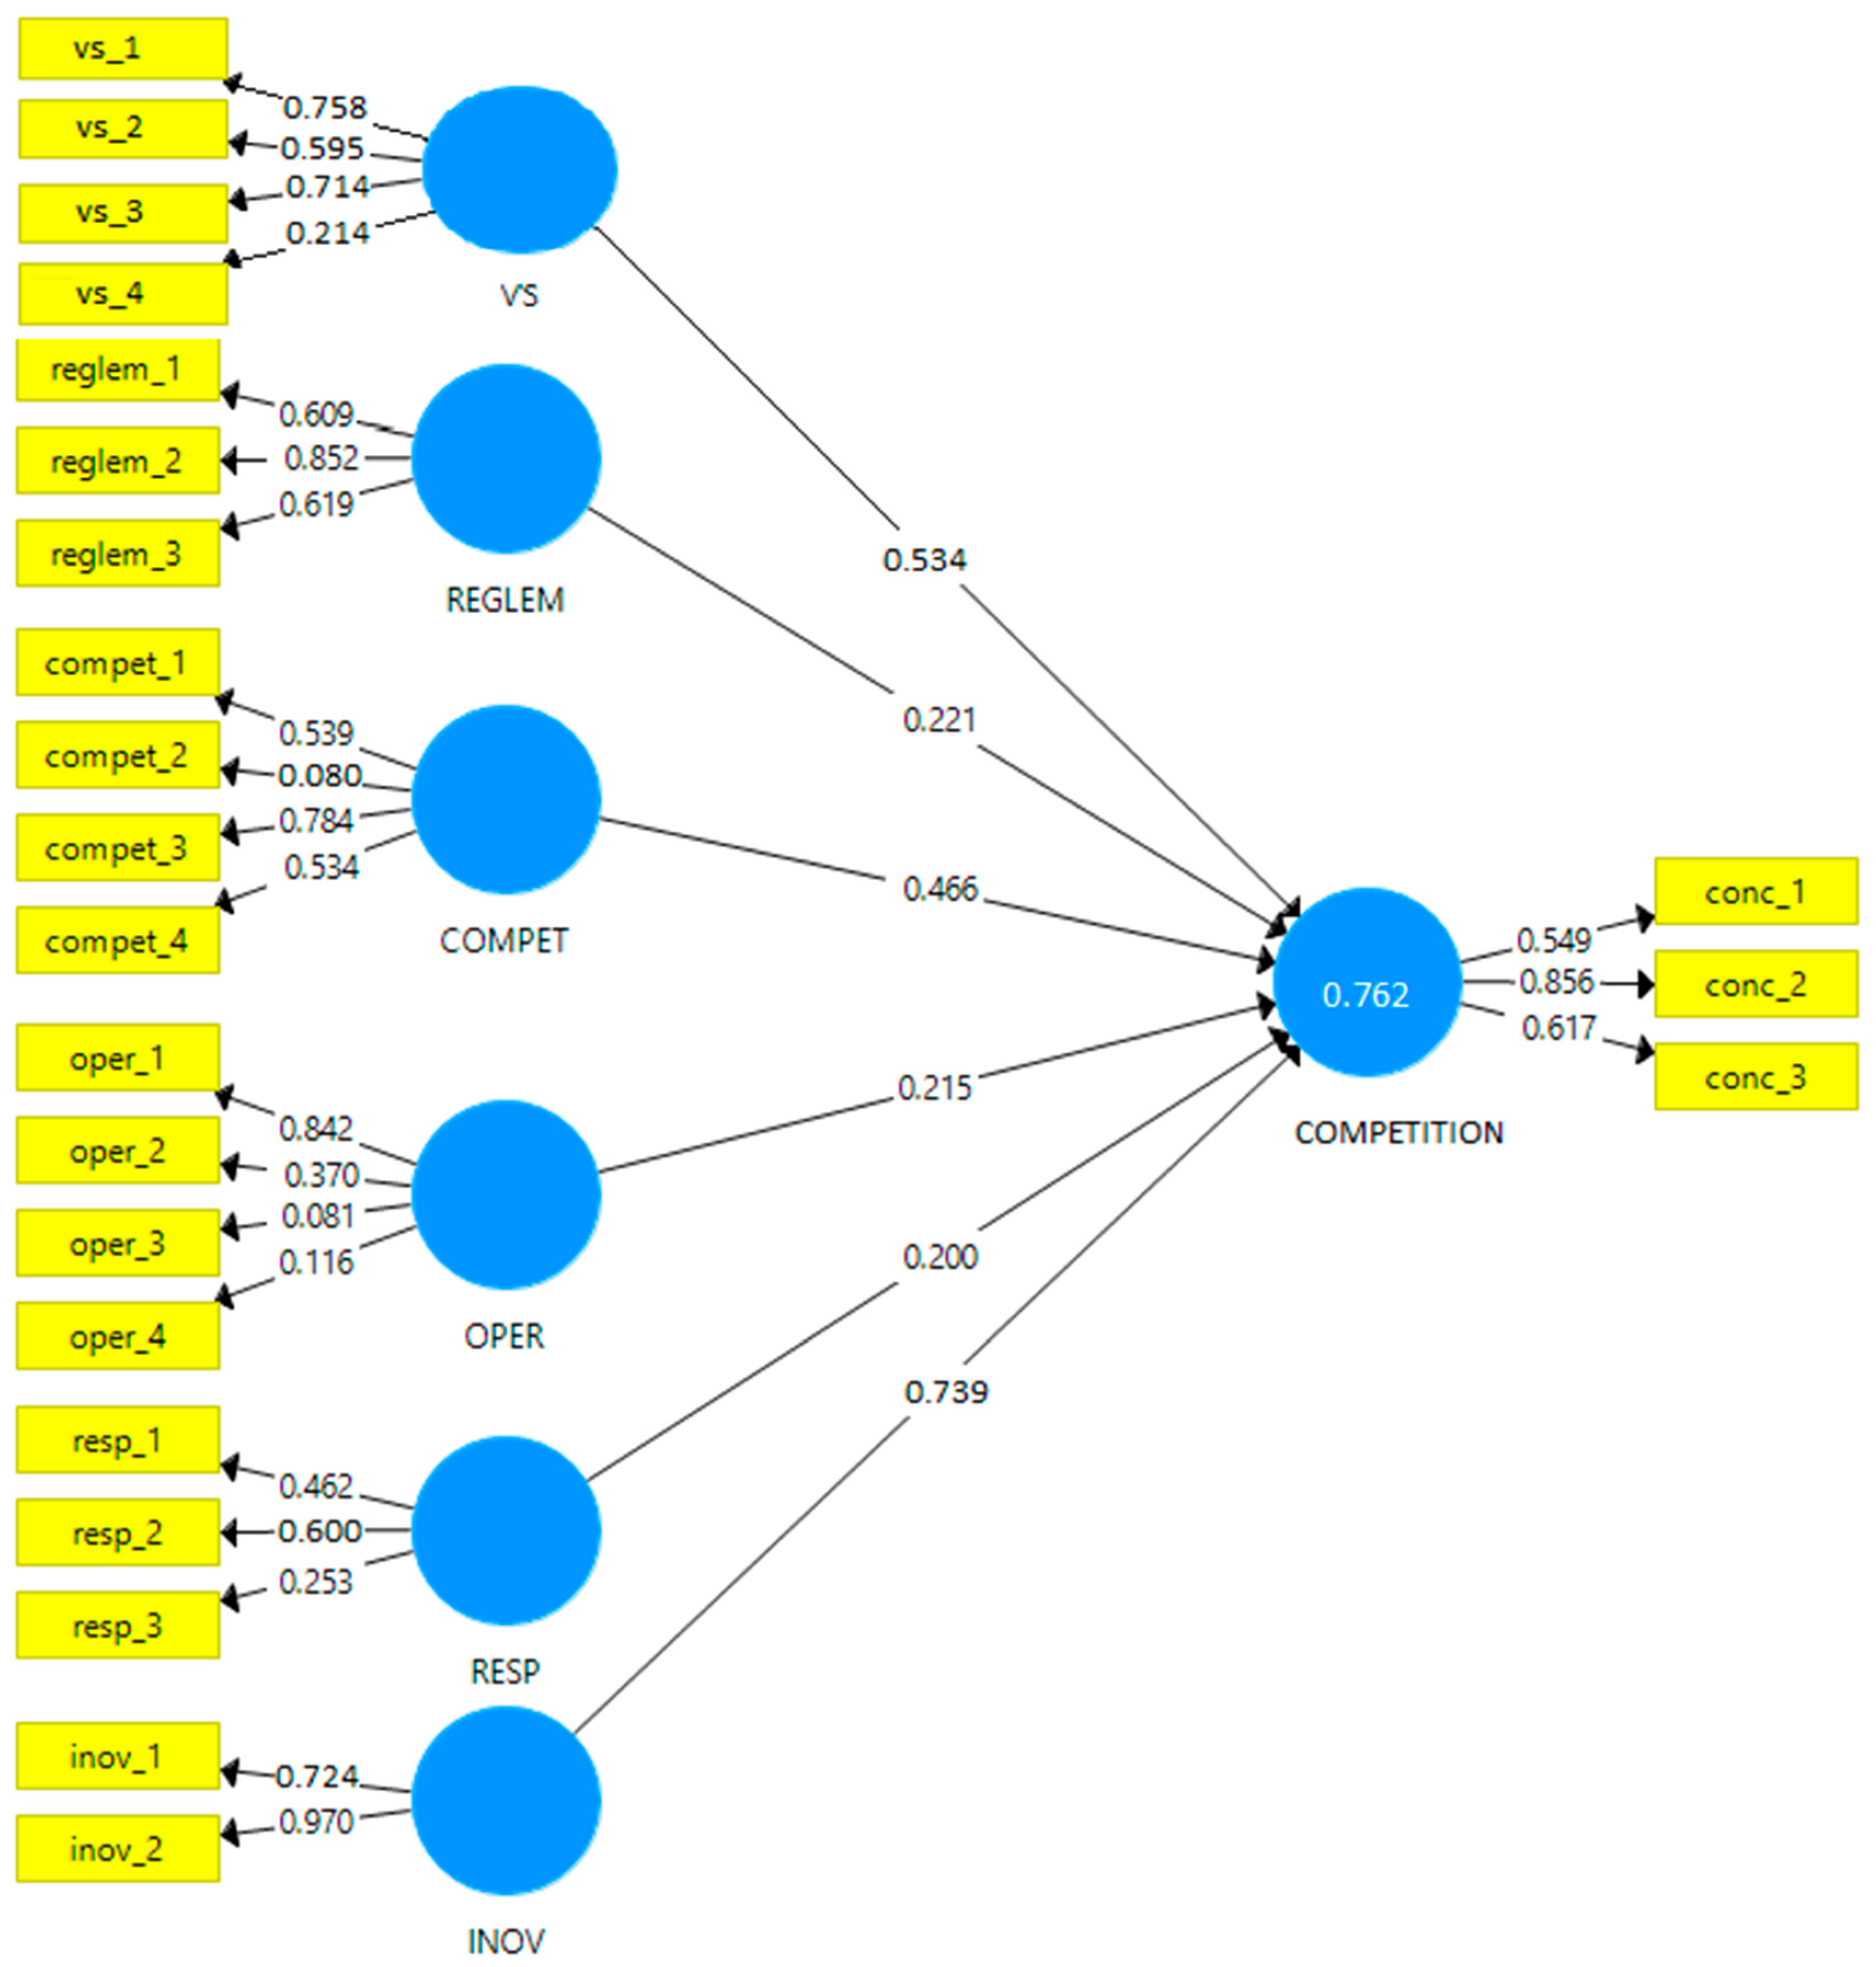
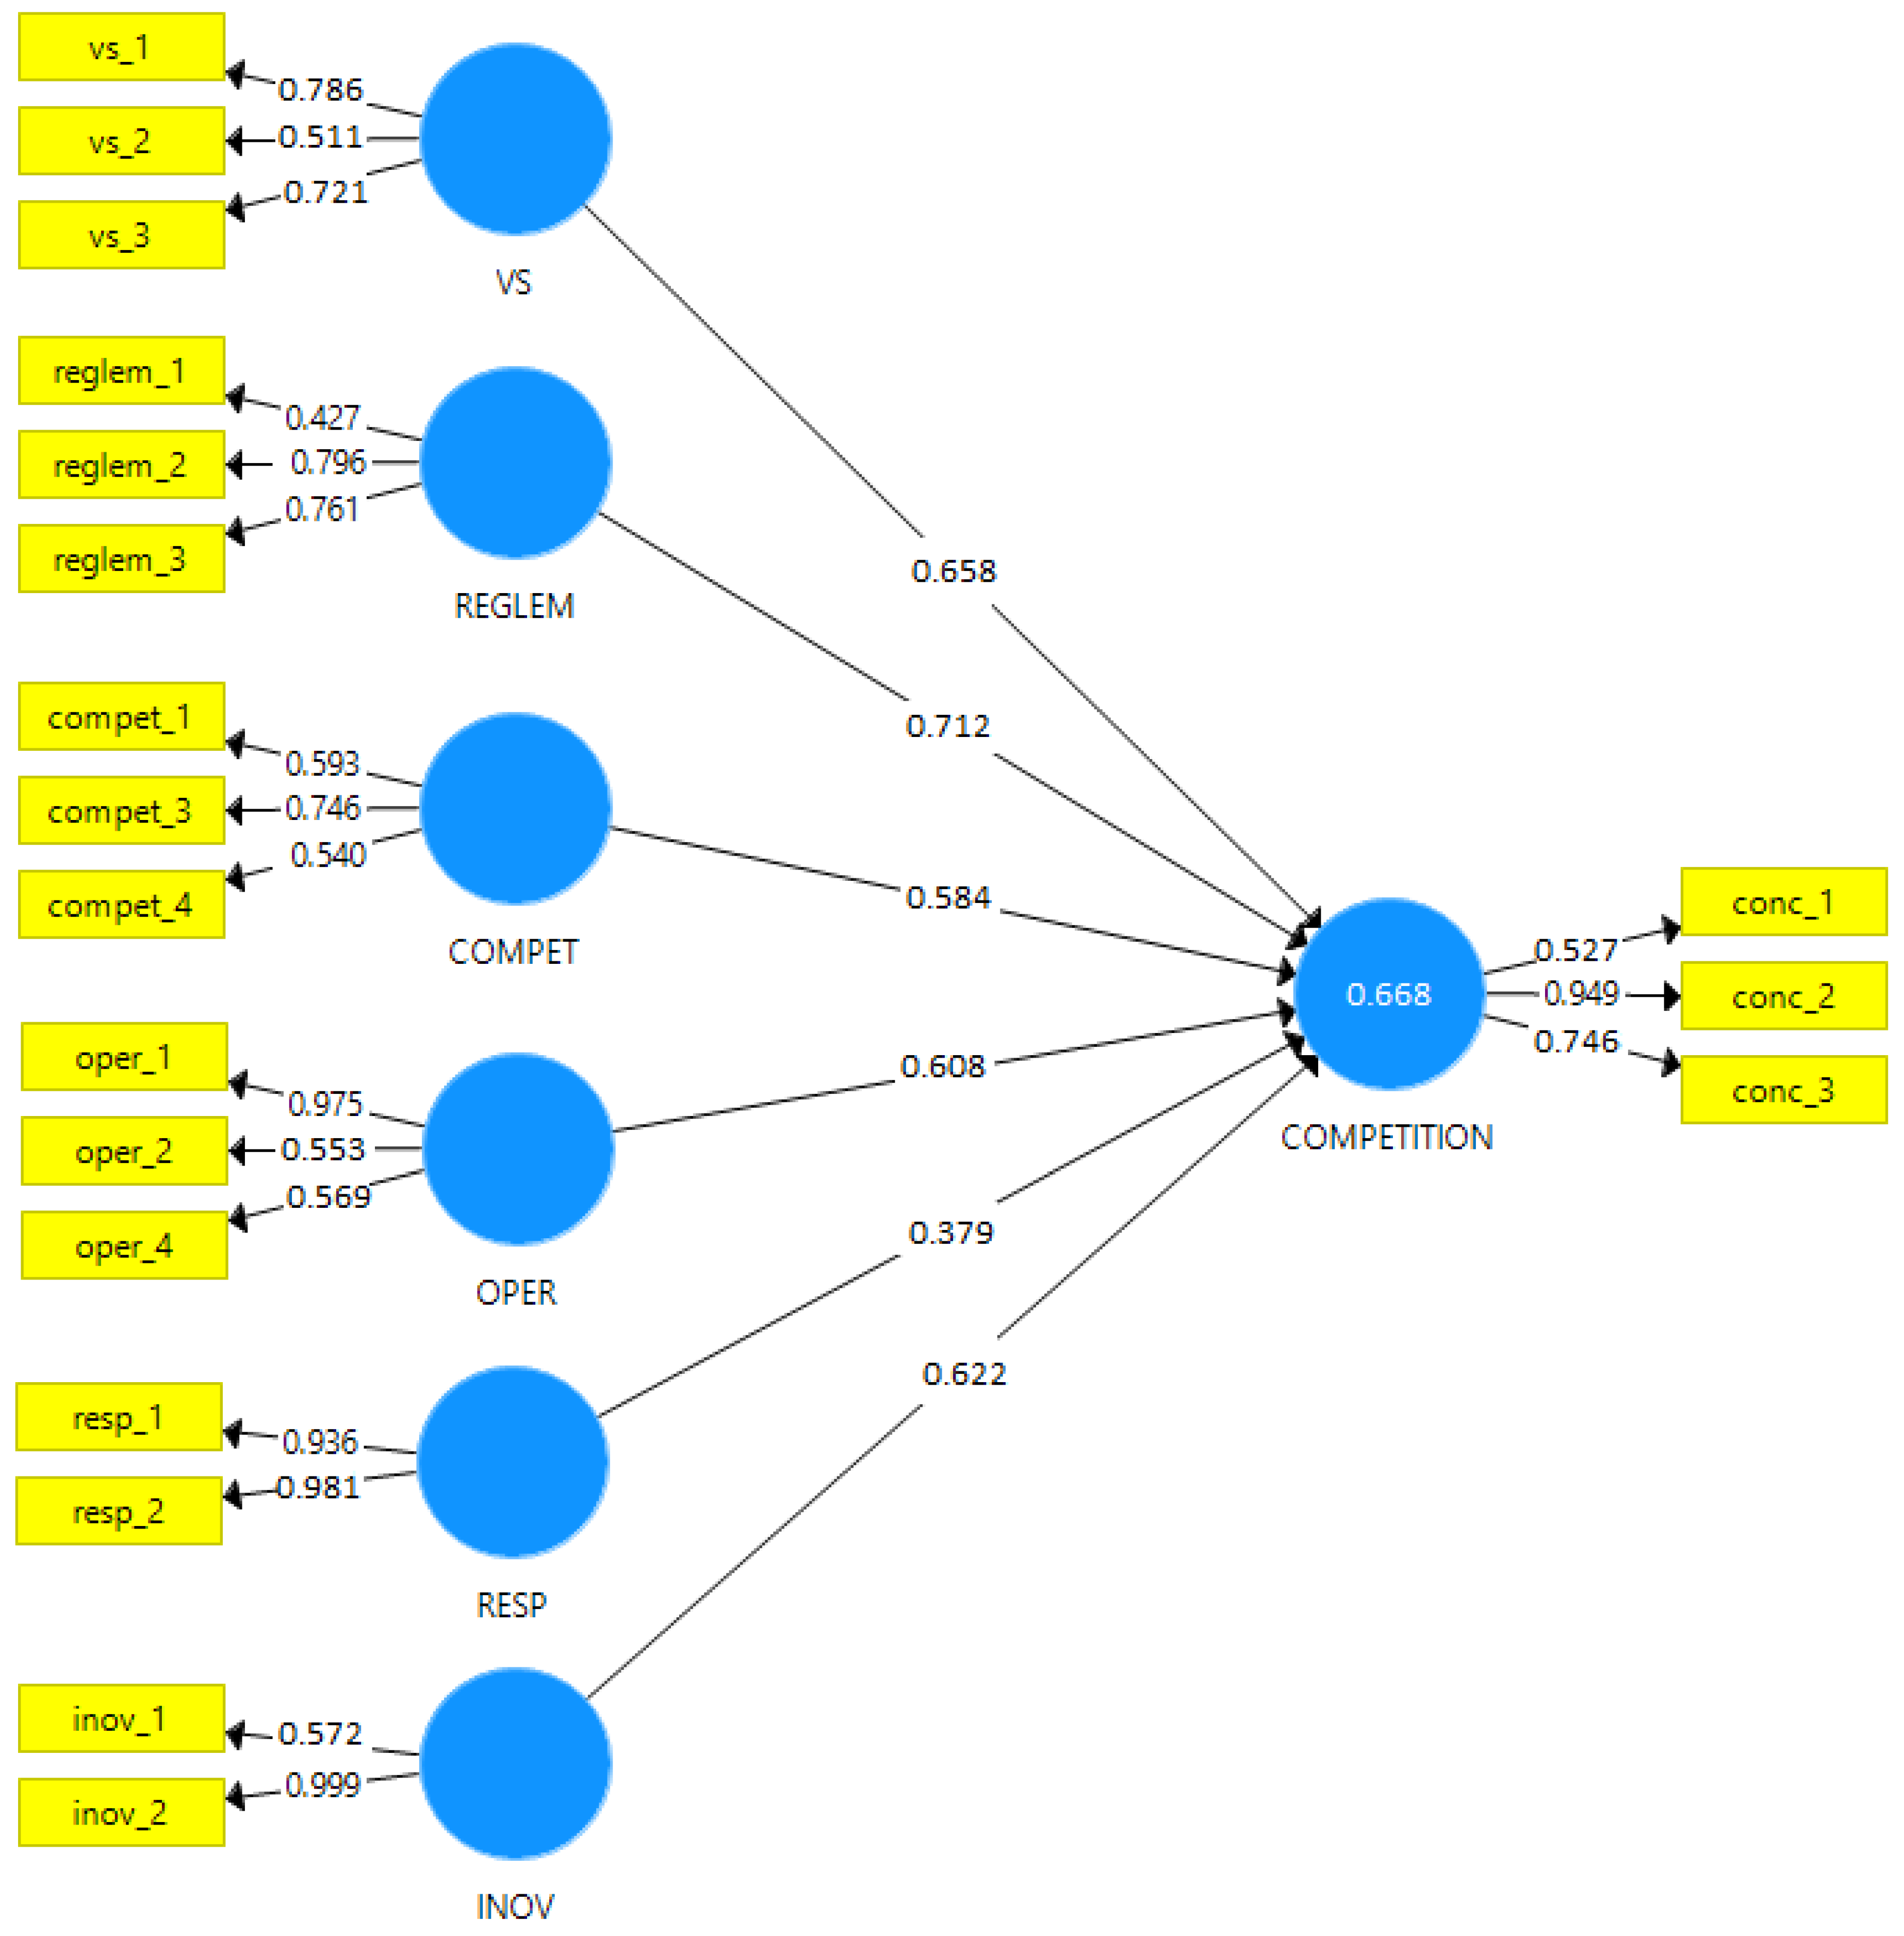
4.2. Structural Model

The ‘inner model’ structural model was described in Figure 2. This indicates the connection between the exogenous variables in the model and the endogenous variable. The structural model [59] is described by the equation
δ = Γδ + Λϕ + Σ
where:
  • δ-the vector for the endogenous latent variables;
  • ϕ-the vector for the exogenous latent variables;
  • Σ-the residual variable vector;
  • Λ and Γ–matrices of the path coefficients.

5. Results and Discussions

The values of the coefficients of the structural model are estimated using the structural equations, and the values obtained could be seen in Figure 4. The value of R-square is 0.668, which means that 66.8% of the variability of the competition degree regarding the green acquisitions is explained by the variability of the model. Regarding the estimated values of the coefficients of the structural model, we observe that all are positive, which means that all latent variables have a positive impact on competition. Thus, of the six indicators, the variable with the greatest impact on competition is “regulation” (factor 0.712), followed by “strategic vision” (factor 0.658), “degree of innovation” (factor 0.622), operational management “(factor 0.608), “competencies” (factor 0.584), and “responsibility” (factor 0.379). The reflective indicators of the dependent variable “competition” have values greater than 0.5, which means that the variables (conc_1, conc_2, and conc_3) are statistically significant. The high values of the reflective variables, namely “number of competitors on the green procurement market”, “price offered for green purchases versus reference price on the market”, and “degree of concentration on the green procurement market” show us that the degree of competition is well represented by the three indicators. In general, multiple factors improve the performance of the model and increase reliability compared to single factors. In our model, the dependent variable is composed of three variables. As with the formative variables, a reflective variable has a greater impact if it has high values of the coefficients, reflecting stronger ways of measurement. This is confirmed by the high values of the three coefficients of the dependent variables.
In addition, to test the six statistical assumptions described in the previous chapter, a Bootstrap Test was performed on a sample of 300 respondents to generate the values of the t test (t-test) and the mean square deviations (standard deviation) of the model parameters. According to statistical theory, ‘bootstrapping’ allows the allocation of precision measurements to sample estimates. The results regarding the testing of statistical assumptions can be seen in Table 5.
At a significance level of 95%, the assumptions for which the p-value is less than 0.05 are validated, while the others for which the p-value is greater than 0.05 are not. Thus, we can conclude that Hypotheses H1, H2, H3, H4, and H6 are valid, while H5 is not. These results confirm the economic studies according to which the strategic vision, the degree of regulation, the level of competences, the integrated operational management, and the degree of innovation have a significant impact on the competition in the green procurement [68] but denies that corporate social responsibility is an important factor in the degree of competition in green procurement [69,70]. This leads to the conclusion that CSR is not well developed in Romania and a possible explanation for that is that the companies do not get enough incentives from the government for implementing CSR’s in green procurement.
In conclusion, we can affirm that the strategic vision, the degree of regulation, the level of competences, the integrated operational management, the social responsibility of the companies and the degree of innovation are determining factors regarding the degree of competition in the green acquisitions in Romania.

6. Conclusions

Using economic modeling in rational behavior theory to model the impact of green procurement on competition using SEM-PLS structural equations, the article estimates and then evaluates the correlation between the determinants of the conceptual management model in analyzing the impact of green procurement on competition. The results indicate that a significant proportion of the variability of the dependent variables is explained by the independent latent variables. Thus, regulation is one of the main criteria that influence the degree of competition in the market of green procurement. Also, two other important factors that converge towards a high level of competition refer to the strategic vision of the companies and the degree of innovation incorporated in the products or technology offered by these companies, which participate in the public procurement procedures. The evaluation results also take into account other criteria, such as the level of knowledge and skills available to market participants, the operational level, and social responsibility. At the same time, we notice the significant contributions of the decision-making processes carried out at the management level, which lead to the increase of the staff motivation, developing the organizational culture and, last but not least, the competitiveness of these companies, reflected by better quality and accessible prices to the offered products. This assessment is based on the high value of the coefficients corresponding to the processes at the management level, quantified in the model.
The survey used in this study highlights the fact that the integrated operational processes used by a company involved in green procurement have a positive impact on the degree of competition and sustainable development. From the analysis of the model, it is highlighted that the confidence of entrepreneurship in government policies for the development of the bioeconomy is very low. We also note that the principle of CSR is an abstract concept, without real applicability, as the modest results obtained for the corporate social responsibility indicator suggest.
The results of the behavioral model, analyzed with the structural equations modeling, confirm the studies in the literature, emphasizing that strategic vision, the degree of regulation, the level of competences, the integrated operational management, the social responsibility of the companies, and the degree of innovation are determining factors in terms of the degree of competition in green procurement in Romania.
This paper confirms the importance of the green procurement in Romania, for the reasons underlined in his paper, in line with our wide review of the literature in the field. Incidentally, a narrow institutional framework was adopted at the EU level, containing rules meant to bring significant development to the plan which was mentioned above, which was mostly transposed by all EU Member States. However, according to the reports of the relevant institutions, the margins of expectation regarding the actual achievements are still high. Moreover, when discussing the problems related to the implementation and elaboration of national legal instruments introduced to stimulate GPP, a whole series of critical issues is coming up. To conclude, these instruments have not demonstrated their efficiency to stimulate GPP.
A limitation of this study is given by the relatively small number of survey respondents. Another limitation of this research is related to the possible subjective answers of the respondents of the questionnaire and to the relatively small number reflective variables and constructs. In future research, these limitations could be overwhelmed by increasing the number of reflective variables, the constructs, and the sample size, as well as by introducing open-end questions into the questionnaire. Further studies in the field of rational behavior theory in modeling the impact of green procurement on competition should be extended to other industries or sectors, and the research may include some possible macroeconomic effects.

Author Contributions

Conceptualization, M.B. and C.B.; Methodology, M.B.; Software, M.B.; Validation, C.B.; Formal analysis, M.B.; Investigation, M.B.; Resources, C.B.; Data curation, M.B.; Writing—original draft preparation, M.B.; Writing—review and editing, C.B.; Visualization, M.B.; Supervision, C.B.; Project administration, C.B. All authors have read and agreed to the published version of the manuscript.

Funding

This research received no external funding.

Data Availability Statement

Restrictions apply to the availability of these data. Data was obtained from [ElSEVIER] and are available [Mihail Busu] with the permission of [ElSEVIER].

Conflicts of Interest

The authors declare no conflict of interest.

References

  1. COM. Interpretation of the Commission Regarding the Integration of Environmental Considerations in Public Procurement Procedures. 2001. Available online: https://ec.europa.eu/regional_policy/sources/docgener/guides/public_procurement/2018/guidance_public_procurement_2018_ro.pdf (accessed on 10 August 2019).
  2. COM. 400—Public Procurement for Better Environmental Conditions. 2008. Available online: https://ec.europa.eu/environment/archives/gpp/buying_green_handbook_ro.pdf (accessed on 8 August 2019).
  3. Directive UE no. 24/2014 Regarding Public Procurement, Transposed at National Level by Law no. 98/2016 Regarding Public Procurement, OUG no. 107/2017, OUG no. 45/2018, Respective HG no. 395/2016. Available online: https://eur-lex.europa.eu/legal-content/RO/TXT/?uri=celex%3A32014L0024 (accessed on 29 July 2019).
  4. Directive UE no. 23/2014 Regarding the Award of Concession Contracts, Transposed by Law no. 100/2016. Available online: https://eur-lex.europa.eu/legal-content/RO/TXT/?uri=OJ%3AJOL_2014_094_R_0001_01 (accessed on 18 July 2019).
  5. Directive UE no. 25/2014 Regarding the Acquisitions Made by the Entities that Operate in the Water, Energy, Transport and Postal Services Sectors, Transposed by Law no. 99/2016 Regarding Sectoral Acquisitions, Respectively by GD no. 394/2016 Regarding the Approval of the Implementing Norms Regarding the Award of Sectoral Contracts. Available online: https://eur-lex.europa.eu/legal-content/RO/TXT/PDF/?uri=CELEX:32014L0025&from=EN (accessed on 10 August 2019).
  6. EC. Communication from the Commission to the European Parliament, The European Economic and Social Committee and the Committee Of the Regions. 2008. Available online: https://ec.europa.eu/environment/gpp/pdf/sec_2008_2124_EN.pdf (accessed on 16 August 2019).
  7. UN. MATTM & United Nations Environment Programme, 2017—Financing the Future: Report of the Italian National Dialogue on Sustainable Finance. 2016. Available online: http://unepinquiry.org/wpcontent/uploads/2017/02/Financing_the_Future_EN.pdf (accessed on 14 August 2019).
  8. EC. Paris Agreement on Climate Change. 2018. Available online: https://www.consilium.europa.eu/en/policies/climate-change/timeline/ (accessed on 24 July 2019).
  9. Brännlund, R.; Lundberg, S.; Marklund, P.O. Assessment of Green Public Procurement as a Policy Tool: Cost-Efficiency and Competition Considerations; Umea Economic Studies Umea University, 2009; Available online: http://ippa.org/images/PROCEEDINGS/IPPC4/07GreenProcurement/Paper7-1.pdf (accessed on 15 August 2019).
  10. Aldenius, M.; Khan, J. Strategic use of green public procurement in the bus sector: Challenges and opportunities. J. Clean. Prod. 2017, 164, 250–257. [Google Scholar] [CrossRef]
  11. Peprah, J.A.; Brako, S.; Akosah, N.B. The Awareness Level of Green Procurement at the District Assemblies in Western Region in Ghana. J. Manag. Sustain. 2018, 8, 46. [Google Scholar] [CrossRef] [Green Version]
  12. Michelsen, O.; de Boer, L. Green procurement in Norway; a survey of practices at the municipal and county level. J. Environ. Manag. 2009, 91, 160–167. [Google Scholar] [CrossRef] [PubMed]
  13. Meehan, J.; Bryde, D. Sustainable procurement practice. Bus. Strategy Environ. 2011, 20, 94–106. [Google Scholar] [CrossRef]
  14. EC. Buying Green! A Handbook on Green Public Procurement. 2011. Available online: https://ec.europa.eu/environment/gpp/pdf/Buying-Green-Handbook-3rd-Edition.pdf (accessed on 6 August 2019).
  15. Romanian Competition Law. 1996. Available online: http://www.consiliulconcurentei.ro/uploads/docs/items/bucket8/id8047/lege_nr21_1996_actualizata_20160303.pdf (accessed on 12 August 2019).
  16. OECD. Competition and Procurement. Key Findings. 2011. Available online: http://www.oecd.org/daf/competition/sectors/48315205.pdf (accessed on 20 June 2019).
  17. Jevons, W.S. Notice of a general mathematical theory of political economy. J. Statistical Soc. Lond. 1862, 70–77. Available online: https://www.peterharrington.co.uk/notice-of-a-general-mathematical-theory-of-political-economy-123182.html (accessed on 23 December 2020).
  18. Menger, C. Principles of Economics; New York University Press: New York, NY, USA, 1871. [Google Scholar]
  19. Walras, L. Éléments D’économie Politique Pure. 1874. Available online: https://halshs.archives-ouvertes.fr/halshs-00508902/document (accessed on 12 June 2019).
  20. Friedman, M.; Savage, L.J. The utility analysis of choices involving risk. J. Political Econ. 1984, 56, 279–304. [Google Scholar] [CrossRef]
  21. Ajzen, I. The theory of planned behavior. Organ. Behav. Hum. Decis. Process. 1991, 50, 179–211. [Google Scholar] [CrossRef]
  22. Hair, J.F.; Hult, G.T.M.; Ringle, C.M.; Sarstedt, M.; Thiele, K.O. Mirror, Mirror on the wall: A comparative evaluation of composite-based structural equation modeling methods. J. Acad. Mark. Sci. 2017, 45, 616–632. [Google Scholar] [CrossRef]
  23. Kock, N. One-tailed or two-tailed P values in PLS-SEM? Int. J. e-Collab. 2015, 11, 1–7. [Google Scholar] [CrossRef]
  24. Busu, C.; Busu, M. Economic modeling in the management of transition to bioeconomy. Amfiteatru Econ. 2019, 21, 1–24. [Google Scholar] [CrossRef]
  25. Sarstedt, M.; Ringle, C.M.; Henseler, J.; Hair, J.F. On the emancipation of PLS-SEM: A commentary on Rigdon. Long Range Plan. 2014, 47, 154–160. [Google Scholar] [CrossRef]
  26. Wong, K.K.K. Partial least squares structural equation modeling (PLS-SEM) techniques using SmartPLS. Mark. Bull. 2013, 24, 1–32. [Google Scholar]
  27. Oztekin, A.; Delen, D.; Turkyilmaz, A.; Zaim, S. A machine learning-based usability evaluation method for eLearning systems. Decis. Support Syst. 2013, 56, 63–73. [Google Scholar] [CrossRef]
  28. Galluzzo, N. A preliminary Quantitative Analysis of Rural Development in Romania Using the PLS-SEM. Albanian J. Agric. Sci. 2018, 17, 125–133. [Google Scholar]
  29. Avkiran, N.K.; Ringle, C.M. Partial Least Squares Structural Equation Modeling: Recent Advances in Banking and Finance; Springer International Publishing: Cham, Switzerland, 2018. [Google Scholar]
  30. Ali, F.; Rasoolimanesh, S.M.; Sarstedt, M.; Ringle, C.M.; Ryu, K. An assessment of the use of partial least squares structural equation modeling (PLS-SEM) in hospitality research. Int. J. Contemp. Hosp. Manag. 2018, 30, 514–538. [Google Scholar] [CrossRef] [Green Version]
  31. Garson, G.D. Partial Least Squares Regression and Structural Equation Models; Statistical Associates: Asheboro, NC, USA, 2016. [Google Scholar]
  32. Ramayah, T.; Cheah, J.-H.; Chuah, F.; Ting, H.; Memon, M.A. Partial Least Squares Structural Equation Modeling (PLS-SEM) Using SmartPLS 3.0: An Updated and Practical Guide to Statistical Analysis; Pearson: Singapore, 2016. [Google Scholar]
  33. Rasoolimanesh, S.M.; Ali, F. Editorial: Partial least squares (PLS) in hospitality and tourism research. J. Hosp. Tour. Technol. 2018, 9, 238–248. [Google Scholar]
  34. Shiau, W.-L.; Sarstedt, M.; Hair, J.F. Editorial: Internet research using Partial Least squares Structural equation modeling (PLS-SEM). Internet Res. Forthcom. 2019, 29, 398–406. [Google Scholar] [CrossRef]
  35. Wold, H.O.A. Partial least squares. In Encyclopedia of Statistical Sciences; Kotz, S., Johnson, N.L., Eds.; Wiley: New York, NY, USA, 2019; pp. 581–591. [Google Scholar]
  36. Sarstedt, M.; Diamantopoulos, A.; Salzberger, T.; Baumgartner, P. Selecting single items to measure doubly-concrete constructs: A cautionary tale. J. Bus. Res. 2016, 69, 3159–3167. [Google Scholar] [CrossRef]
  37. Rigdon, E.E. Rethinking partial least squares path modeling: In praise of simple methods. Long Range Plan. 2012, 45, 341–358. [Google Scholar] [CrossRef]
  38. Henseler, J.; Dijkstra, T.K.; Sarstedt, M.; Ringle, C.M.; Diamantopoulos, A.; Straub, D.W.; Ketchen, D.J.; Hair, J.F.; Hult, G.T.M.; Calantone, R.J. Common beliefs and reality about partial least squares: Comments on Rönkkö and Evermann (2013). Organ. Res. Methods 2014, 17, 182–209. [Google Scholar] [CrossRef] [Green Version]
  39. Sarstedt, M.; Ringle, C.M.; Hair, J.F. Partial least squares structural equation modeling. In Handbook of Market Research; Homburg, C., Klarmann, M., Vomberg, A., Eds.; Springer: Heidelberg, Germany, 2017. [Google Scholar]
  40. Wold, H. Soft modeling: The basic design and some extensions. Syst. Indirect. Obs. 1982, 2, 343. [Google Scholar]
  41. Hair, J.F.; Ringle, C.M.; Sarstedt, M. PLS-SEM: Indeed a silver bullet. J. Mark. Theory Pract. 2011, 19, 139–152. [Google Scholar] [CrossRef]
  42. Hair, J.F.; Sarstedt, M.; Ringle, C.M. Rethinking some of the rethinking of partial least squares. Eur. J. Mark. 2019, 53, 566–584. [Google Scholar] [CrossRef]
  43. Chin, W.W.; Frye, T. PLS Graph–Version 3.0. Soft Modeling Inc. Available online: http://www.plsgraph.com (accessed on 10 December 2020).
  44. Ringle, C.M.; Wende, S.; Becker, J.M. SmartPLS 3; SmartPLS GmbH: Boenningstedt, Germany, 2015. [Google Scholar]
  45. Monecke, A.; Leisch, F. SemPLS: Structural equation modeling using partial least squares. J. Stat. Softw. 2012, 48, 1–32. [Google Scholar] [CrossRef] [Green Version]
  46. Rigdon, E.E. Choosing PLS path modeling as analytical method in European management research: A realist perspective. Eur. Manag. J. 2016, 34, 598–605. [Google Scholar] [CrossRef]
  47. Richter, N.F.; Cepeda-Carrión, G.; Roldán Salgueiro, J.L.; Ringle, C.M. European management research using partial least squares structural equation modeling (PLS-SEM). Eur. Manag. J. 2016, 34, 589–597. [Google Scholar] [CrossRef]
  48. Hair, J.F., Jr.; Sarstedt, M.; Hopkins, L.; Kuppelwieser, V.G. Partial least squares structural equation modeling (PLS-SEM). Eur. Bus. Rev. 2014, 26, 106–121. [Google Scholar] [CrossRef]
  49. Henseler, J.; Ringle, C.M.; Sarstedt, M. A new criterion for assessing discriminant validity in variance-based structural equation modeling. J. Acad. Mark. Sci. 2015, 43, 115–135. [Google Scholar] [CrossRef] [Green Version]
  50. Hair, J.F.; Sarstedt, M.; Ringle, C.M.; Gudergan, S.P. Advanced Issues in Partial Least Squares Structural Equation Modeling (PLS-SEM); Sage: Thousand Oaks, CA, USA, 2018. [Google Scholar]
  51. Nitzl, C. The use of partial least squares structural equation modeling (PLS-SEM) in management accounting research: Directions for future theory development. J. Account. Lit. 2016, 37, 19–35. [Google Scholar] [CrossRef]
  52. do Valle, P.O.; Assaker, G. Using partial least squares structural equation modeling in tourism research: A review of past research and recommendations for future applications. J. Travel Res. 2016, 55, 695–708. [Google Scholar] [CrossRef]
  53. Ringle, C.; Da Silva, D.; Bido, D. Structural equation modeling with the SmartPLS. Braz. J. Mark. 2014, 13, 56–73. [Google Scholar]
  54. Kristensen, K.; Eskildsen, J. Design of PLS-Based Satisfaction Studies. In Handbook of Partial Least Squares; Springer: Berlin/Heidelberg, Germany, 2010; pp. 247–277. [Google Scholar]
  55. Memmott, J.; Cadotte, M.; Hulme, P.E.; Kerby, G.; Milner-Gulland, E.J.; Whittingham, M.J. Putting applied ecology into practice. J. Appl. Ecol. 2010, 47, 1–4. [Google Scholar] [CrossRef]
  56. Pop, N.A.; Pelau, C. Correlations within the EFQM business excellence model by applying a factor analysis. Amfiteatru Econ. 2017, 19, 28–40. [Google Scholar]
  57. Chalikias, M.S. Optimal Designs for Carry Over Effects the Case of Two Treatment and Four Periods. Mathematics 2019, 7, 1179. [Google Scholar] [CrossRef] [Green Version]
  58. Dinu, V. Quality Management and Business Excellence. Amfiteatru Econ. J. 2017, 19, 5–7. [Google Scholar]
  59. Andrecka, M. Corporate social responsibility and sustainability in Danish public procurement. Eur. Procure. Pub. Private Partnersh. L. Rev. 2017, 12, 333. [Google Scholar] [CrossRef]
  60. Sen, S.K.; Pookayaporn, J. Economic value added and ecology value added as a measure for disaster preparedness linked to corporate social responsibility: Japan as a test-bed bridging Asia and North America. Int. J. Bus. Emerg. Mark. 2018, 10, 304–317. [Google Scholar] [CrossRef]
  61. Kelley, N.P.; Pyenson, N.D. Evolutionary innovation and ecology in marine tetrapods from the Triassic to the Anthropocene. Science 2015, 348, 3716. [Google Scholar] [CrossRef] [PubMed] [Green Version]
  62. Witjes, S.; Lozano, R. Sustainable Public Procurement: Moving to more sustainable societies. J. Clean. Prod. 2016, 85–95. Available online: https://www.researchgate.net/profile/Sjors_Witjes/publication/310142630_Sustainable_Public_Procurement_Moving_to_more_sustainable_societies_-_Virtual_Special_Issues_-_Elsevier/links/5829a6b508aefcbdb47fd5bf.pdf (accessed on 23 December 2020).
  63. ZeinEldin, R.A.; Chesneau, C.; Jamal, F.; Elgarhy, M. Statistical Properties and Different Methods of Estimation for Type I Half Logistic Inverted Kumaraswamy Distribution. Mathematics 2019, 7, 1002. [Google Scholar] [CrossRef] [Green Version]
  64. Hair, J.F.; Ringle, C.M.; Sarstedt, M. Partial least squares structural equation modeling: Rigorous applications, better results and higher acceptance. Long Range Plan. 2013, 1, 1–12. [Google Scholar] [CrossRef]
  65. Nacaskul, P. Financial Risk Management and Sustainability. The Sufficiency Economy Philosophy Nexus. 2017. Available online: https://papers.ssrn.com/sol3/papers.cfm?abstract_id=3057886 (accessed on 12 December 2019).
  66. Chin, W.W. How to write up and report PLS analyses. In Handbook of Partial Least Squares; Springer: Berlin/Heidelberg, Germany, 2010; pp. 655–690. [Google Scholar]
  67. Fornell, C.; Larcker, D.F. Structural equation models with unobservable variables and measurement error: Algebra and statistics. J. Mark. Res. 1981, 18, 382–388. [Google Scholar] [CrossRef]
  68. Grandia, J.; Steijn, B.; Kuipers, B. It is not easy being green: Increasing sustainable public procurement behaviour. Innov. Eur. J. Soc. Sci. Res. 2015, 28, 243–260. [Google Scholar] [CrossRef] [Green Version]
  69. Hernandez, A.A.; Ona, S.E. A Qualitative Study of Green IT Adoption within the Philippines Business Process Outsourcing Industry: A Multi-Theory Perspective. Int. J. Enterp. Inf. Syst. 2015, 11, 28–62. [Google Scholar] [CrossRef]
  70. Ho, L.W.; Dickinson, N.M.; Chan, G.Y. Green procurement in the Asian public sector and the Hong Kong private sector. In Natural Resources Forum; Blackwell Publishing Ltd.: Oxford, UK, 2010; Volume 34, pp. 24–38. [Google Scholar]
Figure 1. Conceptual model of the theory of rational behavior. Source: (Ajzen, 1991) [21].
Mathematics 09 00016 g001
Figure 2. Structural model that incorporates the results of rational behavior in modeling the impact of green procurement on competition.
Mathematics 09 00016 g002
Figure 3. Measurement PLS-SEM 1 model. Source: Data analysis was performed by the authors using the SmartPLS software 3.2.8.
Mathematics 09 00016 g003
Figure 4. Measurement PLS-SEM 2 model. Source: Data analysis was performed by the authors using the SmartPLS software 3.2.8.
Mathematics 09 00016 g004
Table 1. Description of the independent variables in the model
Strategic Vision (SV)
vs_1Existence of priority environmental objectives, made aware at the organization level (on a top-down scale), through programs to streamline the use of resources
vs_2The existence of a cooperation partnership in the field of sustainable economy with organizations in the public and/or private environment (chambers of commerce, entrepreneurs’ associations, universities, central or local public authorities, etc.)
vs_3Existence of a management strategy oriented to reintegration programs of the resources used in the production circuit
vs_4Participation in the green procurement procedures organized by the public authorities
Reglementation (Reglem)
Reglem_1Funding programs from European and/or national public funds
Reglem_2Economic incentives provided for in national legislation, favorable to investments in “green” projects
Reglem_3Existence of a legal framework adopted in the field of green procurement
Competences (Compet)
Compet_1Participation in discussion forums and information exchanges with profile organizations, to transfer knowledge of developments and expertise in the field of green procurement
Compet_2Training courses for specialists in the field of environmental policy and public procurement, especially in the field of green procurement
Compet_3Knowledge of specific and/or functional criteria in the field of green procurement that ensures compliance with the legislation in the field
Compet_4Innovative technologies research to reduce energy consumption, extend product life, and reuse resources
Integrated operational management (Oper)
Oper_1Existence of a procurement and strategy department to respond adequately to external requests (business partners, public authorities, etc.)
Oper_2Existence of a logistics department, responsible for packing, recycling, resource reuse, low energy consumption, etc.
Oper_3The existence of an applied research department, which integrates innovative products and/or technologies in the production circuit
Oper_4The existence of an integrated data flow, available to the directorates within the organization
Social responsibility (Resp)
Resp_1Carrying out campaigns of social involvement, by presenting the benefits of green acquisitions
Resp_2CSR and ethics programs at the organization level
Resp_3Incentives provided to employees for compliance
Innovation (Inov)
Inov_1Holding certifications in the field of organic production (for example, the use of eco-label labels)
Inov_2Holding patents/licenses for environmentally friendly technologies
Table 2. Description of the dependent variable.
Endogenous Variable: Competition Degree
Conc_1Number of competitors in the green procurement market
Conc_2The price offered for green purchases versus the reference price on the market
Conc_3The degree of concentration on the green procurement market
Table 3. Validity of model variables.
VariableDillon Golsteins’ RhoCronbach’s AlphaComposite ReliabilityAVEVIF
VS1.0001.0001.0001.0002.131
REGLEM1.0001.0001.0001.0001.548
COMPET0.6870.7080.8350.7081.476
OPER0.6370.7320.6820.6842.674
RESP0.6260.7560.6640.6242.386
INOV0.6450.7890.6780.6182.274
Source: Data analysis was performed by the authors using the SmartPLS software 3.2.8.
Table 4. Correlation matrix of the latent variables.
Latent VariablesAVEThe Square Root of the Correlation Coefficients between Latent Variables
SVReglemCompetOperRespInov
VS1.0001
REGLEM1.0000.6211
COMPET0.8250.6790.5121
OPER0.7480.5280.4910.5311
RESP0.7290.6830.6080.5960.6121
INOV0.6880.6020.5430.5800.6020.5481
Source: Data analysis was performed by the authors using the SmartPLS software 3.2.8.
Table 5. Results of statistical hypotheses tests.
Research HypothesisCoefficientsStandard Errort-Valuep-Value
H1: Strategic Vision -> Green procurement competition0.6580.2463.6480.005
H2: Regulation -> Green procurement competition0.7120.2782.8310.029
H3: Competence -> Green procurement competition0.5840.2023.2890.009
H4: Operational -> Green procurement competition0.6080.2092.4050.036
H5: Responsibility -> Green procurement competition0.3790.2471.7890.242
H6: Innovation -> Green procurement competition0.6220.2483.2340.008
Source: Data analysis was performed by the authors using the SmartPLS software 3.2.8.
Publisher’s Note: MDPI stays neutral with regard to jurisdictional claims in published maps and institutional affiliations.

