Article

Analysis of Rotor-Stator Interaction of a Pump-Turbine with Splitter Blades in a Pump Mode

1
National Research Center of Pumps, Jiangsu University, Zhenjiang 212013, China
2
Department of Energy and Power Engineering, Tsinghua University, Beijing 100084, China
*
Author to whom correspondence should be addressed.
Mathematics 2020, 8(9), 1465; https://doi.org/10.3390/math8091465
Submission received: 23 July 2020 / Revised: 20 August 2020 / Accepted: 24 August 2020 / Published: 1 September 2020

Abstract

:
The pump-turbine is the core component of a pumped storage power station. This paper considers an in-depth analysis of the rotor-stator interaction characteristics under computational fluid dynamics (CFD) and experimental measurements of pump-turbine with splitter blades used in a domestic pumped storage power station. The results show that as the guide blade opening increases, the rotor-stator interaction of the pump-turbine intensifies and the magnitude of the runner radial force and its pulsation amplitude as well as the magnitude of the guide blade water moment and its pulsation amplitude also increase. In addition, when the opening degree increases from 9.8° to 17.5°, the influence on the main frequency is mainly reflected in the phase change. While the opening degree increases from 17.5° to 24.8°, the influence on the main frequency is mainly reflected in the amplitude change. Moreover, the amplitude of 5fn at opening 9.8° and opening 24.8° is greater than the optimal opening 17.5°, indicating that deviation from the optimal opening will aggravate the difference of rotor-stator interaction between splitter blades and guide blades. In the paper, the influence of guide blade openings on the rotor-stator interaction between the splitter guide blade is studied, which provides a theoretical reference for the stable operation of the pump-turbine.

1. Introduction

Pumped storage power station uses the surplus power at the trough to pump water to the upstream reservoir for storage, and then uses it to supplement power at the peak load. It can also cooperate with other grid systems to carry out peak load regulation and valley filling. It is recognized as a reliable peak load regulation power source in the world, so the stability of unit operation is crucial. The flow characteristics of conventional pump-turbine usually produces pressure disturbance and kinetic energy loss when it is running under pump condition. In practice, it often occurs some problems, such as vibration, noise, and mechanical fatigue which are due to the unsteady flow state, pressure pulsation, and energy loss during the operation [1,2]. In addition, the changes of guide vanes opening influence the pump external performance and flow characteristics [3,4,5,6].
At present, through laser Doppler velocimetry (LDV) and particle image velocimetry (PIV) flow field observation technology, pressure pulsation analysis and computational fluid dynamics (CFD) and fluid-structure interaction (FSI) numerical calculation method, scholars have carried out in-depth research on the internal flow characteristics, rotor-stator interaction characteristics of both pumps and turbines, thus have had a full understanding of their mechanism and put forward relevant improvement measures [7,8,9,10,11,12]. Zhang [13] used shear stress transport (SST) model to evaluated energy loss in a side channel pump, which found the SST turbulence model can better describe the hydraulic performance and inner flow in the rotor machinery. Pei [14] carried out unsteady flow characteristics through SST model in a double-suction centrifugal pump as well, and the numerical result was similar to the experiment. Wang [15] compared shear stress transport-scale adaptive simulation (SST-SAS) model with both Unrans and Rans-Les turbulence model and found the SST-SAS model is the most precise. Cairone [16] studied the characterization of the slug flow generated by two fluids upstream (air-water) in serpentine microchannels by the experiments and the results showed a great variability in the flows behaviours and a high sensitivity to the different operative conditions.
In addition, Nicolet [17] carried out a one-dimensional acoustic simulation of the rotor-stator interaction of a mixed-flow pump-turbine under the resonant condition, and revealed the acoustic resonance mode and frequency characteristics generated by the rotor-stator interaction in the volute region, which laid a foundation for the simulation of the full acoustic model. Egusquiza [18] monitored the vibration of the water turbine through the remote monitor and control system and found that the vibration of the pump-turbine is much larger than the conventional hydraulic turbine, which is mainly because of rotor-stator interaction in the pump-turbine, especially in the turbine heavy load conditions. Rodriguez [19] adopted the measurement method of sensor rotation along the shaft to monitor the rotor-stator interaction of pump-turbine, which avoided the measurement influence brought by bearing response and provided a more reliable measurement method for monitor the rotor-stator interaction characteristics. Casartelli [20] investigated a CFD simulation of the flow field and pressure pulsation change combined with FSI technology during the guide vane closing process, which provided a convenient and accurate CFD strategy for analyzing the transient characteristics of the unstable conditions of the pump-turbine and developing the guide vane control rules. Vagnoni [21] carried out a PIV test on the size, velocity field, and pressure of the bubble in the bladeless region during the phase adjustment of the pump-turbine. The image was used to process and identify the bubble characteristics, and the frequency characteristics of the bubble under the influence of rotor-stator interaction were analyzed through the pressure signal.
Furthermore, Li [22] researched the working condition of the turbine through CFD simulation and obtained the distribution and propagation law of the rotor-stator interaction frequency in the bladeless region and the flow passage of the guide blade under the optimal opening. Li [23] studied the similarity of flows in the rotor-stator interaction influence zone of the prototype and model of the mixed-flow pump-turbine. It was found that under Q = 0.45Qd, the pressure side of the prototype and model blade showed significant flow differences and strong Reynolds number effect.
Although many scholars have conducted a lot of research on the mechanism of rotor-stator interaction in pump-turbine so far, the studies on the propagation law of the internal rotor-stator interaction frequency in pump turbines with splitter blades and the vibration characteristics under different working conditions are still limited. Splitter blades can reduce hydraulic loss and power loss, make the circumferential speed and pressure of the impeller more uniform and improve the flow field in the impeller and performance of pumps [24,25,26,27,28].
In this paper, the pump-turbine with splitter blades is the research object. First, the three-dimensional water model of the pump-turbine with splitter blades was established according to the scale of the actual model. Following this, the method of the numerical simulation was determined, and the results of the numerical simulation were compared with the experimental data to verify the external characteristics. Finally, under the same working condition with three different guide vane openings, the pressure pulsation and the force between the guide vane area and the runner area are studied, and the influence of the guide vane opening on the rotor-stator interaction between the guide vane and the runner analyzed. In fact, the combination of traditional pump-turbine and the splitter blades can obtain the advantages of both and reduce the shortcomings. It can better improve the performance curve of the pump, improve the efficiency and stability of small flow and partial load conditions, reduce the internal pressure pulsation of the flow field and improve the cavitation performance of the runner which provides a theoretical basis for the design and improvement of a pump-turbine runner and a reference for the improvement of the rotor-rotor interaction problem of pump-turbine.

2. Numerical Simulation and Tests

2.1. Description of Geometry Model

The pump-turbine with splitter blades is the core component of a pumped storage power station. In the study, the model of pump-turbine with splitter blades is scaled by 1:7.47 for a pump-turbine in a domestic pumped storage power station which mainly includes five parts. The five parts are respectively volute, stay vanes, guide vanes, draft tube and runner. The pump-turbine with splitter blades is a reversible unit. It has two working modes: the pump mode and the turbine mode. Basic parameters of the pump-turbine model are shown in Table 1. The number of the runner vanes is 10, including 5 long vanes and 5 short vanes. In the pump mode, the runner outlet diameter is 55 mm, the volute outlet diameter is 320 mm and the draft tube inlet diameter is 600 mm.

2.2. Working Principle

The pump-turbine is a reversible unit. The working condition of the pump is that the runner rotates anticlockwise, and the flow firstly enters from the draft tube. After the work and activity of the runner, it is guided into the volute by the double-row cascade with a fixed guide blade. Then the casing converts the kinetic energy of the fluid to static pressure energy, to pump the water to the upstream reservoir. The working condition of the turbine is that the flow is entered via an inlet nozzle. The flow rate of water will get reduced along the length of the volute, decreasing area of volute will make sure that flow is entered to run a region almost at a uniform velocity. Stay vanes and guide vanes are fitted at the entrance of the runner to convert one part of pressure energy to kinetic energy. Stay vanes steers the flow towards the runner section thus it reduces swirl of inlet flow. In the runner, water is entered radially and leave axially, both impulse force and lift force will make the runner rotate by clockwise, and ends up flowing out from the draft tube. The runner is connected to the generator via a shaft for electricity production.

2.3. Water Model Establishment and Meshing

The whole computation domain was split into five parts for modeling: volute, stay vanes, guide vanes, draft tube and runner, and full flow geometric model as shown in Figure 1. The Integrated Computer Engineering and Manufacturing Code (ICEM) is a professional CAE pre-processing software. As the standard meshing software for Fluent and CFX, it has powerful model repair capabilities and can automatically remesh the geometric model after the geometric size is changed. The paper uses ICEM CFD to divide the structural mesh of each component of the pump-turbine to ensure that the quantity, quality, and boundary layer of the grid meet the requirements of use. The specific grid of each component is shown in Figure 2.

2.4. Boundary Condition Setting

ANSYS CFX is a powerful CFD software, mainly used for internal and external fluid flow, heat transfer, chemical reactions and combustion, multiphase flow and porous media, steady-state and non-steady-state analysis and other engineering-related issues. In this paper, ANSYS CFX is used to perform a full-channel numerical simulation of the flow field in the pump-turbine. First, the steady calculation uses a SST model; the reference pressure in the calculation domain is a standard atmospheric pressure; under pump conditions, water flows in from the inlet of the draft tube and flows out from the outlet of the volute and the inlet and outlet boundary conditions are set to total pressure and mass flow; the dynamic-static interface is set to the frozen rotor mode and the rest of the static interface is set to none; the turbulence intensity I = 5%; the wall condition is slip-free and smooth; the discrete format is the second-order upwind and the convergence residual accuracy is 10−5. Then, the SST-SAS model is used for unsteady calculation and the initial value of the calculation is the steady calculation result of the corresponding working condition. The multiple reference frame (MRF) model is used for dynamic and static component simulation; the dynamic and static interface of runner and guide vane and draft tube adopts sliding grid method rotor-stator; the time when the impeller rotates 2° is taken as a time step and 10 rotation cycles are used as the calculation duration.

2.5. Mesh Independence Test

Since the number of mesh has a great impact on the calculation results, the mesh number independence analysis was performed for 7 sets of grids. A total of 7 groups of mesh number schemes are set at uniform intervals between 4 million and 10 million. The number of grids in each computational domain is shown in Table 2. The grid-independent results are obtained based on the external data of the guide vane of 17.5° opening under the rated operating conditions in Figure 3. As can be seen, with the increase of mesh number, the relative head error tends to 1. Therefore, the simulation results are verified to be reliable and accurate in external performance. When the total number of grids in each computational domain is more than 7 million, the results of external characteristics remain stable and the number of grids is independent. Therefore, Case 4 is selected, and the total number of grids is 7,213,000.

2.6. Experiment Validations

To study the external characteristics of the pump-turbine in pump mode under different opening conditions, opening 9.8°, 17.5° and 24.8° are selected for analysis in this paper. Taking 24.8° as an example, the angle between Number 3 and Number 5 is the guide vane opening in Figure 4.
Annotation: 1. midpoint of airfoil; 2. bone line of airfoil; 3. tangent at midpoint of airfoil; 4. circle at midpoint of airfoil; 5. tangent of circle at midpoint of airfoil.
The flow and head are normalized as flow coefficient φ and head coefficient ψ by the following equations:
φ = Q u 2 R 2 2
ψ = 2 g H u 2 2
In the formula, H —head, m; u 2 —outlet circumferential velocity of runner, m/s; g —acceleration due to gravity, m/s2; Q —flow rate, m3/s; R 2 —radius of high-pressure side of runner, m.
As can be seen in Figure 5, the simulation head and efficiency both show a good agreement with the test. The maximum error of the lift coefficient in each condition is less than 4.5%, and the maximum error of the efficiency is less than 3.2%. Therefore, the accuracy of the CFD calculation strategy in this paper can be proved, and the calculation results can be used as the basis for analysis. It can be seen from the flow-head curve that small opening with small flow head is larger, while the large opening with large flow head is smaller; the hump phenomenon exists in the vicinity of 0.5–0.75Qd with different openings, and the hump phenomenon is more obvious when the opening is larger. It can be seen from the flow-efficiency curve that the small opening is more efficient at a small flow rate while the large opening is more efficient at a large flow rate, and the small opening is more sensitive to the change of flow rate. With the increase of the opening, the rated flow point 1.0Qd is shifted towards the large flow, and the high efficiency interval is wider. When the guide vane opening is 17.5°, the rated flow point has the highest efficiency, indicating that different flows have the corresponding optimal opening and too large or too small guide vane opening will lead to additional energy loss.

3. Results and Discussion

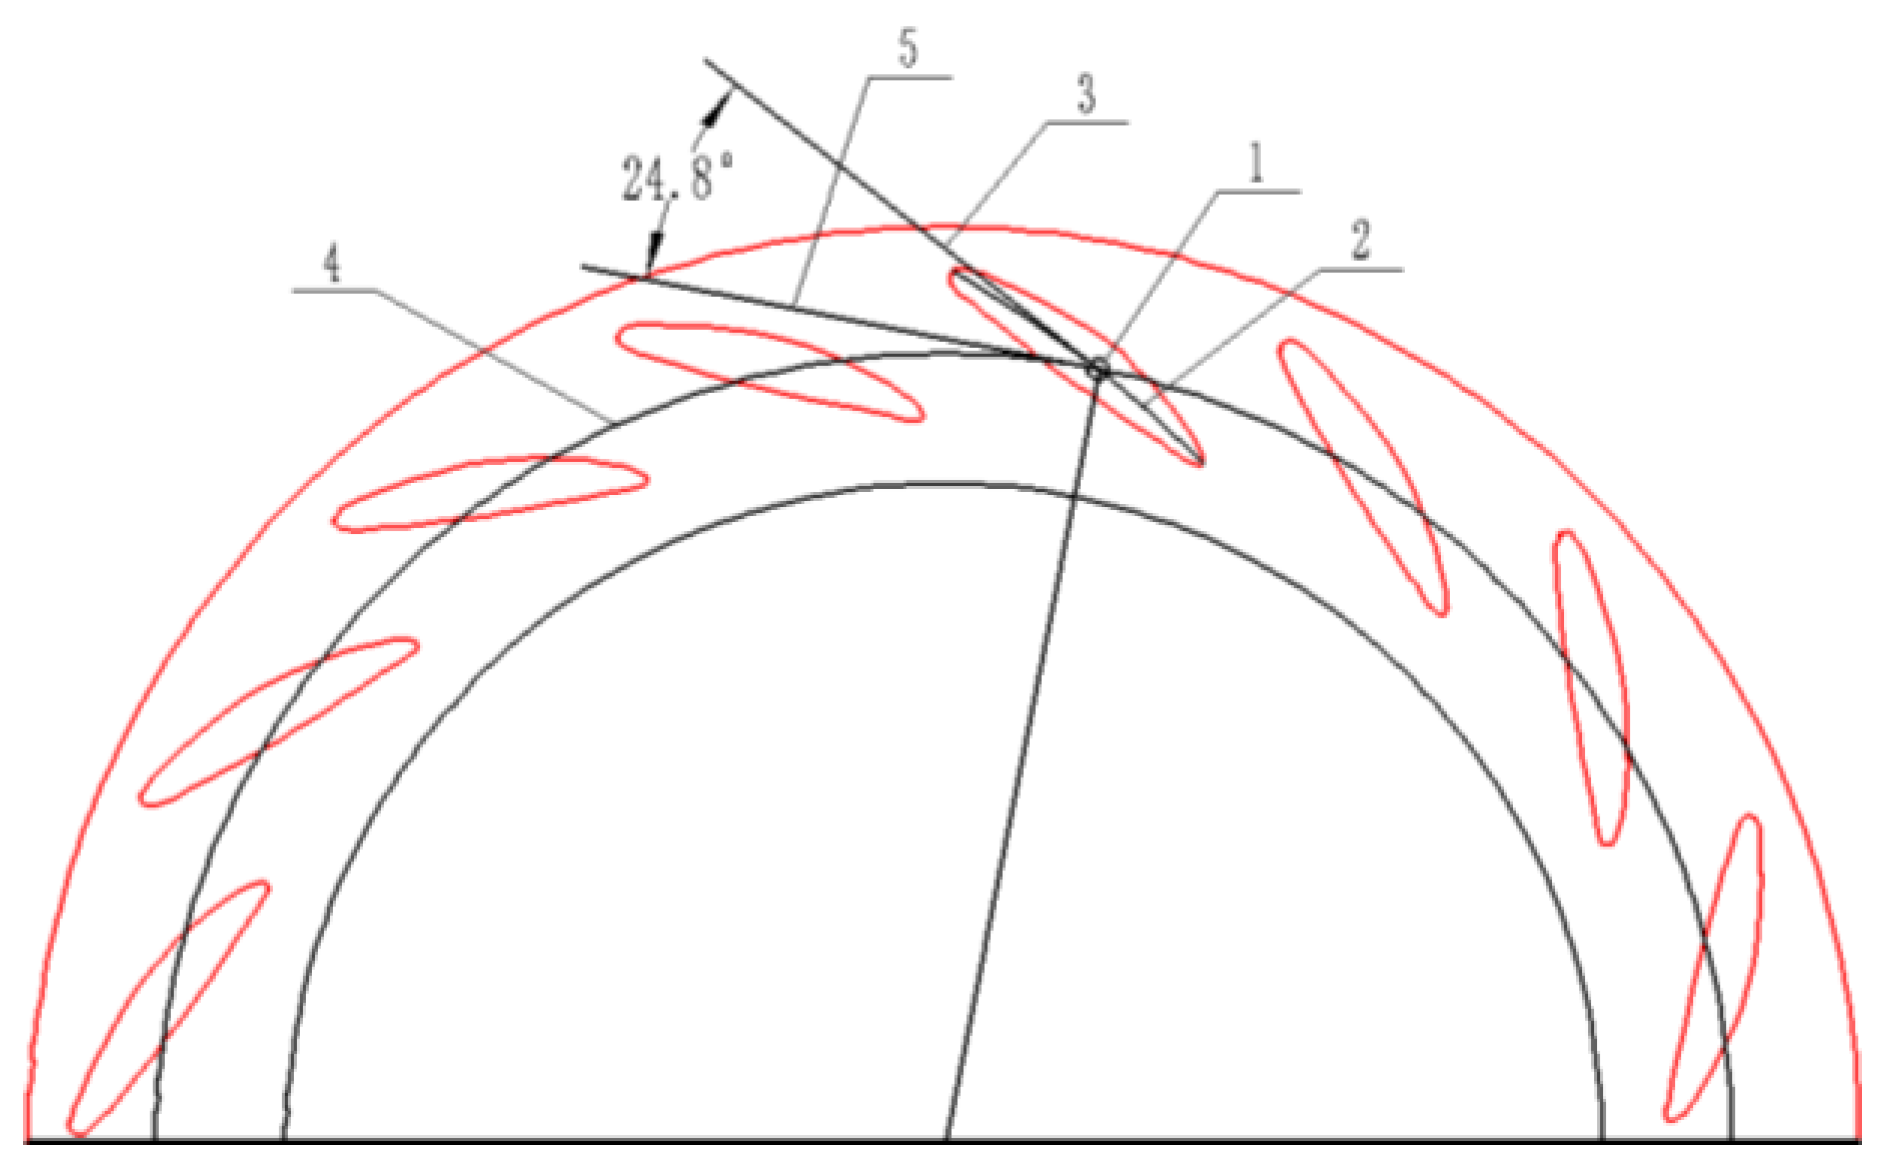
When the pump-turbine runs in the condition of the pump, it will select a suitable opening of guide vane according to the demand of storage. Therefore, the rated conditions of the guide vanes with a small opening of 9.8°, an optimal opening of 17.5°, and a large opening of 24.8° were selected as the research objects. The unsteady pulsation characteristics of the guide vane region and the runner region are emphasized, and the influence of the guide vane opening on the rotor-stator interaction is compared and analyzed.

3.1. Setting of Monitor Points

To obtain the unsteady pulsation distribution and propagation characteristics in the runner and the guide vanes, several pressure monitor points were selected in the runner region. Figure 6 shows the 20 pressure monitor points on the surface of the runner. The monitor point from the outlet near the long blade pressure surface to the inlet is RN01−05; the monitor points from the outlet near the short blade suction surface to the inlet is RN06−10; the monitor points from the outlet near the short blade pressure surface to the inlet is RN11−15 and the monitor points from the outlet near the long blade suction surface to the inlet is RN16−20.
Figure 7 shows 160 pressure monitor points in different sections (top span0.1, middle span0.5, and bottom span0.9) of the double-row cascade flow passage. There are 48 × 3 points in the circumferential direction of the bladeless area, which are denoted as GR001−GR048 (span0.5), GR101−GR148 (span0.1), and GR001−GR048 (span0.9) in a counter-clockwise direction. Four monitor points are arranged in each span0.5 section of four different guide vane passages, totaling 16. According to the serial number of the passage, they are GV001−GV004 (passage of guide vane), SG001−SG004 (between guide vanes and stay vanes), SV001−SV004 (passage of stay vanes) and SS001−SS004 (outlet of stay vanes).

3.2. Analysis of Unsteady Pressure Pulsation in the Runner Region

In this paper, the pressure pulsation coefficient C p is used to represent the pulsation amplitude, and the standard deviation coefficient of pressure pulsation C p is used to represent the overall pulsation intensity over a period of time. Their equations are as follows:
C p = ( p p _ ) / ( 0.5 ρ u 2 2 )
C p = 1 1 2 ρ u 2 2 1 N i = 1 N ( p i p _ ) 2
where, ρ —liquid density, kg/m3; u 2 —peripheral speed, m/s; p —pressure, Pa; p _ —average pressure, Pa; p i —pressure, Pa.
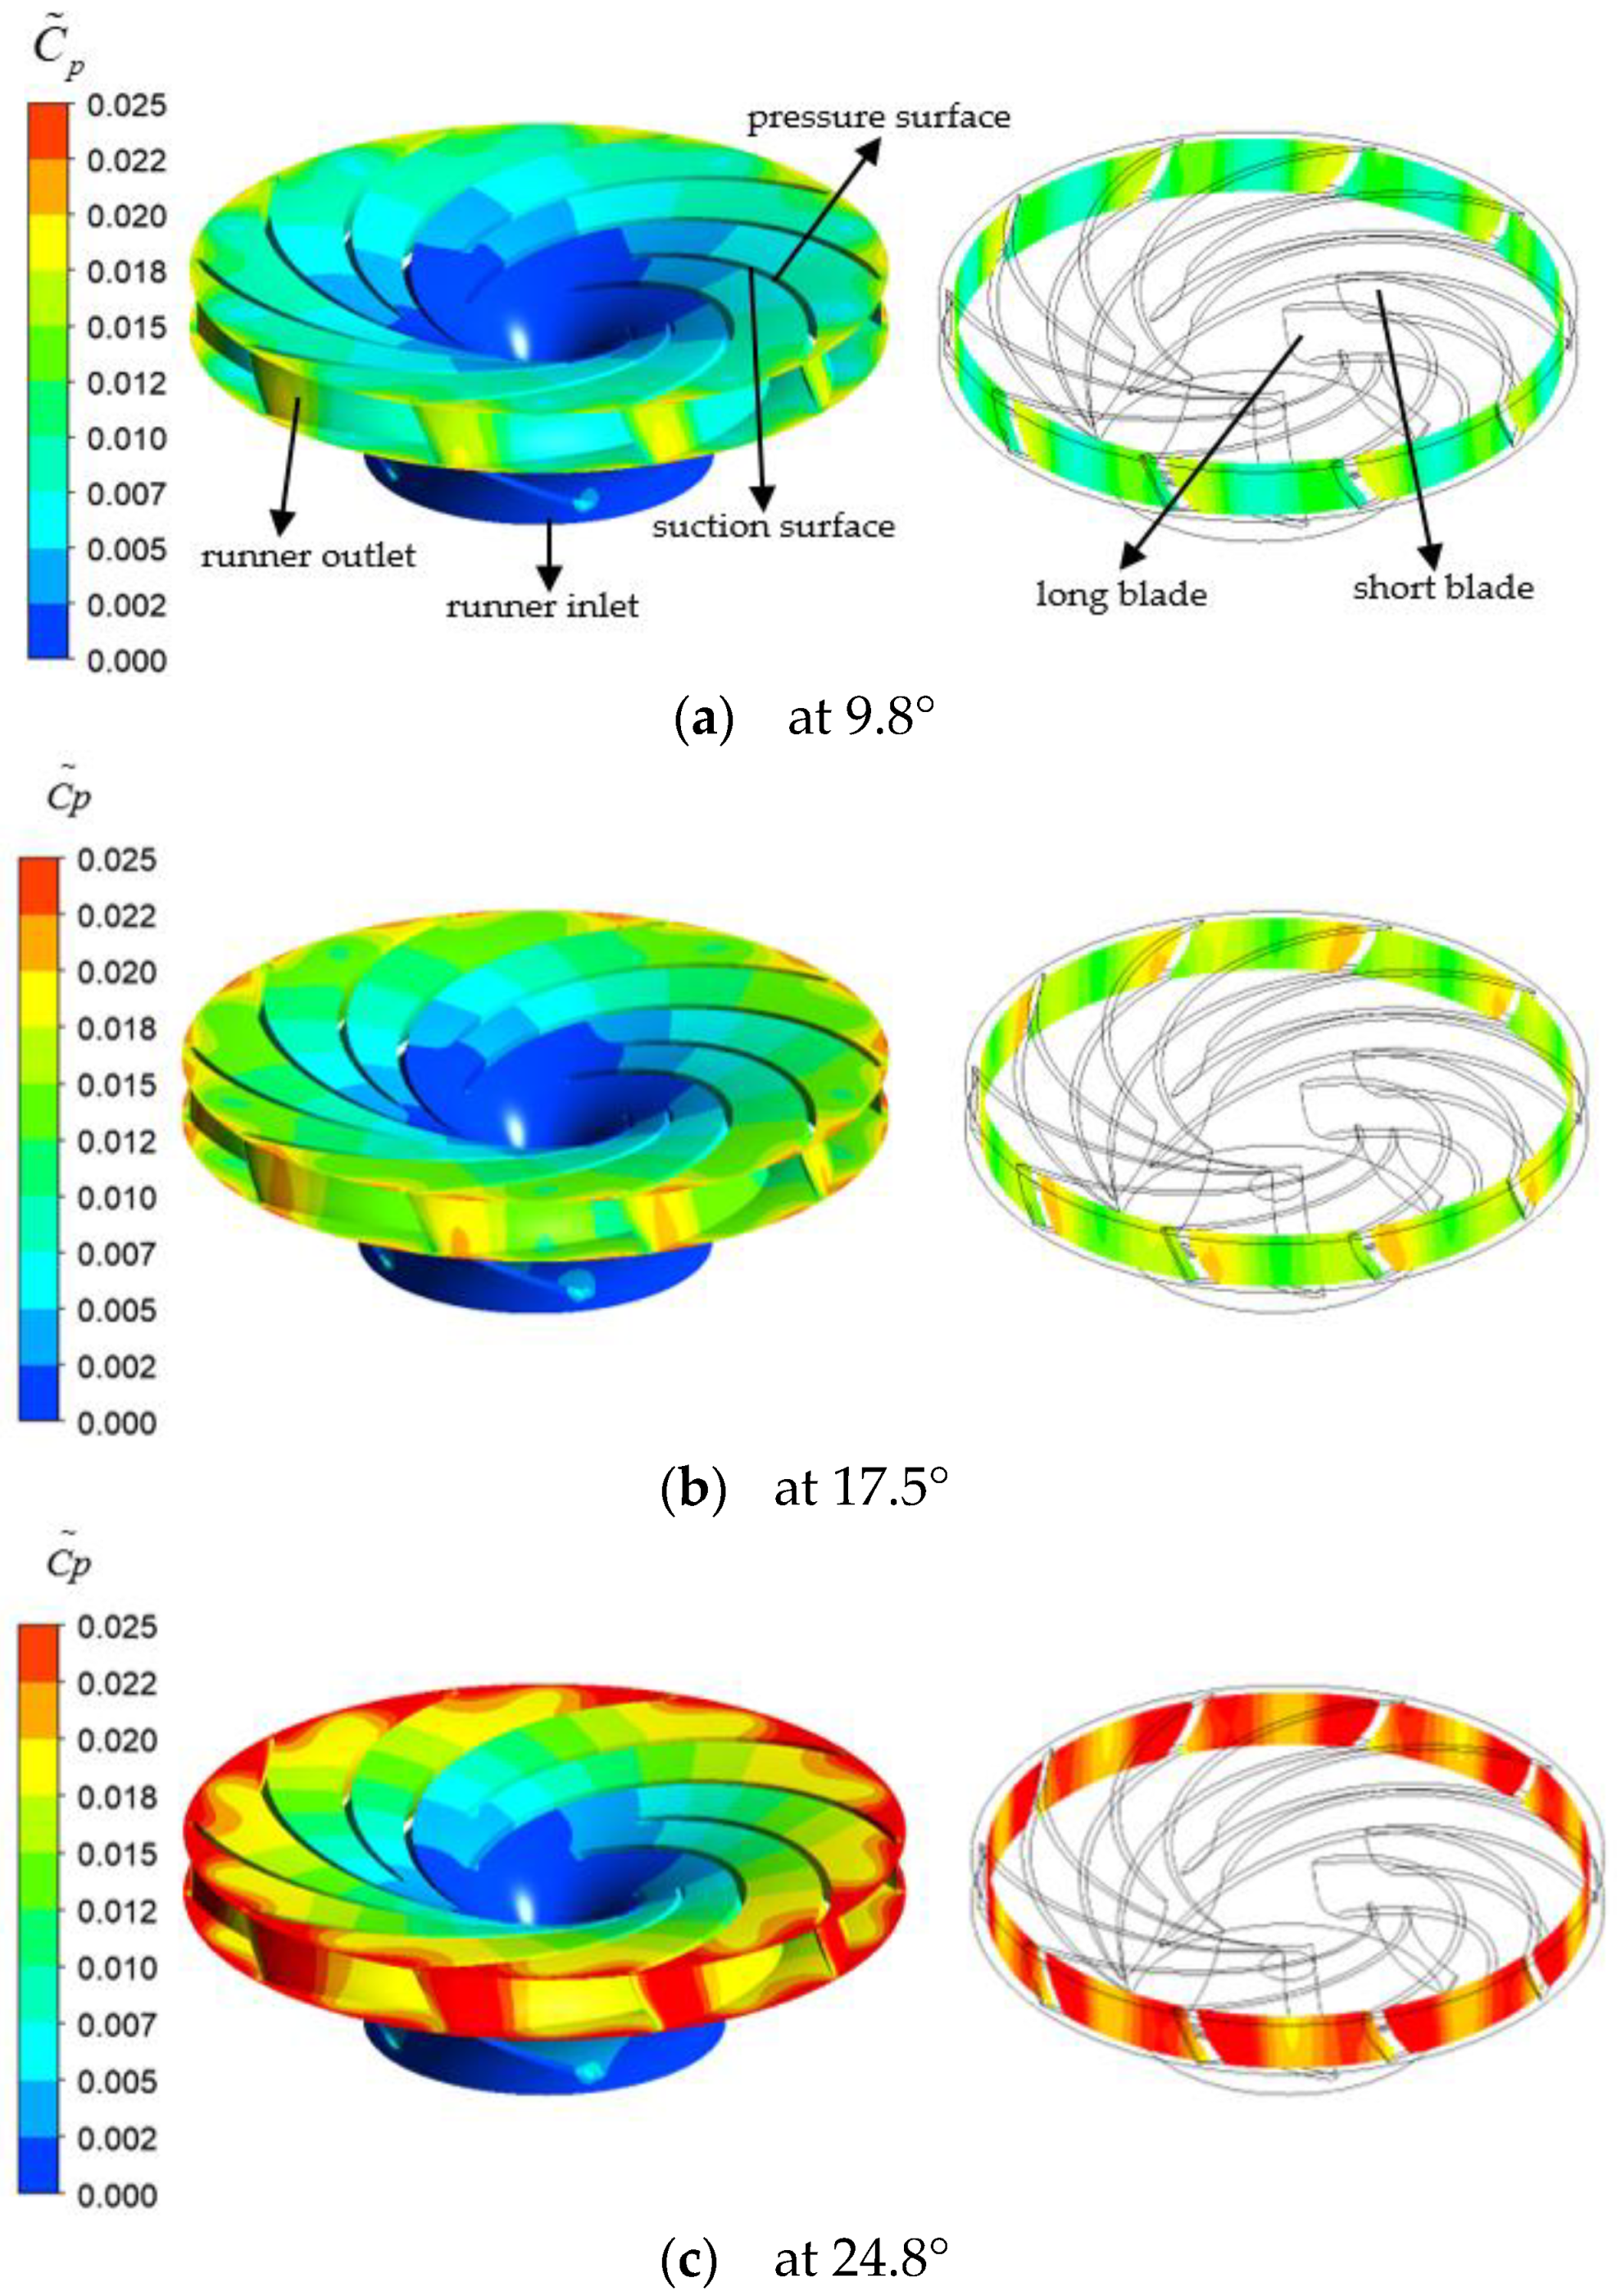
Figure 8 shows the distribution of the standard deviation coefficient of pressure pulsation on the surface of the runner and the outlet torus within 5 rotation cycles under different guide blade openings. As shown in Figure 8, under the influence of rotor-stator interaction between the runner and the guide vanes, the pressure pulsation intensity at the outlet of the runner is relatively large. Moreover, the pressure pulsation near the trailing edge pressure surface of the blade near the bottom ring is particularly intense, indicating that the rotor-stator interaction near the bottom ring is the most significant and fatigue failure is more likely to occur here, which is not conducive to the stable operation of the unit. The pressure pulsation intensity at the inlet of the runner is small. Under the pump condition, the outlet of the draft tube is connected to the inlet of the runner and the steady flow in static draft tube will impinge on the rotational blades especially protruding long blades, causing high pressure pulsation. Thus, the pressure pulsation at the inlet side of the long blades is obvious under the influence of rotor-stator interaction between the long blades and the outlet of the draft tube. In addition, as can be seen from the exit torus, the pressure pulsation intensity near the suction surface of the blade trailing edge is small, indicating that the influence of the rotor-stator interaction on this position is small, and the difference between two sides of the blade trailing edge is large. By comparing the diagrams of pressure pulsation intensity distribution under three different openings, it can be seen that the guide blade opening has a significant influence on the pressure pulsation of the runner. With the increase of guide blade opening, the pressure pulsation intensity of the runner gradually increases, especially the change from the optimal opening of 17.5° to the wide opening of 24.8° is the most obvious, indicating that the increase of guide blade opening will reduce the distance between the stay vanes and the guide vanes, thus intensifying rotor-stator interaction and increasing the pressure pulsation intensity of the runner.
The results of the upper section show that the rotor-stator interaction is the strongest at the outlet of the runner blades. Following this, the time-frequency characteristics of four monitor points near the pressure surface and suction surface of the long and short blades are analyzed. 
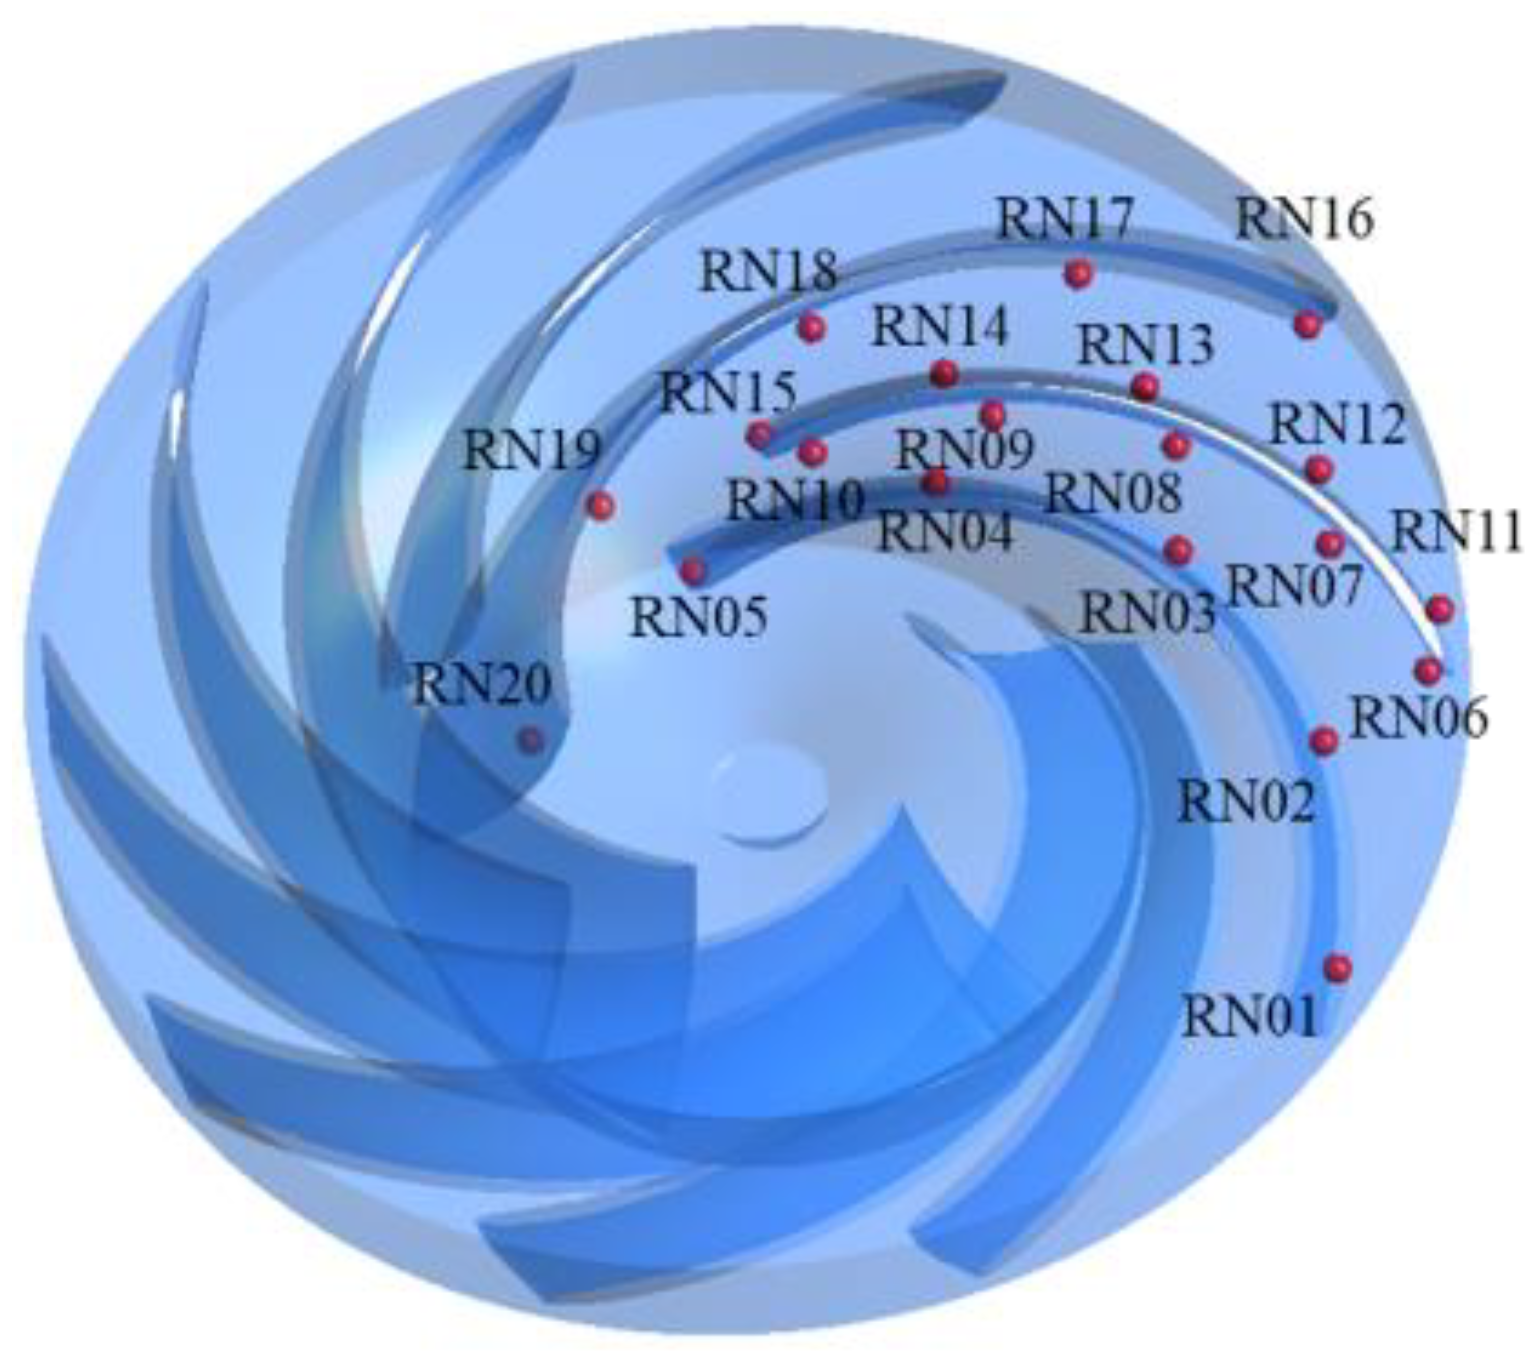
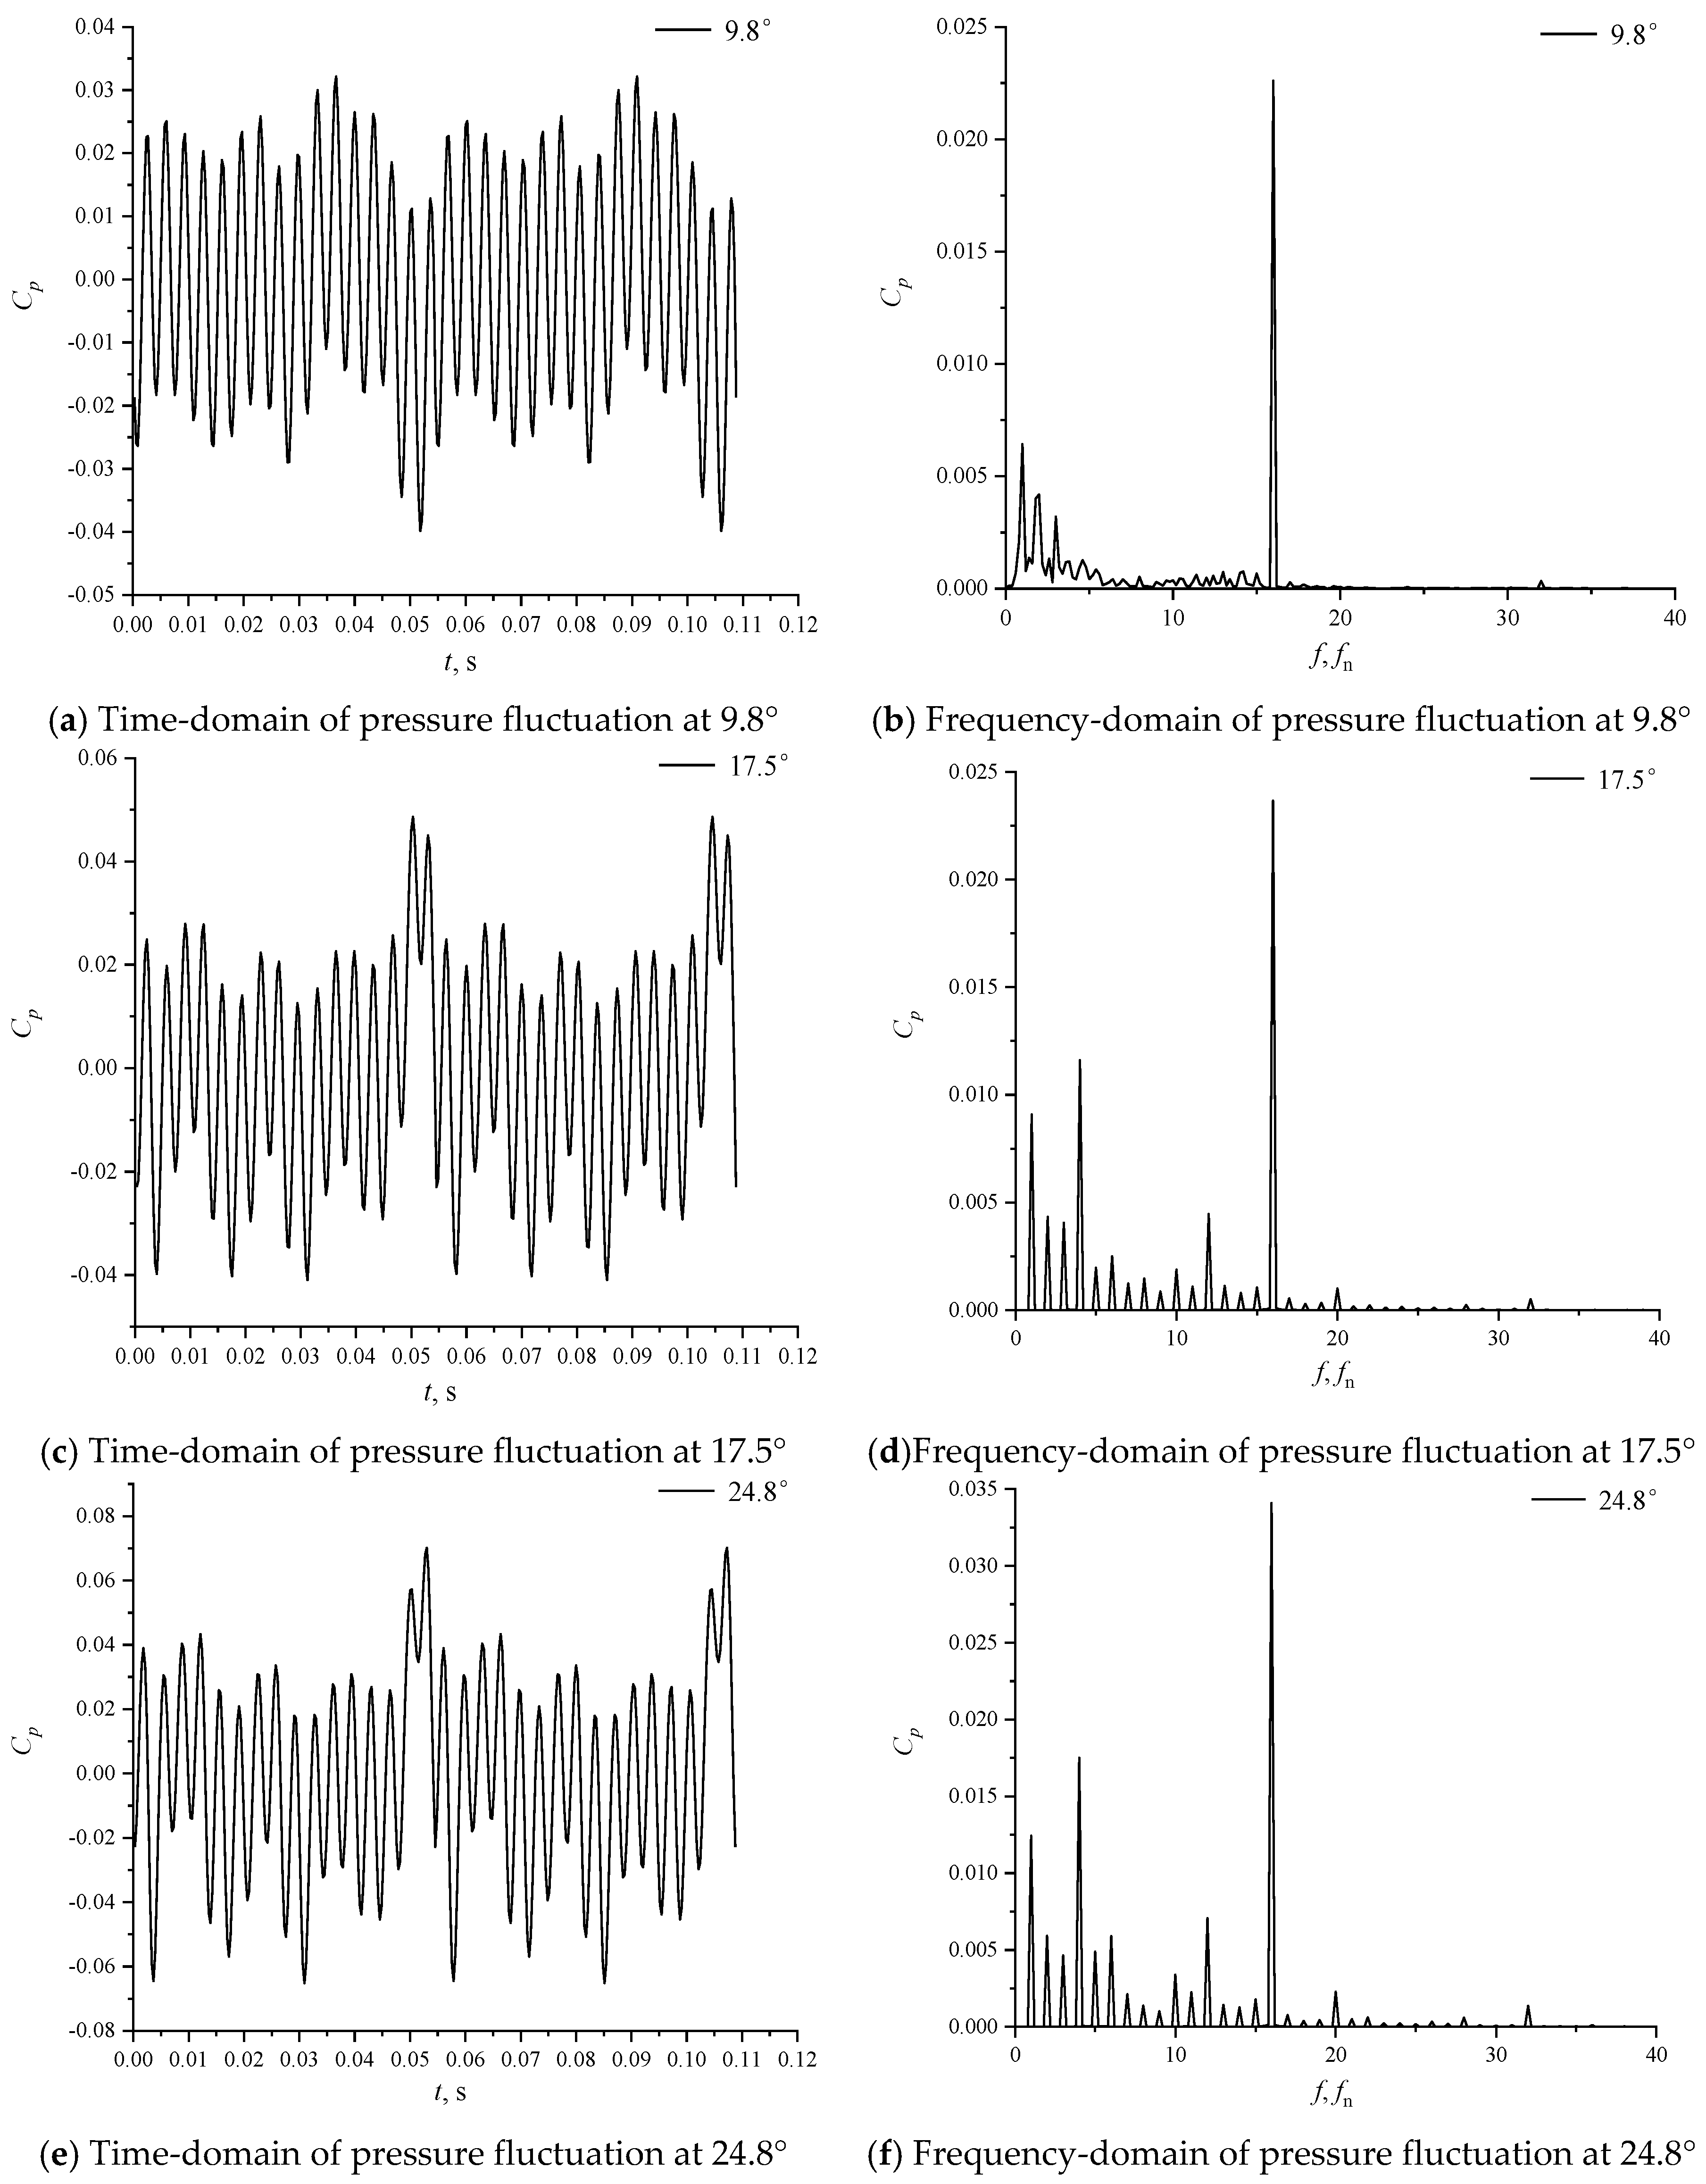
Figure 9 shows the time and frequency domain distribution of pressure fluctuation extracted from the pressure surface monitor point RN01 at the outlet of the long blade under different openings. In the figure, the time-domain is the change of pressure pulsation in two rotation cycles. It can be seen from the figure that the time-domain distribution of pressure pulsation under various degrees of openings has obvious periodicity, and there are 16 peaks and valleys in a rotation period. By comparing the frequency domains of each opening, it can be found that there are more nonlinear frequency components near the axial frequency with a small opening, which indicates that the flow instability phenomenon is relatively obvious under the condition of a small opening, while the protrusions frequency under the optimal opening and large opening are both axial frequency doubling. In addition to the axial frequency and the guide vane passage frequency of 16fn, there is also a higher amplitude of 4fn. By observing the time domain, it can be seen that there are four prominent troughs in a rotation period, and when t = 0.05 s–0.055 s, the blade passes through the guide blade passage near the volute tongue, the pressure pulsation changes greatly. This may be due to the misalignment of the volute tongue and its flow passage, resulting in different degrees of rotor-stator interaction between splitter blades. There are 4 similar pulsation zones in the circumferential direction.
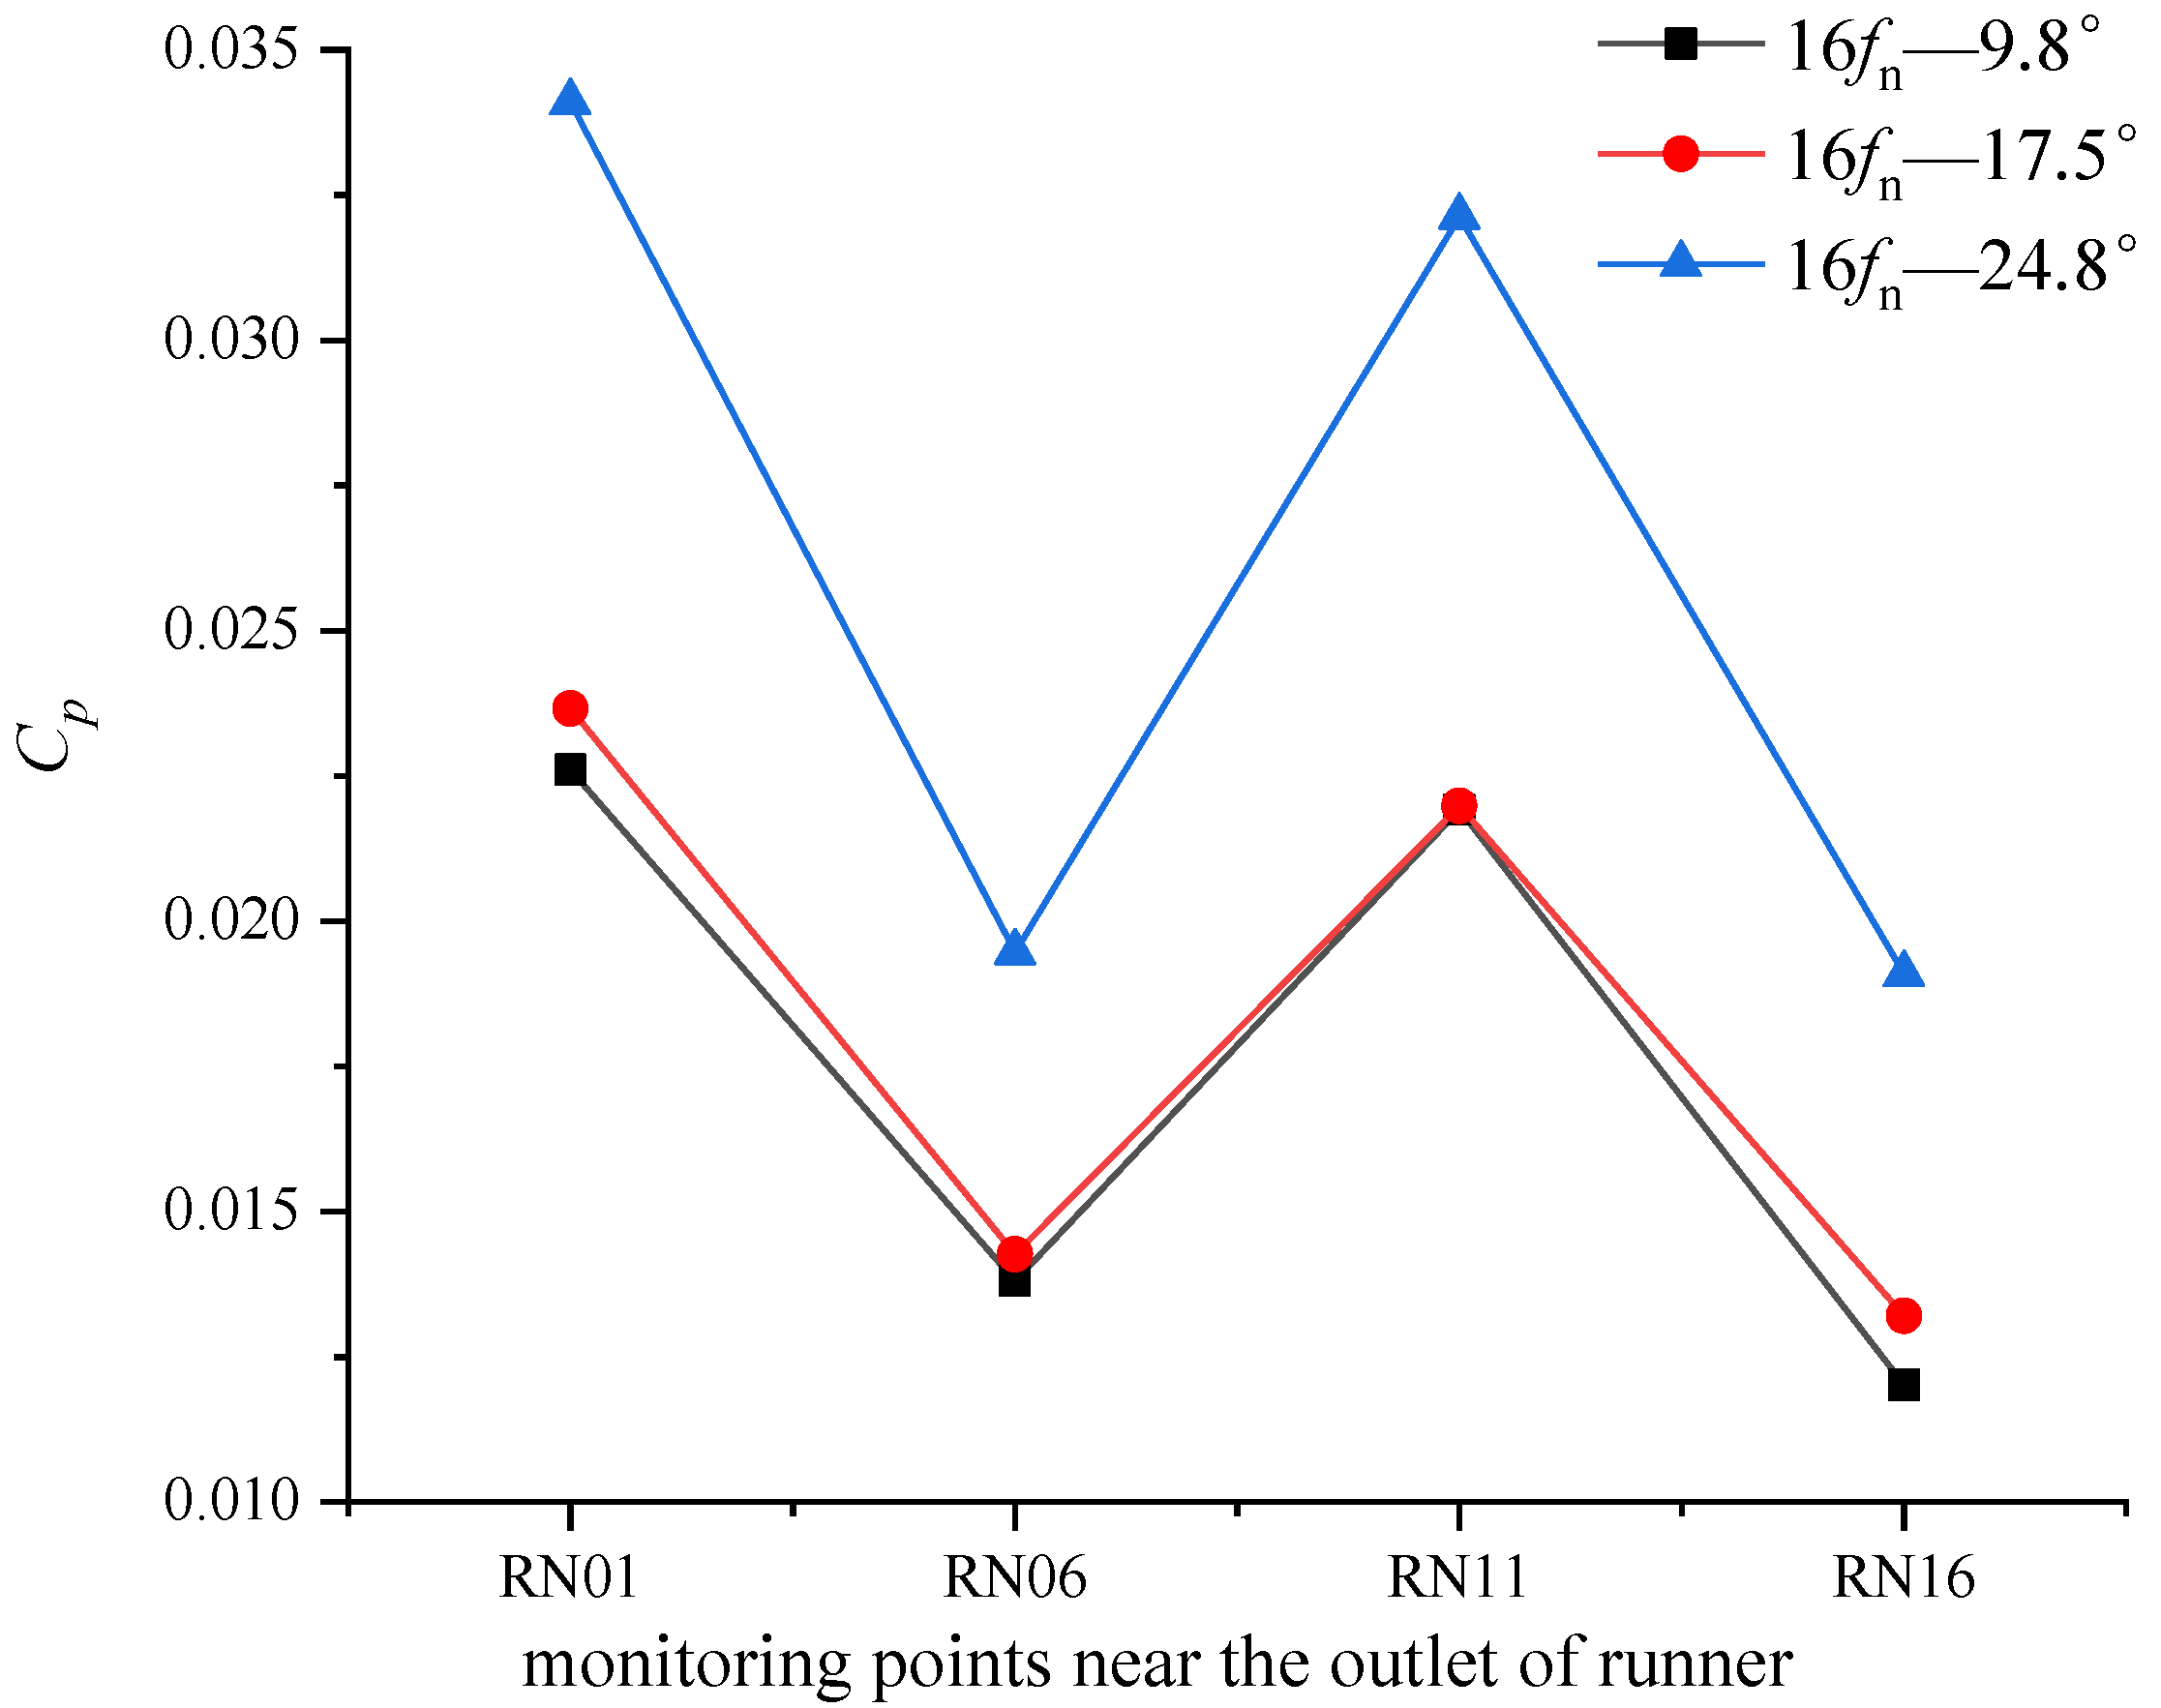
Figure 10 shows the distribution of the amplitude of the rotor-stator interaction main frequency 16fn at the outlet of the runner at different opening degrees. Among them, the monitor points RN01, RN06, RN11, and RN16 are located on the pressure surface of the long blade, the suction surface of the short blade, the pressure surface of the short blade, and the suction surface of the long blade. As can be seen from the figure, the amplitude of the rotor–stator interaction frequency is limited when the guide blade opening increases from a small opening to an optimal opening. The amplitude of measuring point RN16 on the suction surface of the long blade is the most significant, and the optimal opening is about 9.8% higher than that of the small opening. From the optimal opening to the large opening, the amplitude of the rotor–stator interaction frequency is greatly increased, and the amplitude of each measuring point is about 40% higher. The amplitude at the measuring point RN11 on the short blade pressure surface increased the most, and the large opening increased by about 46.2% compared with the optimal opening, which further indicated that the increase of guide blade opening led to the intensification of rotor–stator interaction is the main reason for the increase of pressure pulsation intensity on the runner surface. In addition, the difference of flow at the outlet of long and short blades will lead to the difference in the degree of rotor–stator interaction between the stay vanes and the guide vanes, which is manifested as the stronger rotor–stator interaction at the long blades.
To further analyze the time-frequency characteristics of rotor–stator interaction, a CWT (continuous wavelet transform) is adopted in this paper to extract the distribution of a specific frequency over a period of time. Compared with the short-time Fourier transform, the wavelet transform has many advantages in extracting the time-frequency distribution of the signal. It can take different localization treatments for high-frequency and low-frequency signals. In this paper, Morlet wavelet, which has good adaptability and is widely used in pulsating signal analysis, is selected as the wavelet basis function. The function formula of continuous wavelet change is as follows [29]:
W f ( a , b ) = | a | 1 2 + x ( t ) ψ ( t b a ) d t
where in Formula (5), W f ( a , b ) —wavelet transform coefficient; ψ ( t ) —mother wavelet; x ( t ) —turbulence frequency of the pulsating signal; —conjugate; a—expansion factor; b—translation factor.
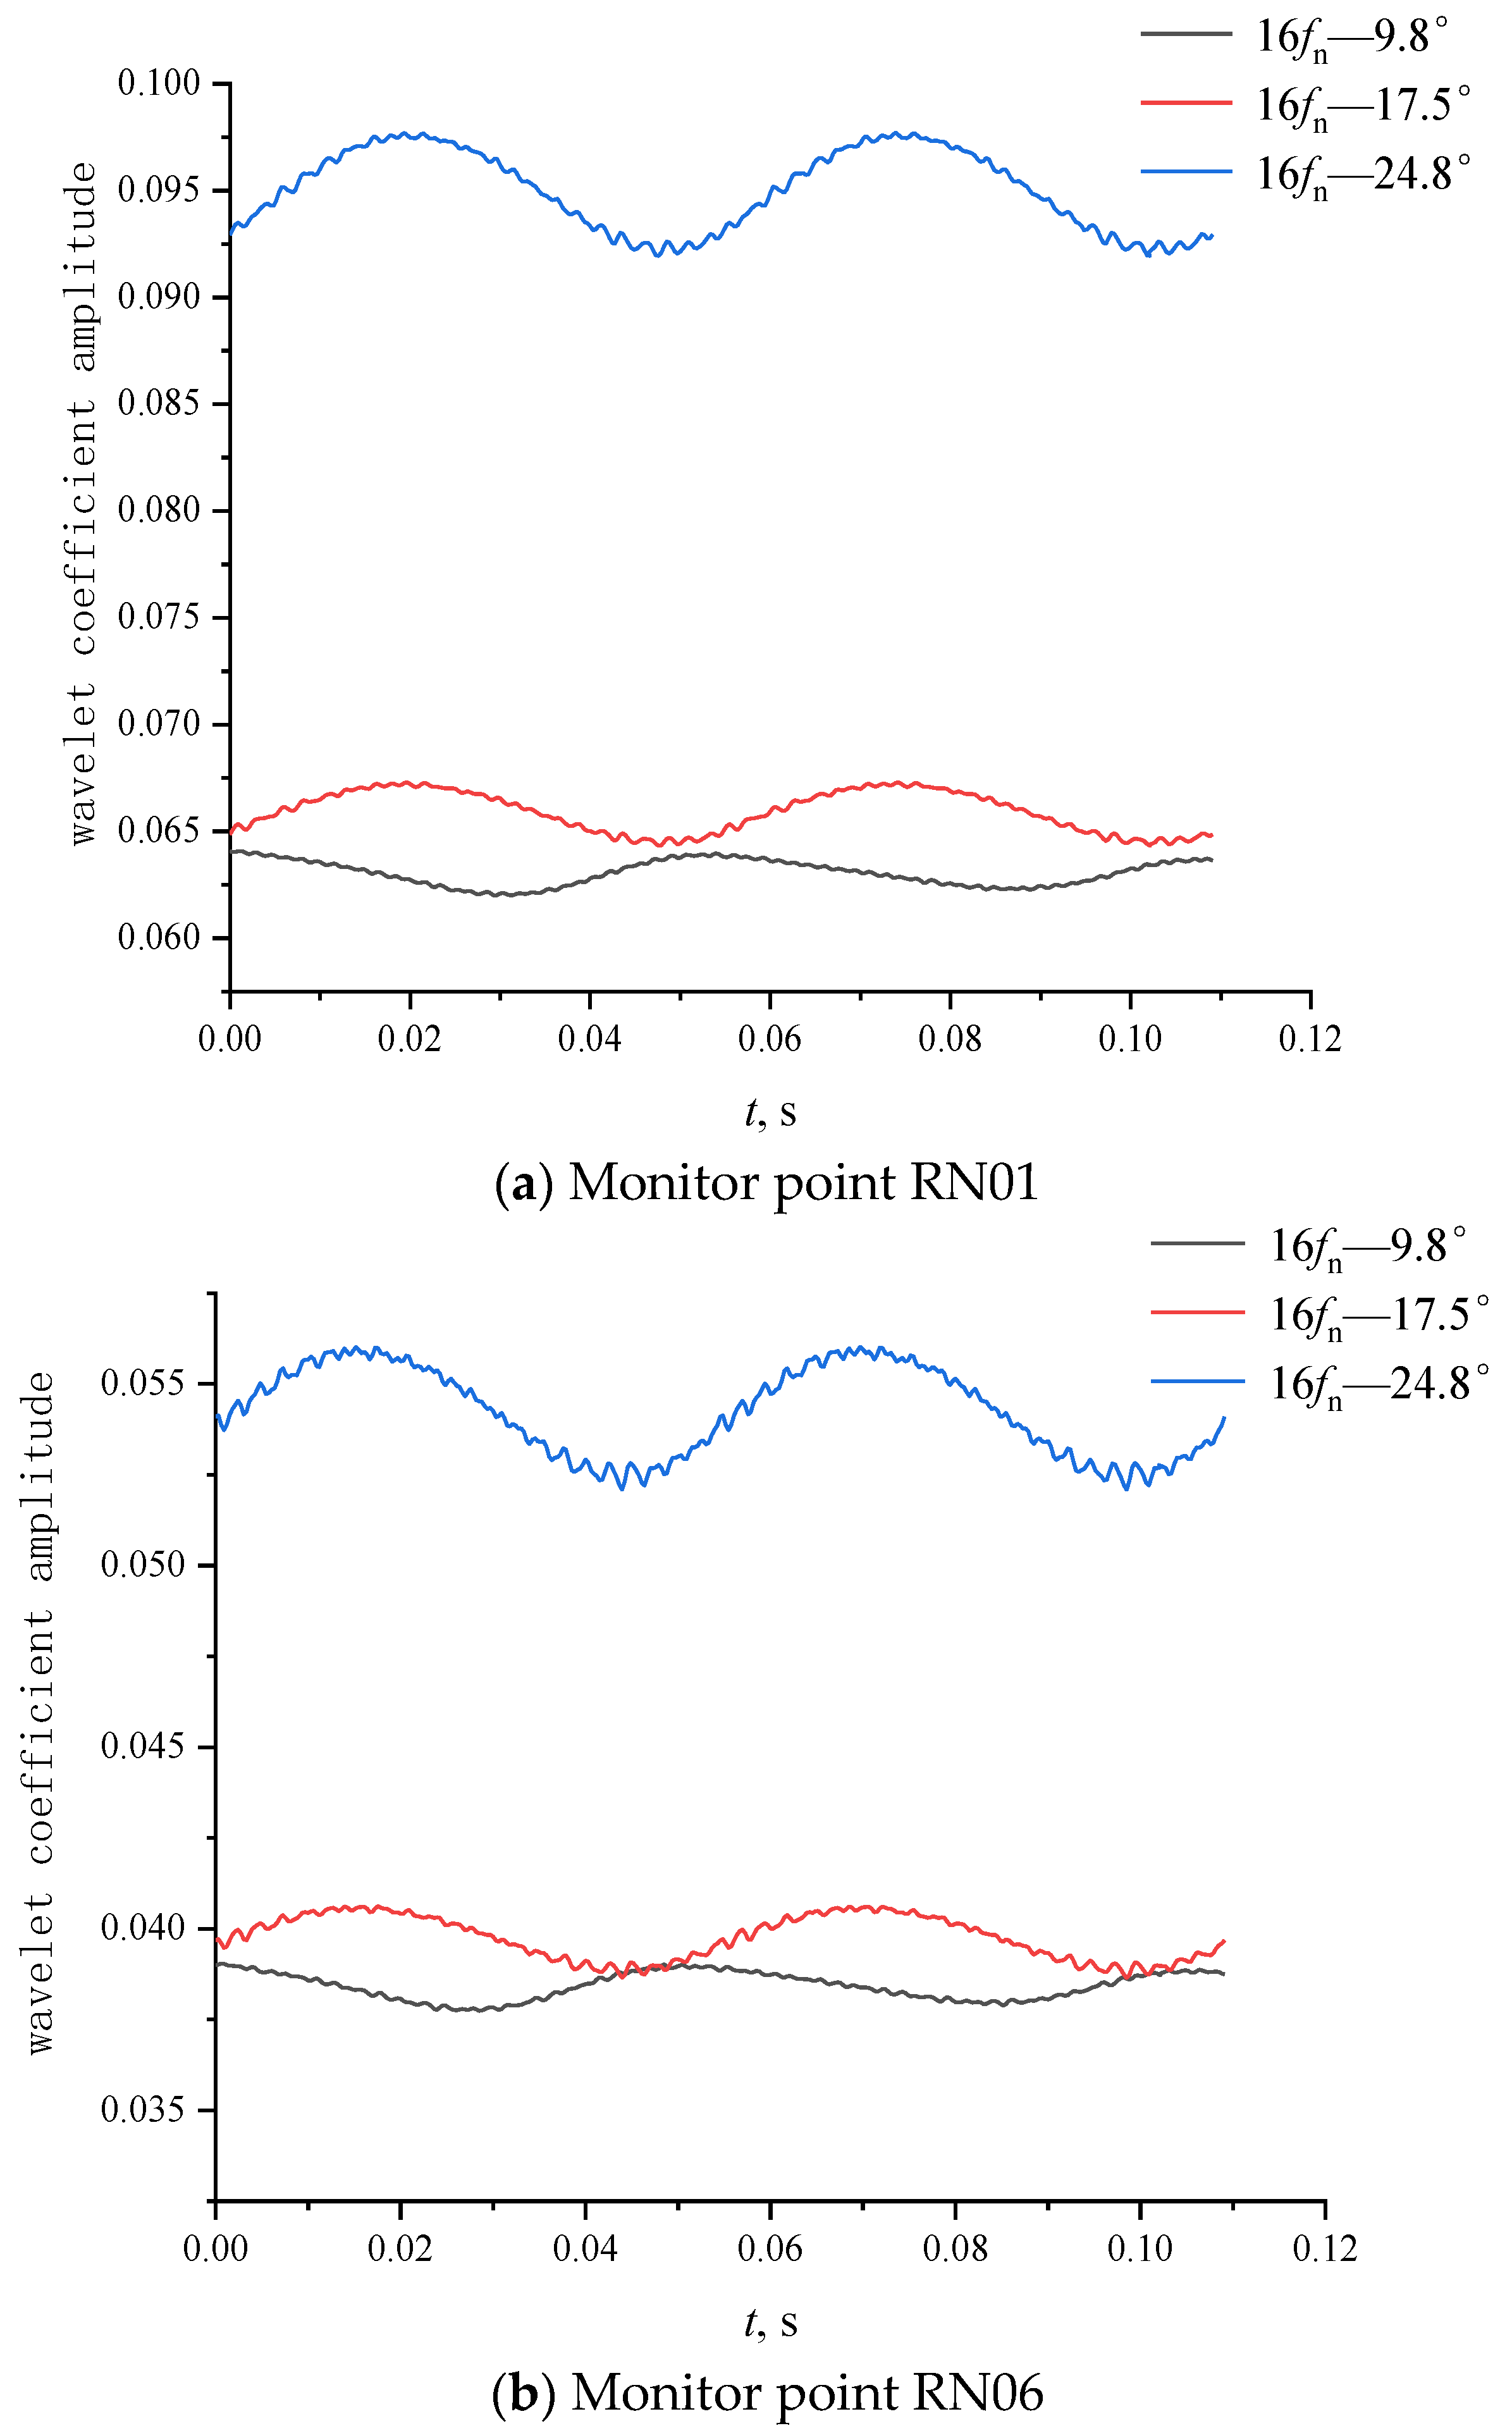
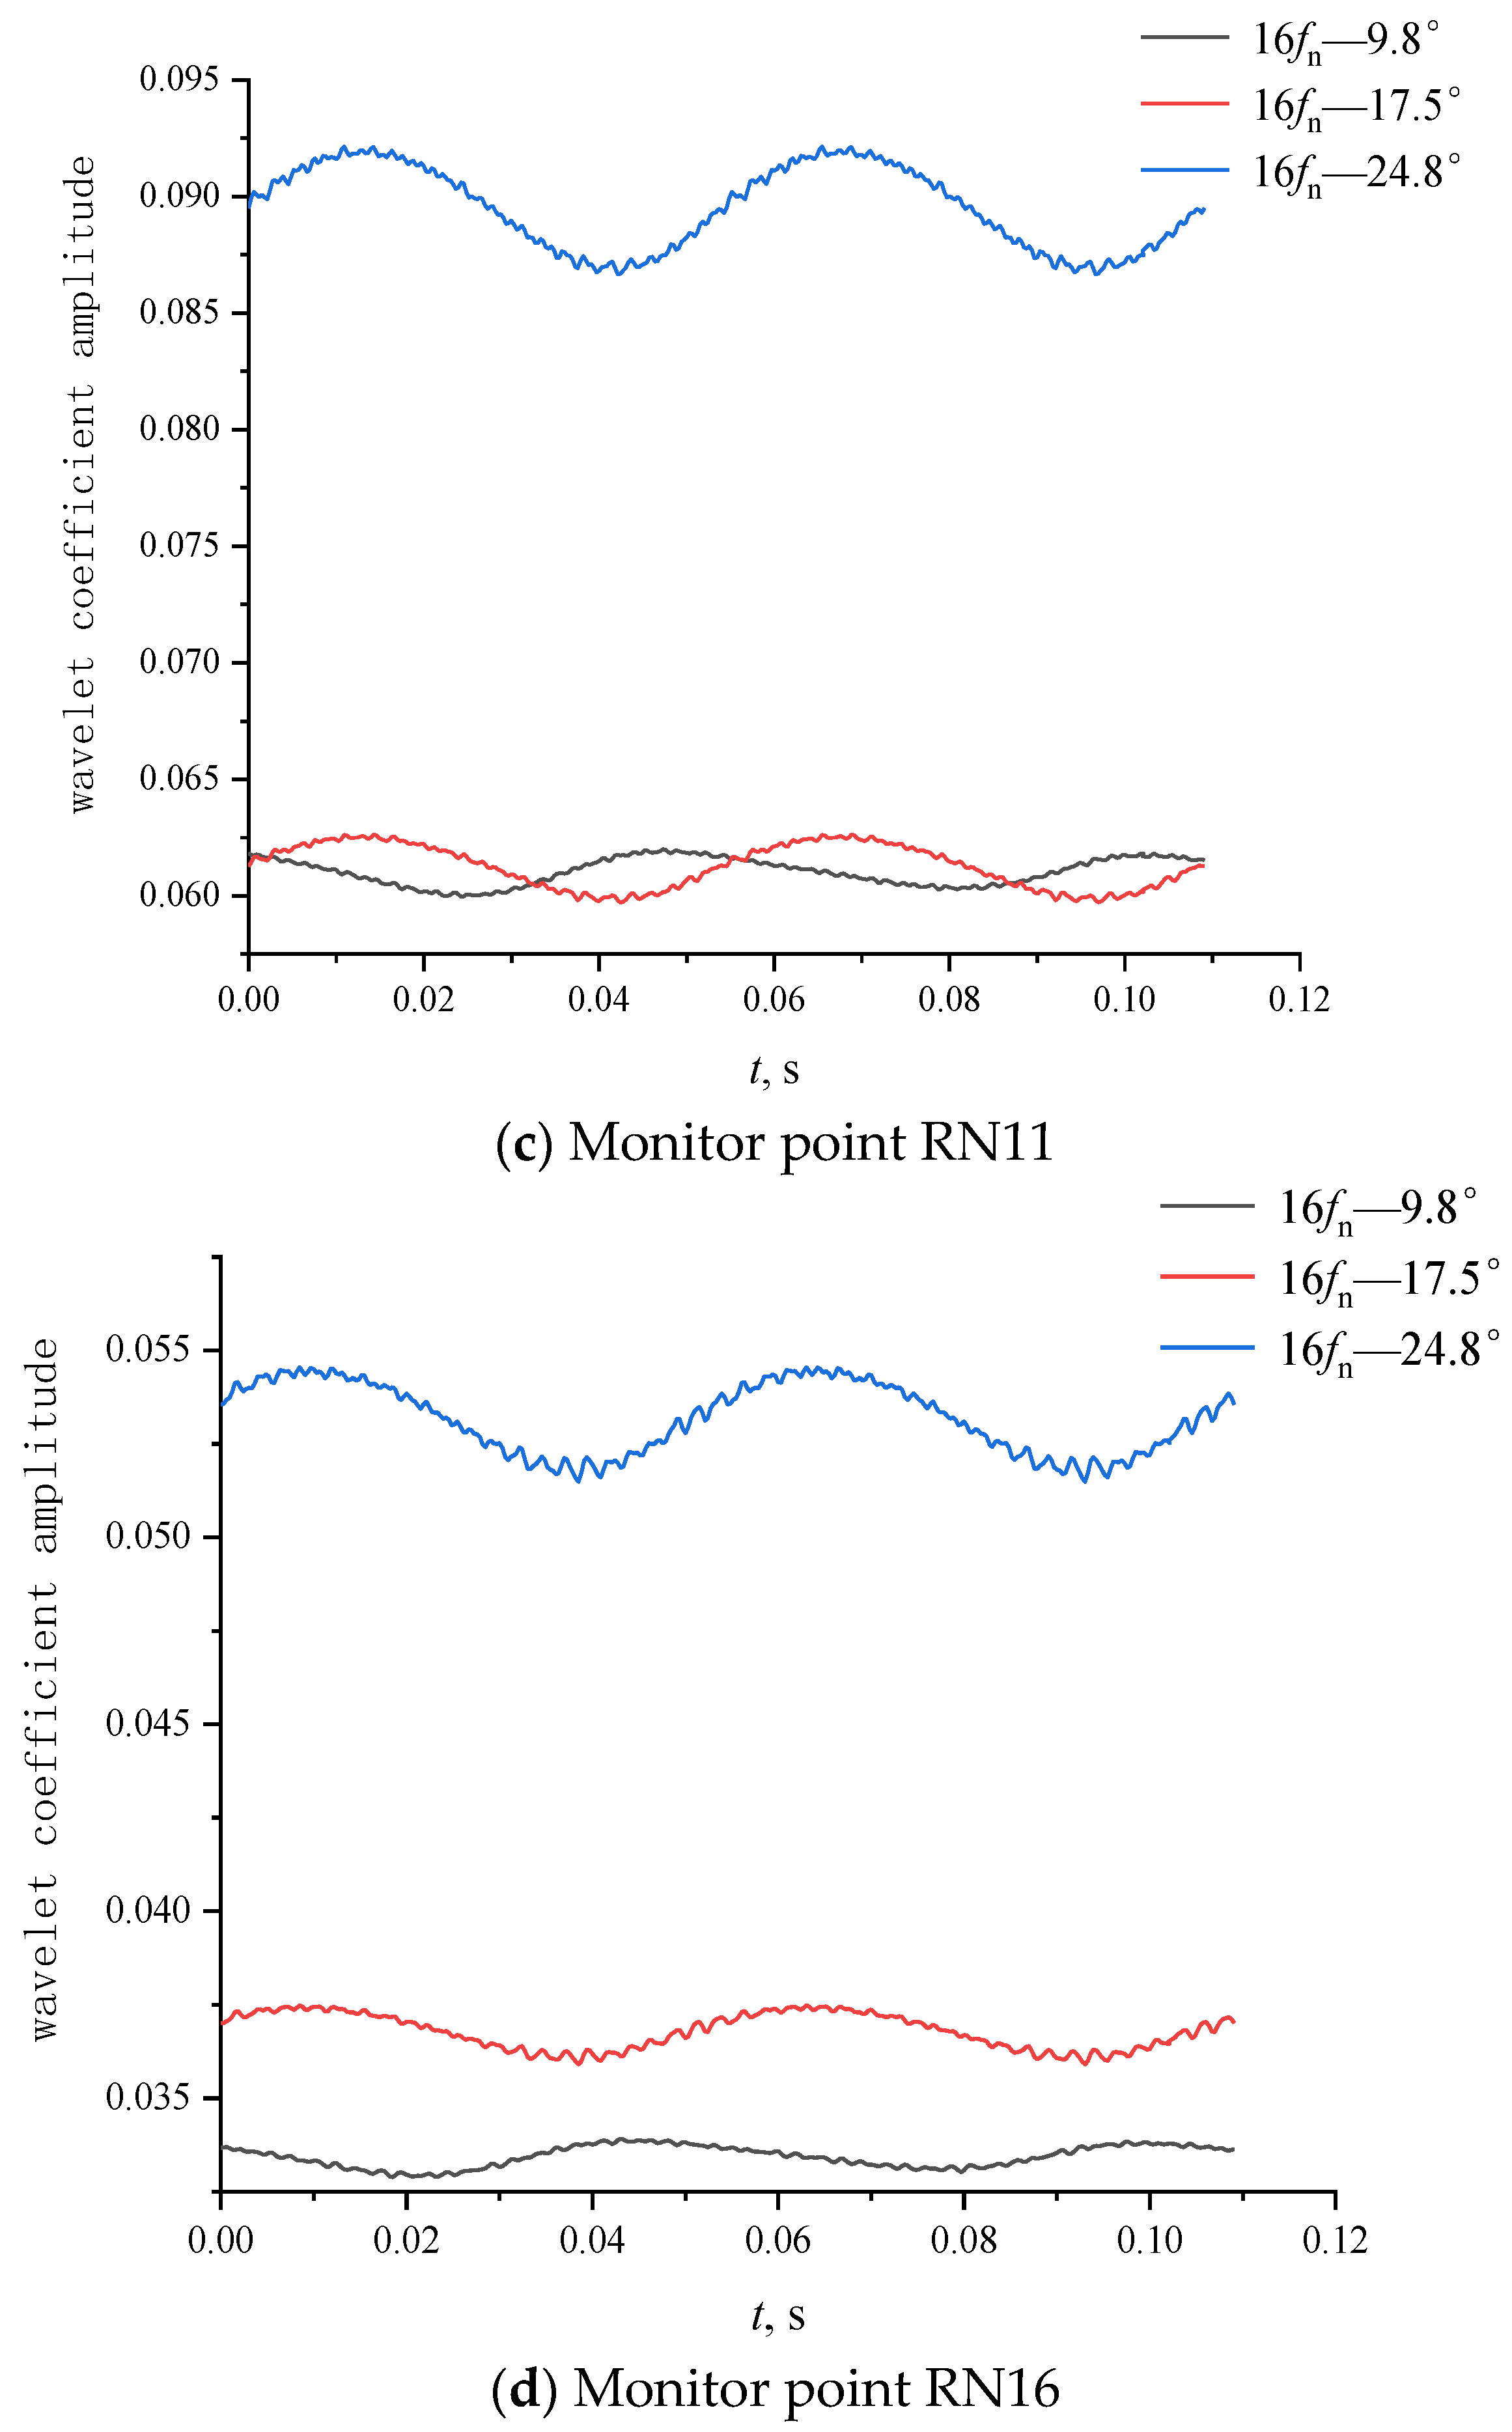
Figure 11 shows the time-frequency distribution of the main frequency of rotor–stator interaction at the monitor point at the outlet of the runner. The x-coordinate is the time of two rotation cycles, and the y-coordinate is the amplitude expressed by the modulus of the wavelet coefficient. It can be seen from the time-frequency diagram that the amplitude of the main frequency 16fn of rotor–stator interaction changes with time. In a small time scale, the amplitude fluctuates in a small range with the change of the measuring point relative to the position of the moving guide vane of the runner. In each rotation period, the fluctuation of the main frequency amplitude is very obvious, and there is a crest and trough. Comparing the time-frequency graphs of each monitor point, it can be seen that the amplitude difference between the large opening and the optimal opening is large, but the fluctuation rules are roughly the same, while the amplitude difference between the small opening and the optimal opening is small, especially the peak and valley values at the measuring point RN11 on the pressure surface of the short blade are roughly equal, but the amplitude difference between the two is large. This indicates that the influence of the change of the opening degree from small to an optimal opening degree on the main frequency is mainly reflected in the phase change, while the change of the opening degree from optimal opening degree to large opening degree mainly affects the amplitude of the main frequency.

3.3. Force Analysis of Runner

Due to the asymmetric influence of the volute tongue and its flow passage, the rotor–stator interaction between the runner and the guide vanes is significantly different in the circumferential direction. The pressure around the runner is unevenly distributed in the circumferential direction, thus producing the radial force acting on the runner. Table 3 lists the radial force of the runner at different opening degrees. During the running process of the runner, as the position of the runner blade relative to the guide blade keeps changing, the radial force acting on the runner also keeps changing. To facilitate the statistics of the runner’s radial force, 180 groups of radial force data were selected for unsteady calculation in the last lap, and the root mean square value was regarded as the runner’s radial force. The calculation expression is as follows:
F R M S = 1 180 i = 1 180 F i 2
where in Formula (6), F i —the instantaneous monitor value of the power.
As can be seen from Table 3, the difference between the radial force value of the small opening and the optimal opening is small, and the radial force of the large opening is greater than that of other openings due to the strong rotor–stator interaction. In addition, the radial force of the optimal opening is the same as that of the large opening in the x and Y directions, while the difference between the small opening and the optimal opening is obvious, indicating that the rotor-stator interaction with a large opening has a good symmetry, but the poor overcurrent capacity under a small opening destroys this characteristic.
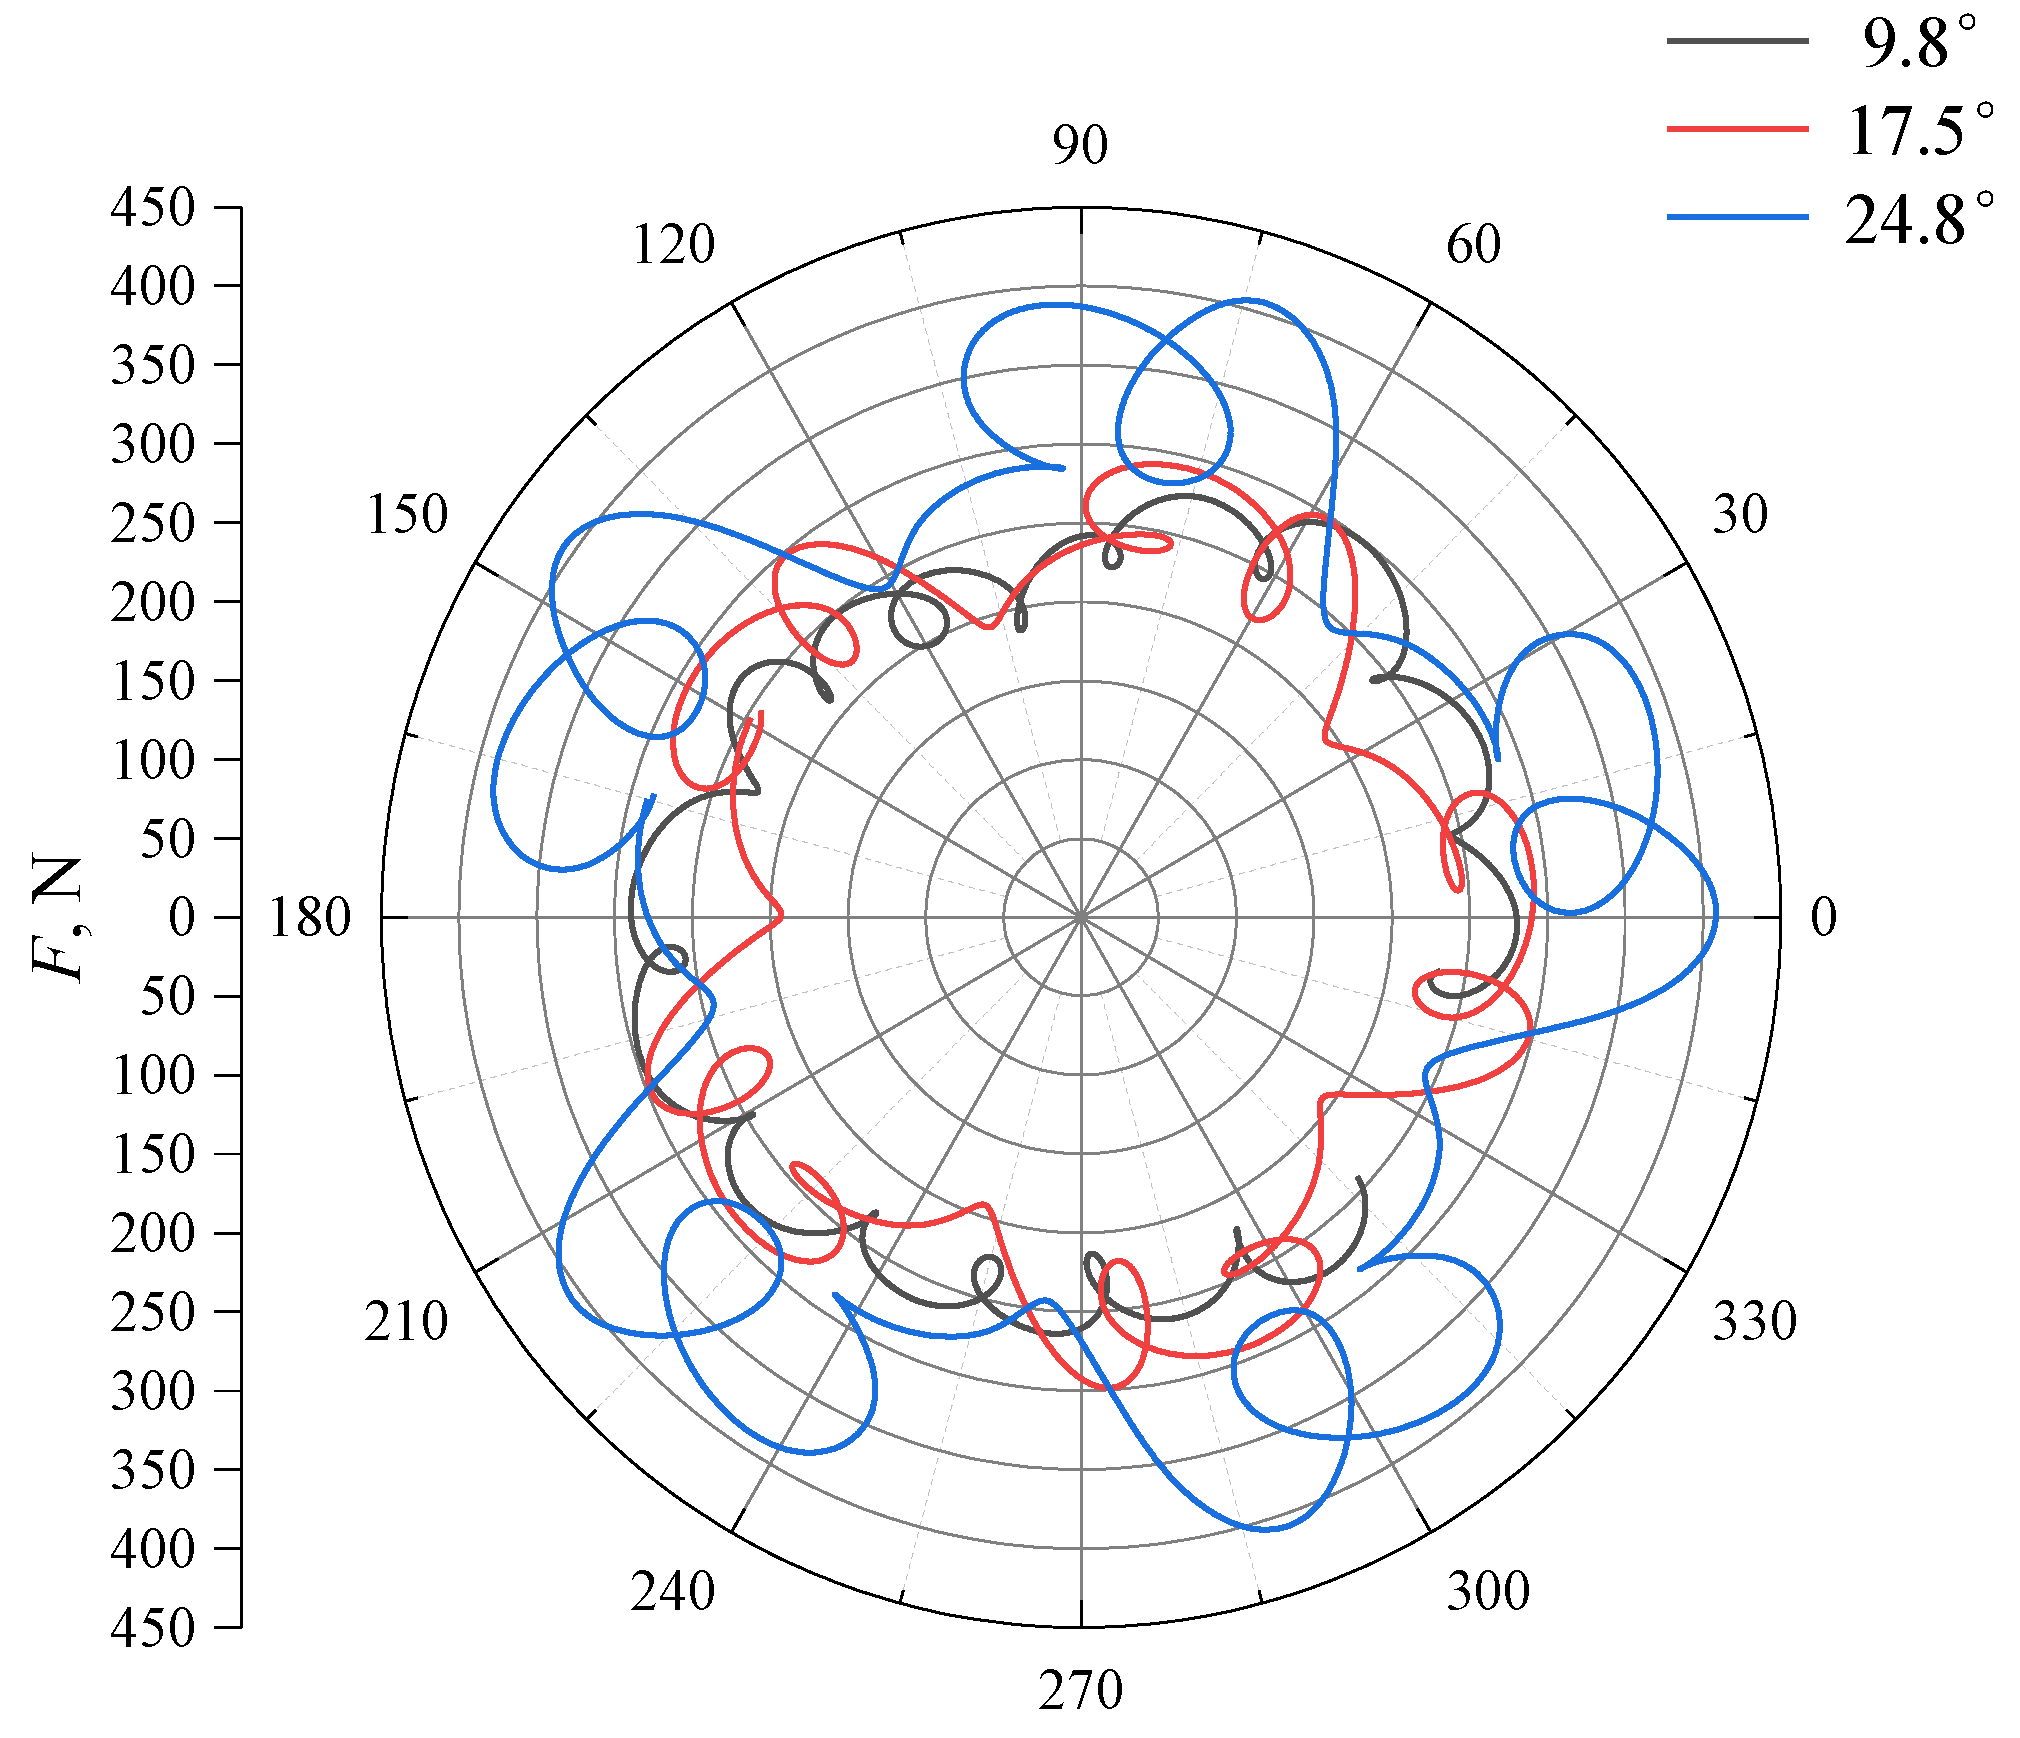
Figure 12 converts 180 groups of radial force data in x and y directions within a rotation period into polar coordinates, which more intuitively reflects the distribution characteristics of the radial force of the runner at different times. From the radial force distribution curves of each opening, it can be seen that with the increase of the guide blade opening, the radial force pulsation amplitude of the runner increases, and the difference between peak and valley values can reach 160 N under a large opening. The radial force distribution of the runner in a rotation period under the optimal opening and the large opening is relatively strong, and there are ten peaks and valleys, and the number is consistent with the number of runner blades, while the pulsation regularity of the radial force with a small opening is not obvious. This indicates that the radial force of the runner is mainly affected by the rotation of the blade, and the poor flow capacity under a small opening will destroy the symmetry and periodicity of the radial force to some extent. Therefore, under the optimal opening, the radial force of the runner has the most reasonable distribution characteristics in magnitude, symmetry and periodicity, while the rest opening is not conducive to the operation stability of the unit.

3.4. Pressure Pulsation Analysis in the Bladeless Region

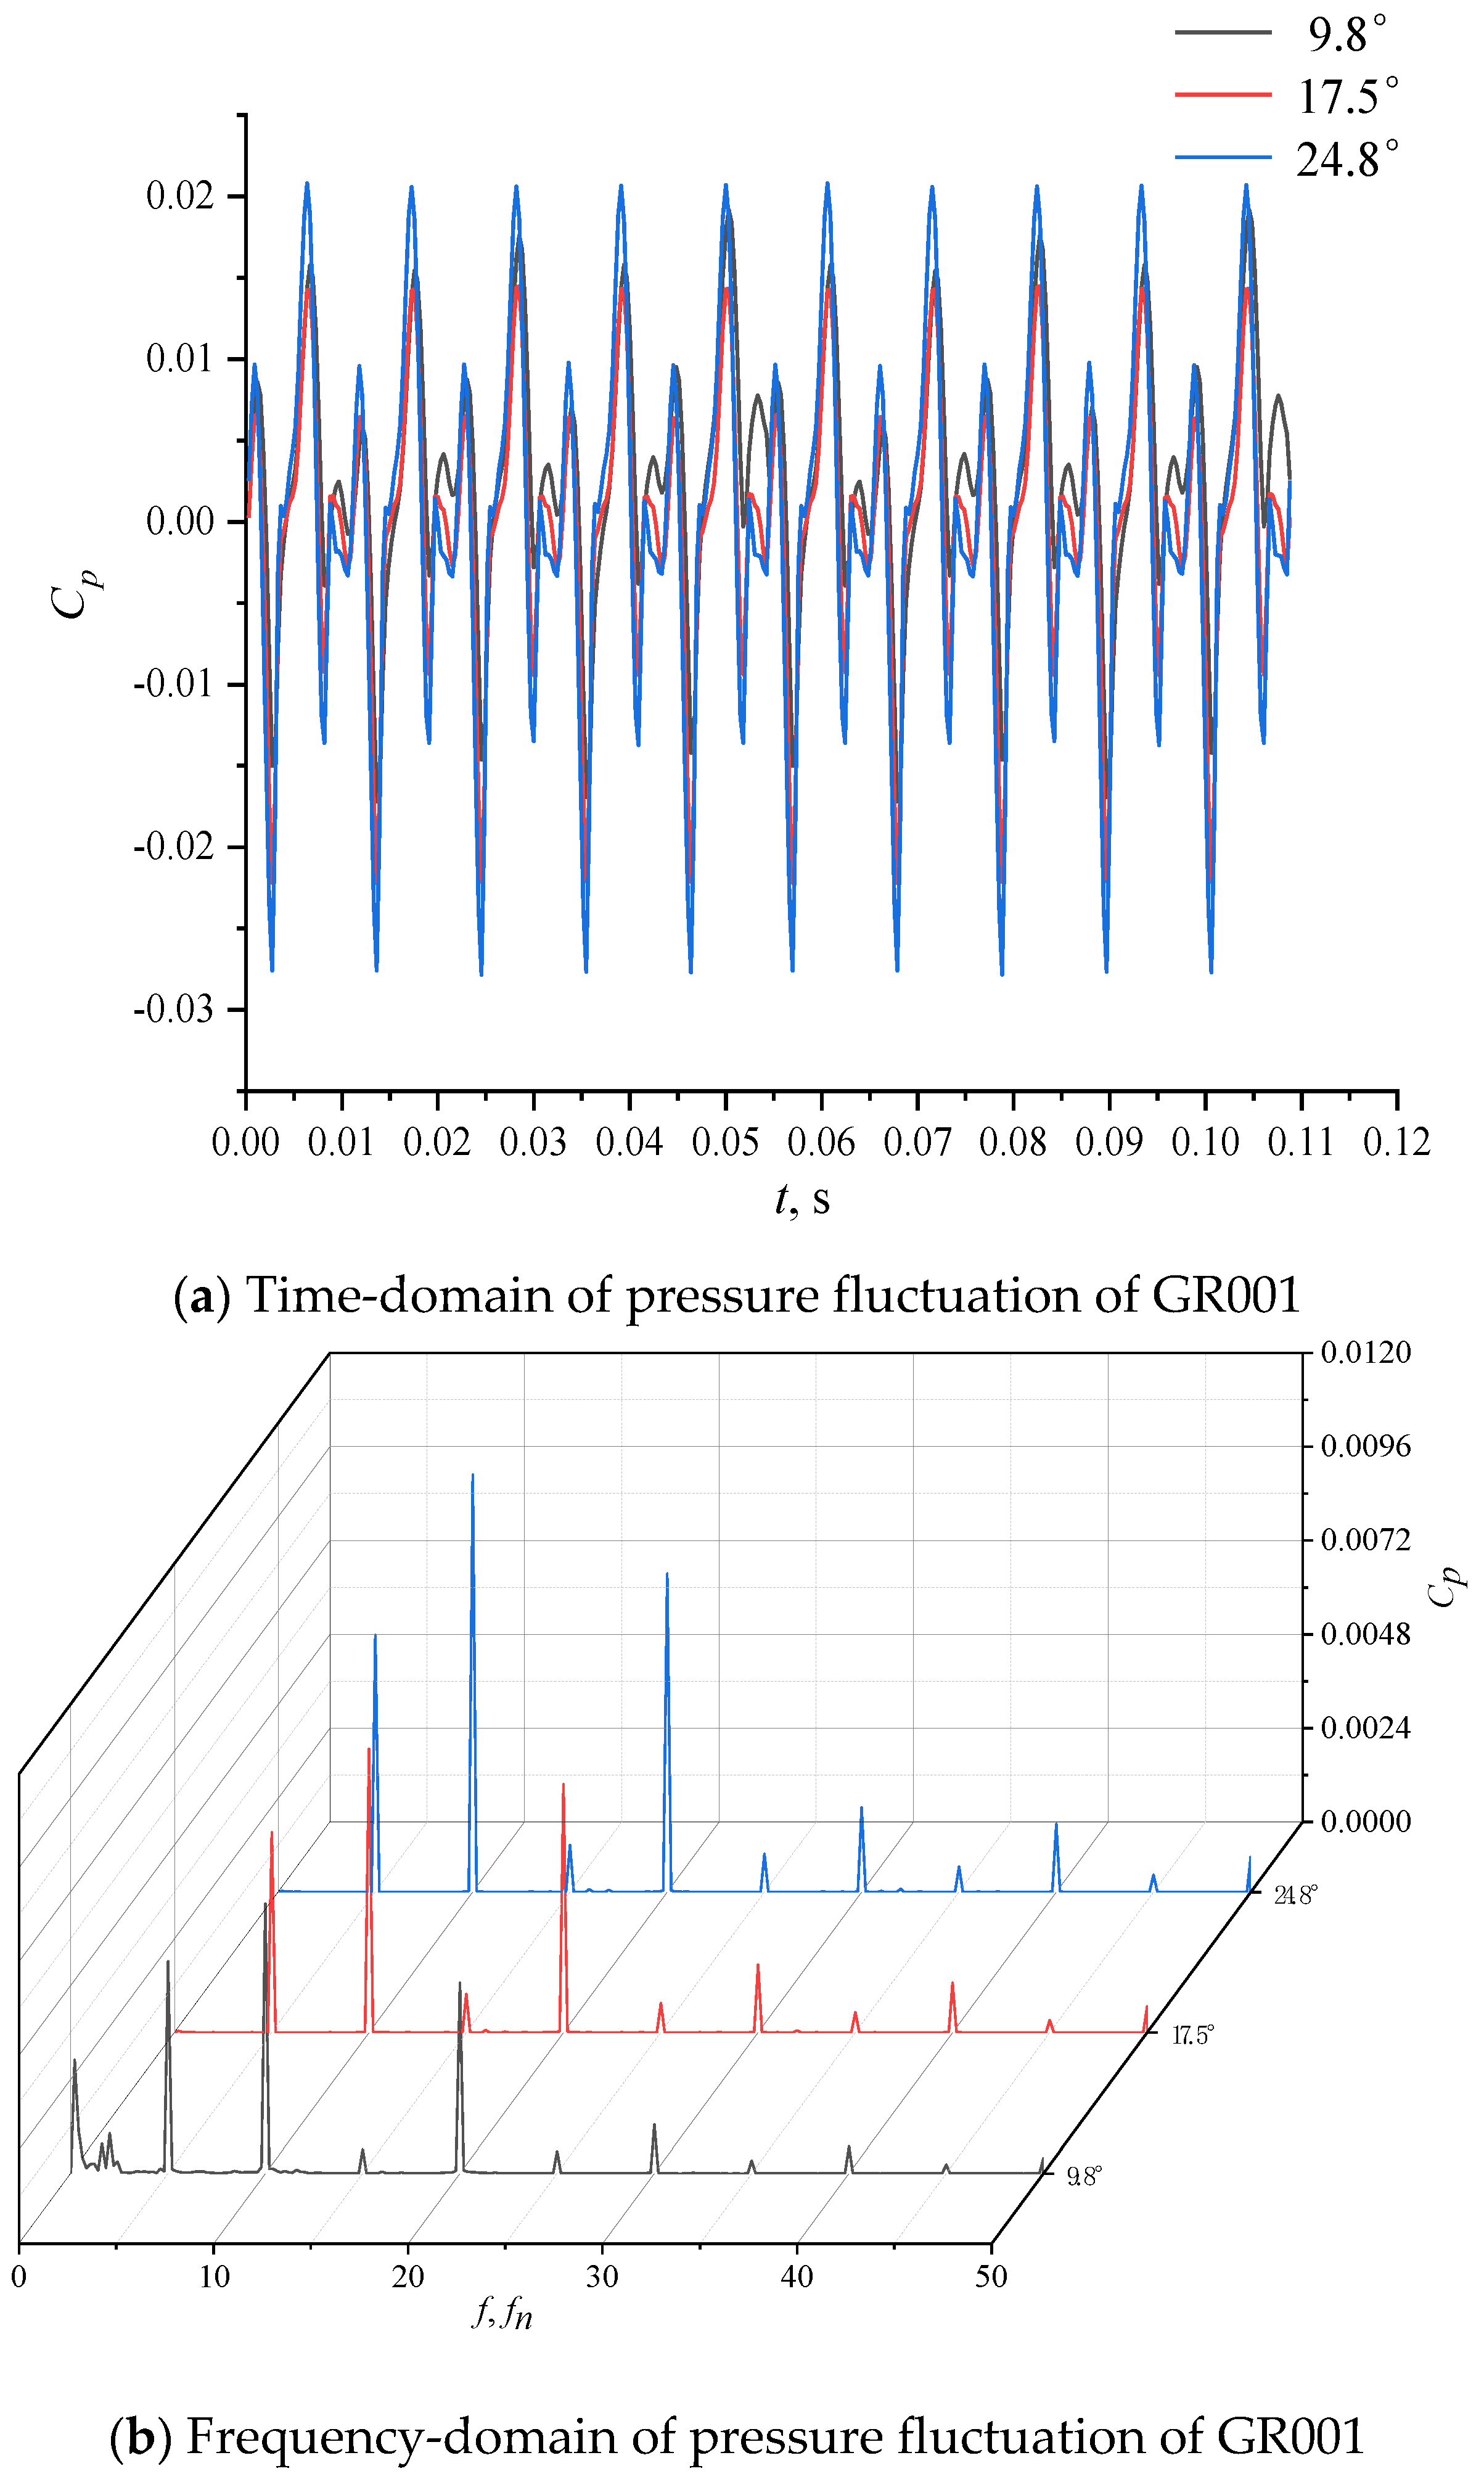
Figure 13 shows the time and frequency domain distribution of pressure pulsation at the measuring point GR001 under different degrees of opening. In Figure 13b, the black curve represents the frequency domain distribution of pressure pulsation at GR001 at 9.8°, the red curve represents the frequency domain distribution of pressure pulsation at GR001 at 17.5° and the blue curve represents the frequency domain distribution of pressure pulsation at GR001 at 24.8° (The meaning of each curve is the same in the frequency domain diagram that appears below). The time interval of the time domain diagram is two rotation periods. It can be seen from the time domain diagram that the pressure pulsation crest and valley of each opening are roughly the same shape, the periodic pulsation of the optimal opening and the large opening is relatively stable, while the pulsation amplitude in different periods changes significantly under the small opening. The results show that the flow instability at a small opening will affect the periodic stability of rotor–stator interaction in the bladeless region. It can be seen from the frequency domain diagram that the amplitude values of 5fn, 10fn, and 20fn caused by rotor-stator interaction under large opening are significantly larger than the rest, indicating that the increase of guide blade opening will intensify the rotor-stator interaction in the bladeless area. In addition to axial frequency doubling caused by rotor-stator interaction, the frequency components with higher amplitude at a small opening also have nonlinear low-frequency 0.2–0.4fn caused by flow instability. In addition, for a single type of blade with a passing frequency of 5fn, the amplitude of the blade with a small opening and a large opening is greater than the optimal opening, indicating that the guide blade opening deviating from the optimal opening will aggravate the difference in rotor-stator interaction between stay vanes and guide vanes.
The change of guide blade opening will lead to the change of measuring point relative to guide blade trailing edge. Combined with the hydraulic asymmetry caused by the volute, the rotor–stator interaction at different circumferential positions in the bladeless region will be different. 
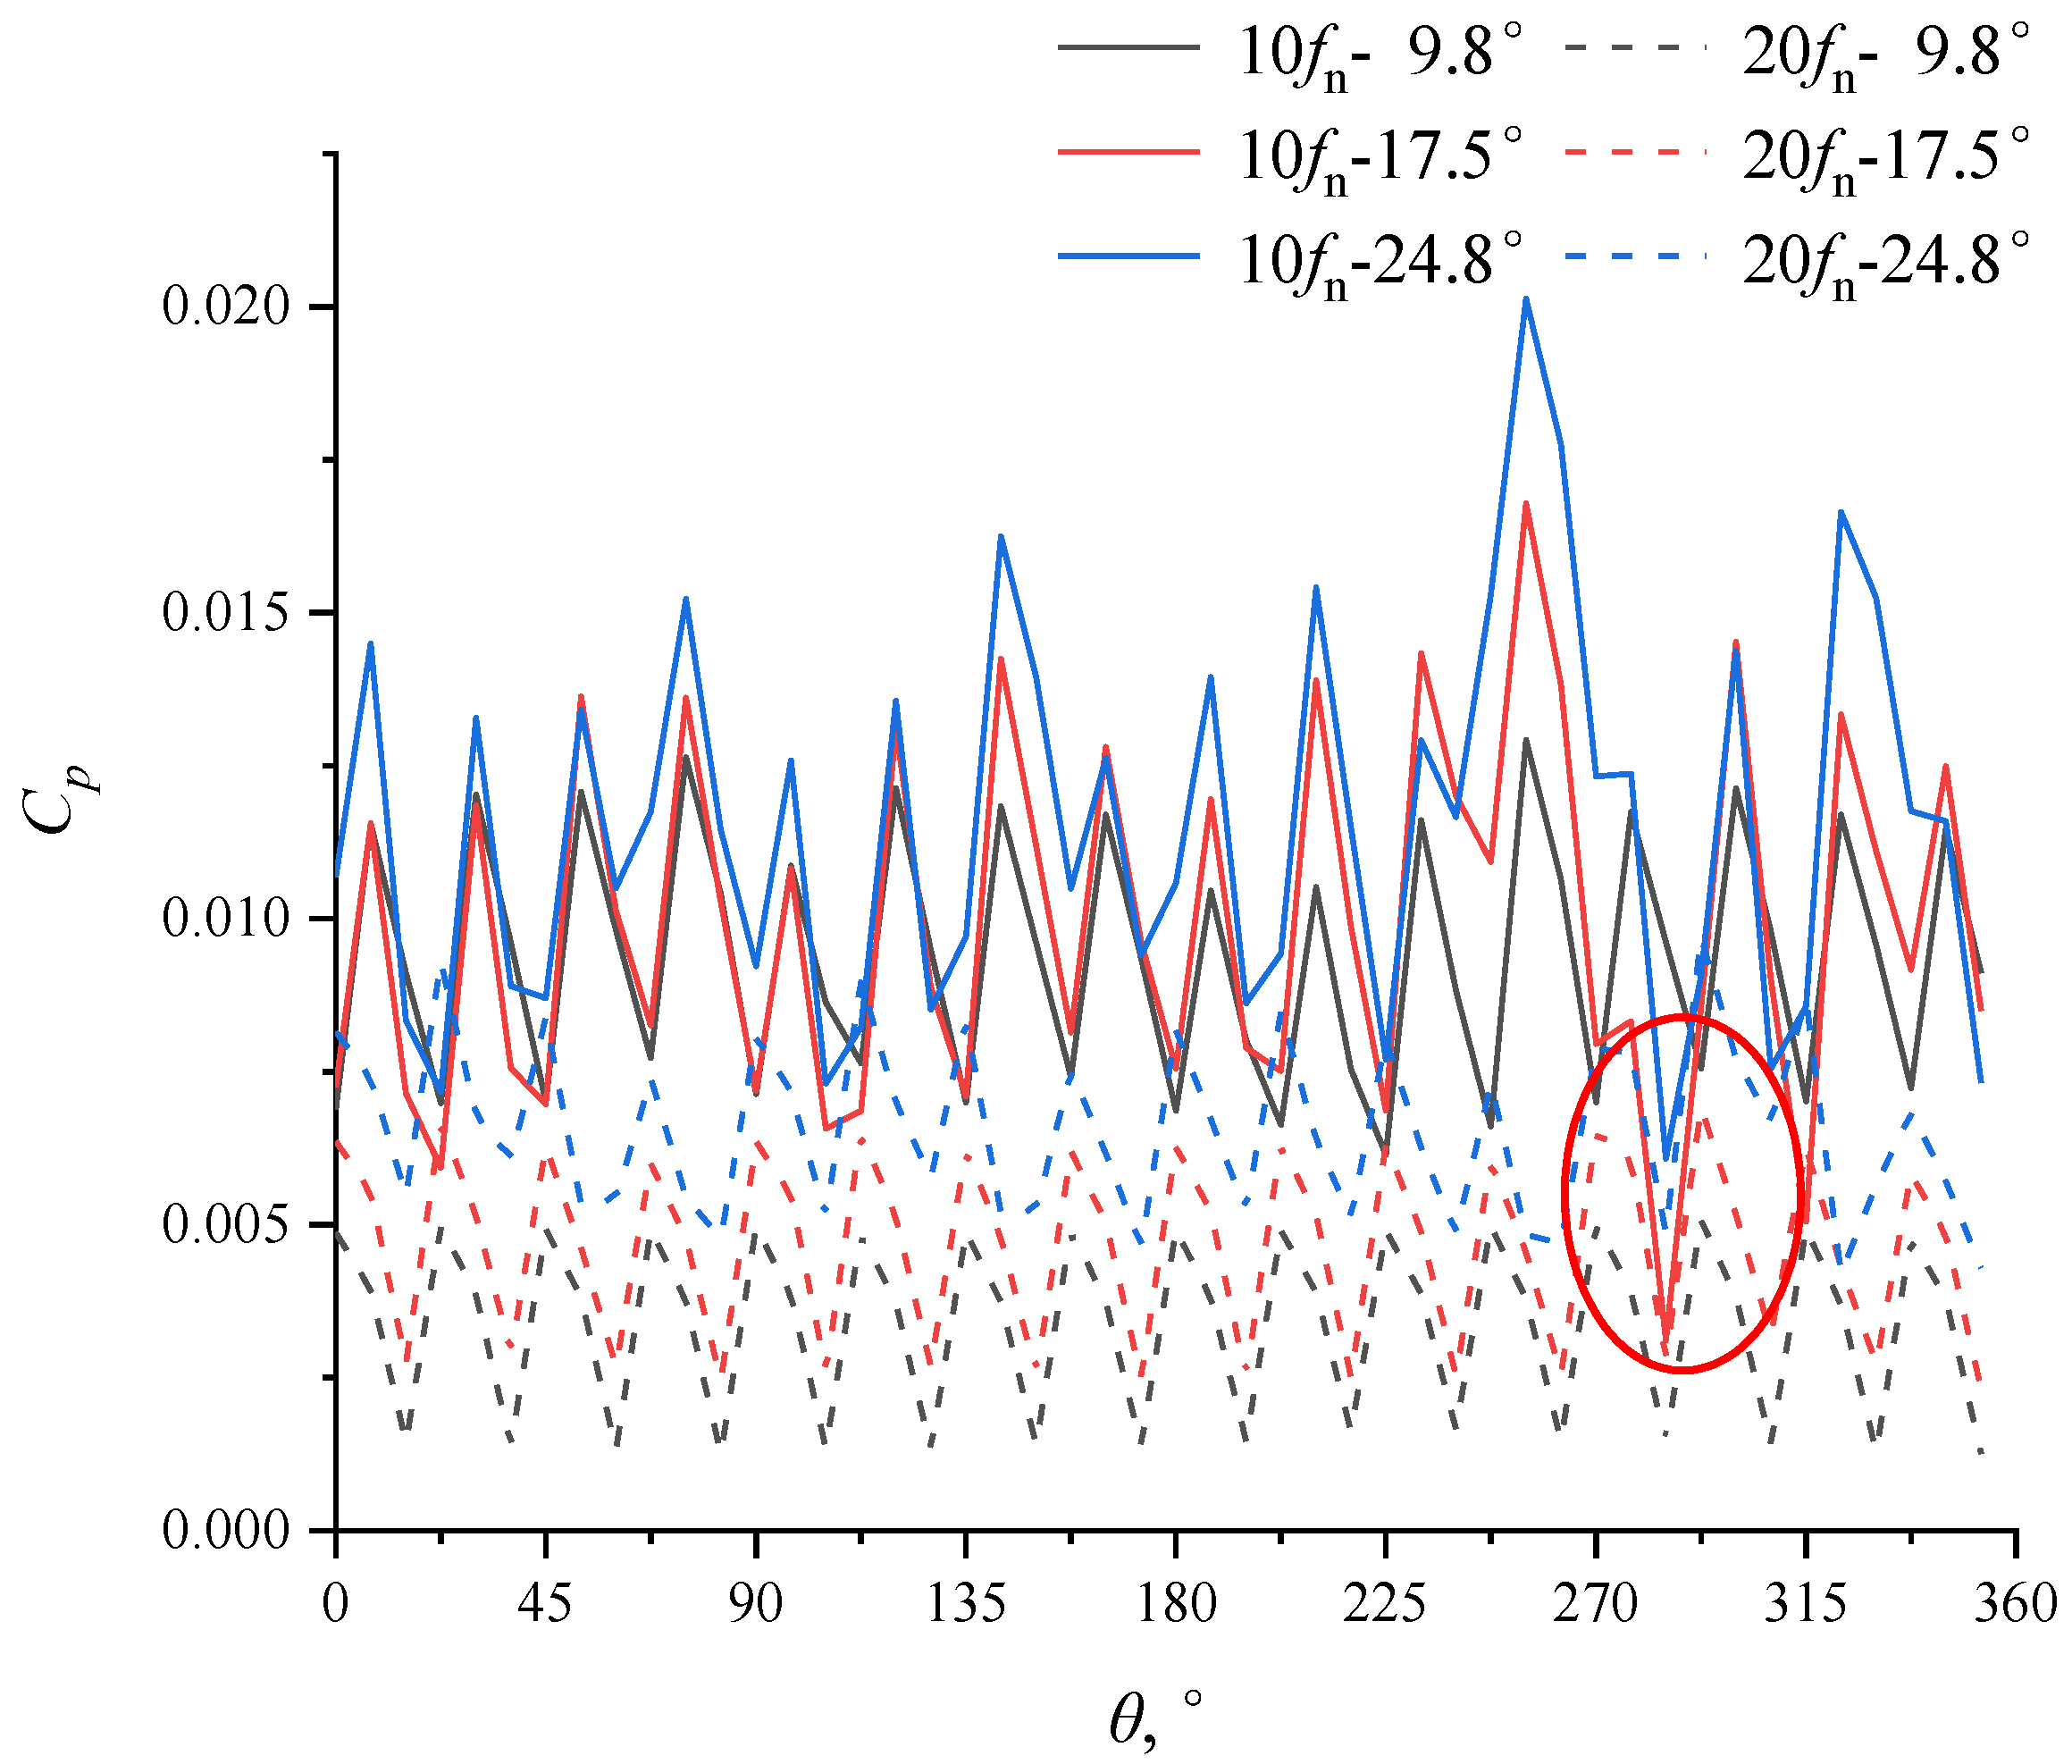
Figure 14 shows the amplitude distribution of 10fn and 20fn of the rotor-stator interaction frequencies at different openings in the circumferential direction. It can be found that the variation rules of 20fn amplitude at each opening are mainly affected by the different positions of the measuring points relative to the guide vanes, while the hydraulic asymmetry has a small influence. The amplitude of the main frequency 10fn changes with poor regularity in the circumferential direction. The marked position of the red circle in the figure is the guide vane channel near the tongue, where the amplitude is greatly distorted under the optimal opening and the large opening. This indicates that the tongue has a great influence on the rotor-stator interaction in the circumferential direction under these two working conditions, while the flow capacity of the guide vanes is poor under a small opening, and the velocity in the bladeless region is large, so the tongue has little influence on the bladeless region. In general, the amplitude of the rotor-stator interaction frequency increases with the increase of the guide vane opening.
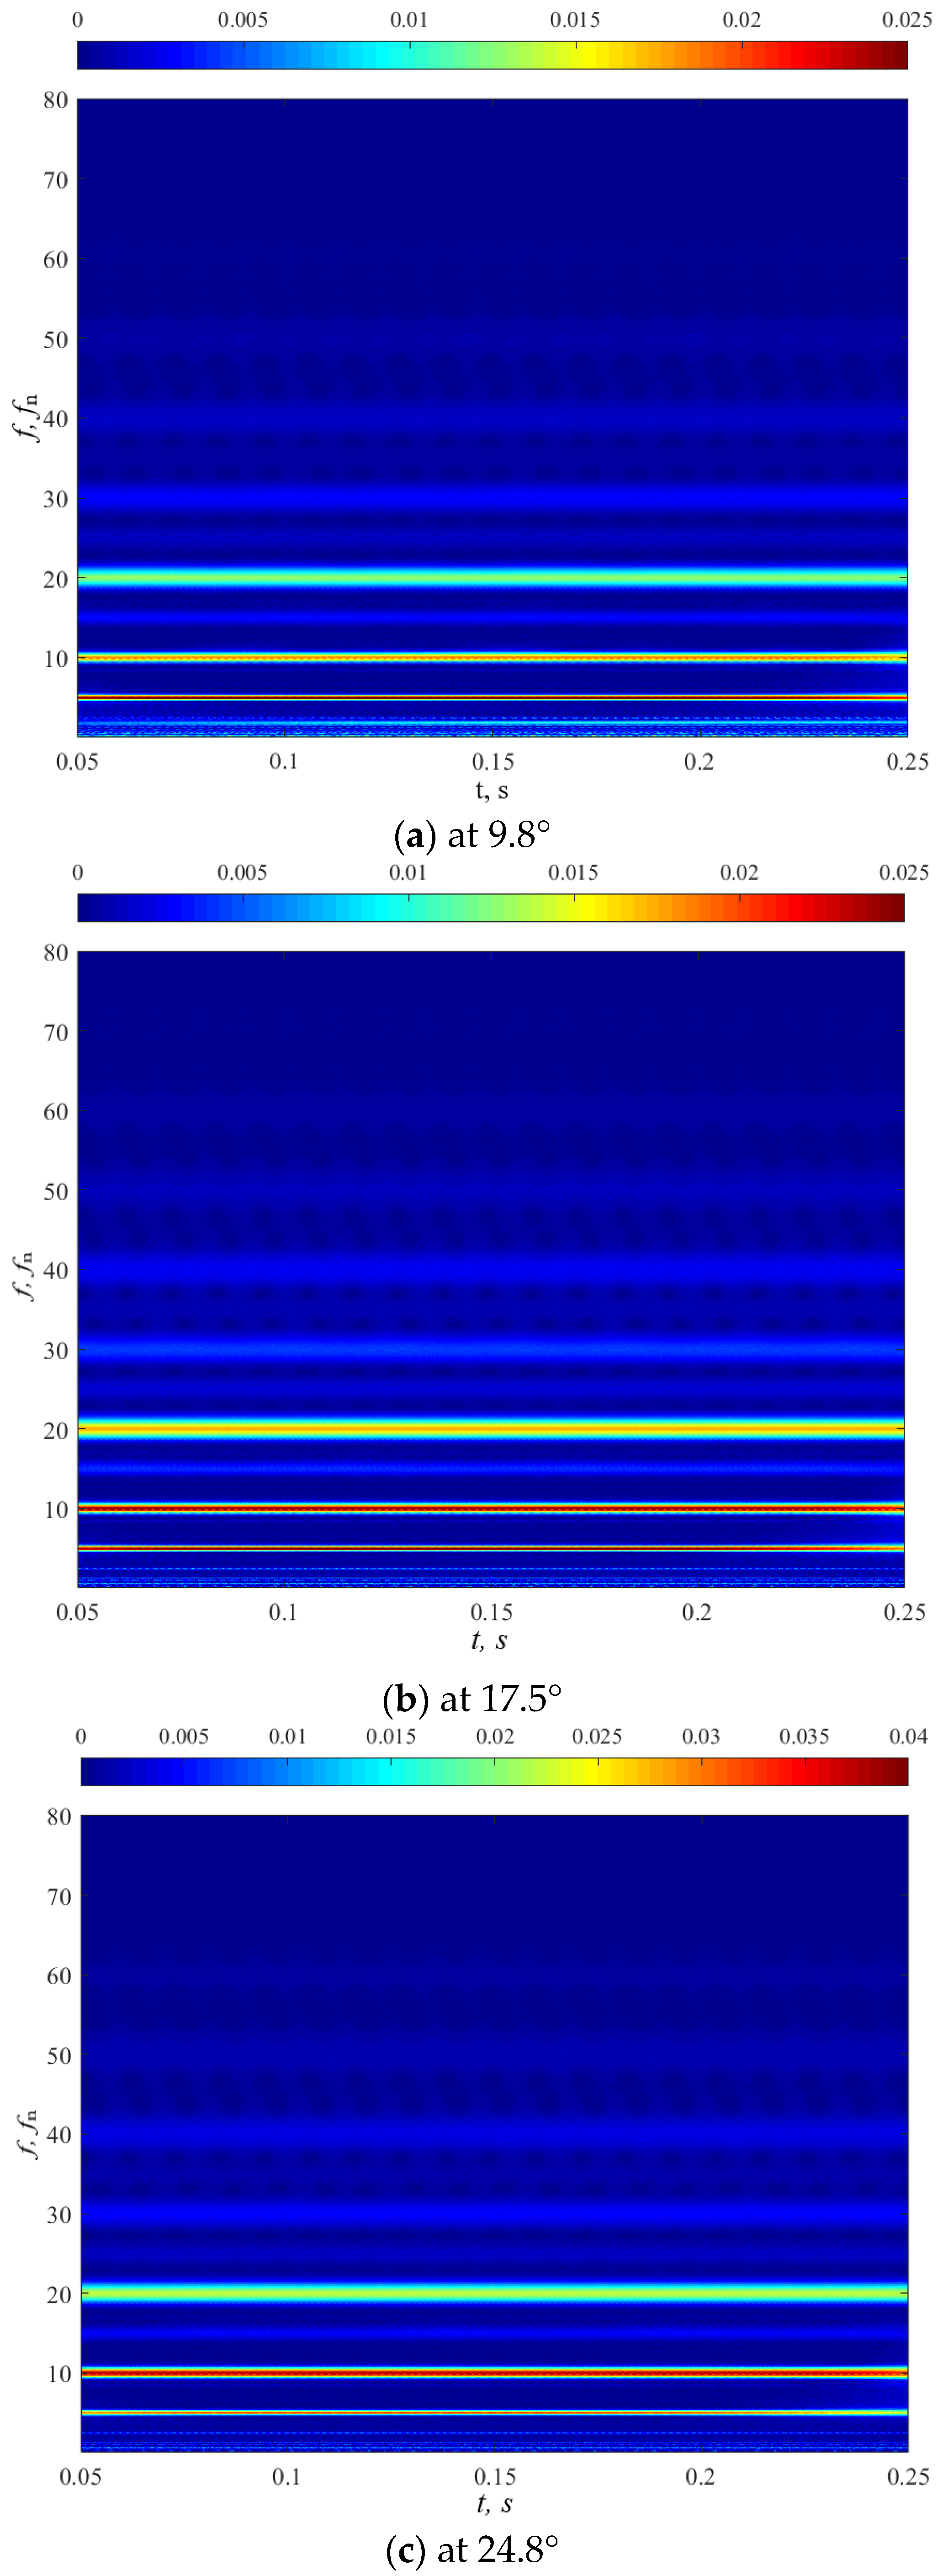
To further analyze the time-frequency characteristics of rotor-stator interaction in the bladeless region, continuous wavelet transform was used to extract the distribution characteristics of the pressure pulsation frequency and corresponding amplitude at the measuring point GR001 in the period of 0.05 s to 0.25 s under different degrees of opening. As shown in Figure 15, the amplitude value adopts the value of the wavelet coefficient. It can be seen from the figure that for a period of time, the pressure pulsation energy in the bladeless region is mainly concentrated in the rotor-stator interaction frequencies 5fn, 10fn and 20fn, and the amplitude is relatively stable. With the increase of the guide blade opening, the amplitude of the main frequency 10fn is the most obvious improvement. The amplitude of the large opening is much higher than the other two, and the frequency interval of high amplitude near 20fn is wider. By comparing the time-frequency graphs of each opening, it is found that the low-frequency amplitude is significantly distributed within 0.05 s to 0.25 s under a small opening.
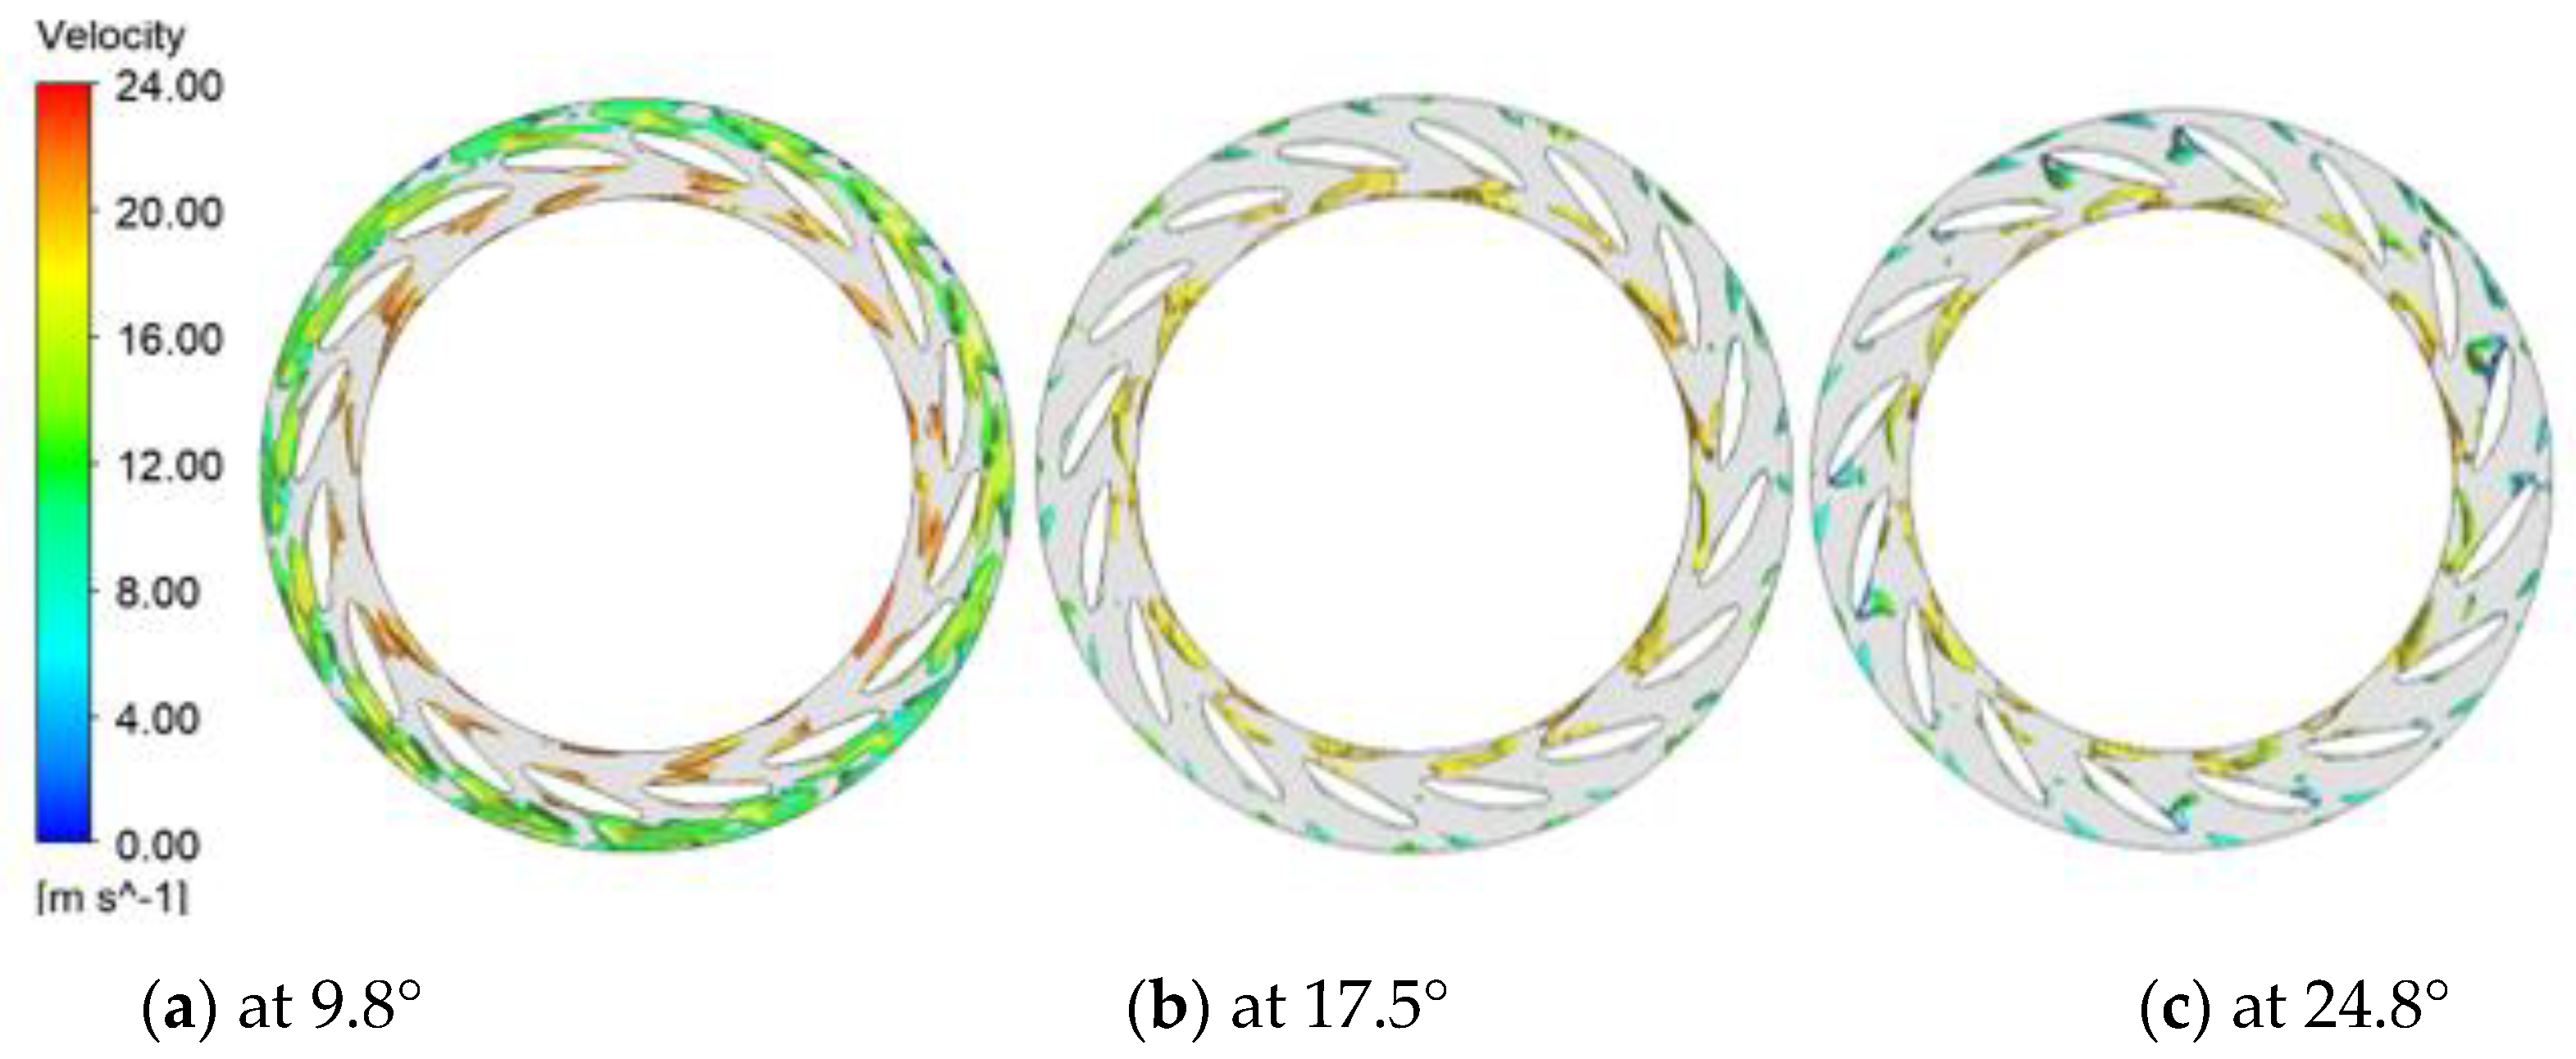
To reflect the influence of the change of guide blade opening on the flow field more intuitively, The Q-criterion is used to extract the vortex core distribution in the guide blade area under different openings and the velocity is used to color it in Figure 16. By observing the vortex core distribution of each opening, it can be found that the vortex core is mainly concentrated in the bladeless region at the inlet and outlet of the guide vanes. The high-speed vortex core generated by rotor-stator interaction is mainly distributed between the runner and the guide vanes. With the increase of the guide vane opening, the distance between the trailing edge of the blade and the guide vanes decreases, the impact angle of the guide blade incoming flow increases, and the size of the vortex core expands, resulting in the enhancement of rotor-stator interaction. In addition, small low-speed vortex cores are distributed in the wake area at the outlet of the active guide blade with an optimal opening and a large opening, and the outlet of the guide vane with a small opening is full of low-speed vortex cores. Therefore, it is speculated that the low-frequency components in the bladeless region between the runner and the guide vanes with a small opening may be related to it, which will be further analyzed.
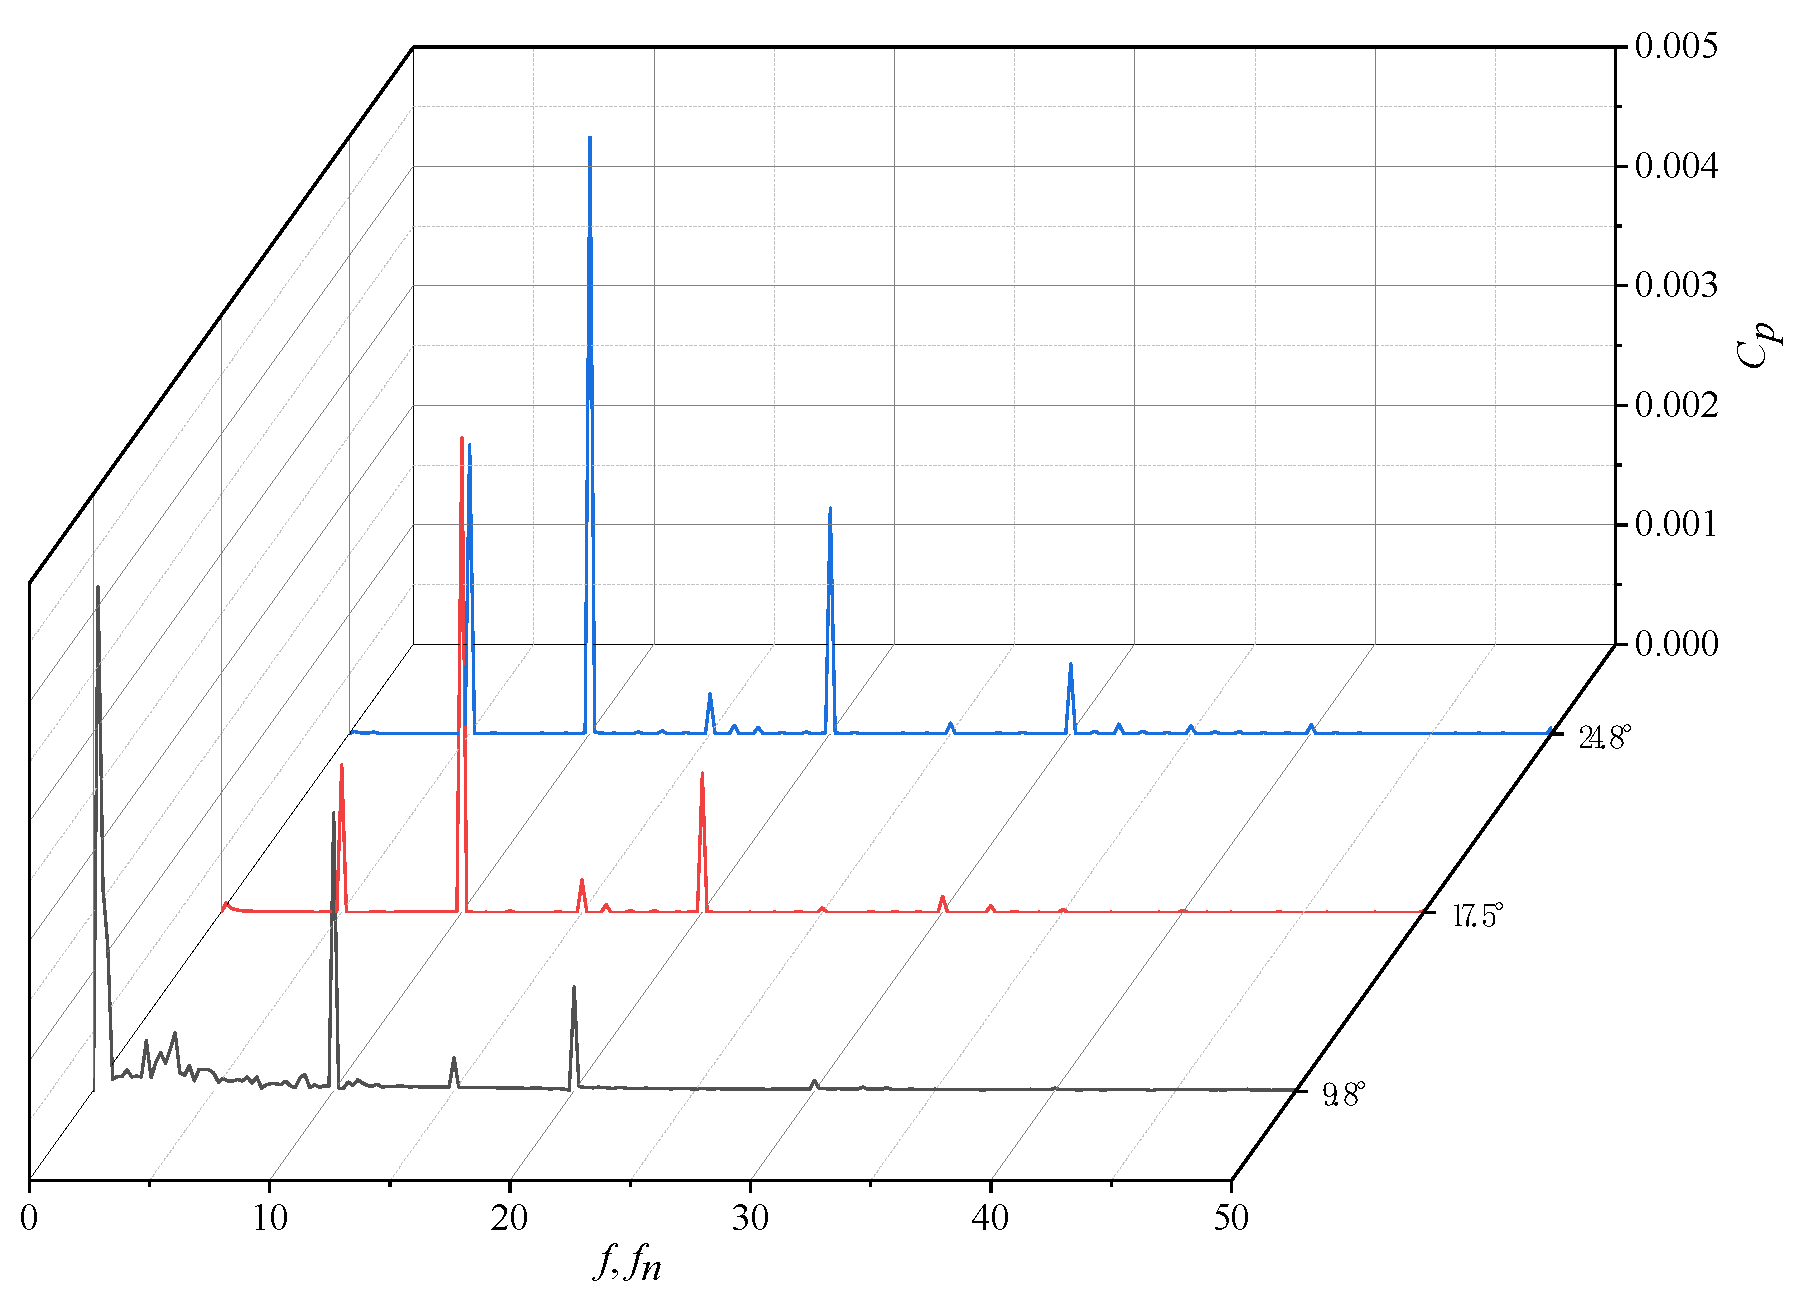
The SG series measuring points are located at the exit of active guide vanes. Figure 17 shows the pressure pulsation frequency domain distribution of SG001 monitor points under different openings. It can be seen from the figure that the main frequency of pressure pulsation at the monitor point SG001 at a small opening is 0.2fn, and the protruding frequency components at an optimal opening and a large opening are consistent with those in the upstream bladeless region and are mainly the rotor–stator interaction frequencies 5fn, 10fn and 20fn, which fully proves the previous speculation about the cause of the low-frequency components. 
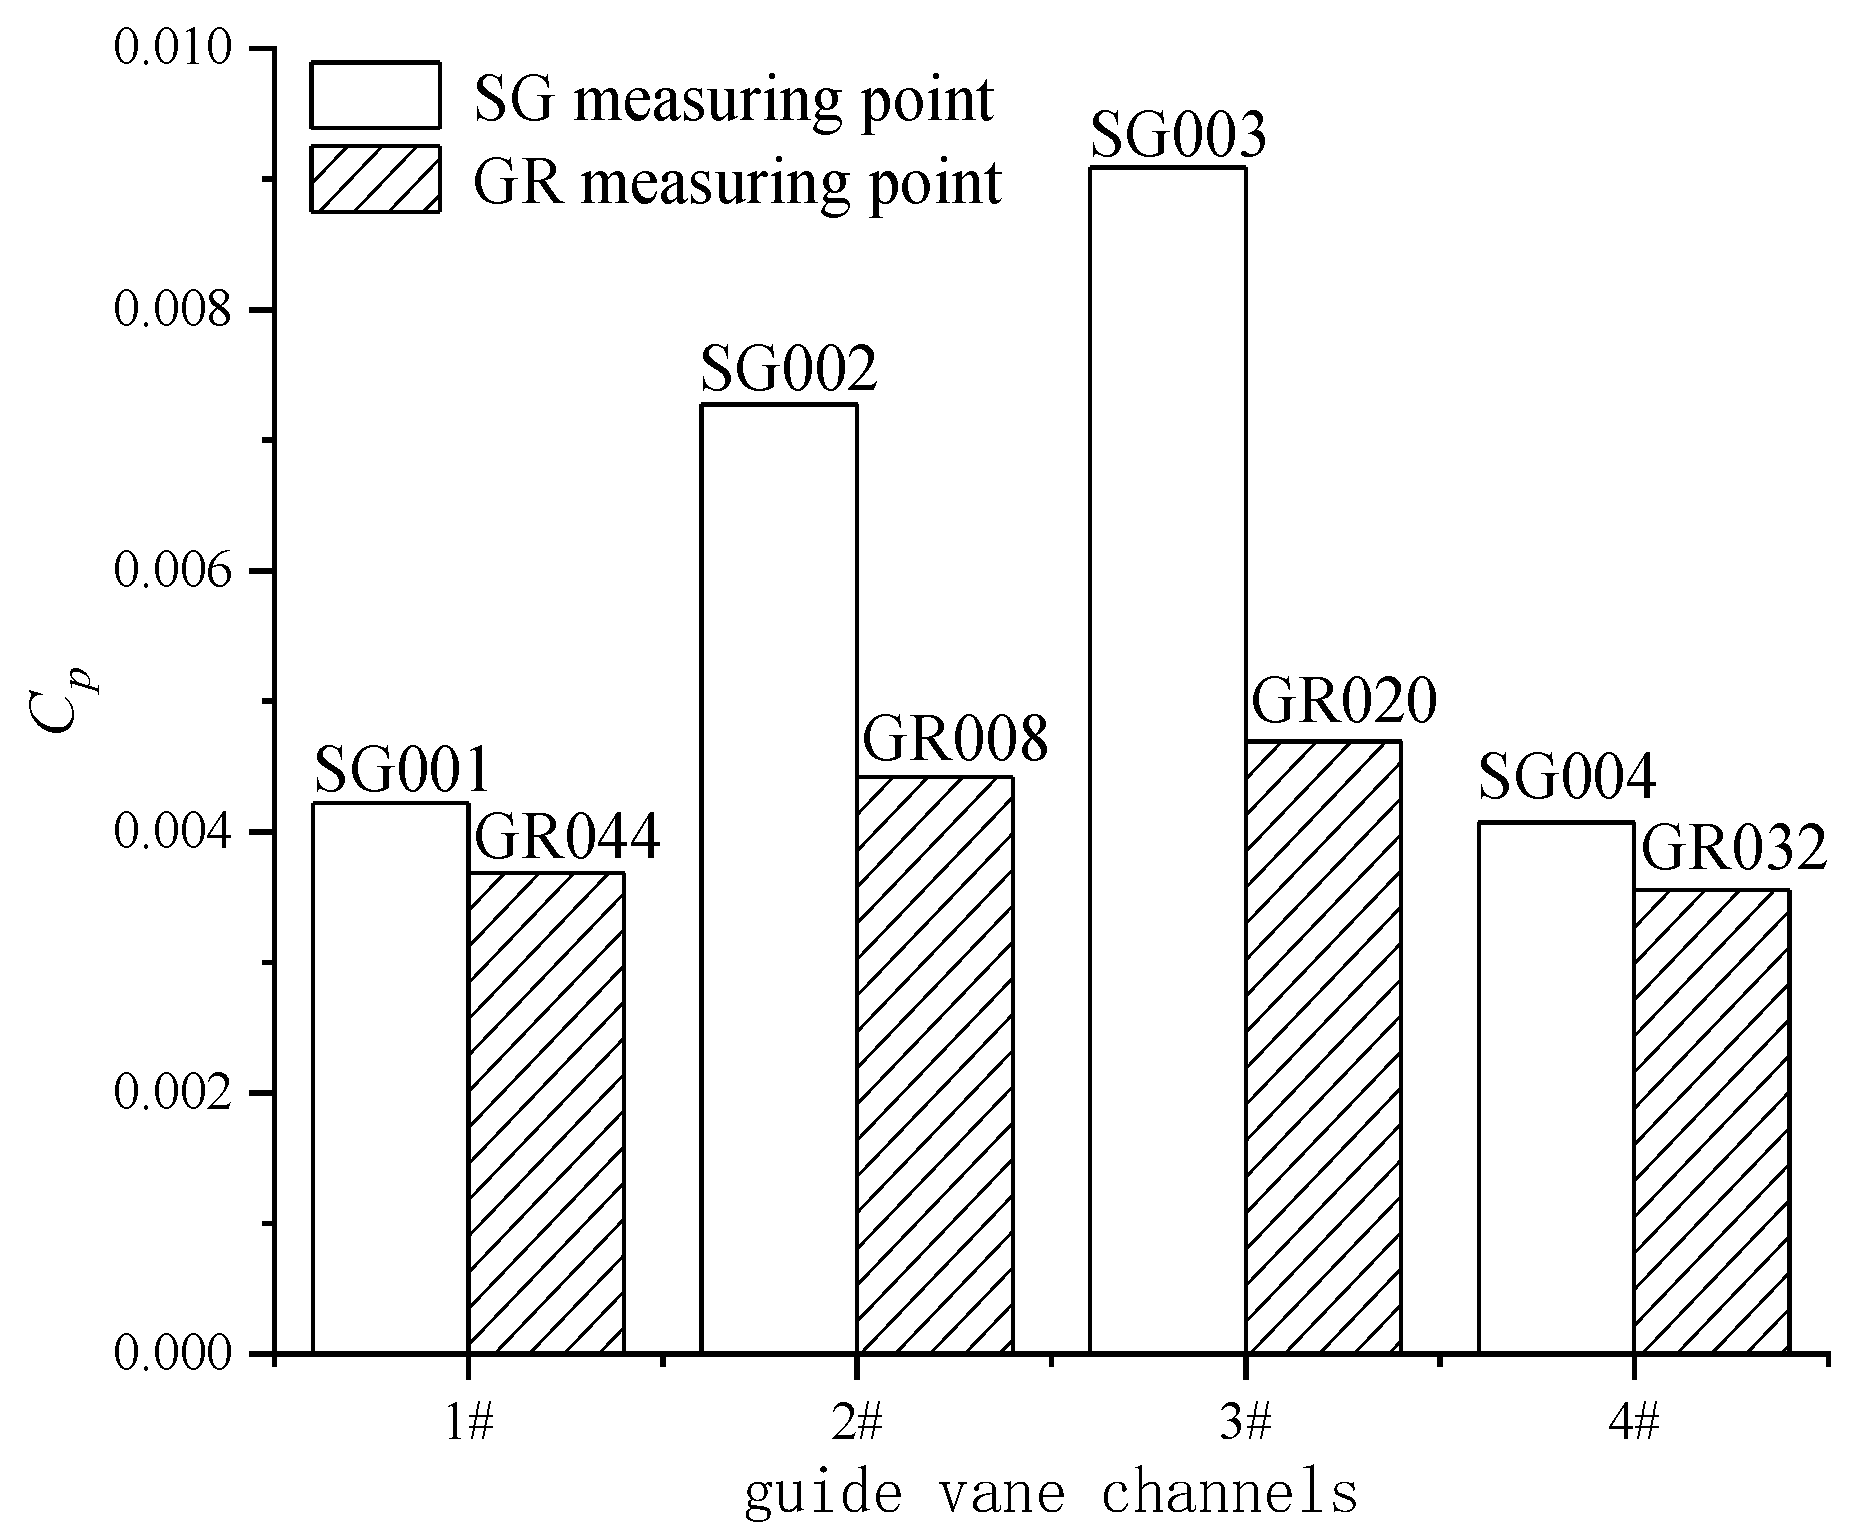
Figure 18 shows the low-frequency amplitude distribution of the measuring points at the inlet and outlet of four guide vane passages at different circumferential positions with a small opening. It can be seen that the low-frequency amplitude of SG series measuring points is greater than that of GR series monitor points, which indicates that the low-frequency pulsation propagates from the outlet of the guide vanes to the upstream bladeless region under a small opening. In addition, the difference of low-frequency amplitude between different guide vane passages is quite obvious, the low-frequency amplitude of the monitor point SG003 is about twice that of the monitor points SG001 and SG004, indicating that the low-frequency amplitude distribution in the circumference direction is quite different.
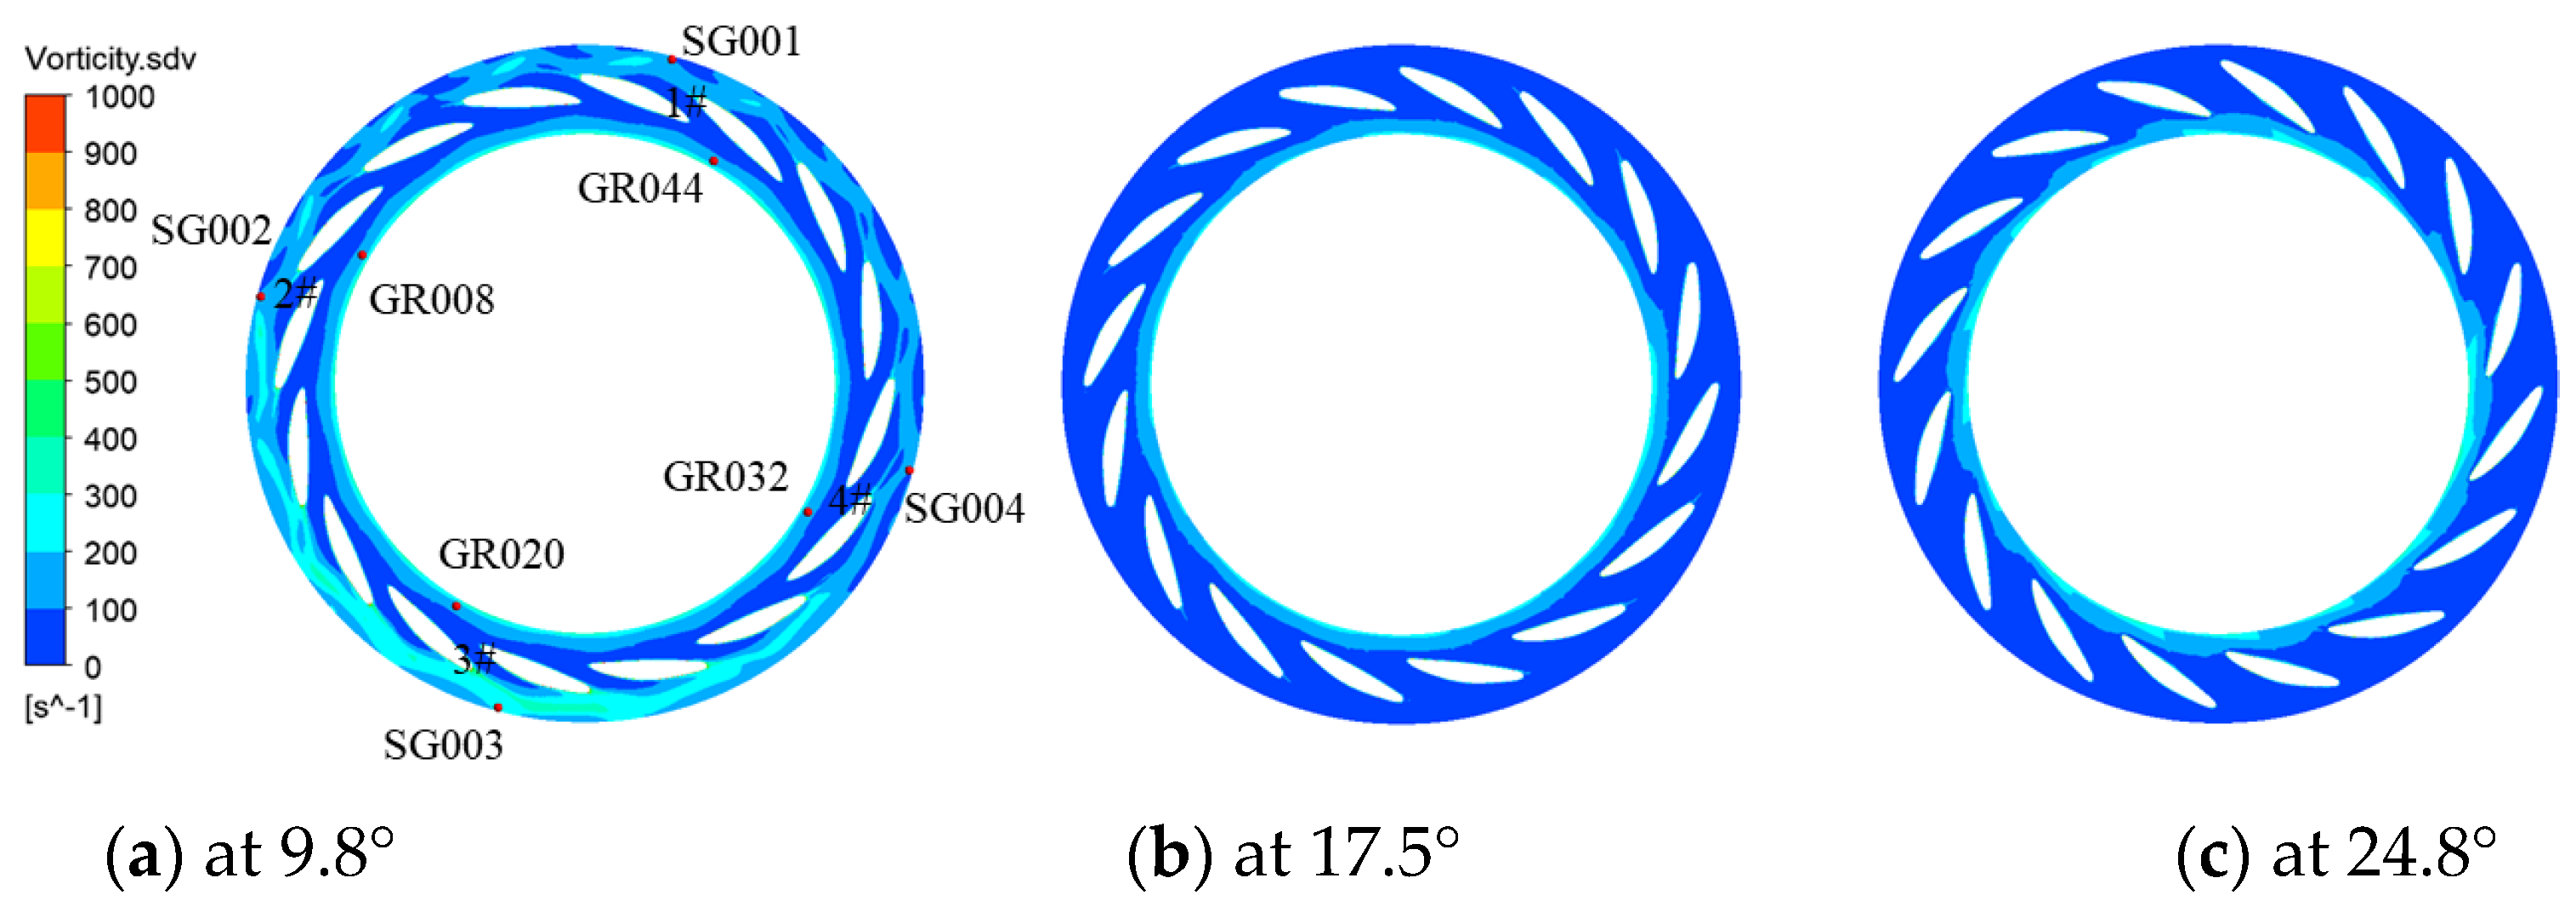
As shown in Figure 19, the standard deviation of the vorticity of the grid node in the guide vanes region is counted within 5 rotation cycles, and the results reflect the vorticity pulsation of the flow field over a period of time. The vorticity pulsation under the optimal opening and the large opening is mainly concentrated in the bladeless region between the runner and the guide vanes, and the degree of pulsation is weak on the whole. The vorticity pulsation at the outlet of the guide blade is relatively significant under a small opening, and the change in the circumference direction is consistent with the low-frequency amplitude distribution of the SG series measuring points mentioned above. This indicates that the flow at the outlet of the guide blade is very unstable under a small opening, and the vortex in this area keeps occurring and collapsing, resulting in a strong vorticity pulsation here, thus producing a low-frequency component with a higher amplitude of 0.2fn.

3.5. Analysis of Guide Vane Water Torque Characteristics

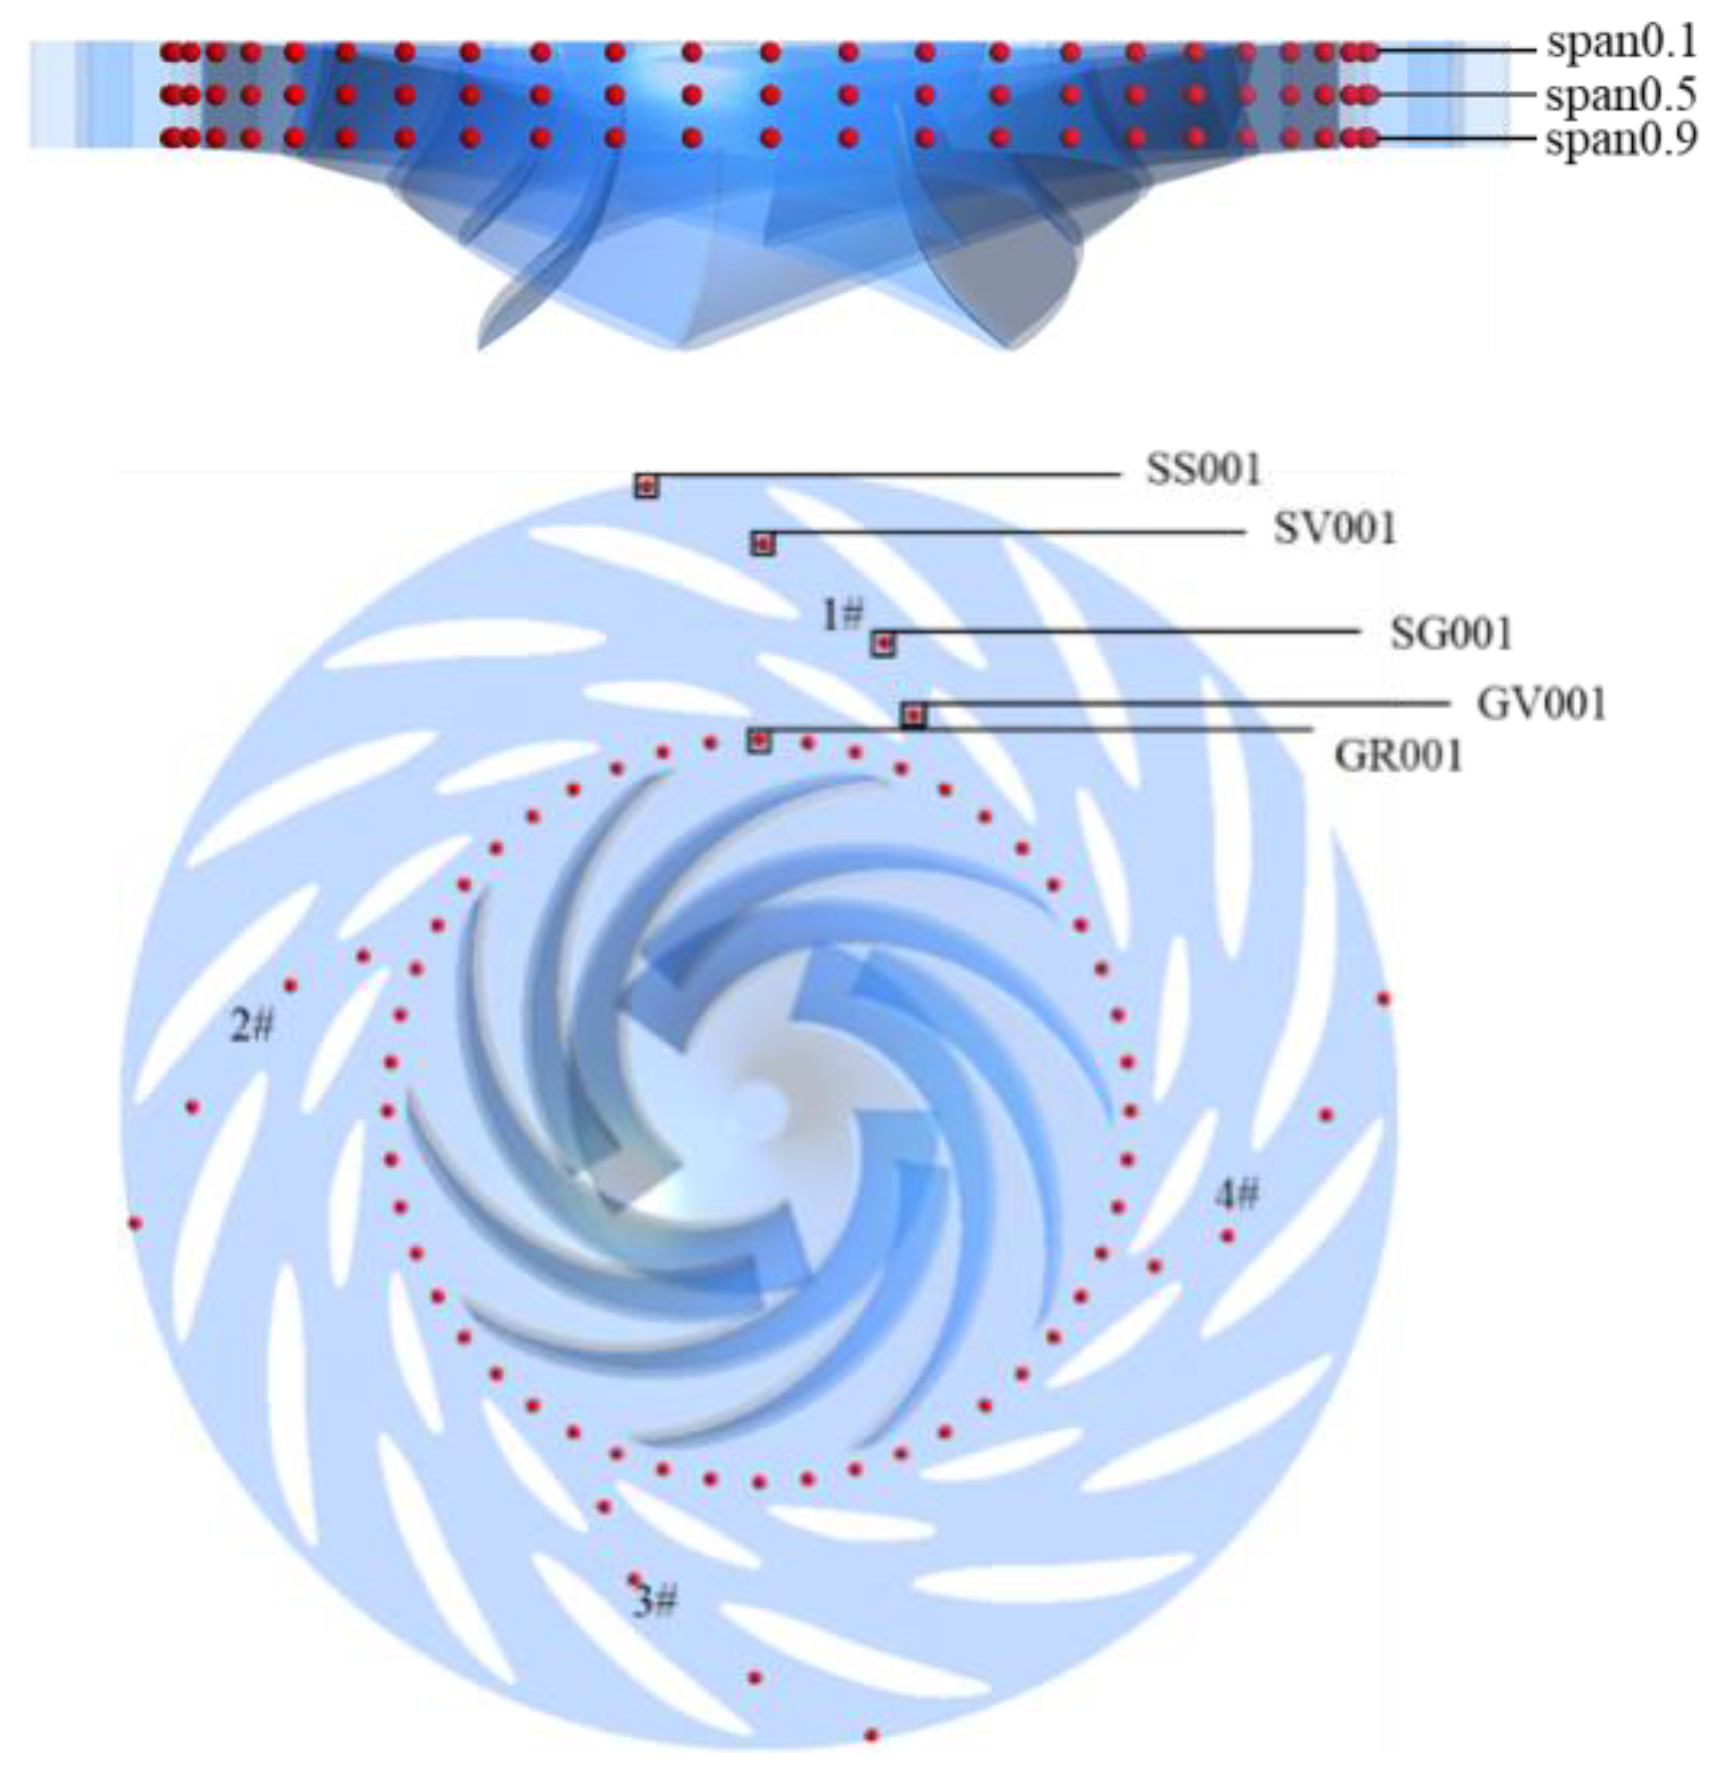
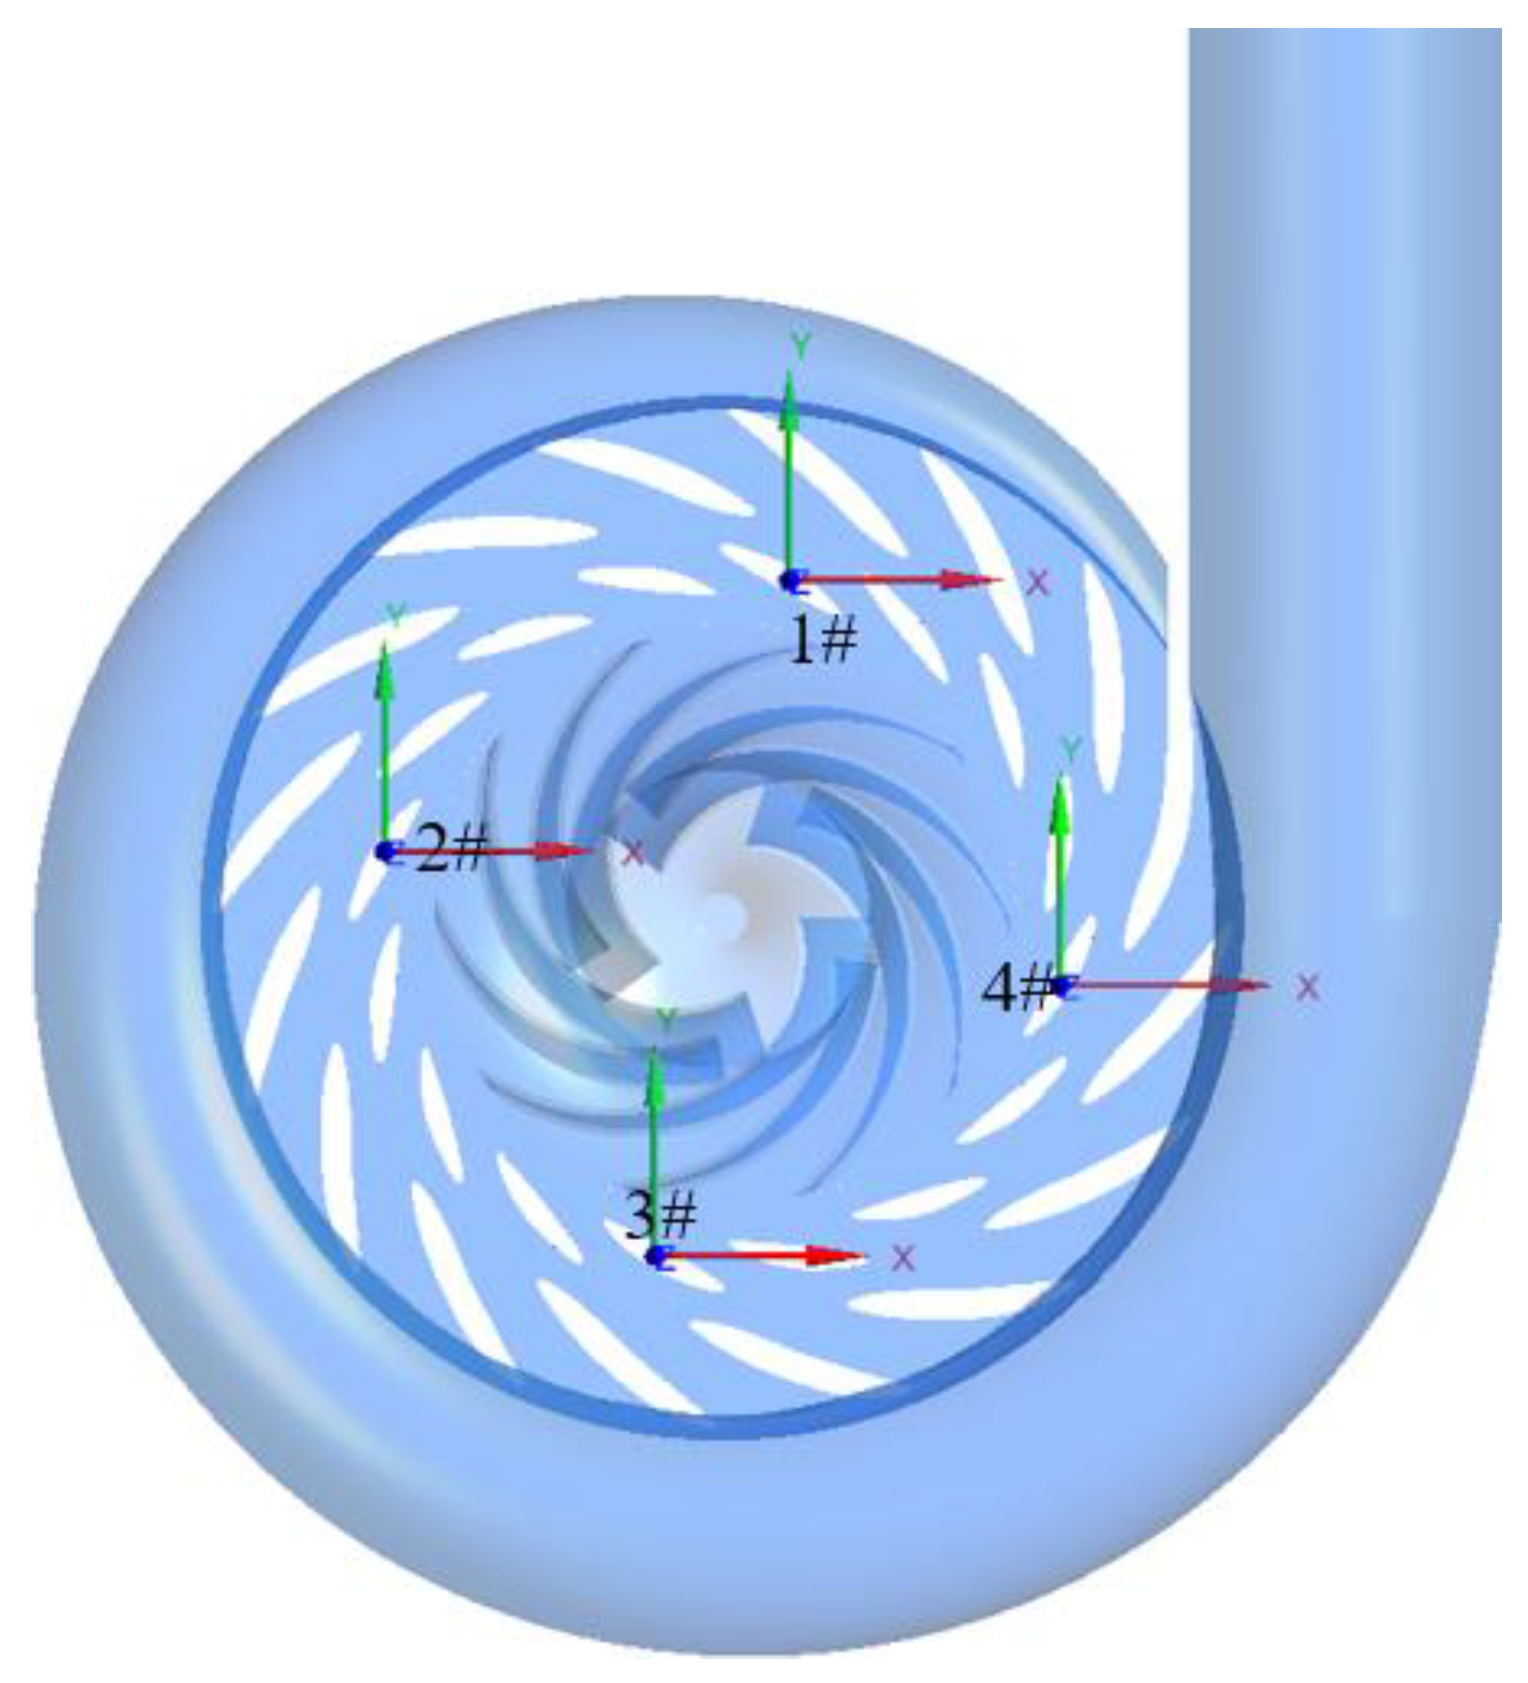
To study the influence of rotor–stator interaction on guide vanes stress, this paper selects 4 active guide vanes with different circumferential positions for water moment monitor under different opening conditions. Figure 20 shows the specific position and rotation axis coordinates of the guide vanes under the optimal opening, and the rest of the openings are the same.
According to relevant standards of the International Electro-Technical Commission (IEC) [30], this paper adopts Formula (7) to conduct dimensionless treatment on the water moment data of guide blade, and obtain the water moment factor data of guide blade, as follows:
T G , ED = T G ρ g H D 1 3
where in Formula (7), T G —Instantaneous monitor value of guide vane water torque, Nm; ρ —density of liquid, kg/m3; g —gravitational acceleration, m/s2; H —head, m; D 1 —diameter of the low-pressure side of the runner, mm.
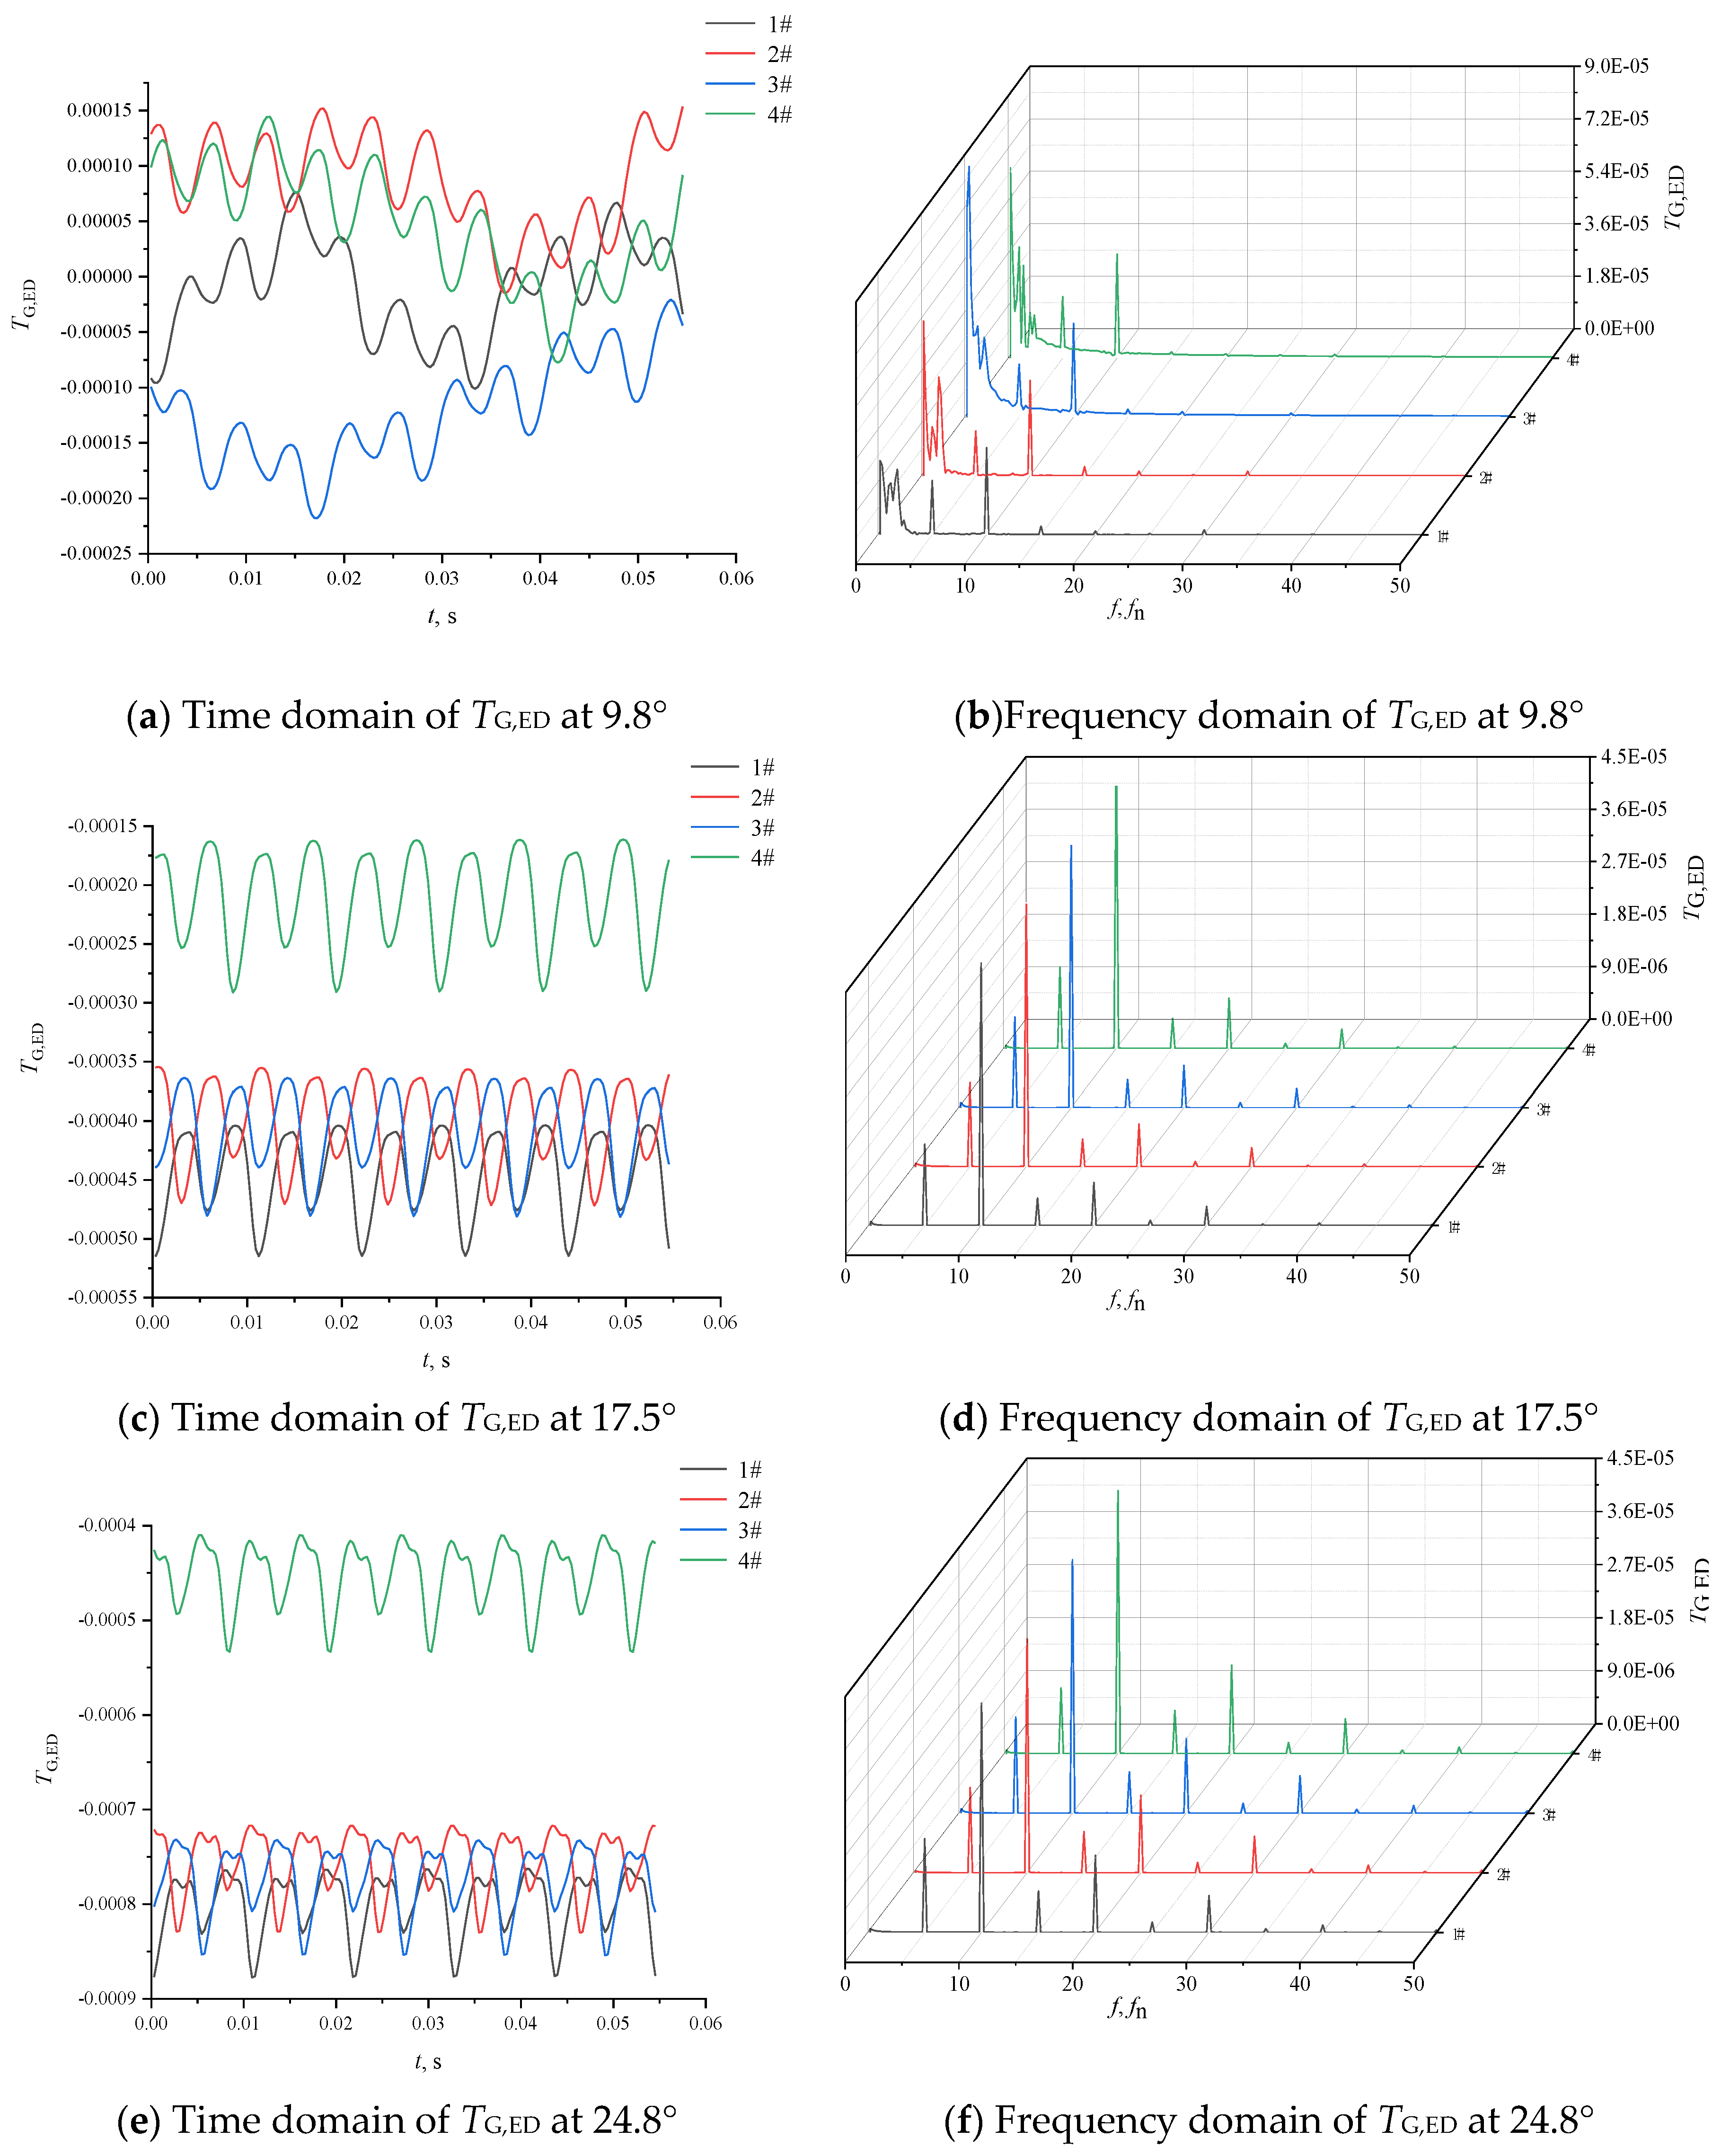
Figure 21 shows the time-frequency domain distribution of the guide blade water torque factor at different guide vane openings. The time-domain diagram shows the variation of the guide vane water torque factor at four different positions in a rotation cycle and the water torque factor of the guide vane closing direction is positive and it of the guide vane opening direction is negative. It is found from the time domain diagram that the regularity of the water moment factor distribution in the time domain is poor under a small opening, and there is uncertainty in the direction of the water moment due to the influence of the unsteady flow at the outlet of the active guide blade. Under the optimal opening and large opening, the guide vanes are affected by the water moment in the opening direction and by the rotor-stator interaction between the runner and the guide vanes. The water moment factor of the guide vanes presents a stable periodic fluctuation in the rotation period. The absolute value of the water moment factor of the guide blade 1# is the largest, while the absolute value of the water moment factor of the guide blade 4# is the smallest. This indicates that there is a significant difference between the guide blade water moment on both sides of the tongue under the optimal opening and the large opening. The guide blade water moment near the large section of the volute outlet is smaller, while the guide vanes water moment located in the flow passage of the small section of the volute is larger. The frequency-domain diagram with a small opening shows that the main frequency of the guide vane water torque factor pulsation frequency is 0.2fn and the second frequency is 16fn. The water torque factor of guide blade 3# has the largest low-frequency pulsation amplitude, and its distribution characteristics are consistent with the pressure pulsation distribution near the guide vanes, thus combined with the above conclusions of pressure pulsation analysis, it is shown that the influence of unsteady flow under the small opening is greater. Further, 5fn, 10fn and 20fn of the rotor-stator interaction frequencies under the optimal opening and the large opening are more prominent. The 10fn amplitude of the main frequency of the water torque factor of guide blade 4# is larger than that of other positions, indicating that the flow difference on both sides of the tongue will intensify the water torque pulsation of the guide blade at that position.

4. Conclusions

In this paper, different rated conditions under three guide vane openings, namely, small opening of 9.8°, optimal opening of 17.5° and large opening of 24.8°, were selected as the research object. The pressure pulsation and stress of guide vane region and runner region are focused on, and the influence of guide vane opening on the rotor-stator interaction was compared and analyzed. The main conclusions were as follows:
  • With the increase of the guide vane opening, the rotor-stator interaction of the pump-turbine intensifies, the magnitude of the radial force of runner and pulsation amplitude as well as the magnitude of the guide vanes water moment and its pulsation amplitude also increase, and the influence brought by the change of the opening becomes more and more significant.
  • The influence of the increase from the optimal opening to 9.8° to 17.5° on the main frequency is mainly reflected in the phase change, while the influence of the increase from the optimal opening to 24.8° on the main frequency is mainly reflected in the amplitude change.
  • Under the influence of blade rotation, the distribution regularity of the runner’s radial force and the guide blade water moment is relatively strong at the optimal opening of 17.5° and the large opening of 24.8°. However, under the condition of the small opening of 9.8°, the poor overcurrent capacity will destroy the symmetry and periodicity of the radial force to some extent.
  • In the case of a small opening degree of 9.8°, the outlet of the guide vanes is full of low-speed vortex core and the degree of vorticity pulsation is relatively strong, which produces a low-frequency component with a higher amplitude of 0.2fn and propagates to the upstream bladeless region.
  • In the case of the small opening and the large opening, the amplitude of 5fn is greater than the optimal opening. It indicates that deviation from the optimal opening will aggravate the difference of rotor-stator interaction between splitter blades and guide vanes.

Author Contributions

Conceptualization, H.S. and J.Z.; methodology, P.H. and P.C.; formal analysis, B.H.; resources, H.C.; writing—original draft preparation, H.C. and P.H.; writing—review and editing, H.S.; supervision, J.Z. and P.H. All authors have read and approved the final manuscript.

Funding

This research was funded by National Key RD Program Projects of China: 2018 YFB0606101, National Natural Science Foundation of China: 51809121, Natural Science Project of Jiangsu Province: SJCX20_1418.

Conflicts of Interest

On behalf of all authors, the corresponding author states that there are no conflict of interest.

Nomenclature

gAcceleration due to gravity: m/s2
ρDensity, kg/m3
HHead, m
QFlow rate, m3/s
tTime, s
x, yCoordinates in stationary frame
iComponents in different directions
TGInstantaneous monitor value of guide vane water torque
D1Diameter of the low-pressure side of the runner
TG,EDGuide vane water torque factor
CFDComputational fluid dynamics
LDVLaser Doppler velocimetry
PIVParticle image velocimetry
FSIFluid–structure interaction
SSTShear stress transport
SST-SASShear stress transport—scale adaptive simulation
MRFMultiple reference frame

References

  1. Kojima, E.; Nagakura, H. Characteristics of fluidborne noise generated by fluid power pumps: 1st report, mechanism of generation of pressure pulsation in axial piston pump. Bull. JSME 1982, 25, 46–53. [Google Scholar] [CrossRef] [Green Version]
  2. Wang, C.; Chen, X.; Qiu, N.; Zhu, Y.; Shi, W. Numerical and experimental study on the pressure fluctuation, vibration, and noise of multistage pump with radial diffuser. J. Braz. Soc. Mech. Sci. Eng. 2018, 40, 481. [Google Scholar] [CrossRef]
  3. Li, D.; Wang, H.; Li, Z.; Nielsen, T.K.; Goyal, R.; Wei, X.; Qin, D. Transient characteristics during the closure of guide vanes in a pump-turbine in pump mode. Renew. Energy 2018, 118, 973–983. [Google Scholar] [CrossRef]
  4. Zhang, Y.; Liu, S.; Wu, Y.; Liu, J. Numerical simulation of flow characteristics of pump turbine with small guide vanes opening. In Proceedings of the 2014 ISFMFE—6th International Symposium on Fluid Machinery and Fluid Engineering, Wuhan, China, 22–25 October 2014. [Google Scholar] [CrossRef]
  5. Li, Q.; Xia, S.S.; Yan, H. Influence of long and short guide vanes on hydraulic performance of water-jet pump. J. Drain. Irrig. Mach. Eng. 2019, 37, 855–862. [Google Scholar]
  6. Xiao, R. Analysis of S characteristics and its pressure pulsation of pump-turbine under pre-opening guide vanes. J. Mech. Eng. 2012, 48, 174. [Google Scholar] [CrossRef]
  7. Haban, V.; Koutnik, J.; Pochyly, F. 1-D mathematical model of high-frequency pressure oscillations induced by RSI including an influence of fluid second viscosity. In Proceedings of the 21st IAHR Symposium on Hydraulic Machinery and Systems, Lausanne, Switzerland, 9–12 September 2002. [Google Scholar]
  8. Rodriguez, C.; Egusquiza, E.; Santos, I.F. Frequencies in the vibration induced by the rotor stator interaction in a centrifugal pump turbine. J. Fluids Eng. 2007, 129, 1428–1435. [Google Scholar] [CrossRef] [Green Version]
  9. Keller, J.; Blanco, E.; Barrio, R.; Parrondo, J. PIV measurements of the unsteady flow structures in a volute centrifugal pump at a high flow rate. Exp. Fluids 2014, 55, 1820. [Google Scholar] [CrossRef]
  10. Gao, Z.; Zhu, W.; Lu, L.; Deng, J.; Zhang, J.; Wuang, F. Numerical and experimental study of unsteady flow in a large centrifugal pump with stay vanes. J. Fluids Eng. 2014, 136, 071101. [Google Scholar] [CrossRef]
  11. Chitrakar, S.; Cervantes, M.J.; Thapa, B.S. Fully coupled FSI analysis of Francis turbines exposed to sediment erosion. Int. J. Fluid Mach. Syst. 2014, 7, 101–109. [Google Scholar] [CrossRef] [Green Version]
  12. Nicolet, C.; Ruchonnet, N.; Alligne, S.; Koutnik, J.; Avellan, F. Hydroacoustic simulation of rotor-stator interaction in resonance conditions in Francis pump-turbine. IOP Conf. Ser. Earth Environ. Sci. 2010, 12, 012005. [Google Scholar] [CrossRef]
  13. Zhang, F.; Appiah, D.; Hong, F.; Zhang, J.; Yuan, S.; Adu-Poku, K.A.; Wei, X. Energy loss evaluation in a side channel pump under different wrapping angles using entropy production method. Int. Commun. Heat Mass Transf. 2020, 113, 104526. [Google Scholar] [CrossRef]
  14. Pei, J.; Osman, M.K.; Wang, W.; Yuan, J.; Yin, T.; Appiah, D. Unsteady flow characteristics and cavitation prediction in the double-suction centrifugal pump using a novel approach. Proc. Inst. Mech. Eng. Part A J. Power Energy 2019, 234, 283–299. [Google Scholar] [CrossRef]
  15. Wang, Y.F.; Zhang, F.; Yuan, S.Q. Effect of unrans and hybrid rans-les turbulence models on unsteady turbulent flows inside a side channel pump. ASME J. Fluids Eng. 2020, 142, 061503. [Google Scholar] [CrossRef]
  16. Cairone, F.; Gagliano, S.; Bucolo, M. Experimental study on the slug flow in a serpentine microchanne. Exp. Therm. Fluid Sci. 2016, 76, 34–44. [Google Scholar] [CrossRef]
  17. Nicolet, C.; Zobeiri, A.; Maruzewski, P.; Avellan, F. On the upper part load vortex rope in Francis turbine: Experimental investigation. IOP Conf. Ser. Earth Environ. Sci. 2010, 12, 12053. [Google Scholar] [CrossRef] [Green Version]
  18. Egusquiza, E.; Valero, C.; Valentin, D. Condition monitor of pump-turbines. New challenges. Measurement 2015, 67, 151–163. [Google Scholar] [CrossRef] [Green Version]
  19. Rodriguez, C.; Mateos-Prieto, B.; Egusquiza, E. Monitoring of rotor-stator interaction in pump-turbine using vibrations measured with on-board sensors rotating with shaft. Shock. Vib. 2014, 2014, 276796. [Google Scholar] [CrossRef] [Green Version]
  20. Casartelli, E.; Mangani, L.; Ryan, O.; Schmid, A. Application of transient CFD-procedures for S-shape computation in pump-turbines with and without FSI. IOP Conf. Ser. Earth Environ. Sci. 2016, 49, 42008. [Google Scholar] [CrossRef]
  21. Vagnoni, E.; Andolfatto, L.; Guillaume, R.; Leroy, P.; Avellan, F. Rotating air-water ring in the vaneless gap of a pump-turbine operating in condenser mode. Int. J. Multiph. Flow 2018, 105, 112–121. [Google Scholar] [CrossRef]
  22. Li, D.; Gong, R.; Wang, H.; Wei, X.; Liu, Z.S.; Qin, D.Q. Analysis of rotor-stator interaction in turbine mode of a pump-turbine model. J. Appl. Fluid Mech. 2016, 9, 2559–2568. [Google Scholar] [CrossRef]
  23. Li, Z.; Wang, Z.; Wei, X.; Qin, D. Flow similarity in the rotor-stator interaction affected region in prototype and model francis pump-turbines in generating mode. J. Fluids Eng. 2016, 138, 061201. [Google Scholar] [CrossRef]
  24. Cavazzini, G.; Pavesi, G.; Santolin, A.; Ardizzon, G.; Lorenzi, R. Using splitter blades to improve suction performance of centrifugal impeller pumps. Proc. Inst. Mech. Eng. Part A J. Power Energy 2014, 229, 309–323. [Google Scholar] [CrossRef]
  25. Shigemitsu, T.; Fukutomi, J.; Wada, T.; Shinohara, H. Performance analysis of mini centrifugal pump with splitter blades. J. Therm. Sci. 2013, 22, 573–579. [Google Scholar] [CrossRef]
  26. Shigemitsu, T.; Fukutomi, J.; Kaji, K.; Wada, T. Unsteady internal flow conditions of mini-centrifugal pump with splitter blades. J. Therm. Sci. 2013, 22, 86–91. [Google Scholar] [CrossRef]
  27. Kergourlay, G.; Younsi, M.; Bakir, F.; Rey, R. Influence of splitter blades on the flow field of a centrifugal pump: Test-analysis comparison. Int. J. Rotating Mach. 2007, 2007, 085024. [Google Scholar] [CrossRef] [Green Version]
  28. Yang, S.S.; Kong, F.Y.; Chen, B. Splitter Blades on the Performance of Pump as Turbine Using cfd. Kung Cheng Je Wu Li Hsueh Pao/J. Eng. Thermophys. 2010, 31, 141–144. [Google Scholar]
  29. He, W.; Jiang, Z.; Feng, K. Bearing fault detection based on optimal wavelet filter and sparse code shrinkage. Measurement 2009, 42, 1092–1102. [Google Scholar] [CrossRef]
  30. Swiss Standards. Hydraulic Turbines, Storage Pumps and Pump Turbines-Model Acceptance Tests; International Electrotechnical Commission: Geneve, Switzerland, 1999; pp. 54–55. [Google Scholar]
Figure 1. Full flow geometric model.
Mathematics 08 01465 g001
Figure 2. Each component structural mesh.
Mathematics 08 01465 g002
Figure 3. Mesh independence test.
Mathematics 08 01465 g003
Figure 4. Diagram of guide vane opening.
Mathematics 08 01465 g004
Figure 5. Comparison of performance between simulation and experiment in different openings.
Mathematics 08 01465 g005aMathematics 08 01465 g005b
Figure 6. Monitor points in runner.
Mathematics 08 01465 g006
Figure 7. Monitor points in stay-guide vanes.
Mathematics 08 01465 g007
Figure 8. Pressure fluctuation distributions on runner surface and outlet ring surface at different openings.
Mathematics 08 01465 g008
Figure 9. Time and frequency domain of pressure fluctuation of RN01 with different opening.
Mathematics 08 01465 g009
Figure 10. Amplitude distribution of 16fn at runner outlet.
Mathematics 08 01465 g010
Figure 11. Time-frequency domain of pressure pulsation of 16fn at runner outlet.
Mathematics 08 01465 g011aMathematics 08 01465 g011b
Figure 12. Radial force distribution of runner in one rotation cycle.
Mathematics 08 01465 g012
Figure 13. Time and frequency domain of pressure fluctuation of GR001 with different opening.
Mathematics 08 01465 g013
Figure 14. Circumferential distribution of rotor-stator interaction amplitude with different opening.
Mathematics 08 01465 g014
Figure 15. Time-frequency domain of pressure pulsation of GR001 with different opening.
Mathematics 08 01465 g015
Figure 16. Distribution of vortex core in the region of guide vane with different openings.
Mathematics 08 01465 g016
Figure 17. Frequency domain of pressure fluctuation of SG001 with different opening.
Mathematics 08 01465 g017
Figure 18. Amplitude distribution of 0.2fn in different channels (9.8°).
Mathematics 08 01465 g018
Figure 19. Distribution of vorticity fluctuation in the region of guide vane with different opening.
Mathematics 08 01465 g019
Figure 20. Monitor position of hydraulic torque of guide vane.
Mathematics 08 01465 g020
Figure 21. Time and frequency domain distributions of TG,ED with different openings.
Mathematics 08 01465 g021
Table 1. Basic parameters of the pump-turbine model.
ParametersNumber
Stay vanes16
Guide vanes16
Runner vanes10
Runner low-pressure side diameter D1 (mm)300
Runner high-pressure side diameter D2 (mm)584
Runner outlet diameter (mm)55
Volute outlet diameter (mm)320
Draft tube inlet diameter (mm)600
Table 2. Grid quantity statistics of each computational domain (×104).
CaseVoluteStay VaneGuide VaneDraft TubeRunnerTotal
148.688.398.260.6130.9426.6
265.1110.2119.777.5145.9518.4
384.5129.7136.4100.9163.8615.3
4107.6152.8158.9117.6184.4721.3
5126.0173.2177.1135.3206.5818.1
6149.2191.6196.5154.8228.1920.2
7170.7209.7216.6173.3246.71017.0
Table 3. Radial force of the runner with different opening.
OpeningFxRMS, NFyRMS, NF, N
9.8°172.430181.119250.066
17.5°177.022177.093250.397
24.8°230.050229.982325.292

