Article

Finite Element Analysis of Custom Shoulder Implants Provides Accurate Prediction of Initial Stability

by
Jonathan Pitocchi
1,2,3,*,
Mariska Wesseling
1,
Gerrit Harry van Lenthe
2 and
María Angeles Pérez
3
1
Materialise NV, 3001 Leuven, Belgium
2
Biomechanics Section, KU Leuven, 3001 Leuven, Belgium
3
Multiscale in Mechanical and Biological Engineering, Instituto de Investigación en Ingeniería de Aragón (I3A), Instituto de Investigación Sanitaria Aragón (IIS Aragón), University of Zaragoza, 50018 Zaragoza, Spain
*
Author to whom correspondence should be addressed.
Mathematics 2020, 8(7), 1113; https://doi.org/10.3390/math8071113
Submission received: 26 May 2020 / Revised: 29 June 2020 / Accepted: 3 July 2020 / Published: 6 July 2020
(This article belongs to the Special Issue Numerical Simulation in Biomechanics and Biomedical Engineering)

Abstract

:
Custom reverse shoulder implants represent a valuable solution for patients with large bone defects. Since each implant has unique patient-specific features, finite element (FE) analysis has the potential to guide the design process by virtually comparing the stability of multiple configurations without the need of a mechanical test. The aim of this study was to develop an automated virtual bench test to evaluate the initial stability of custom shoulder implants during the design phase, by simulating a fixation experiment as defined by ASTM F2028-14. Three-dimensional (3D) FE models were generated to simulate the stability test and the predictions were compared to experimental measurements. Good agreement was found between the baseplate displacement measured experimentally and determined from the FE analysis (Spearman’s rank test, p < 0.05, correlation coefficient ρs = 0.81). Interface micromotion analysis predicted good initial fixation (micromotion <150 µm, commonly used as bone ingrowth threshold). In conclusion, the finite element model presented in this study was able to replicate the mechanical condition of a standard test for a custom shoulder implants.

1. Introduction

Since its introduction in the late 1980s, reverse shoulder arthroplasty (RSA) has become a standard treatment for patients with rotator cuff arthropathy. More recently, surgeons have expanded its application to fracture care, rheumatoid arthritis, and even failed prior surgery replacements, further increasing the number of surgeries [1,2]. In many cases, the presence of considerable bone loss at the glenoid side, due to degenerative arthritis or secondary to revision surgeries, may complicate baseplate implantation. This limits the treatment options and jeopardizes the clinical outcomes, as insufficient bone stock can lead to suboptimal component fixation and therefore early implant failure.
Different methods have been described to address glenoid defects, depending on the bone loss severity [3]. Eccentric reaming can be performed in case of moderate bone loss, while bone grafting is more suitable for large defects. However, the results of bone grafting are controversial since not all studies have reported satisfactory outcomes [4]. More recently, custom implants have been introduced as an alternative treatment. Together with patient-specific preoperative planning and implant design, custom implants allow for proper joint positioning and fixation of the component in the remaining native bone [5,6].
In order to avoid aseptic loosening of the glenoid component, a stable bone–implant interface is necessary, in which only small relative movements are allowed. Fixation screws are used to provide initial mechanical stability (primary fixation) which subsequently can lead to biological fixation by bone ingrowth (secondary fixation). To enable bone ingrowth, custom implants have a porous titanium structure (spray-coated or 3D printed) [7,8]. However, micro-motion at the bone–implant interface above 150 µm has been shown to inhibit this mechanism and lead to an unstable fibrous tissue layer between the metallic porous layer and the host bone [9]. Therefore, implant design should be optimized to minimize micromotion at the time of initial fixation, thus leading to a stable bone–implant interface and to a better osseointegration.
For patient-specific shoulder implants, the enormous design space, which allows the glenoid component to be adapted to the patient anatomy, represents a challenge to the evaluation of the mechanical stability. While mechanical tests can be performed extensively to assess the stability of standard implants [10,11,12], for custom implants with a unique design for each patient, it is not practical to use mechanical testing to verify the stability. Alternatively, Finite Element (FE) analysis has been widely used to evaluate the influence of different implant configurations on the initial fixation of an implant [13,14,15,16,17,18,19].
Chae et al. analyzed the bone–implant interface micromotion of an inferiorly tilted glenoid component virtually implanted in a scapula model and found that the tilted fixation compromised initial mechanical stability [17]. Suarez et al. investigated how a different type and number of screws impacted the initial stability of a cementless glenoid component, reporting higher interface micromotions when the same implant was tested in poor quality bone [14], even when more physiological loads (e.g., from musculoskeletal model) were applied [18]. Elwell et al. [19] reported similar results, showing that the use of only two fixation screws could amplify the negative effect of baseplate lateralization, thus jeopardizing implant stability and worsening its functional outcome. Hopkins et al. examined multiple standard designs with different screw angle inclination, concluding that increasing the screw inclination enhanced stability more than using longer and thicker screws [15]. Other studies explored instead the effect of the prosthesis repositioning (using different glenosphere sizes or bone grafting) and found that a lateralization of 10 mm was mechanically acceptable for osseointegration [13,16].
However, the effect of different loading directions, which in case of a custom implant cannot be neglected due to the asymmetry of the design shape, was never systematically investigated. It is evident that, since the main parameters (number and type of screws, baseplate dimensions, etc.) are unique for each custom implant, FE analysis has the potential to guide the design process by virtually comparing multiple designs without the need of a mechanical test.
Therefore, the aim of this study is to develop an automated workflow to evaluate the initial stability of custom shoulder implants during the design phase, by simulating a fixation experiment based on ASTM F2028-14 [20]. To our knowledge, this is the first study to automate, evaluate and validate a full in silico modeling of the ASTM F2028-14 for a custom-made prosthesis. Moreover, the FE model can be used to predict the relative motion at the bone–implant interface, which cannot be quantified by the current mechanical tests.

2. Materials and Methods

A custom reverse shoulder implant was designed and 3D printed to comply with ASTM standards [20]. To evaluate the preclinical stability of the implant, displacement of the glenoid baseplate was measured in response to axial and shear loading, after insertion in a bone substitute. The experimental baseplate displacement was compared to the model estimation to validate the virtual bench test. A more detailed explanation regarding the mechanical test and the in silico model is presented in the following sections.

2.1. Experimental Set-Up

The ASTM F2028-14 [20] is a standard method commonly used for assessing the risk of glenoid loosening in shoulder implants. The test protocol includes three subsequent steps: (1) an initial static analysis to measure the baseplate displacement, (2) a fatigue phase in which the implant is cyclically rotated around an axis loaded with a compressive axial force, and (3) an additional static phase to measure the glenoid fixation, similarly to step 1.
The custom implant was inserted into a 20 pcf (pounds per cubic foot) polyurethane block (Sawbones Europe AB, Sweden), which is normally used as substitute of glenoid bone in mechanical tests [21]. Two locking and two nonlocking (compression) screws were used to fix the implant to the artificial bone (Figure 1a). Compression screws are able to close the gap at the bone–implant interface, by pressing the metal component towards the bone. For this reason, nonlocking screws were inserted first, followed by the locking screws, which instead lock the implant in place thanks to the threaded head mating the threaded holes of the implant.
An axial compressive load of 430 N was applied perpendicular to the glenoid plane by a flat polyacetal load applicator. An additional shear load of 350 N was applied parallel to the baseplate via a horizontal loading fixture (Figure 1b). Shear and axial forces were defined in a worst-case loading scenario, being respectively 42% and 51% of body weight (assumed to be 86 kg) [20].
Contrary to standard baseplates, which normally have a symmetric round shape, custom implants can present an asymmetric design, consequently the shear load was applied along the four main directions of the implant: anterior, posterior, superior and inferior (Figure 1a). Dial indicators (MTS System, USA) were placed to measure the displacement of the baseplate. For each loading direction, both axial and shear baseplate displacements were measured, resulting in a total of eight measurements. Each measurement was performed three times and averaged value was obtained. The test was repeated for six identical samples under the same conditions.

2.2. Generation of Finite Element Models

An automated workflow was developed to set-up FE simulations of a virtual bench test. To obtain a virtual bench test that can be run multiple times by the design engineers to support possible design decisions and adaptations, the computational time of the simulation needs to be limited. For this reason, the finite element model was created to simulate only the static step of the experimental test, without considering the fatigue aspect, similarly to the work of Virani et al. [13].

2.2.1. Bone and Implant Models

The geometry files (STL) of the implant were imported into the design software 3-matic (v 14.0, Materialise N.V., Leuven, Belgium), that includes a Python scripting interface to automate processes (Figure 2). The bone substitute, which had to match the nonflat contact surface at the interface with the implant, and the loading box were created through a series of Boolean operations.
The 3D FE models were meshed with tetrahedral C3D4 elements. For the loading box, a coarse mesh was used, with element edge lengths ranging from 2 to 4 mm. The bone block was meshed with nonuniform elements, using a more fine mesh at the interface. A mesh convergence study was performed upfront by evaluating the impact of different mesh size on the interface micromotion. Ultimately, an average element edge length of 0.5 mm at the baseplate–bone interface was considered as the converged mesh. Nonmanifold nodes were created at the bone–implant interface, to facilitate the micromotion calculation and the convergence of the contact analysis. Due to this operation the elements nodes in the contact surface were shared between implant and bone. The implant was meshed with an average edge length of 0.5, for a total of approximately 630,000 elements, consistent with the dimensions of the prosthetic components and necessary to capture the complexity of the custom design. Ultimately, the glenosphere was meshed with an average element size of 0.5 mm. The meshing process of the screws is described in Section 2.2.3.
All components were modeled with linear elastic material properties, which is an assumption commonly made under these experimental conditions [22]. The loading box and baseplate were assigned with a Young’s modulus of 110,000 MPa and a Poisson’s ratio, ν, of 0.3 (corresponding to Titanium Ti-6Al-4V, [23]). The porous structure of the baseplate, mainly consisting of 3D printed Titanium, was modelled as a solid part and characterized by a lower stiffness. A Young’s modulus equal to 2000 MPa and a Poisson’s ratio of 0.3 were used, consistently with the values reported in the literature for titanium porous scaffolds [24]. The glenosphere was modeled using cobalt-chromium-molybdenum material properties (E = 220,000 MPa, ν = 0.3, [25]). The material properties of the foam block, representative of human glenoid trabecular bone, were taken as reference for the bone substitute (E = 200 MPa, ν = 0.3, [26]).
Contact surfaces were tied or were modelled as a hard contact with friction, depending on the interaction of the component. The interface between glenosphere and baseplate, and loading box and bone block, were considered completely tied, with no relative motion. Coulomb friction contact was implemented at the bone–implant interface. In the literature, values ranging from 0.5 to 0.7 are reported for the friction coefficient between bone and porous metal [13,14,22,27], thus an average friction coefficient of 0.6 was selected for the presented model.

2.2.2. Screw Model

In order to assess the impact of different screw types (compression and locking) on fixation, particular attention was paid to the screw modeling. A recent study showed that an excessive simplification of the screw shaft model has an impact on the micromotion in RSA implant design analysis [22]. Hence, the validity of the simplification assumptions has always to be evaluated against experimental measurements, aiming for a trade-off between acceptable computation times and prediction accuracy.
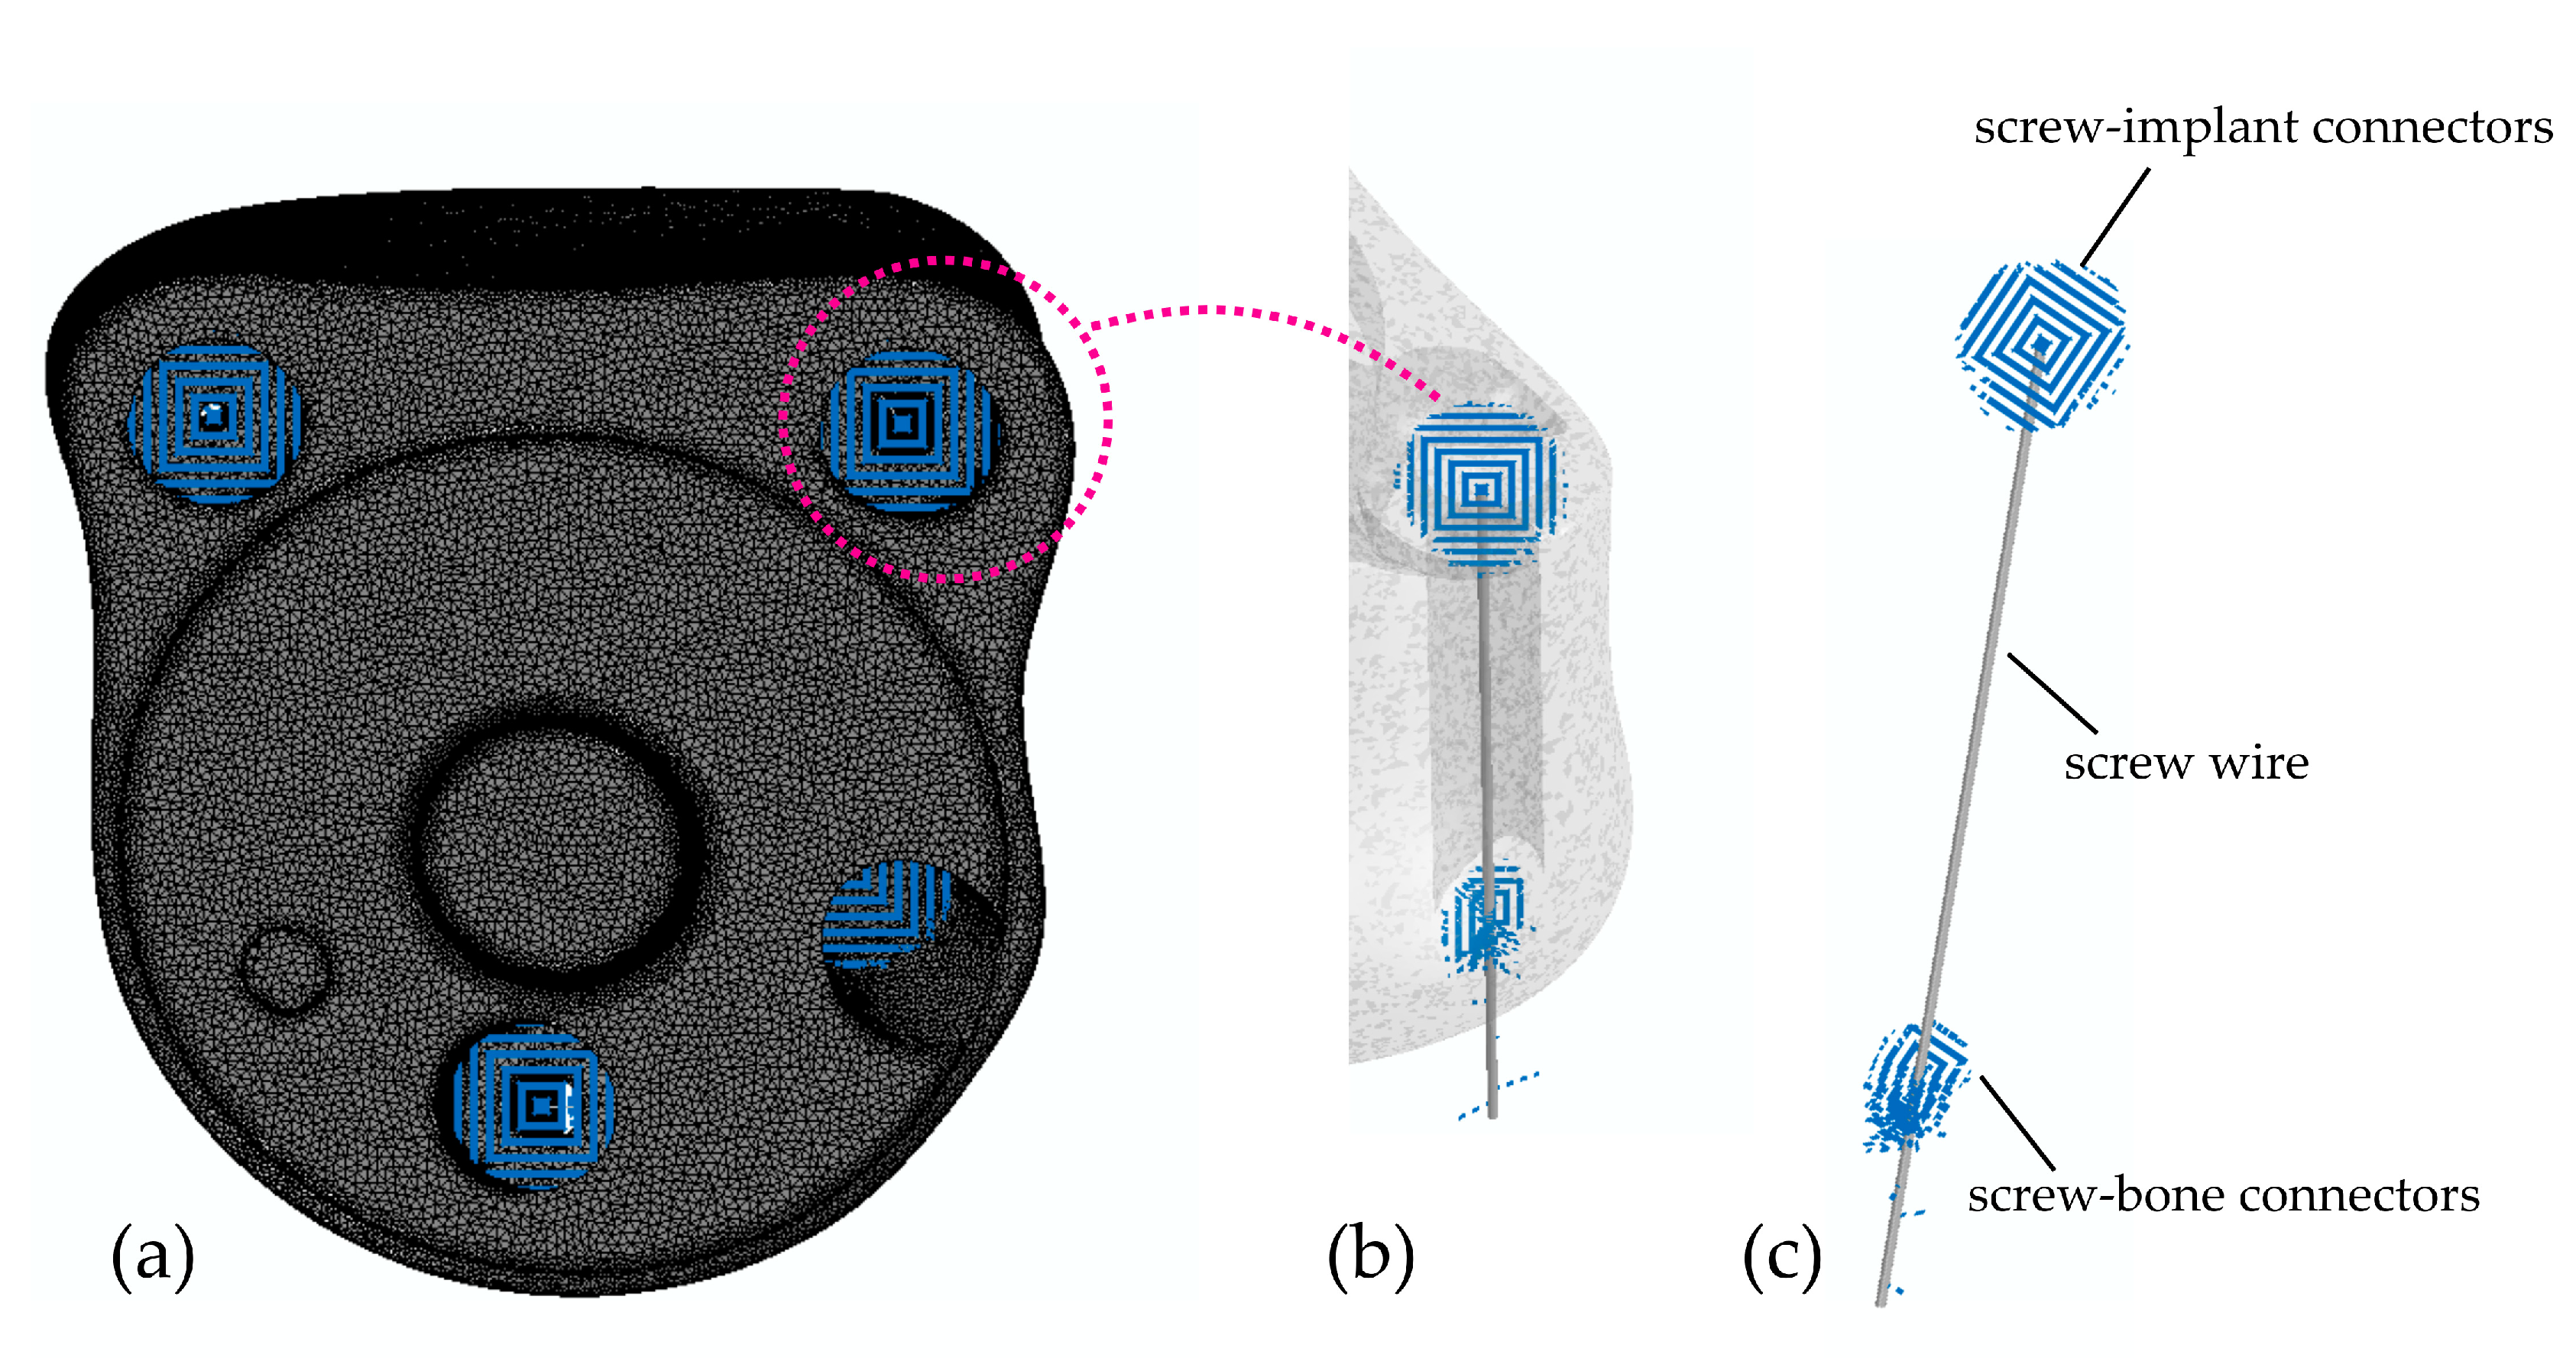
Screws were modeled following a previously described approach [28]. This approach uses structural elements for the connection to the bone, which avoids the need of meshing screw holes and the associated computational cost related to additional contact analysis (Figure 3a). A script was implemented in Python 3.7 to automate the modeling process and include the screws in the Abaqus input file. As output of the design planning phase, five screw parameters could be extracted: position (head coordinates), length, direction, outer diameter and root diameter.
Each screw was modeled as a wire connecting the head point (input parameter) to the endpoint (obtained with the length and direction vector) and penetrating the elements of the bone (Figure 3b,c). All the nodes of the bone elements lying around the wire and at a maximum distance equal to the outer screw radius were connected perpendicular to the wire with rigid connector elements. The screw head was fixed to the implant in a similar way, by connecting the node representing the head with the nodes within the baseplate holes. To mesh the screw wire, beam elements (B32, three-node) with a circular cross section equal to the root radius where used, imposing as nodes the calculated intersection points between wire and connector elements. Since titanium screws were used, a Young’s modulus of 110,000 MPa and a Poisson’s ratio of 0.3 were assigned as material properties.
To differentiate the mechanical behavior between locking and compression screws, additional assumptions were made. To model the loose connection between the unthreaded head of a compression screw and the implant, the stiffness of the first 2 mm of the screw shaft was set to 200 MPa, a value equal to the elastic modulus of the bone substitute [14].
Moreover, nonlocking screws provide an initial compression that constrains the implant towards the bone. The impact of this aspect on FE analysis was already examined in literature, demonstrating that the inclusion of preload in the model is a key parameter when investigating interface micromotion [29]. For this reason, preload was explicitly modeled using the pretension section of Abaqus at the intersection of the screwed and nonscrewed portion of the shaft, similarly to the study of Virani et al. [13]. For the current model, the input values of the insertion force were estimated based on experimental data [30]. Briefly, a custom-made load sensor was built to measure the compression force generated by the screw head. Screws with different lengths were inserted into synthetic bone blocks (Sawbones; Malmö, Sweden) of 20 pcf and the force was acquired until failure of the bone substitute. This resulted in a maximum compression of 370 N and 420 N for the two screws used in the loosening test. Since those values were measured at failure loads, the pretensions in Abaqus were set to 260 N and 300 N, by taking 70% of the force to failure [14].

2.2.3. Boundary Conditions and Simulation Steps

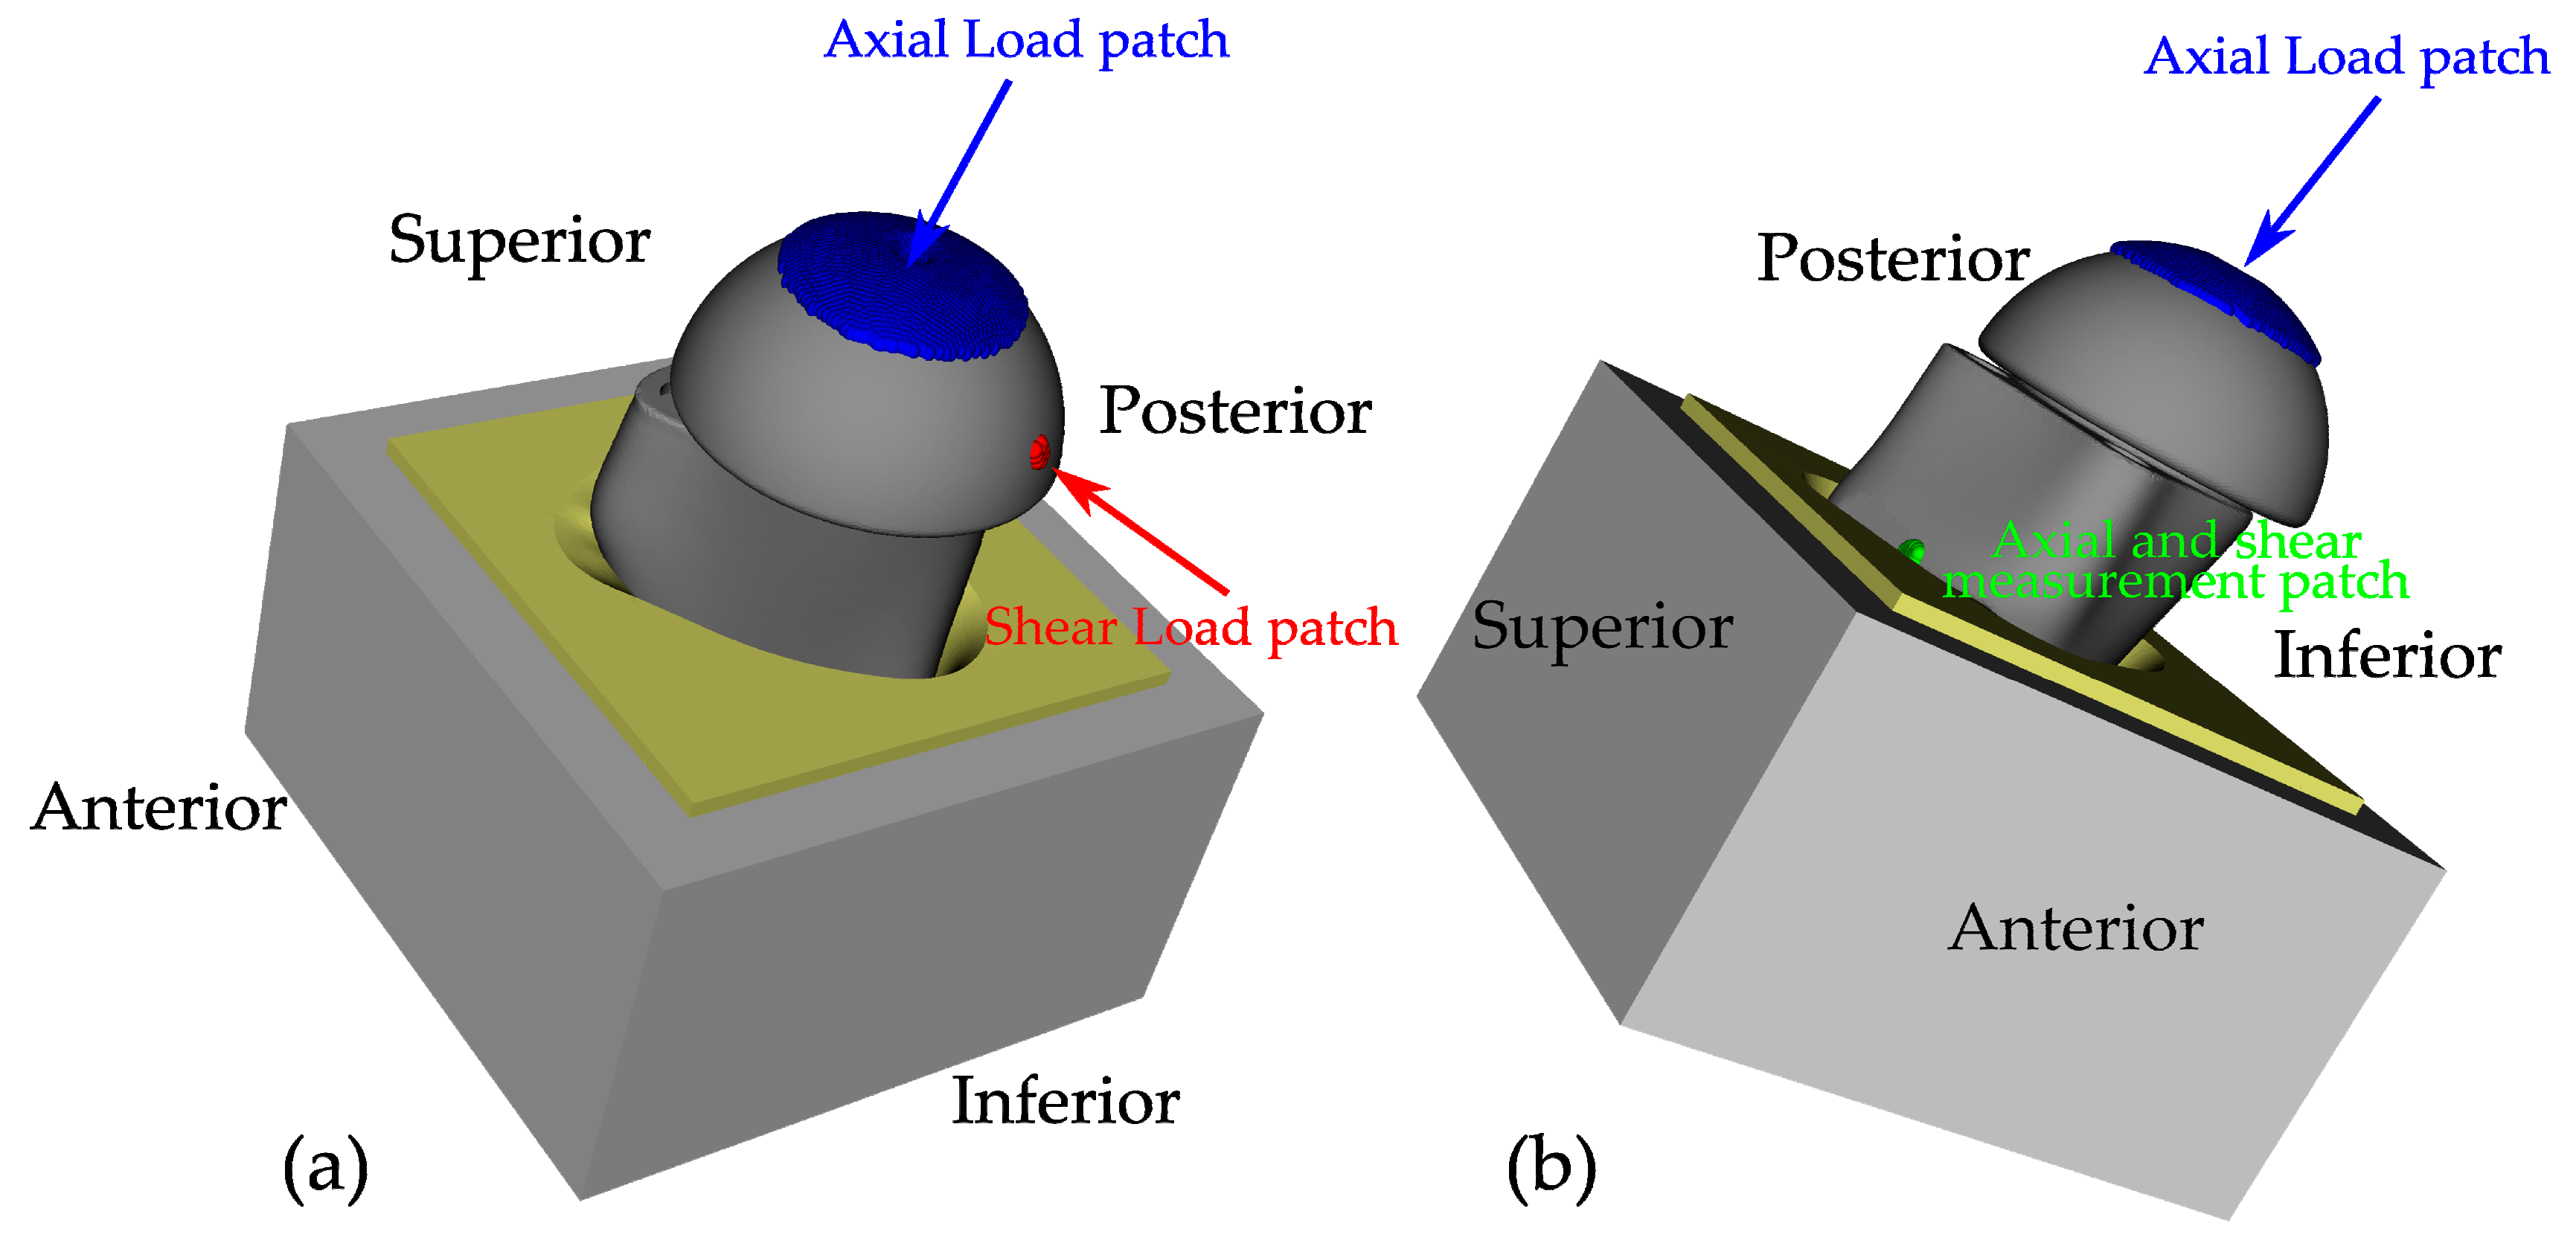
Boundary and loading conditions mimicking the experimental set-up were applied. Specifically, the bottom and side faces of the rectangular metal box were fully constrained in all the directions. The axial load of 430 N was applied perpendicular to the glenoid plane through the glenosphere. A patch (10 mm radius) was defined on top of the glenosphere cup surface and all nodes lying inside were selected to apply the load (Figure 2). For the shear force, a patch of 1 mm radius was defined on the inferior side of the cup, as to simulate the horizontal load fixture (Figure 2a).
To estimate the baseplate displacement, measurement patches of nodes (1 mm radius, representative of the dial indicator tip) were also automatically defined on the baseplate surface, using the known direction vector of the load (Figure 2b). For example, when the shear load was imposed inferiorly (Figure 1a), the measurement patch was defined superiorly, centered at the intersection point between the load direction vector and the edge of the implant surface.
All analyses were performed in Abaqus/Standard 6.14 (Dassault Systèmes, Waltham, MA, USA). To solve the nonlinear equilibrium equations the Newton’s method was used [31]. A three-step analysis was implemented to mimic the experimental set-up and take into account the implemented surgical technique, which consists of inserting the compression screws first followed by the locking screws: in the first step, screw pretension was modeled (see Section 2.2.3), in the second step shear load was applied, followed by the axial load in the third step.
The end of the first step was considered as the initial state for the displacement analysis, similarly to the experimental set-up (pretension of the compression screws already present before the application of the loads). Consequently, the final baseplate displacement, used for model validation, was defined as the difference in the average displacement of the patch nodes between the second and third step.

2.3. Statistical Analyses and Sensitivity Study

Predicted implant stability values were calculated as the average of the displacements for the nodes lying in the measurement patch, as defined in Section 2.2.3. Both the shear and axial components of the displacements were taken into account. A Spearman’s rank order correlation test was used for comparing the consistency of results between the experimental and in silico analysis, with a significance level set to 0.05. Correlation coefficients whose magnitude were lower than 0.7, between 0.7 and 0.9 and higher than 0.9, indicated respectively a moderate, high and very high correlation [32].
Besides the baseplate displacement, shear and axial micromotion at the bone–implant interface were calculated using the FE method. These micromotions comprised the displacement values for all nodes on the contact surface. Since nonmanifold nodes were created at the bone–implant interface, micromotion was defined as the relative motion between the corresponding nodes after application of the loads. In particular, for each contact node on the implant surface, micromotion UP was calculated as:
UP = RP − RB,
where RP and RB are the vector positions of the node on the prosthesis (p) and its corresponding one on the bone surface (B), respectively. Shear (Ut) and axial (Un) micromotion were then calculated by projecting the total micromotion on the corresponding loading direction vectors, as follows:
U t = U P   ·   t ^
U n = U P   ·   n ^
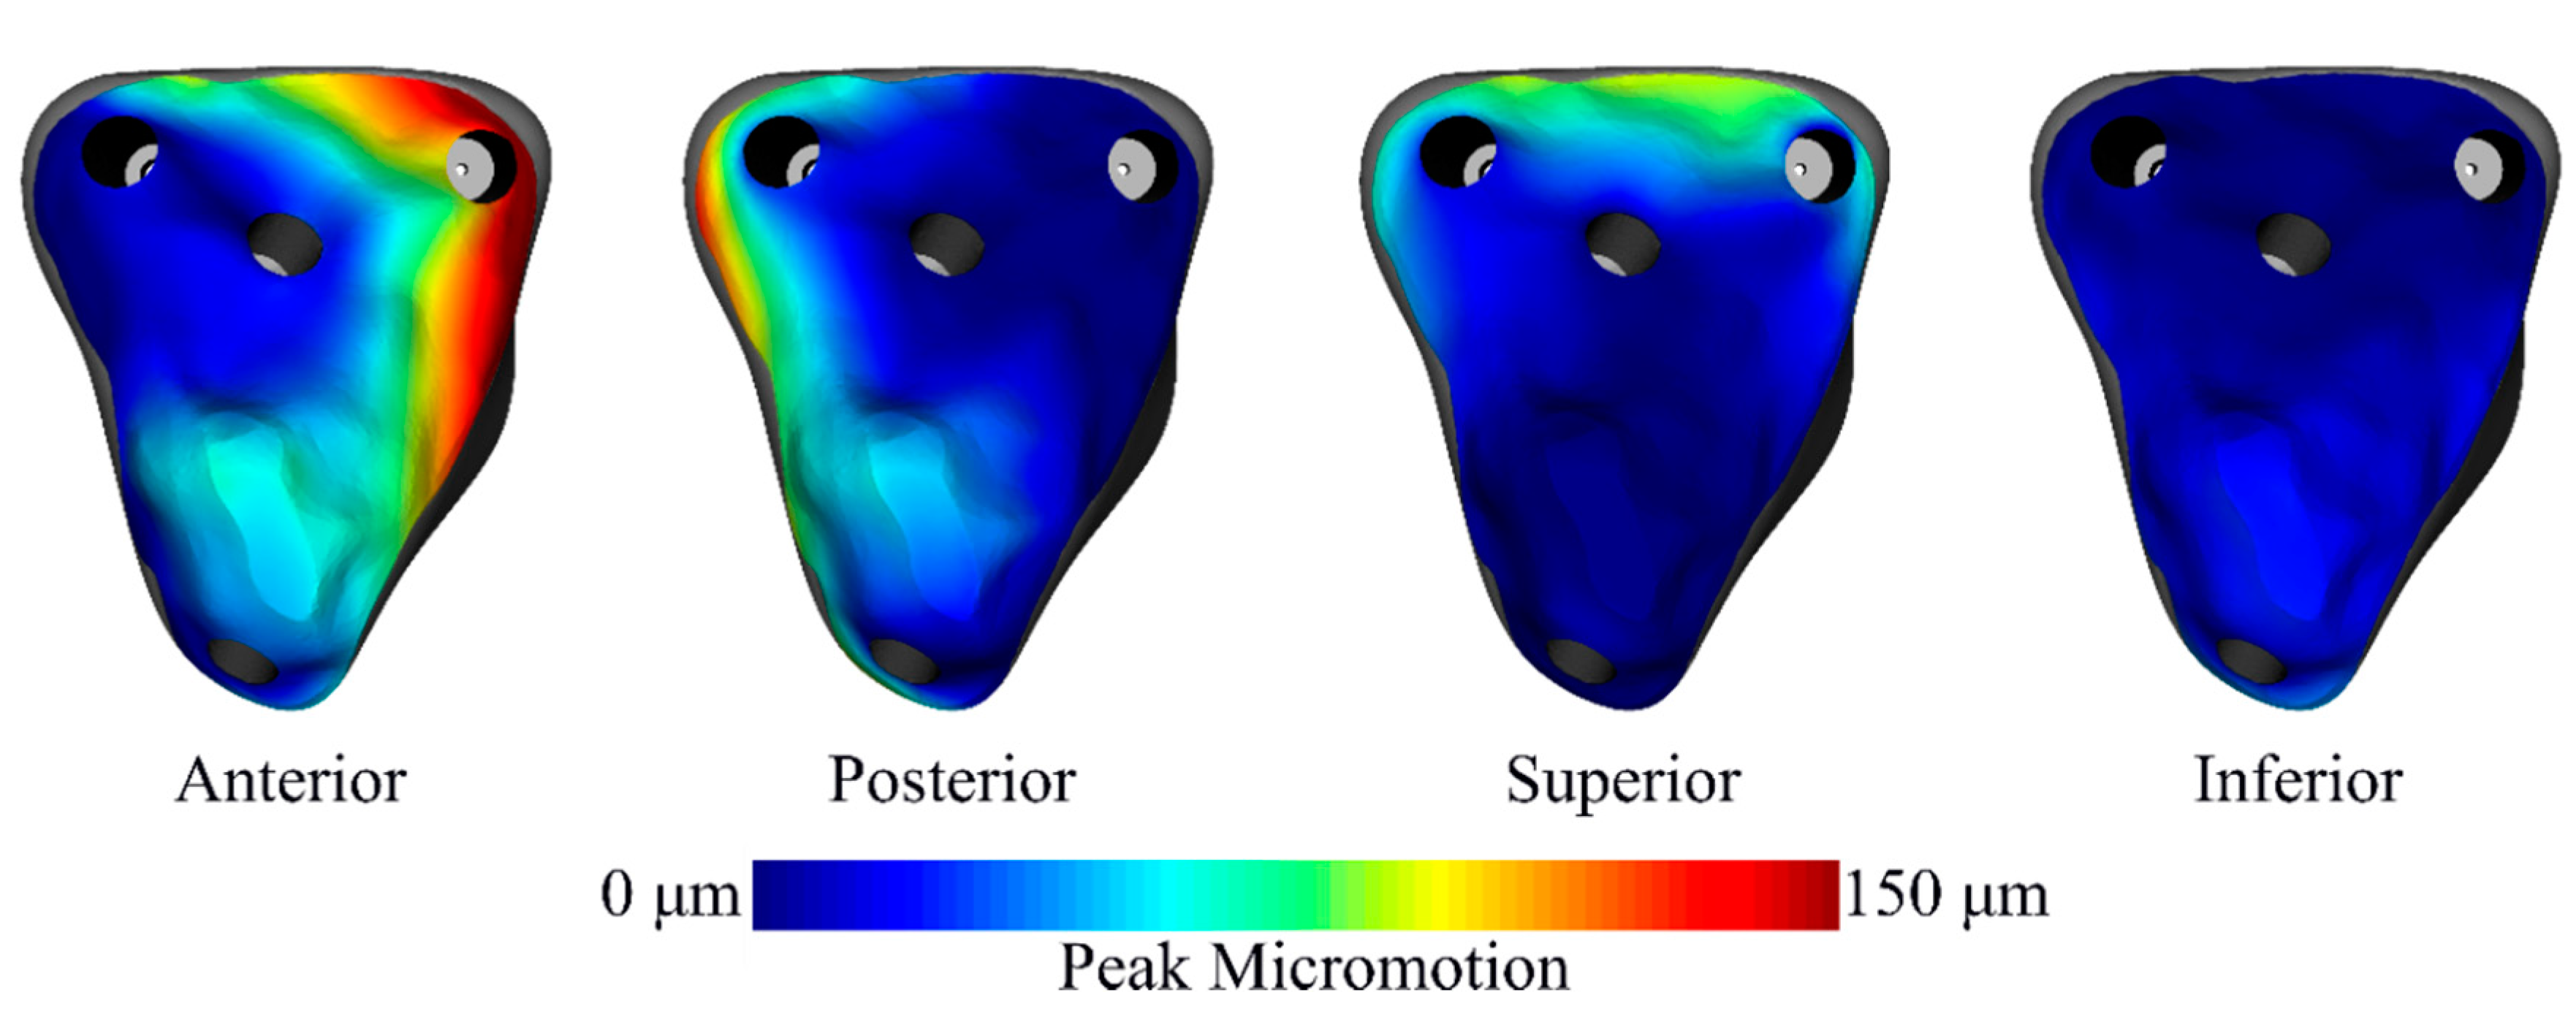
where t ^ and n ^ respectively represent the unit vector of the directions along which shear and axial load were applied. The total relative micromotion between glenoid baseplate and bone, is further referred to as peak micromotion [33] and was visualized as a color map on the back of the prosthesis.
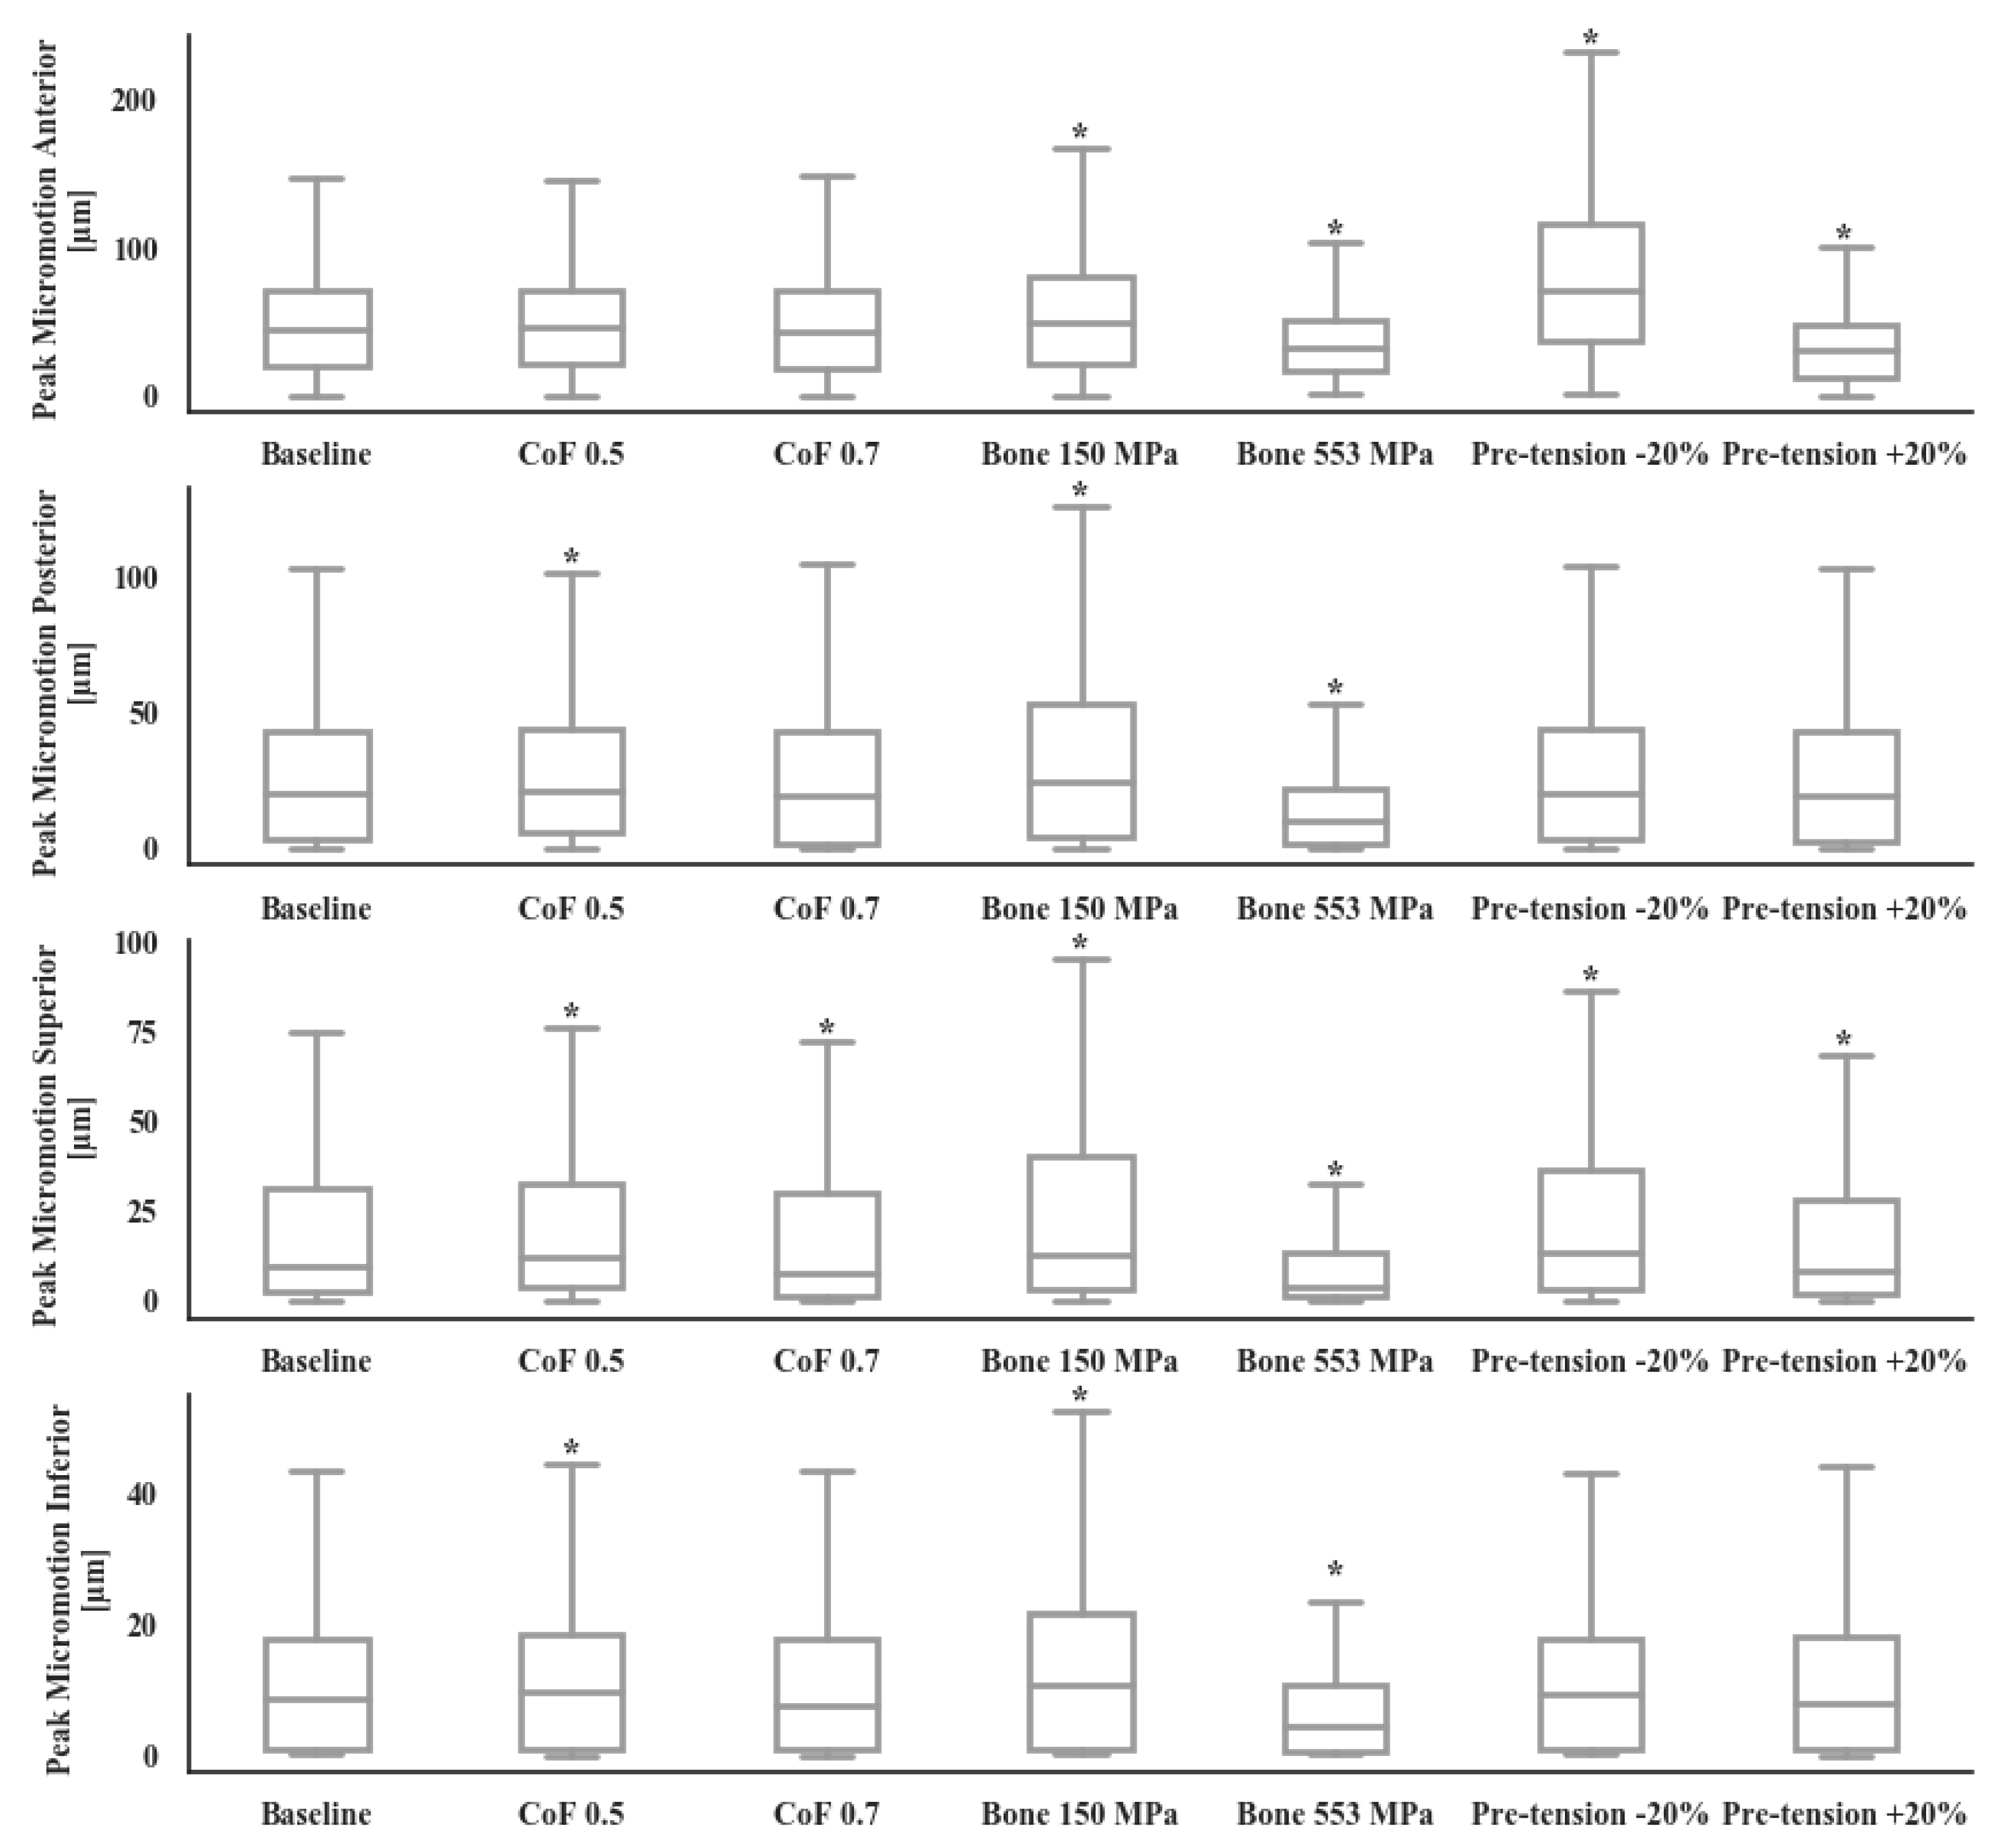
To evaluate the impact of changes in the model parameters on the FE output interface micromotion, a sensitivity analysis was performed. In particular, changes in the bone substitute material properties, the friction coefficient and the screw preload were investigated. A summary of these numerical tests is presented in Table 1. Each parameter was modified independently, for a total of 24 simulations (six for each loading condition).
For the stiffness of the bone surrogate, the Young’s modulus was modified to mimic the properties of 15 pcf (osteoporotic bone) and 30 pcf foam blocks, corresponding to 150 MPa and 553 MPa respectively [16,26].
The Coulomb’s coefficient was adapted to simulate local changes at the bone–implant interface by imposing values of 0.5 and 0.7, which are representative of the friction ranges found in literature.
Finally, a change in the preload of the compression screws was applied, modifying by ±20% the baseline pretension value.
A paired t-test was used to compare the peak micromotion of the baseline model with each sensitivity model, with a significance level set to 0.01, following a Bonferroni correction of the alpha value (α = 0.05, n = 6: α/n ≈ 0.01).

3. Results

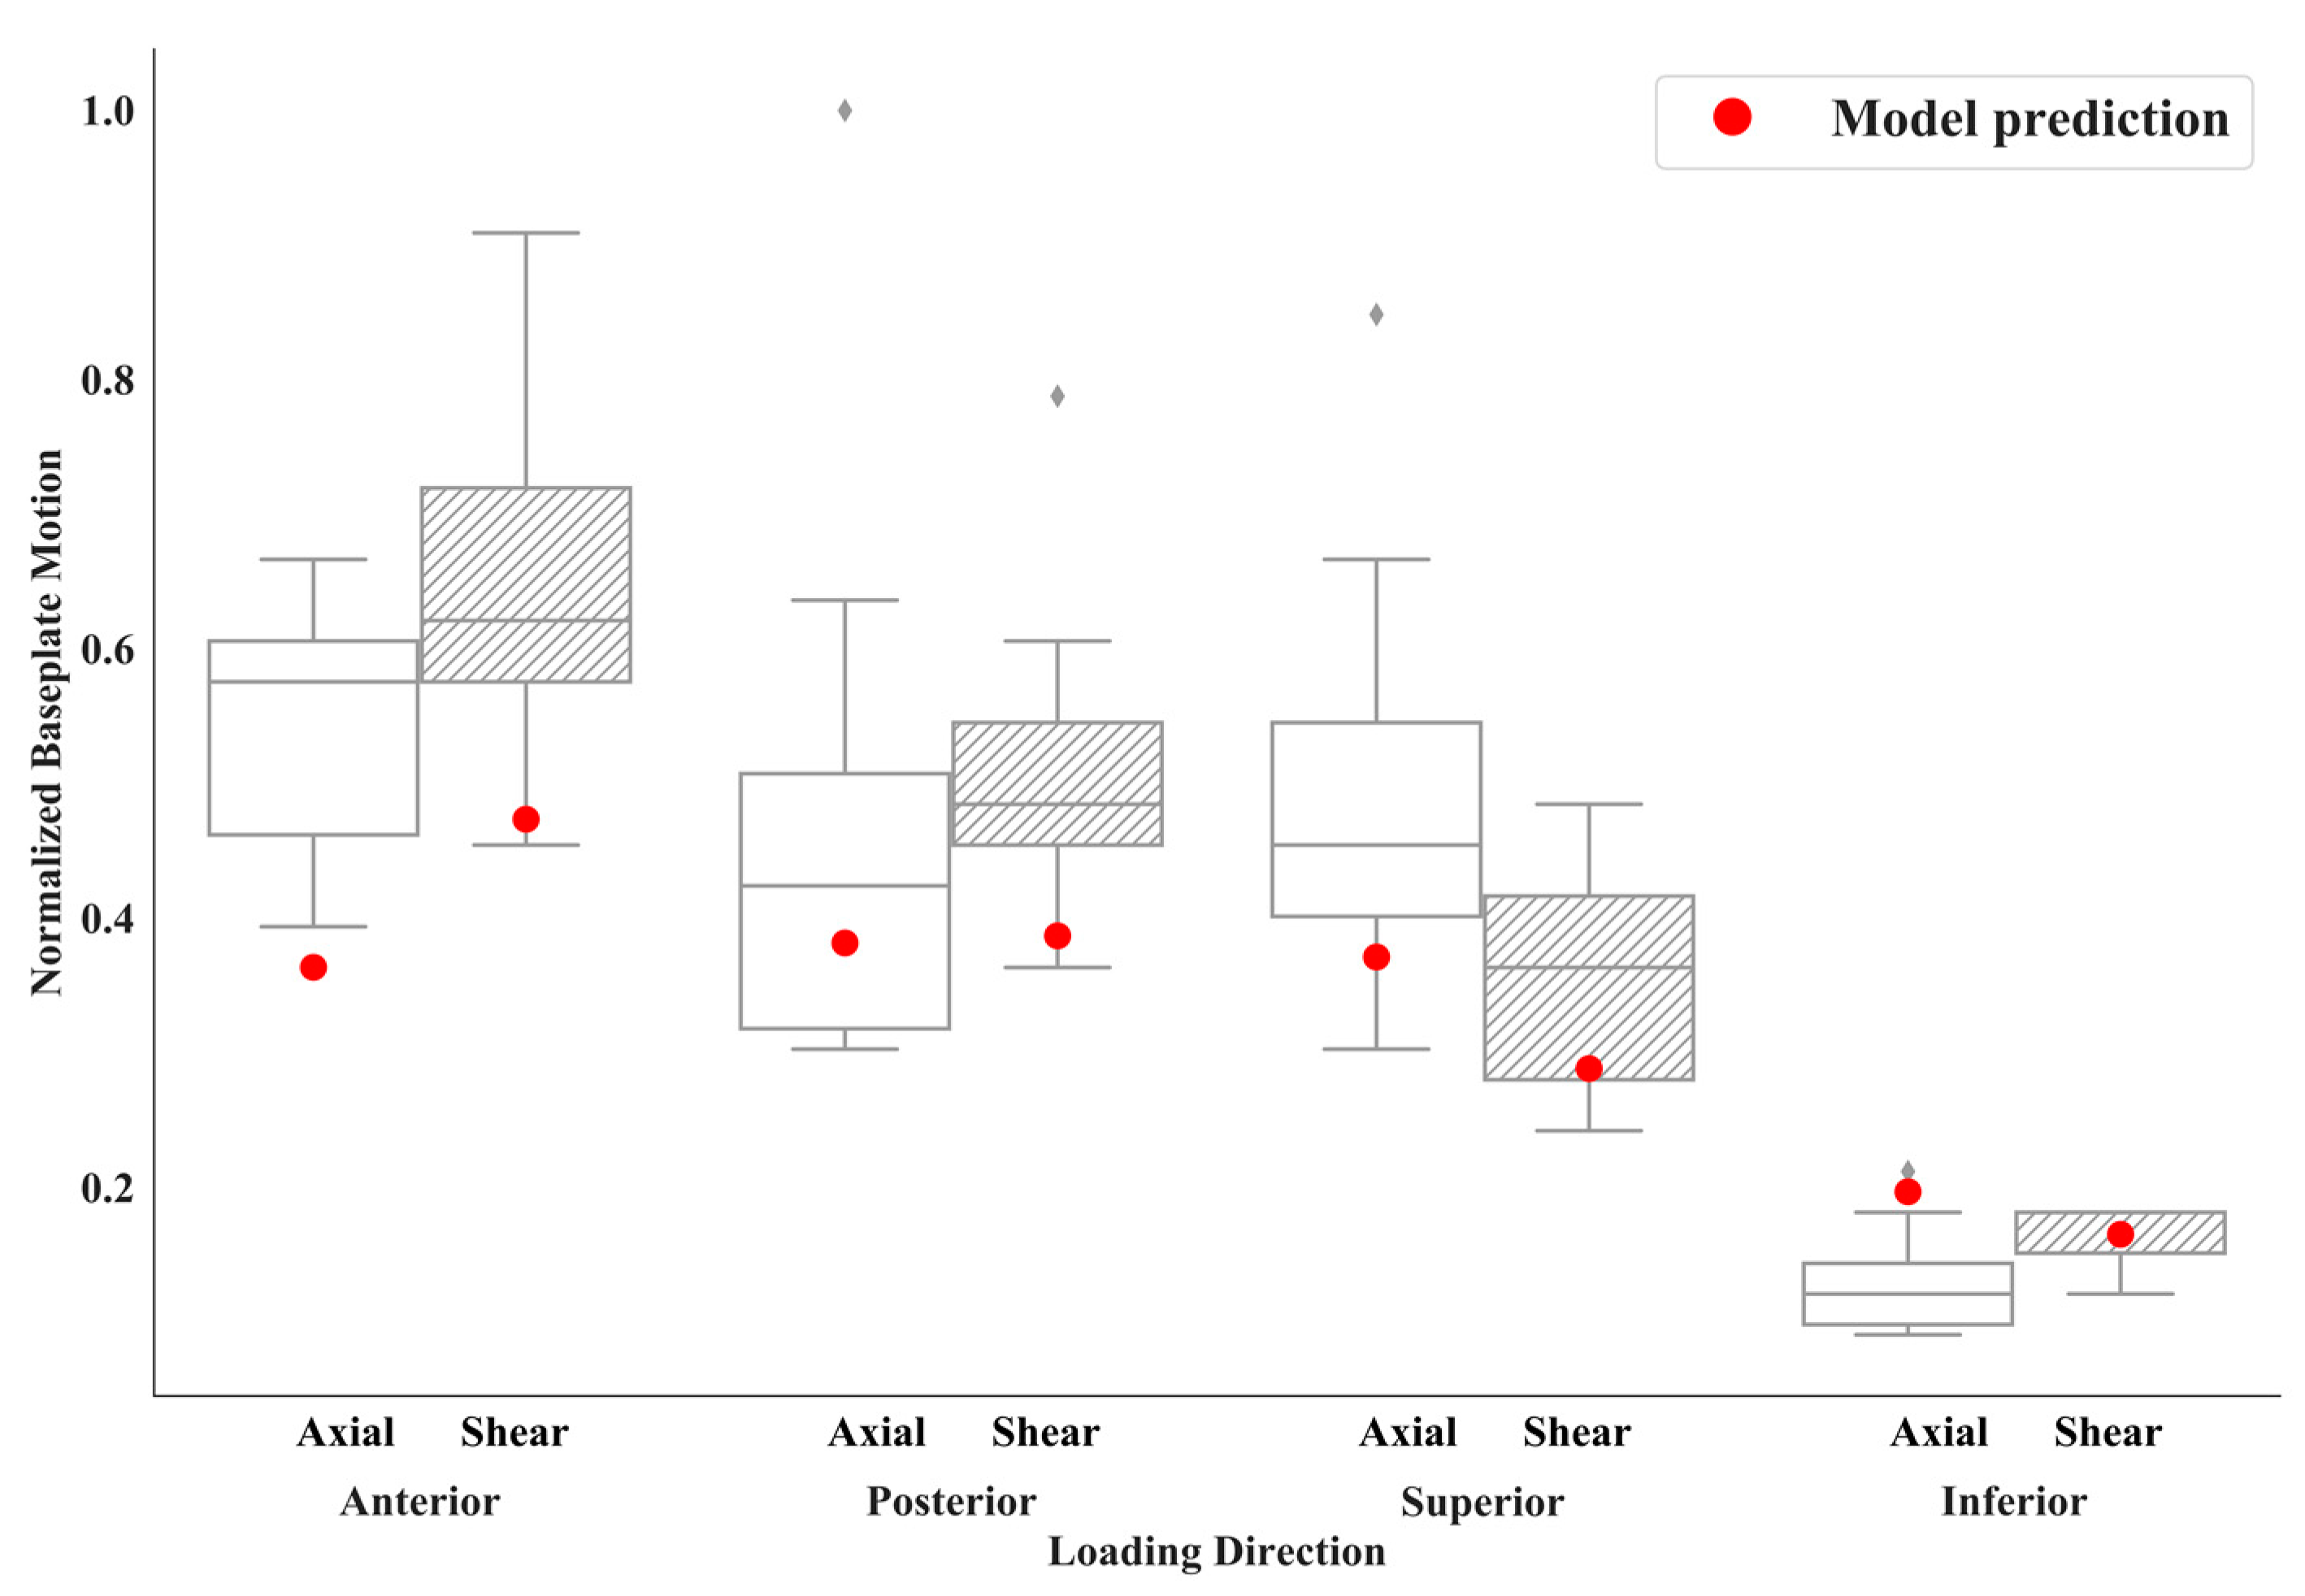
FE results for the baseplate displacement were within the variability of the experimental measurements for all loading directions (Figure 4). The smallest displacements were found when the shear load was applied inferiorly to the baseplate. The Spearman’s rank order test revealed a statistically significant (p < 0.05) high correlation (ρs = 0.81) between the experimental results and FE results.
The maximum interface micromotion was found for the anterior shear load (Figure 5). For all the loading directions, the median peak micromotion was lower than 50 µm. A 95th percentile of 141 µm, 80 µm, 73 µm and 25 µm was reported for the anterior, posterior, superior and inferior loading respectively. When looking at the axial and shear components, the median shear micromotion was always higher than the axial. For none of the loading directions, micromotion above 150 µm was reported (Figure 6).
The sensitivity of the model to input parameters showed a peak micromotion for the baseline model which was significantly different (p < 0.01) when compared to the model with reduced and increased elastic moduli of bone substitute, for all the loading directions (Figure 7). For the anterior loading, which reported the highest micromotion values, significant differences were also found between the baseline model and the one with reduced/increased compression screws pretension.

4. Discussion

In this study, an automated workflow to evaluate the preclinical stability of a shoulder implant through FE simulations was presented and validated. To our knowledge, this is the first work to report a full in silico modeling of ASTM F2028-14 for a custom-made prosthesis. Although previous studies [13,14,22] reported FE analysis for a similar experimental set-up, the effect of different loading directions, which in case of a custom implant cannot be neglected due to the asymmetry of the design shape, was never systematically investigated. This approach resulted in a total of eight measurements that were used to support the FE predictions.
The results of the mechanical test showed an influence of the loading direction on the implant stability. In particular, the presented design reported the lowest displacements when the shear load was applied inferiorly to the glenosphere. This is mainly due to the presence of two screws, one locking and one compression, in the superior part of the baseplate, which are almost perpendicular to the direction of the inferior load and opposite to its application point. Instead, the highest displacements were measured for the anterior loading directions, due to the absence of a good screw fixation at the anterior side. These results further corroborate the idea that each new implant should be tested in those different conditions.
All the experimental measurements showed a high variability. Although one unique design was tested with six samples, this variability is likely to reflect the variations that occurred during the production of the implants and the assembly of the different components. The 3D printed technique used for fabrication could introduce inaccuracies, especially in the porous structure, which influenced the mechanical measurements. Similarly, the bone substitute blocks were artificially carved to match the nonflat baseplate surface, possibly causing additional variation.
Direct comparison of the experimental outcomes with previous studies is not possible due to major methodological divergences. Higher mechanical loads were used to test standard implants (750 N both in axial and shear) and only the shear displacement was measured when the load was applied superiorly [12,13,15]. Under this configuration, the presented work reported slightly higher shear values (Figure 4, inferior direction), meaning that the effect of a smaller applied load was compensated by the use of a custom implant with nonstandard design (e.g., nonflat contact surface, asymmetry of the shape).
The good agreement between experimental and FE-predicted micromotions was confirmed by a Spearman’s rank test, resulting in a correlation coefficient of 0.81 (high), which is lower than the one reported by Virani et al. (0.96, [13]). The lower correlation coefficient can be explained by the use of a custom design, which leads to additional complexity in the simulation. Similar to Virani et al. [13] overstiffening of the model was observed, which, in the context of this study, can be partially explained by the use of linear tetrahedral elements in the meshing process, a choice justified by the need of low computational cost.
One limit of the standard mechanical test presented here is related to the lack of micromotion measurements at the bone–implant surface. In contrast, FE modeling can provide a valuable insight on the interface behavior, although their accuracy cannot be directly evaluated against experimental outputs. As previously described, micromotion above 150 µm can jeopardize bone ingrowth and lead to an unstable fixation [9]. Design engineering should take into account this aspect when looking for possible design adaptations. For this reason, interface micromotion was estimated through the FE model. When evaluating the two separated components, higher median values were reported for the shear component. These results are in accordance with previous studies indicating that micromotion of reverse implants occurs mainly in shear [34]. For none of the loading directions peak micromotion was found to be higher than 150 µm, suggesting that the implant design does not jeopardize bone ingrowth. Additionally, the highest values were calculated at the edge of the interface, where osseointegration is less likely to happen.
The interface micromotions predicted by the FE model were sensitive to changes in some of the input parameters: the FE model was sensitive under all the loading directions to a change in bone quality (150 MPa and 553 MPa), similarly to what has been reported in the literature [14]. Moreover, this study corroborates the idea that the impact of an adequate modeling of the compression screws cannot be neglected [29]. A change in the screw pretension can lead to very different micromotion, thus suggesting that pretension should always be included in the simulation and its value estimated or derived through experimental measurements.
The generalizability of these results is subject to certain limitations which need to be addressed. Major assumptions were made during the creation of the in-silico model, looking for a trade-off between accuracy and computational cost. The bone substitutes were modeled with homogeneous isotropic material properties, a simplification commonly accepted and implemented in the literature [13,14,16,22], although not fully representative of the behavior of the bone substitute. The porous structure of the implant was not explicitly modelled to reduce the complexity of the model. As an alternative, a lower elastic modulus was used for the corresponding elements. While this assumption impacts the frictional behavior at the interface, the sensitivity showed that a change in this parameter did not substantially influence the micromotion estimations (at least in the configurations where highest values were reported).
While 150 µm is the ASTM accepted threshold to promote osseointegration [20], its application has been challenged in the literature. Other studies [15,35] referred to lower values (20 µm–50 µm) during the evaluation of interface micromotion. When lowering the threshold, the presented model would still predict bone ingrowth in the inner region of the prosthesis, however these results should be interpreted carefully and always considering the simplifications of the study.
The automated workflow was built to replicate only the static analysis described in the ASTM standard and additional efforts should be made to include the dynamic loading, which are probably not compatible with the requirement of a low computational workflow. However, it can be assumed that minimizing the initial static displacement with an optimized design, will also lead to better fatigue outcome.
Validation of the model was obtained only for a single design and under a relatively limited degree of freedom. It is believed that a more complete experimental set of tests is necessary, at least to assess the impact of additional design changes (e.g., number and type of screws) and to ensure the validity of the assumptions made. To further strengthen the predictive power of the simulation, alternative micromotion metrics would be necessary since the current mechanical set-up fails to provide a direct measure of the full-field interface micromotion [29,35].
In summary, the automated workflow presented in this study was able to replicate the mechanical condition of a standard test for a patient-specific shoulder implant. The finite element analysis can potentially support the engineers during the design phase, by virtually comparing different implants. Moreover, the minimization of the interface micromotion would lead to an improved initial stability and hence to a better clinical outcome, by allowing for secondary fixation through bone ingrowth and reducing the risk of revision surgery due to mechanical loosening. Finally, the presented tool could be used to define which configurations need to be tested when looking for worst case scenarios, thus reducing the amount of required mechanical experiments.

Author Contributions

Conceptualization, J.P.; methodology, J.P., M.W., G.H.v.L., M.A.P.; software, J.P.; writing—original draft preparation, J.P.; writing—review and editing, J.P., M.W., G.H.v.L., M.A.P.; supervision, G.H.v.L., M.A.P.; project administration, M.W., M.A.P. All authors have read and agreed to the published version of the manuscript.

Funding

This project has received funding from the European Union’s Horizon 2020 Research and Innovative program under the Marie Skłodowska-Curie grant agreement No 722535.

Conflicts of Interest

The authors declare no conflict of interest. The funders had no role in the design of the study; in the collection, analyses, or interpretation of data; in the writing of the manuscript, or in the decision to publish the results.

References

  1. Walker, M.; Brooks, J.; Willis, M.; Frankle, M. How Reverse Shoulder Arthroplasty Works. Clin. Orthop. Relat. Res. 2011, 469, 2440–2451. [Google Scholar] [CrossRef] [PubMed] [Green Version]
  2. Jarrett, C.D.; Brown, B.T.; Schmidt, C.C. Reverse Shoulder Arthroplasty. Orthop. Clin. N. Am. 2013, 44, 389–408. [Google Scholar] [CrossRef] [PubMed]
  3. Williams, G.R.; Iannotti, J.P. Options for glenoid bone loss: Composites of prosthetics and biologics. J. Shoulder Elb. Surg. 2007, 16, S267–S272. [Google Scholar] [CrossRef] [PubMed]
  4. Hoffelner, T.; Moroder, P.; Auffarth, A.; Tauber, M.; Resch, H. Outcomes after shoulder arthroplasty revision with glenoid reconstruction and bone grafting. Int. Orthop. 2014, 38, 775–782. [Google Scholar] [CrossRef] [PubMed] [Green Version]
  5. Rodríguez, J.A.; Entezari, V.; Iannotti, J.P.; Ricchetti, E.T. Pre-operative planning for reverse shoulder replacement: The surgical benefits and their clinical translation. Ann Jt. 2019, 4, 4. [Google Scholar] [CrossRef]
  6. Chammaa, R.; Uri, O.; Lambert, S. Primary shoulder arthroplasty using a custom-made hip-inspired implant for the treatment of advanced glenohumeral arthritis in the presence of severe glenoid bone loss. J. Shoulder Elb. Surg. 2017, 26, 101–107. [Google Scholar] [CrossRef]
  7. Stoffelen, D.V.C.; Eraly, K.; Debeer, P. The use of 3D printing technology in reconstruction of a severe glenoid defect: A case report with 2.5 years of follow-up. J. Shoulder Elb. Surg. 2015, 24, e218–e222. [Google Scholar] [CrossRef]
  8. Dines, D.M.; Gulotta, L.; Craig, E.V.; Dines, J.S. Novel Solution for Massive Glenoid Defects in Shoulder Arthroplasty: A Patient-Specific Glenoid Vault Reconstruction System. Am. J. Orthop. 2017, 46, 104–108. [Google Scholar]
  9. Jasty, M.; Bragdon, C.; Burke, D.; O’Connor, D.; Lowenstein, J.; Harris, W.H. In Vivo Skeletal Responses to Porous-Surfaced Implants Subjected to Small Induced Motions. J. Bone Jt. Surg. 1997, 79, 707–714. [Google Scholar] [CrossRef]
  10. Stroud, N.; DiPaola, M.J.; Flurin, P.-H.; Roche, C.P. Reverse shoulder glenoid loosening: An evaluation of the initial fixation associated with six different reverse shoulder designs. Bull. Hosp. Jt. Dis. 2013, 71 (Suppl. S2), S12–S17. [Google Scholar]
  11. Formaini, N.T.; Everding, N.G.; Levy, J.C.; Santoni, B.G.; Nayak, A.N.; Wilson, C. Glenoid baseplate fixation using hybrid configurations of locked and unlocked peripheral screws. J. Orthop. Traumatol. 2017, 18, 221–228. [Google Scholar] [CrossRef] [PubMed] [Green Version]
  12. Harman, M.; Frankle, M.; Vasey, M.; Banks, S. Initial glenoid component fixation in “reverse” total shoulder arthroplasty: A biomechanical evaluation. J. Shoulder Elb. Surg. 2005, 14, S162–S167. [Google Scholar] [CrossRef]
  13. Virani, N.A.; Harman, M.; Li, K.; Levy, J.; Pupello, D.R.; Frankle, M.A. In vitro and finite element analysis of glenoid bone/baseplate interaction in the reverse shoulder design. J. Shoulder Elb. Surg. 2008, 17, 509–521. [Google Scholar] [CrossRef] [PubMed]
  14. Suarez, D.R.; Valstar, E.R.; Rozing, P.M.; van Keulen, F. Fracture risk and initial fixation of a cementless glenoid implant: The effect of numbers and types of screws. Proc. Inst. Mech. Eng. Part H 2013, 227, 1058–1066. [Google Scholar] [CrossRef] [PubMed]
  15. Hopkins, A.R.; Hansen, U.N.; Bull, A.M.J.; Emery, R.; Amis, A.A. Fixation of the reversed shoulder prosthesis. J. Shoulder Elb. Surg. 2008, 17, 974–980. [Google Scholar] [CrossRef]
  16. Denard, P.J.; Lederman, E.; Parsons, B.O.; Romeo, A.A. Finite element analysis of glenoid-sided lateralization in reverse shoulder arthroplasty: Lateralization in RSA. J. Orthop. Res. 2017, 35, 1548–1555. [Google Scholar] [CrossRef]
  17. Chae, S.-W.; Lee, H.; Kim, S.M.; Lee, J.; Han, S.-H.; Kim, S.-Y. Primary stability of inferior tilt fixation of the glenoid component in reverse total shoulder arthroplasty: A finite element study. J. Orthop. Res. 2016, 34, 1061–1068. [Google Scholar] [CrossRef] [Green Version]
  18. Suárez, D.R.; van der Linden, J.C.; Valstar, E.R.; Broomans, P.; Poort, G.; Rozing, P.M.; van Keulen, F. Influence of the positioning of a cementless glenoid prosthesis on its interface micromotions. Proc. Inst. Mech. Eng. Part H 2009, 223, 795–804. [Google Scholar] [CrossRef]
  19. Elwell, J.; Choi, J.; Willing, R. Quantifying the competing relationship between adduction range of motion and baseplate micromotion with lateralization of reverse total shoulder arthroplasty. J. Biomech. 2017, 52, 24–30. [Google Scholar] [CrossRef] [Green Version]
  20. F04 Committee. Standard Test Methods for Dynamic Evaluation of Glenoid Loosening or Disassociation; ASTM International: West Conshohocken, PA, USA, 2014. [Google Scholar]
  21. Lehtinen, J.T.; Tingart, M.J.; Apreleva, M.; Warner, J.J.P. Total, trabecular, and cortical bone mineral density in different regions of the glenoid. J. Shoulder Elb. Surg. 2004, 13, 344–348. [Google Scholar] [CrossRef]
  22. Dharia, M.A.; Bischoff, J.E.; Schneider, D. Impact of Modeling Assumptions on Stability Predictions in Reverse Total Shoulder Arthroplasty. Front. Physiol. 2018, 9, 1116. [Google Scholar] [CrossRef] [PubMed]
  23. Boampong, D.K.; Green, S.M.; Unsworth, A. N+ ion Implantation of Ti6Al4V Alloy and UHMWPE for total Joint Replacement Application. J. Appl. Biomater. Biomech. 2003, 1, 164–171. [Google Scholar] [CrossRef]
  24. Barui, S.; Chatterjee, S.; Mandal, S.; Kumar, A.; Basu, B. Microstructure and compression properties of 3D powder printed Ti-6Al-4V scaffolds with designed porosity: Experimental and computational analysis. Mater. Sci. Eng. C 2017, 70, 812–823. [Google Scholar] [CrossRef]
  25. ASTM. Standard Specification for Cast Cobalt-Chromium-Molybdenum Alloy for Surgical Implant Applications; ASTM International: West Conshohocken, PA, USA, 1997; pp. 4–5. [Google Scholar]
  26. F04 Committee. Standard Practice for Finite Element Analysis (FEA) of Non-Modular Metallic Orthopaedic Hip Femoral Stems; ASTM International: West Conshohocken, PA, USA, 2013. [Google Scholar]
  27. Zhang, Y.; Ahn, P.B.; Fitzpatrick, D.C.; Heiner, A.D.; Poggie, R.A.; Brown, T.D. Interfacial Frictional Behavior: Cancellous Bone, Cortical Bone, And a Novel Porous Tantalum Biomaterial. J. Musculoskelet. Res. 1999, 3, 245–251. [Google Scholar] [CrossRef]
  28. Wieding, J.; Souffrant, R.; Fritsche, A.; Mittelmeier, W.; Bader, R. Finite Element Analysis of Osteosynthesis Screw Fixation in the Bone Stock: An Appropriate Method for Automatic Screw Modelling. PLoS ONE 2012, 7, e33776. [Google Scholar] [CrossRef] [PubMed]
  29. Dharia, M.; Mani, S. Impact of screw preload on primary stability in reverse shoulder arthroplasty. Orthop. Proc. 2019, 101, 48. [Google Scholar] [CrossRef]
  30. Pitocchi, J.; Wirix-Speetjens, R.; van Lenthe, G.H.; Pérez, M.A. Measuring tightening torque and force of non-locking screws for reverse shoulder prosthesis. Orthop. Proc. 2020, 102, 75. [Google Scholar] [CrossRef]
  31. Abaqus 6.14 Documentation. Available online: http://ivt-abaqusdoc.ivt.ntnu.no:2080/texis/search/?query=wetting&submit.x=0&submit.y=0&group=bk&CDB=v6.14 (accessed on 16 June 2020).
  32. Mukaka, M. A guide to appropriate use of Correlation coefficient in medical research. Malawi Med. J. 2012, 24, 69–71. [Google Scholar]
  33. Favre, P.; Henderson, A.D. Prediction of stemless humeral implant micromotion during upper limb activities. Clin. Biomech. 2016, 36, 46–51. [Google Scholar] [CrossRef]
  34. Hoenig, M.P.; Loeffler, B.; Brown, S.; Peindl, R.; Fleischli, J.; Connor, P.; D’Alessandro, D. Reverse glenoid component fixation: Is a posterior screw necessary? J. Shoulder Elb. Surg. 2010, 19, 544–549. [Google Scholar] [CrossRef]
  35. Favre, P.; Perala, S.; Vogel, P.; Fucentese, S.F.; Goff, J.R.; Gerber, C.; Snedeker, J.G. In vitro assessments of reverse glenoid stability using displacement gages are misleading—Recommendations for accurate measurements of interface micromotion. Clin. Biomech. 2011, 26, 917–922. [Google Scholar] [CrossRef] [PubMed] [Green Version]
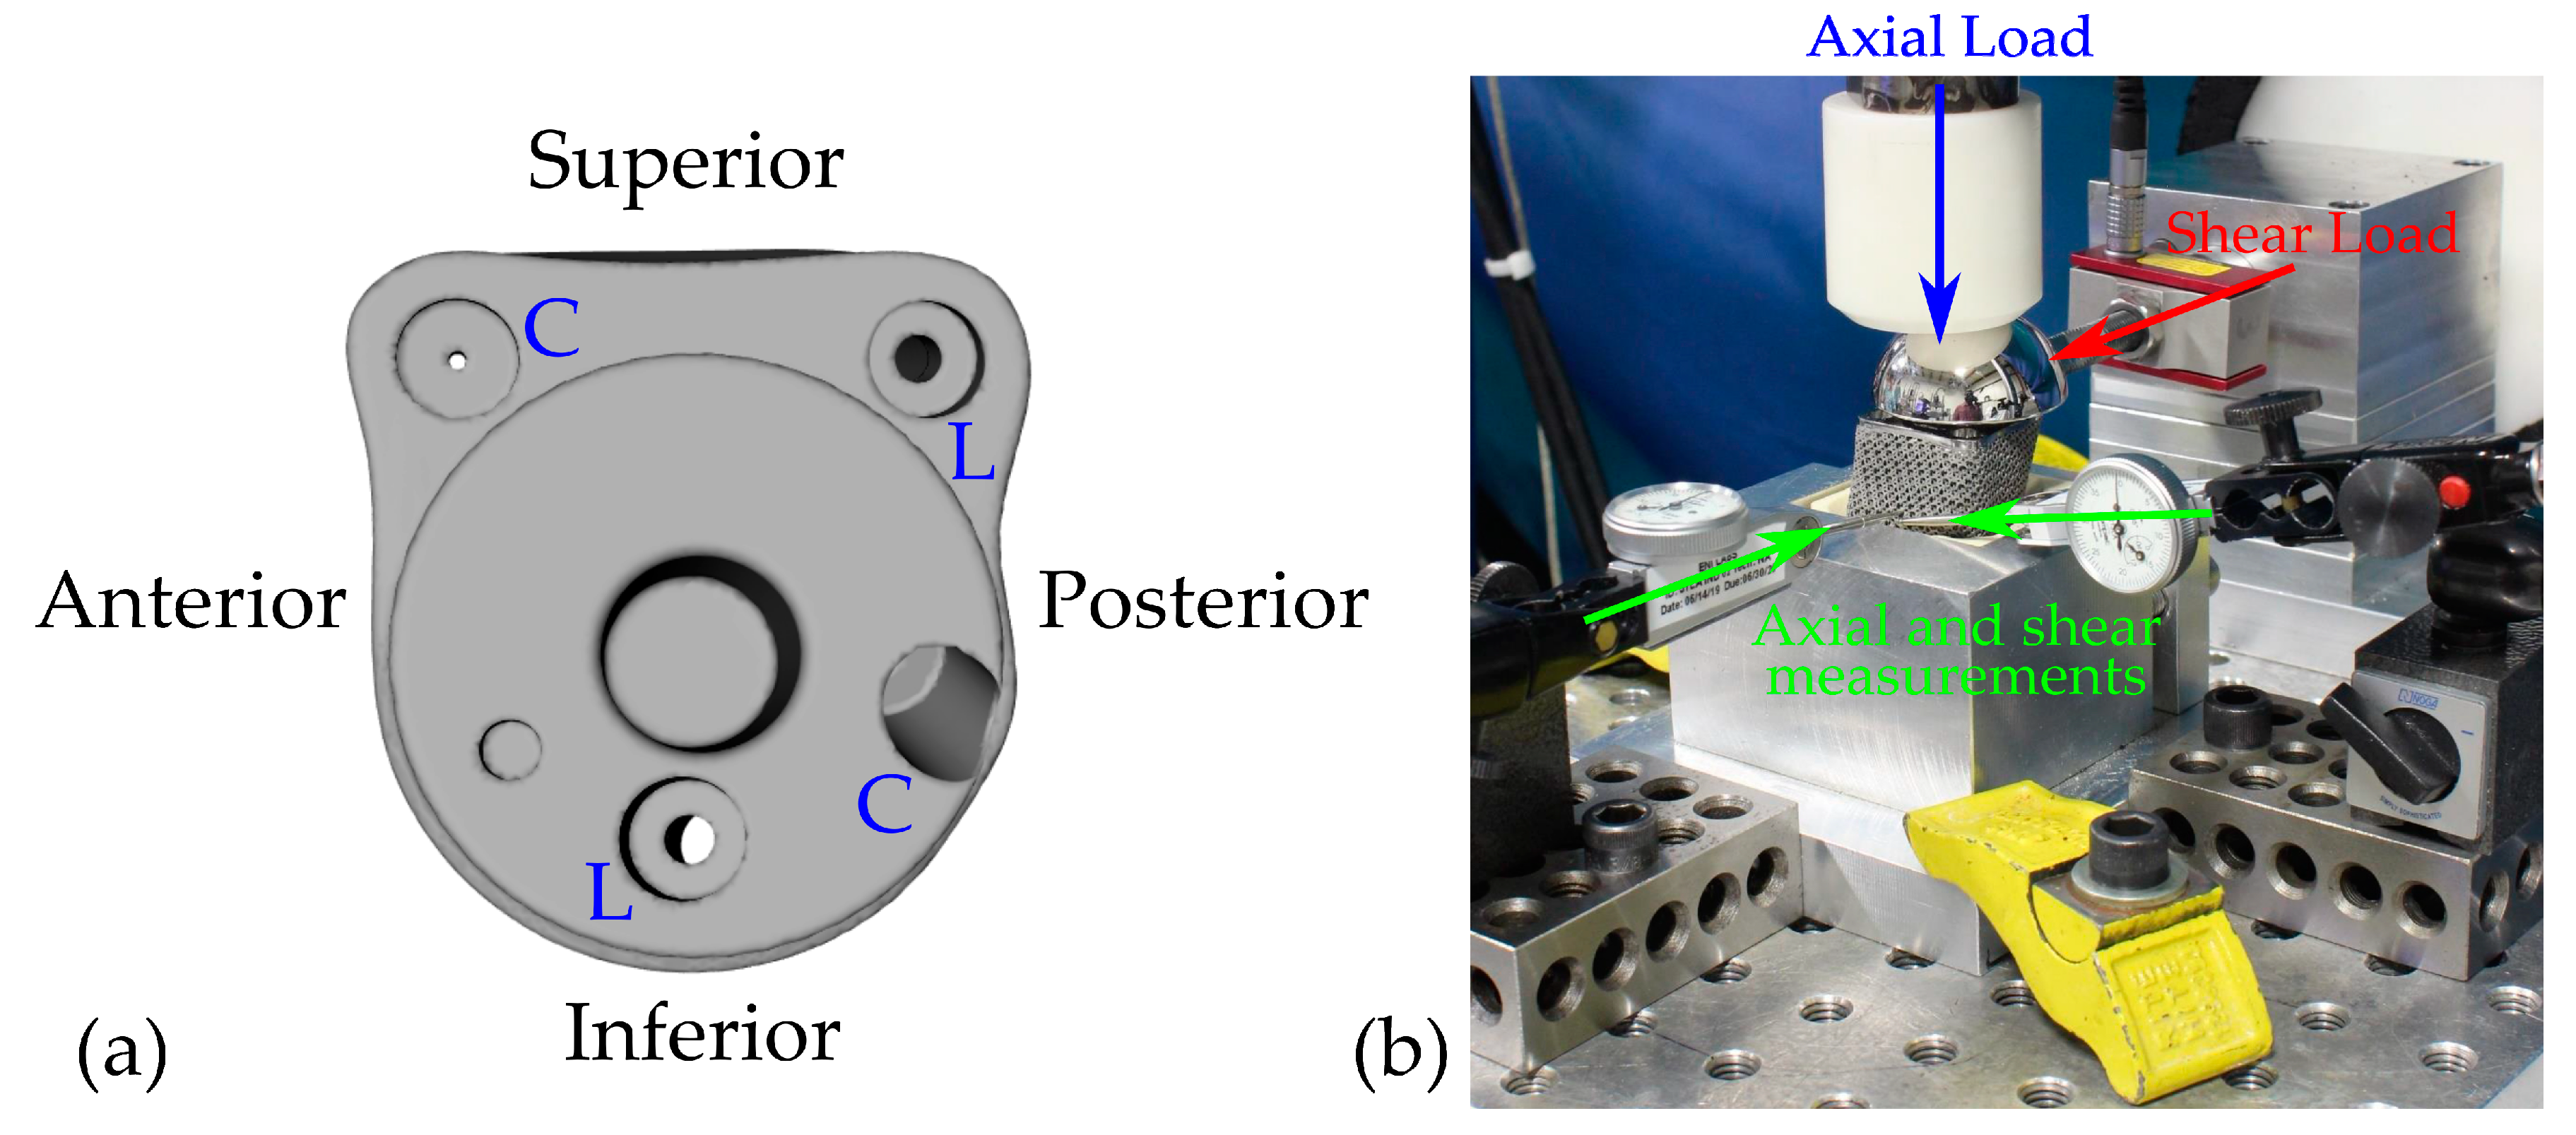
Figure 1. Left (a), top view of the custom implant with the four main directions: anterior, posterior, superior and inferior. Four screws were used to fix the implant: two locking (L) and two nonlocking (compression, C). Right (b), experimental set-up with a shear load (red arrow) applied inferiorly via a horizontal loading fixture. Axial load was applied through the glenosphere (blue arrow). Axial and shear components of the baseplate displacement were measured superiorly with two dial indicators (green arrows).
Mathematics 08 01113 g001
Figure 2. Left (a), isometric view of the finite element (FE) model with a shear load applied inferiorly. In blue the patch defined for the application of the axial load, in red the shear load patch. Right (b), superior view of the FE model. In green the measurement patch defined to calculate the baseplate displacement.
Mathematics 08 01113 g002
Figure 3. Left (a), top view of the model and the four screws. In blue the connectors between screw head and implant. Right (b), detail of one screw (implant transparent). Right (c), the generated screw model.
Mathematics 08 01113 g003
Figure 4. Baseplate displacement measured experimentally (boxplot) and determined from the model (red dots). For the FE analysis, predicted values were calculated as the average of the displacements for the nodes lying in the measurement patch, as defined in Section 2.2.3. Data were normalized to the largest micromotion measured in any of the tests. For each of the four main implant directions, both axial and shear displacements were measured. Gray points represent outliers in the measurements.
Mathematics 08 01113 g004
Figure 5. Interface micromotion. Shear and axial components of the total micromotion (peak) was evaluated for all the loading directions. The red dashed line represents the 150 µm threshold.
Mathematics 08 01113 g005
Figure 6. Back view of the implant. Peak micromotion map at the bone–implant interface for all the loading directions.
Mathematics 08 01113 g006
Figure 7. Change of the interface peak micromotion due to modification of different model parameters: bone Young’s modulus (150 and 553 MPa), coefficient of friction (CoF = 0.5 and 0.7) and screw pretension (load ±20%). *: paired t-test, p < 0.01.
Mathematics 08 01113 g007
Table 1. Parameter variation for the sensitivity analysis.
ParameterBaseline ValueSensitivity Values
Elastic Modulus Bone200 MPa150 MPa, 553 MPa
Coefficient of Friction (CoF)0.60.5, 0.7
Screw pre-load 260 N, 300 N±20%