Abstract
The one dimensional discrete scan statistic is considered over sequences of random variables generated by block factor dependence models. Viewed as a maximum of an 1-dependent stationary sequence, the scan statistics distribution is approximated with accuracy and sharp bounds are provided. The longest increasing run statistics is related to the scan statistics and its distribution is studied. The moving average process is a particular case of block factor and the distribution of the associated scan statistics is approximated. Numerical results are presented.
1. Introduction
There are many situations when an investigator observes an accumulation of events of interest and wants to decide if such a realisation is due to hazard or not. These types of problems belong to the class of cluster detection problems, where the basic idea is to identify regions that are unexpected or anomalous with respect to the distribution of events. Depending on the application domain, these anomalous agglomeration of events can correspond to a diversity of phenomena—for example one may want to find clusters of stars, deposits of precious metals, outbreaks of disease, minefield detections, defectuous batches of pieces and many other possibilities. If such an observed accumulation of events exceeds a preassigned threshold, usually determined from a specified significance level corresponding to a normal situation (the null hypothesis), then it is legitimate to say that we have an unexpected cluster and proper measures has to be taken accordingly.
Searching for unusual clusters of events is of great importance in many scientific and technological fields, including DNA sequence analysis ([1,2]), brain imaging ([3]), target detection in sensors networks ([4,5]), astronomy ([6,7]), reliability theory and quality control ([8]) among many other domains. One of the tools used by practitioners to decide on the unusualness of such agglomeration of events is the scan statistics. Basically, the tests based on scan statistics are looking for events that are clustered amongst a background of those that are sporadic.
Let be two positive integers and be a sequence of independent and identically distributed random variables with the common distribution . The one dimensional discrete scan statistics is defined as
where the random variables are the moving sums of length m given by
Usually, the statistical tests based on the one dimensional discrete scan statistics are employed when one wants to detect a local change in the signal within a sequence of T observations via testing the null hypothesis of uniformity, , against a cluster alternative, (see References [9,10]). Under , the random observations are i.i.d. distributed as , while under the alternative hypothesis, there exists a location where , , are distributed according to and outside this region are distributed as .
We observe that whenever exceeds the threshold , where the value of is computed based on the relation and is a preassigned significance level of the testing procedure, the generalized likelihood ratio test rejects the null hypothesis in the favor of the clustering alternative (see Reference [9]). It is interesting to note that most of the research has been done for being binomial, Poisson or normal distribution (see References [9,10,11,12,13]). More recently, Reference [14] proposed a testing procedure based on one-dimensional scan statistic for geometric and negative binomial distributions.
There are three main approaches used for investigating the exact distribution of the one dimensional discrete scan statistics—the combinatorial methods ([12,15]), the Markov chain imbedding technique ([16,17]) and the conditional probability generating function method ([18,19]). Due to the high complexity and the limited range of application of the exact formulas, a considerable number of approximations and bounds have been developed for the estimation of the distribution of the one dimensional discrete scan statistics, for example, References [9,12,13,20]. A full treatment of these results is presented in References [10,11].
Even if in general the ’s are supposed to be i.i.d distributed, there are applications, such as detecting similarities between DNA sequences, where the ’s are not independent ([21]). In order to evaluate the effect of dependence, the alternative model is in many cases a Markov chain the whole dependence structure of which depends only on the joint distribution of two consecutive random variables.
In this work we introduce dependence models based on block-factors obtained from i.i.d. sequences in the context of the one dimensional discrete scan statistics. We derive approximations and their corresponding errors with application to the longest increasing run distribution and the moving average process.
The paper is structured as follows. In Section 2 we introduce the block factor model and present the approximation technique for the distribution of the scan statistics under this model. As a particular block factor model, the distribution of the length of the longest increasing run in a trial of i.i.d real random variables and the moving average processes are related to the scan statistics distribution in Section 3. Numerical results based on simulations illustrate the accuracy of the approximation. Concluding remarks end the paper.
2. One Dimensional Scan Statistics for Block-Factor Dependence Model
Most of the research devoted to the one dimensional discrete scan statistic considers the independent and identically distributed model for the random variables that generate the sequence which is to be scanned. In this section, we define a dependence structure for the underlying random sequence based on a block-factor type model.
2.1. The Block-Factor Dependence Model
Let us recall (see also Reference [22]) that the sequence of random variables with state space is said to be k block-factor of the sequence with state space if there is a measurable function such that
The Figure 1 presents the sequence of length T obtained as a k block-factor from a sequence of length throughout some function f.
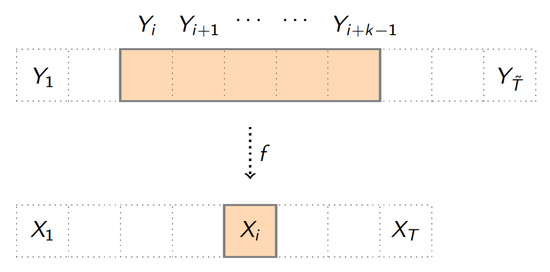
Figure 1.
The block factor model.
As an example of block-factor model, in Reference [23], the authors consider an i.i.d. sequence of standard normal distributed random variables and the 2 block-factor defined by
Therefore, due to the overlapping structure of and , they obtain a Gaussian stationary process with some correlation structure for which the scan statistics distribution is studied.
More generally, let observe that if a sequence of random variables is a k block-factor, then the sequence is -dependent. Recall that a sequence is m-dependent with (see Reference [22]), if for any the -fields generated by and are independent.
2.2. Scan Statistics Viewed as Maximum of 1-Dependent Sequence
Let be a k-block factor of the i.i.d. sequence , where and , and be the scan statistics associated to the sequence as defined in (1) for some scanning window of length m, .
Put for some integer and define, for each , the random variables
where . That is, for each , is the scan statistic associated to the sequence of length , . An illustration of the construction of variables is presented in Figure 2 for and .
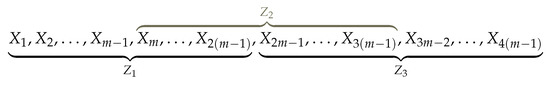
Figure 2.
Construction of .
Then, is 1-dependent and stationary and we have that
Thus, for any block factor model obtained from an i.i.d sequence, the distribution of the associated scan statistics is the distribution of the maximum of some 1-dependent stationary sequence.
2.3. Approximation
In References [24,25] the authors extended the approximation results obtained in Reference [26] for the distribution of the maximum of a 1-dependent stationary sequence. The main results is stated in the following theorem.
Let be a strictly stationary 1-dependent sequence of random variables and for , let
Theorem 1.
For all x such that , the following approximation formula holds:
with
where ,
and where with , for arbitrarily small , and the second root in magnitude of the equation .
The evaluation of the functions K and for some selected values of is presented in Table 1. These values allow to compute directly the error bound approximation in (7).

Table 1.
Selected values for l, K and functions in Theorem 1 for .
Applying Theorem 1 to the sequence defined in (4), from (5) we obtain an approximation and the associated error bound for in the following way. Put for ,
and observe that using the notation of (6) we have . For x such that we apply the result from Theorem 1 to obtain the approximation
with an error bound of about . Observe that and represent the distributions of the scan statistics over sequences of variable of lengths and respectively . and are generally estimated by Monte Carlo simulation.
Thus, if is an estimate of , , with and x is such that then
where is the total error of the approximation given by
One of the main advantage of this approximation method with respect to the product-type approximation proposed in Reference [12], who uses the same quantities and , is that it provides sharp error bounds for the approximation.
3. Some Related Problems to the Scan Statistics under Block-Factor Dependence Model
In order to illustrate the efficiency of the approximation (14) and the obtained error bounds, in this section we present two examples of statistics related to discrete scan statistics.
3.1. Length of the Longest Increasing Run in a i.i.d Sequence
Let , , …, be a sequence of length , , of independent and identically distributed random variables with the common distribution F. We say that the subsequence forms an increasing run (or ascending run) of length , starting at position , if it verifies the following relation
We denote the length of the longest increasing run among the first random variables by . This run statistics plays an important role in many applications in fields such computer science, reliability theory or quality control. The asymptotic behaviour of has been investigated by several authors depending on the common distribution, F. In the case of a continuous distribution [27] (see also Reference [28]) has shown that this behaviour does not depend on the common law. For the particular setting of uniform random variables, this problem was addressed by References [29,30,31]. Under the assumption that the distribution F is discrete, the limit behaviour of depends strongly on the common law F, as in Reference [32] (see also References [33,34]) proved for the case of geometric and Poisson distribution. In Reference [35], the case of discrete uniform distribution is investigated, while in Reference [36], the authors study the asymptotic distribution of when the variables are uniformly distributed but not independent.
In this section, we evaluate the distribution of the length of the longest increasing run using the methodology developed in Section 2. The idea is to express the distribution of the random variable in terms of the distribution of the scan statistics random variable.
Let and define the block-factor transformation by
Then, our block-factor model becomes
and , …, form a 1-dependent and stationary sequence of random variables.
Notice that the distribution of and the distribution of the length of the longest run of ones, , among the first T binary random variables , are related and satisfy the following identity
The statistics is also known as the length of the longest success run or head run and was extensively studied in the literature. One can consult the monographs of References [16,17] for applications and further results concerning this statistic. Moreover, the random variable can be interpreted as a particular case of the scan statistics random variable and between the two we have the relation
Hence, combining (19) and (20), we can express the distribution of the length of the longest increasing run as
Thus, we can estimate the distribution of using the foregoing identity and the approximations developed in Section 2 for the discrete scan statistics random variable.
We should also note that in Reference [30] the authors studied the asymptotic behaviour of over a sequence of m-dependent binary random variables. They showed that, given a stationary m-dependent sequence of random variables with values 0 and 1, , if there exist positive constants t, C such that
then, as
where and .
In order to illustrate the accuracy of the approximation of based on scan statistics, using the methodology developed in Section 2, we consider that the random variables ’s have a common uniform distribution. Simple calculations show that and
thus , and . In the context of our particular situation, the result of Reference [30] in Equation (23) becomes:
where .
In Table 2, we consider a numerical comparison study between the simulated value (column ) obtained by Monte Carlo simulation with trials, the approximation based on scan statistics (column ) computed from the Equation (14) where and are computed with trials and the limit distribution (column ) of the distribution of the length of the longest increasing run, , in a sequence of random variables distributed uniformly over . The results show that both our method and the asymptotic approximation in (25) are very accurate. It is worth mentioning that for our simulations we used an adapted version of the Importance Sampling procedure introduced in Reference [3], an efficient method that proved to perform very well for small p values (where naive Monte Carlo methods tend to break down) [37].
Table 2.
The distribution of the length of the longest increasing run: , , .
3.2. The Moving Average - Like Process of Order q Model
We consider the particular situation of the one dimensional discrete scan statistics defined over a sequence of random variables obtained as a linear block factor of a discrete Gaussian white noise. Because of the similarity with the definition of a classical moving average process, we call that block factor model a moving average - like process. It is worth mentioning that the distribution of the scan statistics in the context of a moving average process for normal data was studied in Reference [38] where the authors compared the product-type approximation developed in Reference [13] with the approximation of Reference [23]. In the block-factor model introduced in (3), let be a positive integer and , , …, be a sequence of independent and identically Gaussian distributed random variables with known mean and variance .
Let be a fixed non null vector and take , the (measurable) transformation that defines the block-factor model, to be equal with
For , with , our dependent model is defined by the relation
The moving sums of size m, , can be expressed as
where the coefficients , …, are evaluated by
- (a)
- For ,
- (b)
- For ,
Therefore, for each , the random variable follows a normal distribution with mean and variance . Moreover, a simple calculation shows that the covariance matrix has the entries
Given the mean and the covariance matrix of the vector , one can use the importance sampling algorithm developed in Reference [3] (see also Reference [37]) or the one presented in Reference [39] to estimate the distribution of the one dimensional discrete scan statistics . Another way is to use the quasi-Monte Carlo algorithm developed in Reference [40] to approximate the multivariate normal distribution.
In our application example we adopt the importance sampling procedure developed in Reference [3]. In order to evaluate the accuracy of the approximation developed in (14), we consider , , , and the coefficients of the moving average model to be . We compare our approximation (column ) given in (14) with the one (column AppPT) given in Reference [41] using product-type approximations. In Table 3, we present numerical results for the setting described above. In our algorithms we used trials for the computation of (x) and and trials for the Monte-Carlo simulation of the .
Table 3.
MA-like(q = 2) model: , , , , .
4. Conclusions
Block factor models defined from i.i.d. sequence generate random sequences with a particular type of dependence structure. For this type of dependence, the scan statistics can be viewed as the maximum of a 1-dependent stationary sequence, for which the distribution can be approximated with high accuracy. The approximation error can be controlled by using efficient algorithms of simulation as for example the importance sampling approach proposed in Reference [3] (see also Reference [25]). We approximated the distribution of longest increasing run statistics over an i.i.d sequence as a particular case of scan statistics distribution over a block factor model.
Author Contributions
Conceptualization, A.A. and C.P.; methodology, A.A. and C.P.; software, A.A.; validation, A.A. and C.P.; formal analysis, A.A. and C.P.; writing original draft preparation, C.P.; writing review and editing, A.A. and C.P.; visualization, A.A. and C.P.; supervision, A.A. and C.P.; project administration, C.P.; funding acquisition, A.A. All authors have read and agreed to the published version of the manuscript.
Funding
This work was partially supported by a grant of the Romanian National Authority for Scientific Research and Innovation, project number POC P-37-257 and MCI National Core Program, project 25 N/2019 BIODIVERS 19270103.
Acknowledgments
The authors wish to thank the anonymous reviewers for their careful reading of the manuscript and their helpful suggestions and comments which led to the improvement of the paper.
Conflicts of Interest
The authors declare no conflict of interest.
References
- Hoh, J.; Ott, J. Scan statistics to scan markers for susceptibility genes. Proc. Natl. Acad. Sci. USA 2000, 97, 9615–9617. [Google Scholar] [CrossRef] [PubMed]
- Sheng, K.-N.; Naus, J. Pattern matching between two non aligned random sequences. Bull. Math. Biol. 1994, 56, 1143–1162. [Google Scholar] [CrossRef]
- Naiman, D.Q.; Priebe, C.E. Computing scan statistic p values using importance sampling, with applications to genetics and medical image analysis. J. Comput. Graph. Stat. 2001, 10, 296–328. [Google Scholar] [CrossRef]
- Guerriero, M.; Pozdnyakov, V.; Glaz, J.; Willett, P. A repeated significance test with applications to sequential detection in sensor networks. IEEE Trans. Signal Process. 2010, 58, 3426–3435. [Google Scholar] [CrossRef]
- Guerriero, M.; Willett, P.; Glaz, J. Distributed target detection in sensor networks using scan statistics. IEEE Trans. Signal Process. 2009, 57, 2629–2639. [Google Scholar] [CrossRef]
- Darling, R.W.R.; Waterman, M.S. Extreme value distribution for the largest cube in a random lattice. SIAM J. Appl. Math. 1986, 46, 118–132. [Google Scholar] [CrossRef]
- Marcos, R.; Marcos, C. From star complexes to the field: Open cluster families. Astrophys. J. 2008, 672, 342–351. [Google Scholar] [CrossRef]
- Boutsikas, M.V.; Koutras, M.V. Reliability approximation for Markov chain imbeddable systems. Methodol. Comput. Appl. Probab. 2000, 2, 393–411. [Google Scholar] [CrossRef]
- Glaz, J.; Naus, J. Tight bounds and approximations for scan statistic probabilities for discrete data. Ann. Appl. Probab. 1991, 1, 306–318. [Google Scholar] [CrossRef]
- Glaz, J.; Naus, J.; Wallenstein, S. Scan Statistics; Springer Series in Statistics; Springer: New York, NY, USA, 2001. [Google Scholar]
- Glaz, J.; Balakrishnan, N. Scan Statistics and Applications; Springer Sciences+Business Media: Berlin, Germany, 1999. [Google Scholar]
- Naus, J. Approximations for distributions of scan statistics. J. Am. Stat. Assoc. 1982, 77, 177–183. [Google Scholar] [CrossRef]
- Wang, X.; Glaz, J.; Naus, J. Approximations and inequalities for moving sums. Methodol. Comput. Appl. Probab. 2012, 14, 597–616. [Google Scholar]
- Chen, J.; Glaz, J. Scan statistics for monitoring data modeled by a negative binomial distribution. Commun. Stat. Theory Methods 2016, 45, 1632–1642. [Google Scholar] [CrossRef]
- Naus, J. Probabilities for a generalized birthday problem. J. Am. Stat. Assoc. 1974, 69, 810–815. [Google Scholar] [CrossRef]
- Balakrishnan, N.; Koutras, M.V. Runs and Scans with Applications; Wiley Series in Probability and Statistics; Wiley-Interscience [John Wiley & Sons]: New York, NY, USA, 2002. [Google Scholar]
- Fu, J.C.; Lou, W. Distribution Theory of Runs and Patterns and Its Applications: A Finite Markov Chain Imbedding Approach; World Scientific Publishing Co., Inc.: River Edge, NJ, USA, 2003. [Google Scholar]
- Ebneshahrashoob, M.; Gao, T.; Wu, M. An efficient algorithm for exact distribution of discrete scan statistics. Methodol. Comput. Appl. Probab. 2005, 7, 1423–1436. [Google Scholar] [CrossRef]
- Uchida, M. On generating functions of waiting time problems for sequence patterns of discrete random variables. Ann. Inst. Stat. Math. 1998, 50, 650–671. [Google Scholar] [CrossRef]
- Chen, J.; Glaz, J. Approximations and inequalities for the distribution of a scan statistic for 0-1 Bernoulli trials. Adv. Theory Pract. Stat. 1997, 1, 285–298. [Google Scholar]
- Arratia, R.; Gordon, L.; Waterman, M.S. The Erdos-Rényi law in distribution for coin tossing and sequence matching. Ann. Stat. 1990, 18, 539–570. [Google Scholar] [CrossRef]
- Burton, R.M.; Goulet, M.; Meester, R. On one-dependent processes and k-block factors. Ann. Probab. 1993, 21, 2157–2168. [Google Scholar] [CrossRef]
- Haiman, G.; Preda, C. One dimensional scan statistics generated by some dependent stationary sequences. Stat. Probab. Lett. 2013, 83, 1457–1463. [Google Scholar] [CrossRef]
- Amărioarei, A. Approximation for the Distribution of Extremes of One Dependent Stationary Sequences of Random Variables. arXiv 2012, arXiv:1211.5456v1. [Google Scholar]
- Amărioarei, A. Approximations for the Multidimensional Discrete Scan Statistics. Ph.D. Thesis, University of Lille, Lille, France, 2014. [Google Scholar]
- Haiman, G. Estimating the distributions of scan statistics with high precision. Extremes 2000, 3, 349–361. [Google Scholar] [CrossRef]
- Pittel, B. Limiting behavior of a process of runs. Ann. Probab. 1981, 9, 119–129. [Google Scholar] [CrossRef]
- Frolov, A.; Martikainen, A. On the length of the longest increasing run in Rd. Stat. Prob. Lett. 1999, 41, 153–161. [Google Scholar] [CrossRef]
- Grill, K. Erdos-Révész type bounds for the length of the longest run from a stationary mixing sequence. Probab. Theory Relat. Fields 1987, 75, 169–179. [Google Scholar] [CrossRef]
- Novak, S. Longest runs in a sequence of m-dependent random variables. Probab. Theory Relat. Fields 1992, 91, 269–281. [Google Scholar] [CrossRef]
- Révész, P. Three problems on the llength of increasing runs. Stochastic Process. Appl. 1983, 5, 169–179. [Google Scholar] [CrossRef]
- Csaki, E.; Foldes, A. On the length of theh longest monnotone block. Studio Scientiarum Mathematicarum Hungarica 1996, 31, 35–46. [Google Scholar]
- Eryilmaz, S. A note on runs of geometrically distributed random variables. Discrete Math. 2006, 306, 1765–1770. [Google Scholar] [CrossRef][Green Version]
- Grabner, P.; Knopfmacher, A.; Prodinger, H. Combinatorics of geometrically distributed random variables: Run statistics. Theoret. Comput. Sci. 2003, 297, 261–270. [Google Scholar] [CrossRef][Green Version]
- Louchard, G. Monotone runs of uniformly distributed integer random variables: A probabilistic analysis. Theoret. Comput. Sci. 2005, 346, 358–387. [Google Scholar] [CrossRef]
- Mitton, N.; Paroux, K.; Sericola, B.; Tixeuil, S. Ascending runs in dependent uniformly distributed random variables: Application to wireless networks. Methodol. Comput. Appl. Probab. 2010, 12, 51–62. [Google Scholar] [CrossRef]
- Malley, J.; Naiman, D.Q.; Bailey-Wilson, J. A compresive method for genome scans. Hum. Heredity 2002, 54, 174–185. [Google Scholar] [CrossRef] [PubMed]
- Wang, X.; Zhao, B.; Glaz, J. A multiple window scan statistic for time series models. Stat. Probab. Lett. 2014, 94, 196–203. [Google Scholar] [CrossRef]
- Shi, J.; Siegmund, D.; Yakir, B. Importance sampling for estimating p values in linkage analysis. J. Am. Stat. Assoc. 2007, 102, 929–937. [Google Scholar] [CrossRef]
- Genz, A.; Bretz, F. Computation of Multivariate Normal and T Probabilities; Springer: New York, NY, USA, 2009. [Google Scholar]
- Wang, X.; Glaz, J. A variable window scan statistic for MA(1) process. In Proceedings of the 15th International Conference on Applied Stochastic Models and Data Analysis ASMDA 2013, Barcelona, Spain, 25–28 June 2013; pp. 955–962. [Google Scholar]
© 2020 by the authors. Licensee MDPI, Basel, Switzerland. This article is an open access article distributed under the terms and conditions of the Creative Commons Attribution (CC BY) license (http://creativecommons.org/licenses/by/4.0/).