Article

An Image-Based Double-Smoothing Cohesive Finite Element Framework for Particle-Reinforced Materials

1
Science and Technology on Reactor System Design Technology Laboratory, Nuclear Power Institute of China, Chengdu 610213, China
2
Department of Astronautic Science and Mechanics, Harbin Institute of Technology, Harbin 150001, China
*
Author to whom correspondence should be addressed.
Mathematics 2020, 8(4), 543; https://doi.org/10.3390/math8040543
Submission received: 5 March 2020 / Revised: 26 March 2020 / Accepted: 2 April 2020 / Published: 7 April 2020
(This article belongs to the Special Issue Applied Mathematics and Mechanics 2019)

Abstract

:
In order to simulate the fracture process of particle-reinforced materials on the micro-scale, an image-based double-smoothing cohesive finite element framework is proposed in the present paper. Two separate smoothing processes are performed to reduce the noise in the digital image and eliminate the jagged elements in the finite element mesh. The main contribution of the present study is the proposed novel image-based cohesive finite element framework, and this method improved the quality of the meshes effectively. Meanwhile, the artificial resistance due to the jagged element is reduced with the double-smoothing cohesive finite element framework during the crack propagation. Therefore, the image-based double-smoothing cohesive finite element framework is significant for the simulation of fracture mechanics.

1. Introduction

Particle-reinforced materials, such as concretes, particle metal matrix composites, polymer binder explosives, and dispersion nuclear fuel, are widely used in engineering applications as an expanded new category of materials. [1,2,3]. Since the microstructure of particle-reinforced material is complex (e.g., the size and distribution of particles are random), the simulation of fracture behavior on the micro-scale becomes a challenged issue. Meanwhile, cohesive finite element framework is a powerful methodology to simulate the fracture process on the micro-scale explicitly. However, how to reconstruct the real microstructure of the particle-reinforced materials is a common challenge in the cohesive finite element framework.
To elaborate the microstructures of these materials, many researchers develop reconstruction methods to generate finite element (FE) meshes from digital images. [4,5,6,7,8,9,10,11,12,13,14,15,16,17]. Mainly, these reconstruction methods can be classified into two categories [18]: based on geometry and pixel method.
In the geometry-based method [12,13,17], there are two steps to reconstruct the FE mesh from digital images. Firstly, different components of material (e.g., particles and matrix) are segmented and the corresponding geometric models (body or surface) are generated using commercial software or in-house program. It should be noticed that this approach requires a lot of efforts and cannot be easily automated. Then these geometrics are usually meshed normally.
In the pixel/voxel-based method [11,14,15,16], elements are generated directly and automatically by mapping pixels/voxels in the digital image [19,20]. The material regions selected for analyzing are determined based on the gray level of corresponding pixel/voxel. Comparing these two FE reconstruction methods, the pixel/voxel-based method is more efficient and can be easily automated. In particle-reinforced materials, with respect to the distribution of particles, which is always arbitrary, the unit cell models can not accurately represent the microstructure. Meanwhile, the boundaries of particles are extremely complicated for manual segmenting. Therefore, the automatic pixel/voxel-based method is more suitable for the reconstruction of particle-reinforced materials than the geometry-based method. However, since the shape of element generated directly from the pixel/voxel is limited to a square or a cube, the mesh at interfaces is relatively rougher than that in geometry-based mesh. Obviously, the excessive rough mesh will lead to the stress concentration [14,16]. To overcome this limitation in pixel/voxel-based meshes, a double-smoothing pixel/voxel-based reconstruction method is proposed. Two separate smoothing processes are performed to reduce the noise in the digital image and eliminate the jagged element in finite element mesh, respectively.

2. Method of Image-Based Reconstruction

The digital images used for finite element reconstruction can be captured by the microscope or the X-ray tomography. As mentioned in the above section, a gray level threshold can be utilized to segment the digital image into different parts corresponding to different materials. However, the quality of meshes generated directly by segmenting the image is extremely low. As shown in the “direct reconstruction” of Figure 1, some particles are lost at edges of the image, and some unreasonable voids appear in particles. Moreover, the material interfaces are extremely rough, much like sawteeth. There are two reasons leading to this rough mesh:
(1)
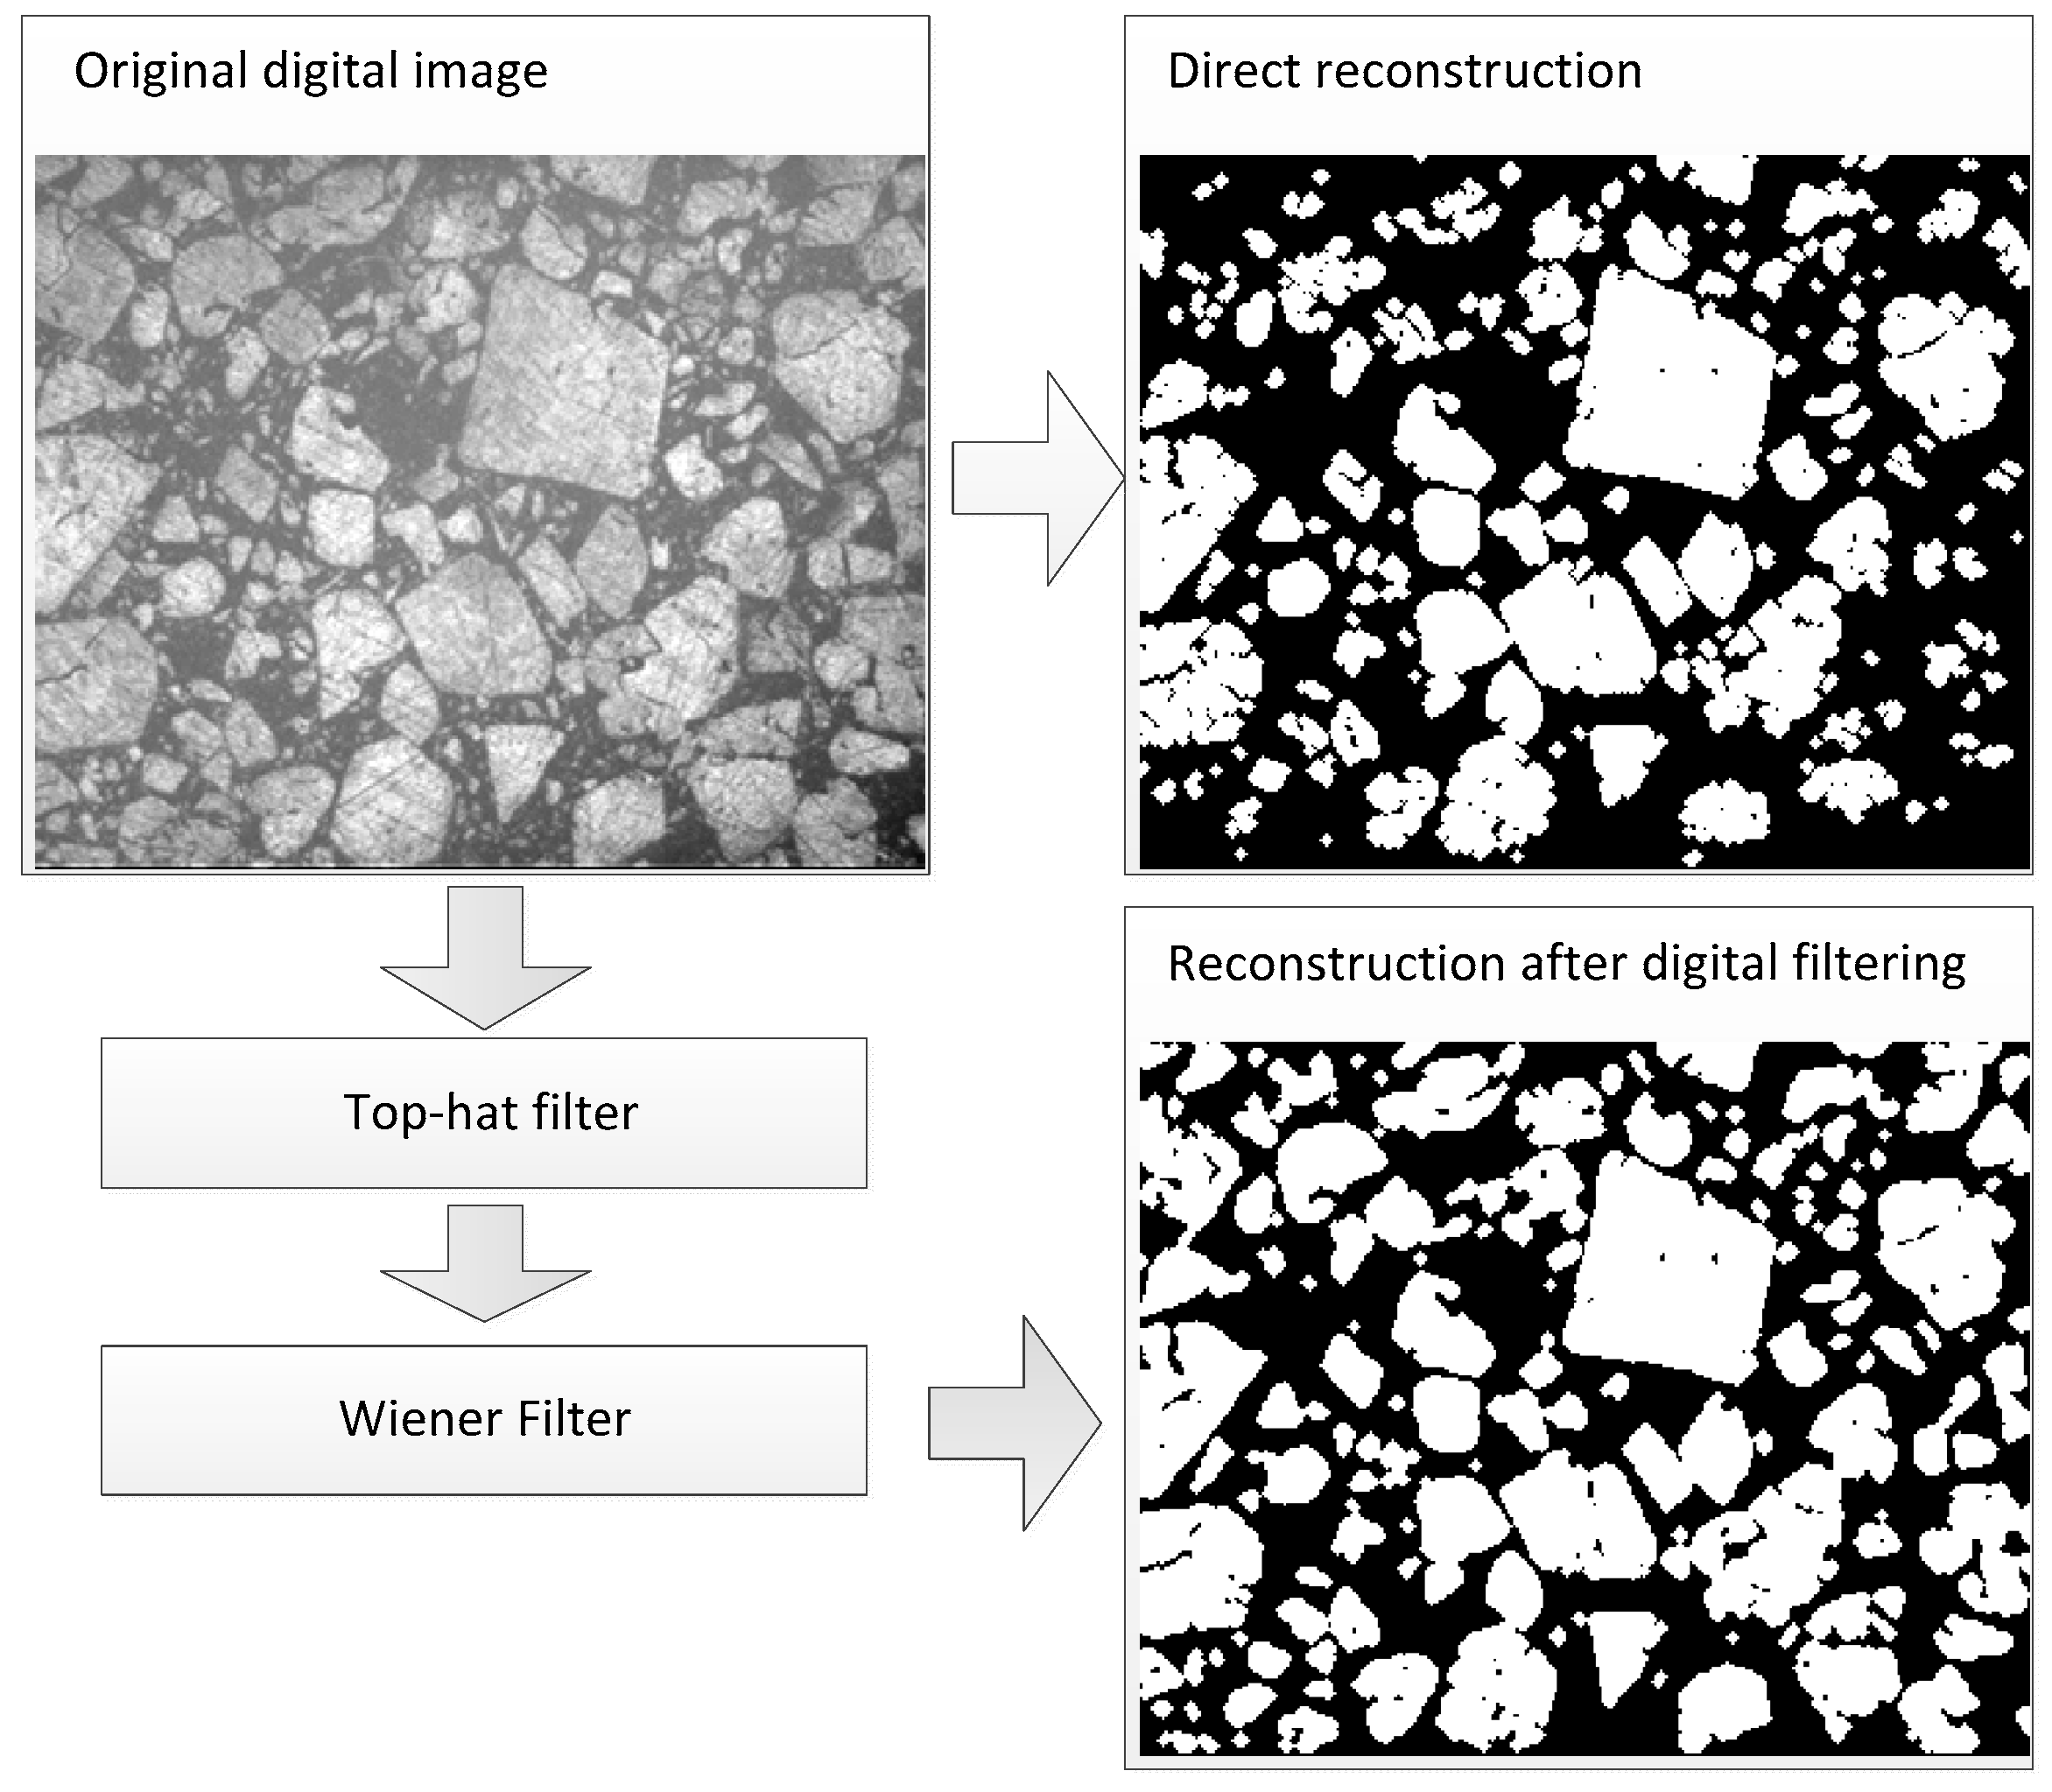
The uneven illumination and noises in digital image give rise to the loss of particles and the appearance of unreasonable voids;
(2)
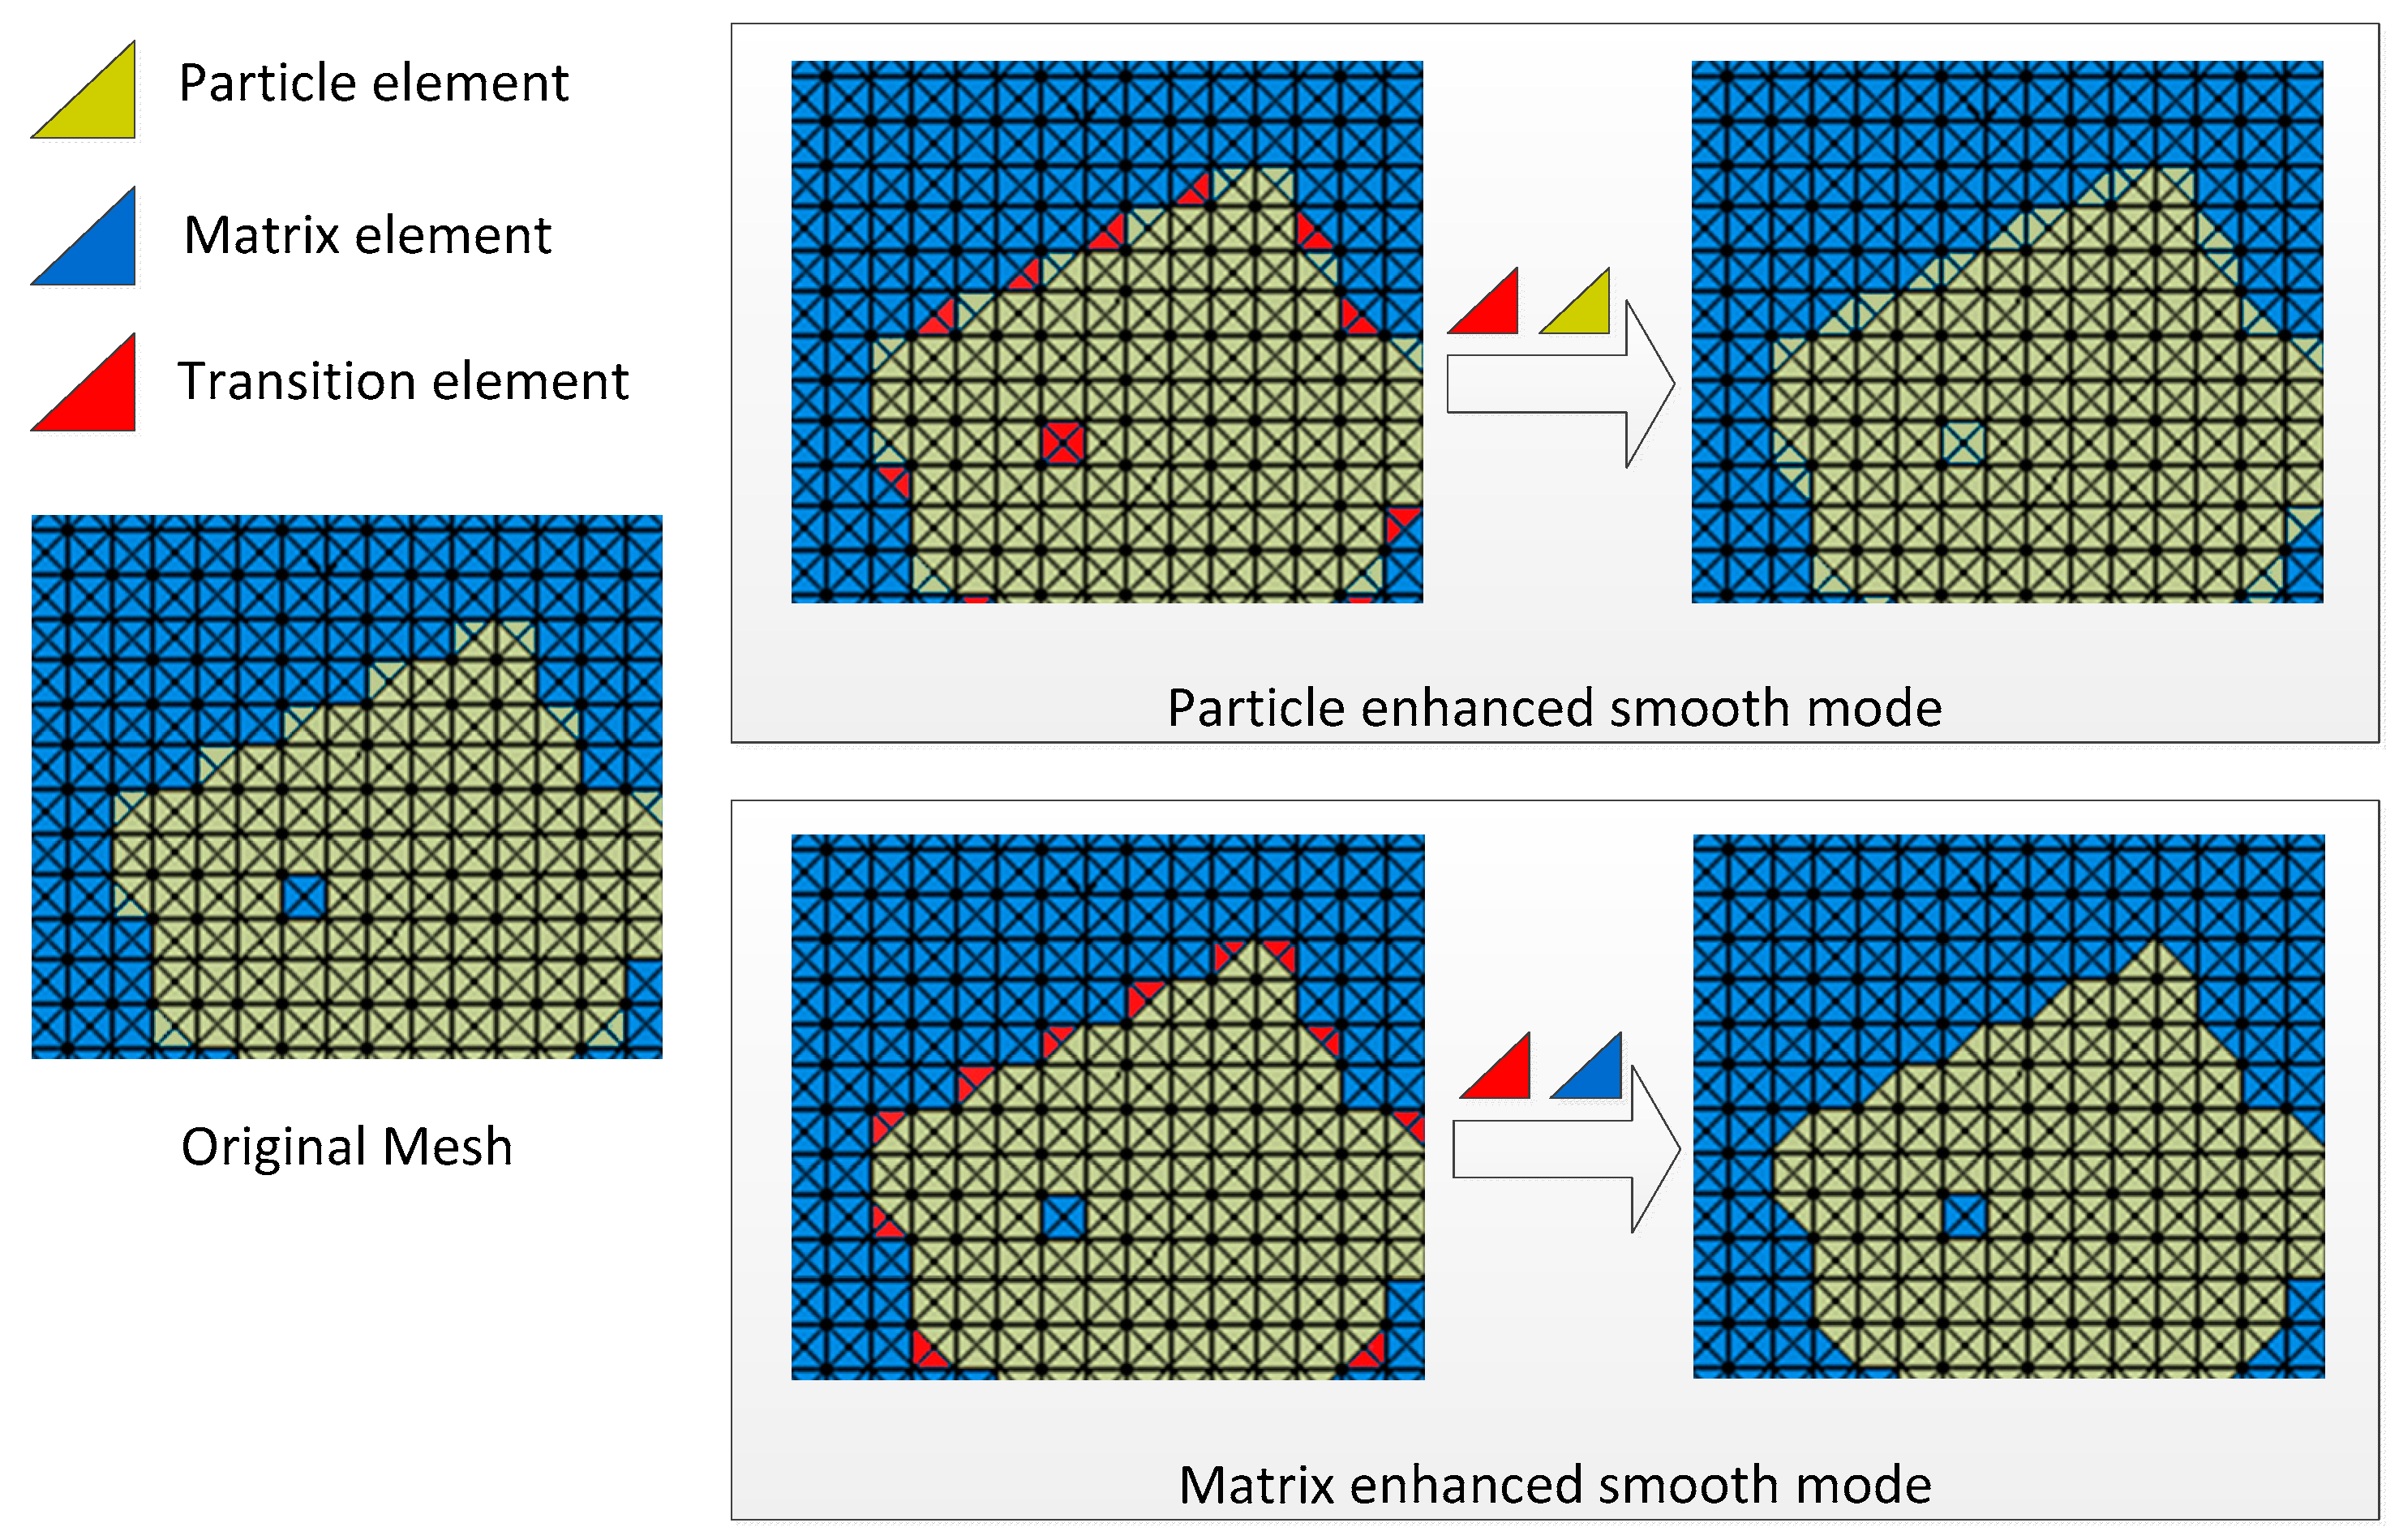
The meshes with square elements lead to the appearance of jagged interfaces.
To overcome these problems, a double-smoothing method is developed to reconstruct the microstructure of particle-reinforced material in this study. The first smoothing process is performed in the digital image before the pixel-to-element mapping. A combination of several digital filters is utilized to correct the uneven illumination and reduce the noises in original images. The second smoothing process is conducted in the pixel-to-element FE meshes. The jagged interfaces are repaired by an effective smoothing algorithm. Therefore, the whole process of double-smoothing reconstruction is divided into three stages: smoothing digital image, pixel-to-element mapping, and smoothing FE mesh. These three steps are presented in the next subchapters, respectively.

2.1. Smoothing Process for Digital Image

In this step, a combination of top-hat filter [21] and Wiener filter [22] is applied to improve the quality of digital images. The top-hat filter is utilized to correct the uneven illumination, and the Wiener filter is used to reduce the noise created during capturing image. It should be noted that the true image of microstructure described by function f ( x , y ) cannot be captured accurately without any noises. Actually, the captured image is a special mapping of the true image f ( x , y ) with some digital noises and finally is represented by the function of g ( x , y ) . For convenience, the mapping function h ( x , y ) and the noise function n ( x , y ) are assumed to be independent from the f ( x , y ) . Therefore, the captured image function g ( x , y ) is as follows:
g ( x , y ) = f ( x x , y y ) h ( x , y ) d x d y + n ( x , y ) .
The aim of the smoothing process is to restore the true image f ( x , y ) from the captured image g ( x , y ) . The top-hat filter [21], a signal processing technique, is utilized to correct the uneven illumination in the captured image firstly. Then, the Wiener filter [22] is performed to reduce the noises, as follows:
f ( x , y ) = μ σ 2 ν 2 σ 2 ( g ( x , y ) μ ) ,
where f ( x , y ) is the restored “true” image, g ( x , y ) is the captured image. The estimated local mean μ and variance σ 2 around each pixel can be got by the following equations.
μ = 1 N M x , y η g ( x , y )   ,
σ 2 = 1 N M x , y η g 2 ( x , y ) μ 2 ,
where η is the N × M neighborhood of the current pixel. Since the local noise variance ν 2 is unknown, the global mean value of the estimated variances is used in present work.
The comparison of the direct reconstructed model and reconstruction after digital filtering is present in Figure 1. It can be observed that the combination of top-hat filter and Wiener filter can restore and smooth the model effectively.

2.2. Pixel-to-Element Mapping

In this step, a smoothed image is mapped into FE mesh. Different from the one-to-one pixel/voxel-based mesh, each pixel of image is mapped into a box with four triangular elements in FE meshes. The schematic of the one-to-four mapping is shown in Figure 2. It should be notice that the linear triangular element is adopted in the present work. Although the quadratic element is better suited to present complex geometries and bending deformations. The linear element is easier to implement and takes less computational cost than the quadratic element. Moreover, the present method can be extended to quadratic element by adding the mid-side nodes easily.
Assuming the width of the image is M and the height is N. The four elements corresponding to the pixel with coordinate ( x , y ) are numbered as follows:
E ( x , y , c ) = 4 M ( y 1 ) + 4 ( x 1 ) + c   (   c = 1 , 2 , 3 , 4 ) ,
where c is a constant describing the order of elements in a box, as shown in Figure 2.
The material property P ( x , y , c ) of each box is determined by the gray level f ( x , y ) in corresponding pixel. That is
P ( x , y , c ) = { p a r t i c l e ,   ( f ( x , y ) T ) m a t r i x ,   ( f ( x , y ) > T )     (   c = 1 , 2 , 3 , 4 )
Here, f ( x , y ) is the restored “true” digital image, and T is the gray level threshold.
Comparing with the one-to-one mapping method, this mapping method mainly has two advantages:
  • Since triangular elements are used to smooth the meshes, the rough interfaces caused by square elements are improved effectively;
  • The present model can be expanded to an cohesive finite element framework, a significant model for the simulation of damage and fracture, easily.
It should be notice that present work is focusing on the simulation of fracture. Therefore, the one-to-four mapping method is adopted to provide more propagating directions for fracture simulations. For the other purpose, each pixel of image can also be mapped onto another type of element.

2.3. Smoothing Process for FE Mesh

It is obvious that the first smoothing process has restored the true image as accurately as possible. However, even if a true image is used in the reconstruction, rough meshes at interfaces still cannot be avoided. In this step, the second smoothing process of FE mesh is introduced to improve the rough interfaces. The main idea is that some triangular elements with particle/matrix properties around the interfaces are selected as transition elements, and the material properties of the transition elements are replaced by the material property of matrix/particles. After this smoothing process, the rough meshes are remarkably improved by enlarging the angles between elements from 90 ° to 135 ° . Two different smoothing modes with the enhancement of particle or matrix are illustrated in Figure 3, respectively. It can be observed that the transition elements used in different modes are completely differently. Therefore, a universal pseudocode of the smoothing algorithm is illustrated in Figure 4. Firstly, the enhanced mode should be selected as either particle or matrix. Then, transition elements around interfaces are marked, and the properties of these elements are changed into the enhanced property.

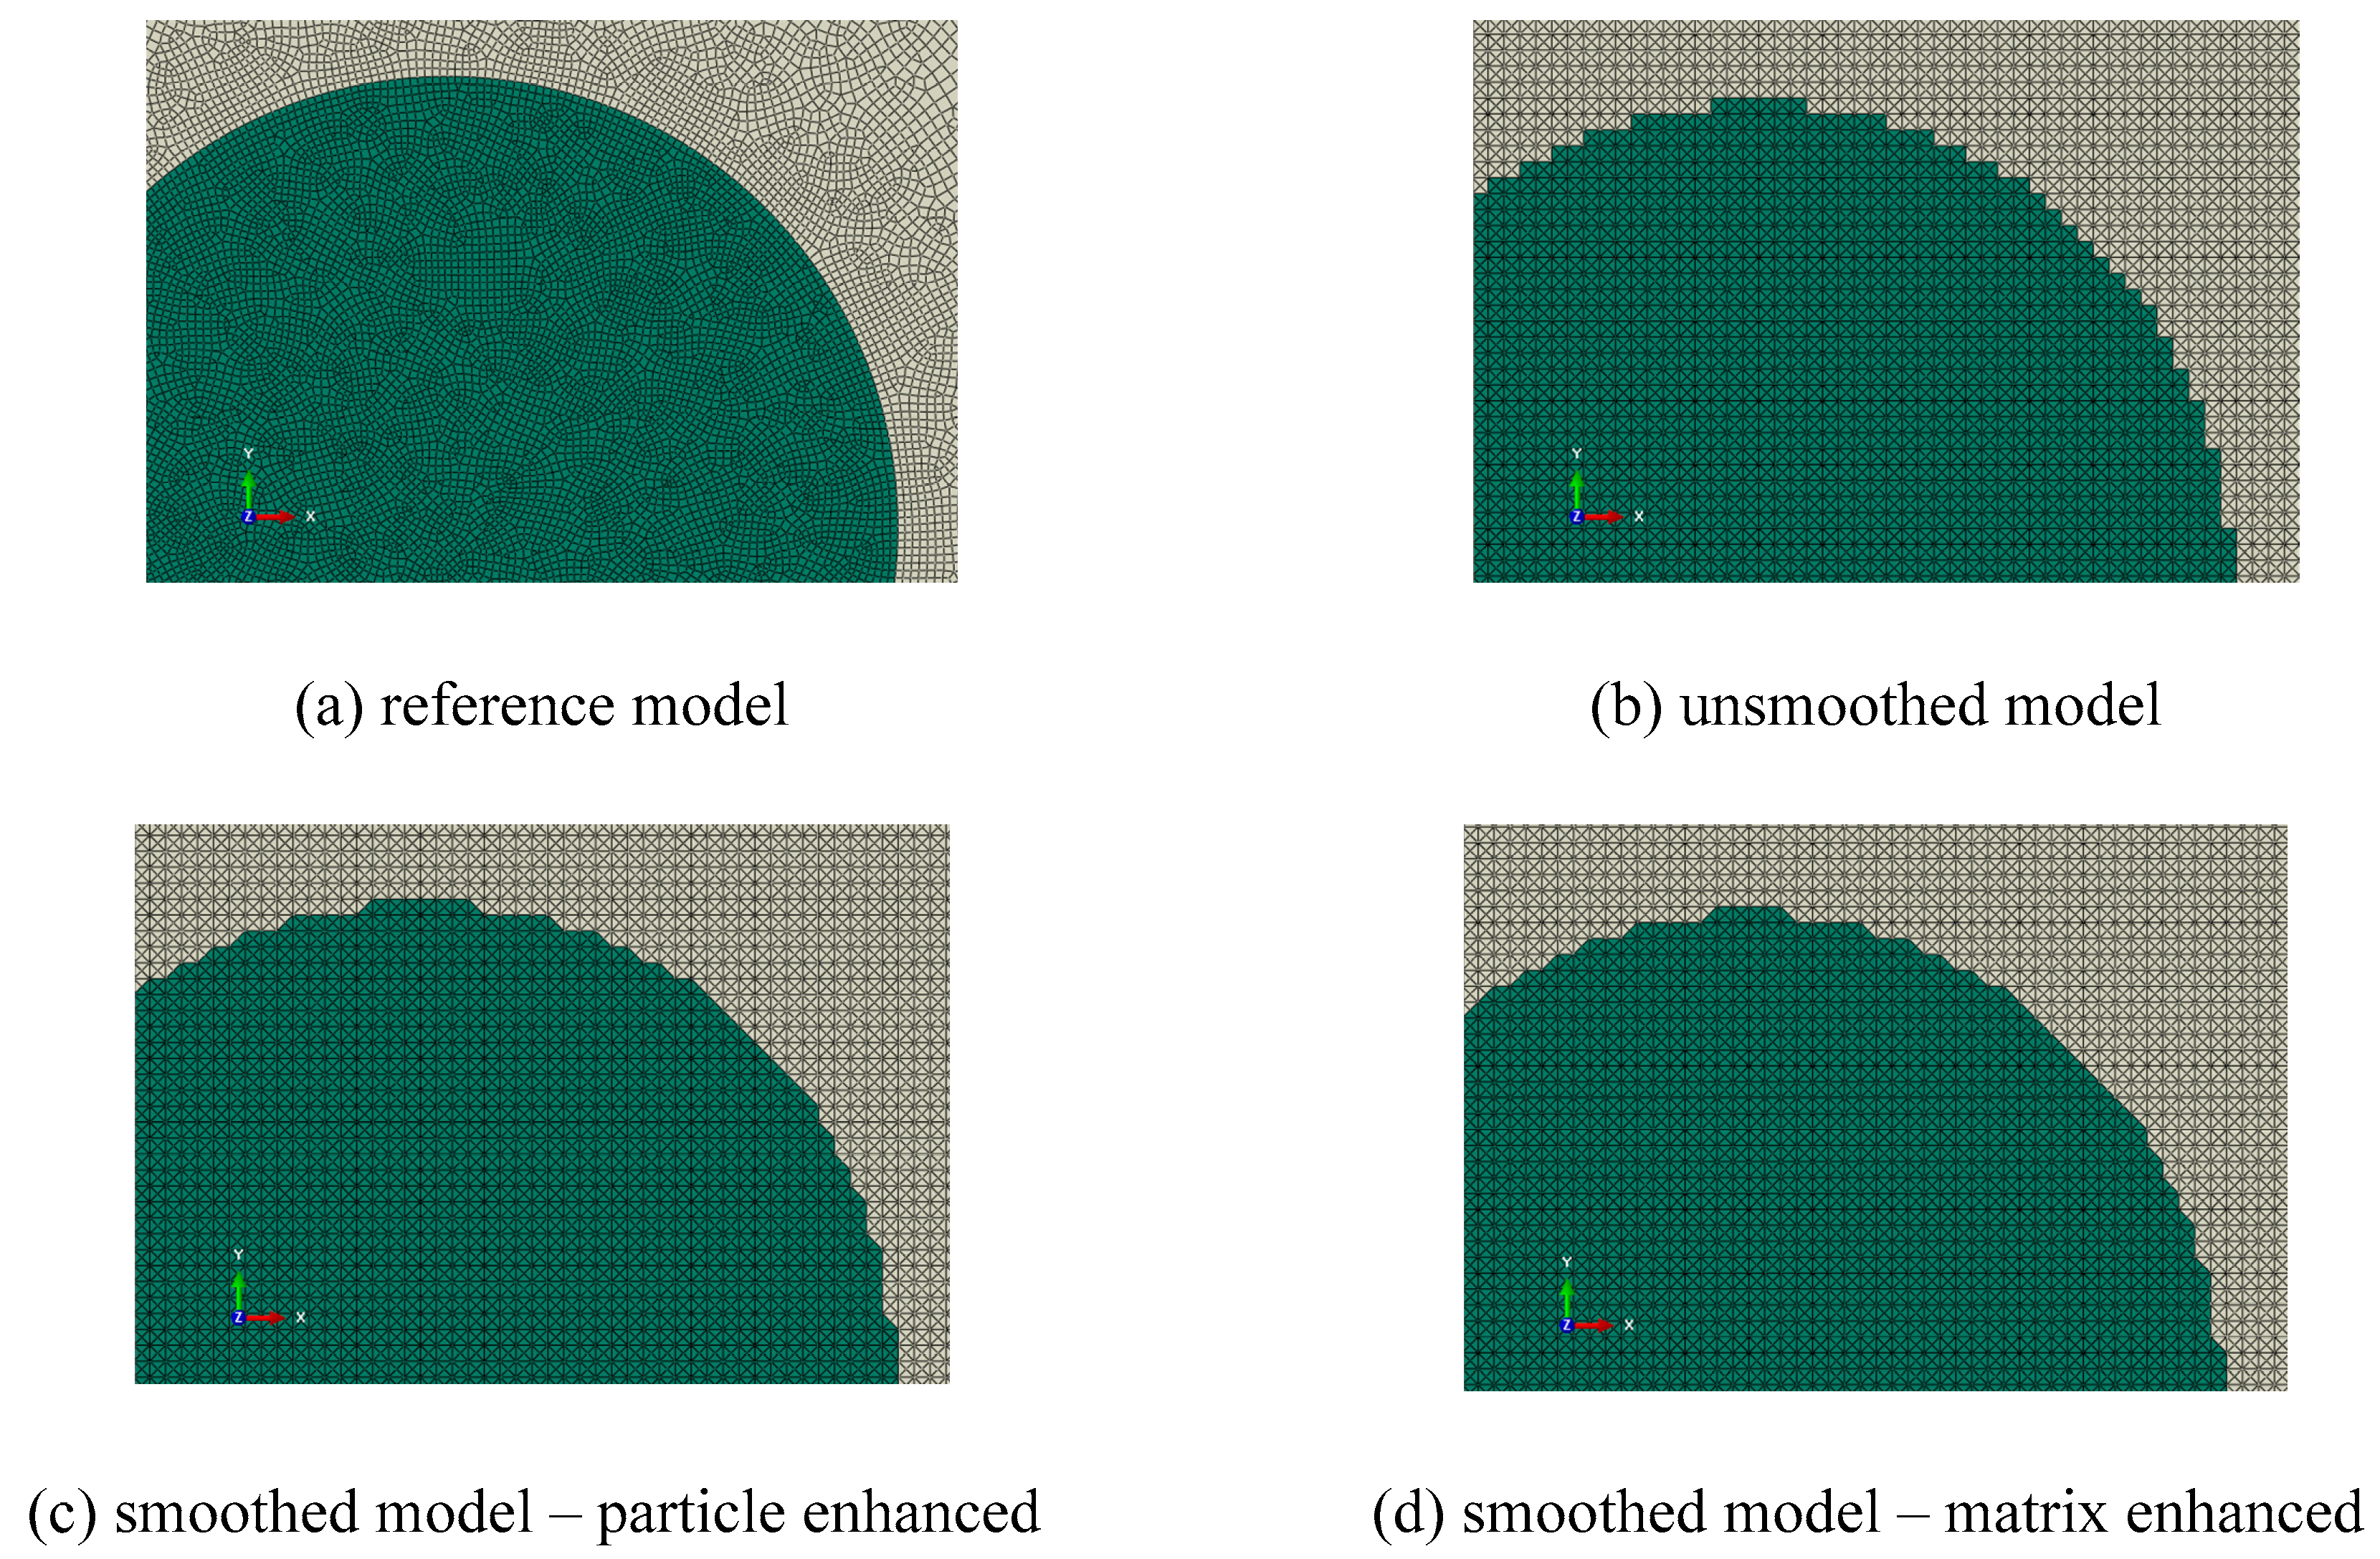
3. Comparison of the Smoothed and Unsmoothed Model

In order to evaluate the influence of the double-smoothing method, the comparison is given in this section. Firstly, models with one circular particle are compared with a referenced model. Situations with and without damage are considered, respectively. Then, an image of a particle-reinforced material is reconstructed, and the results of crack lengths and damage zones are compared between the smoothed model and the unsmoothed one.

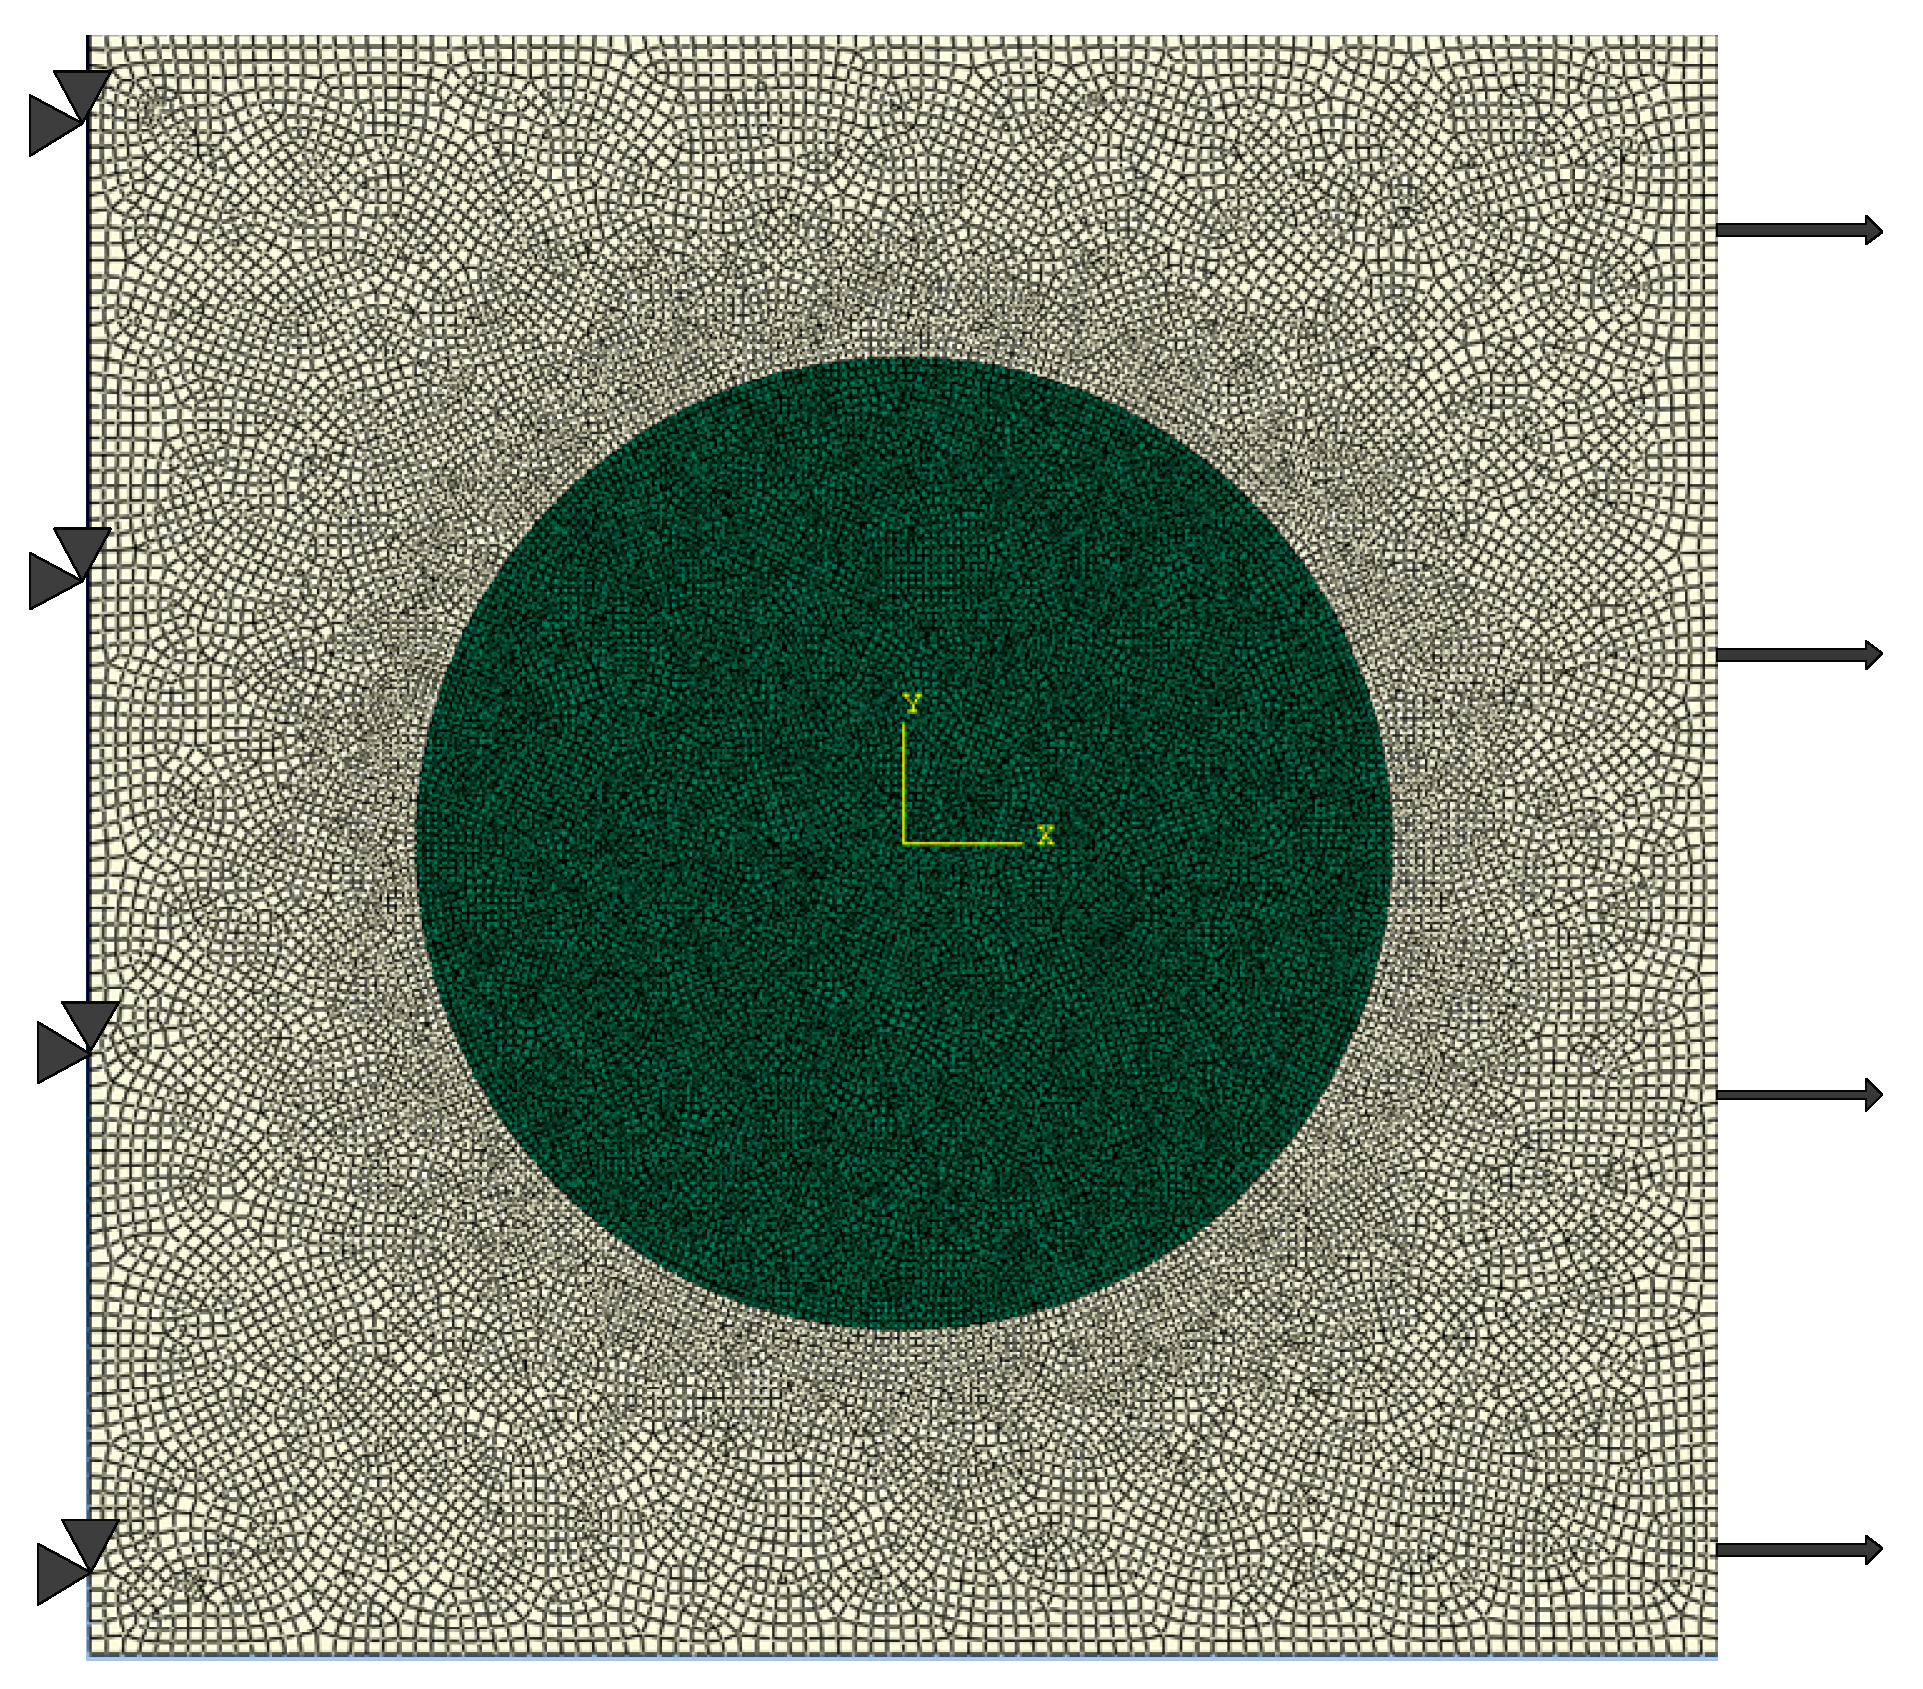
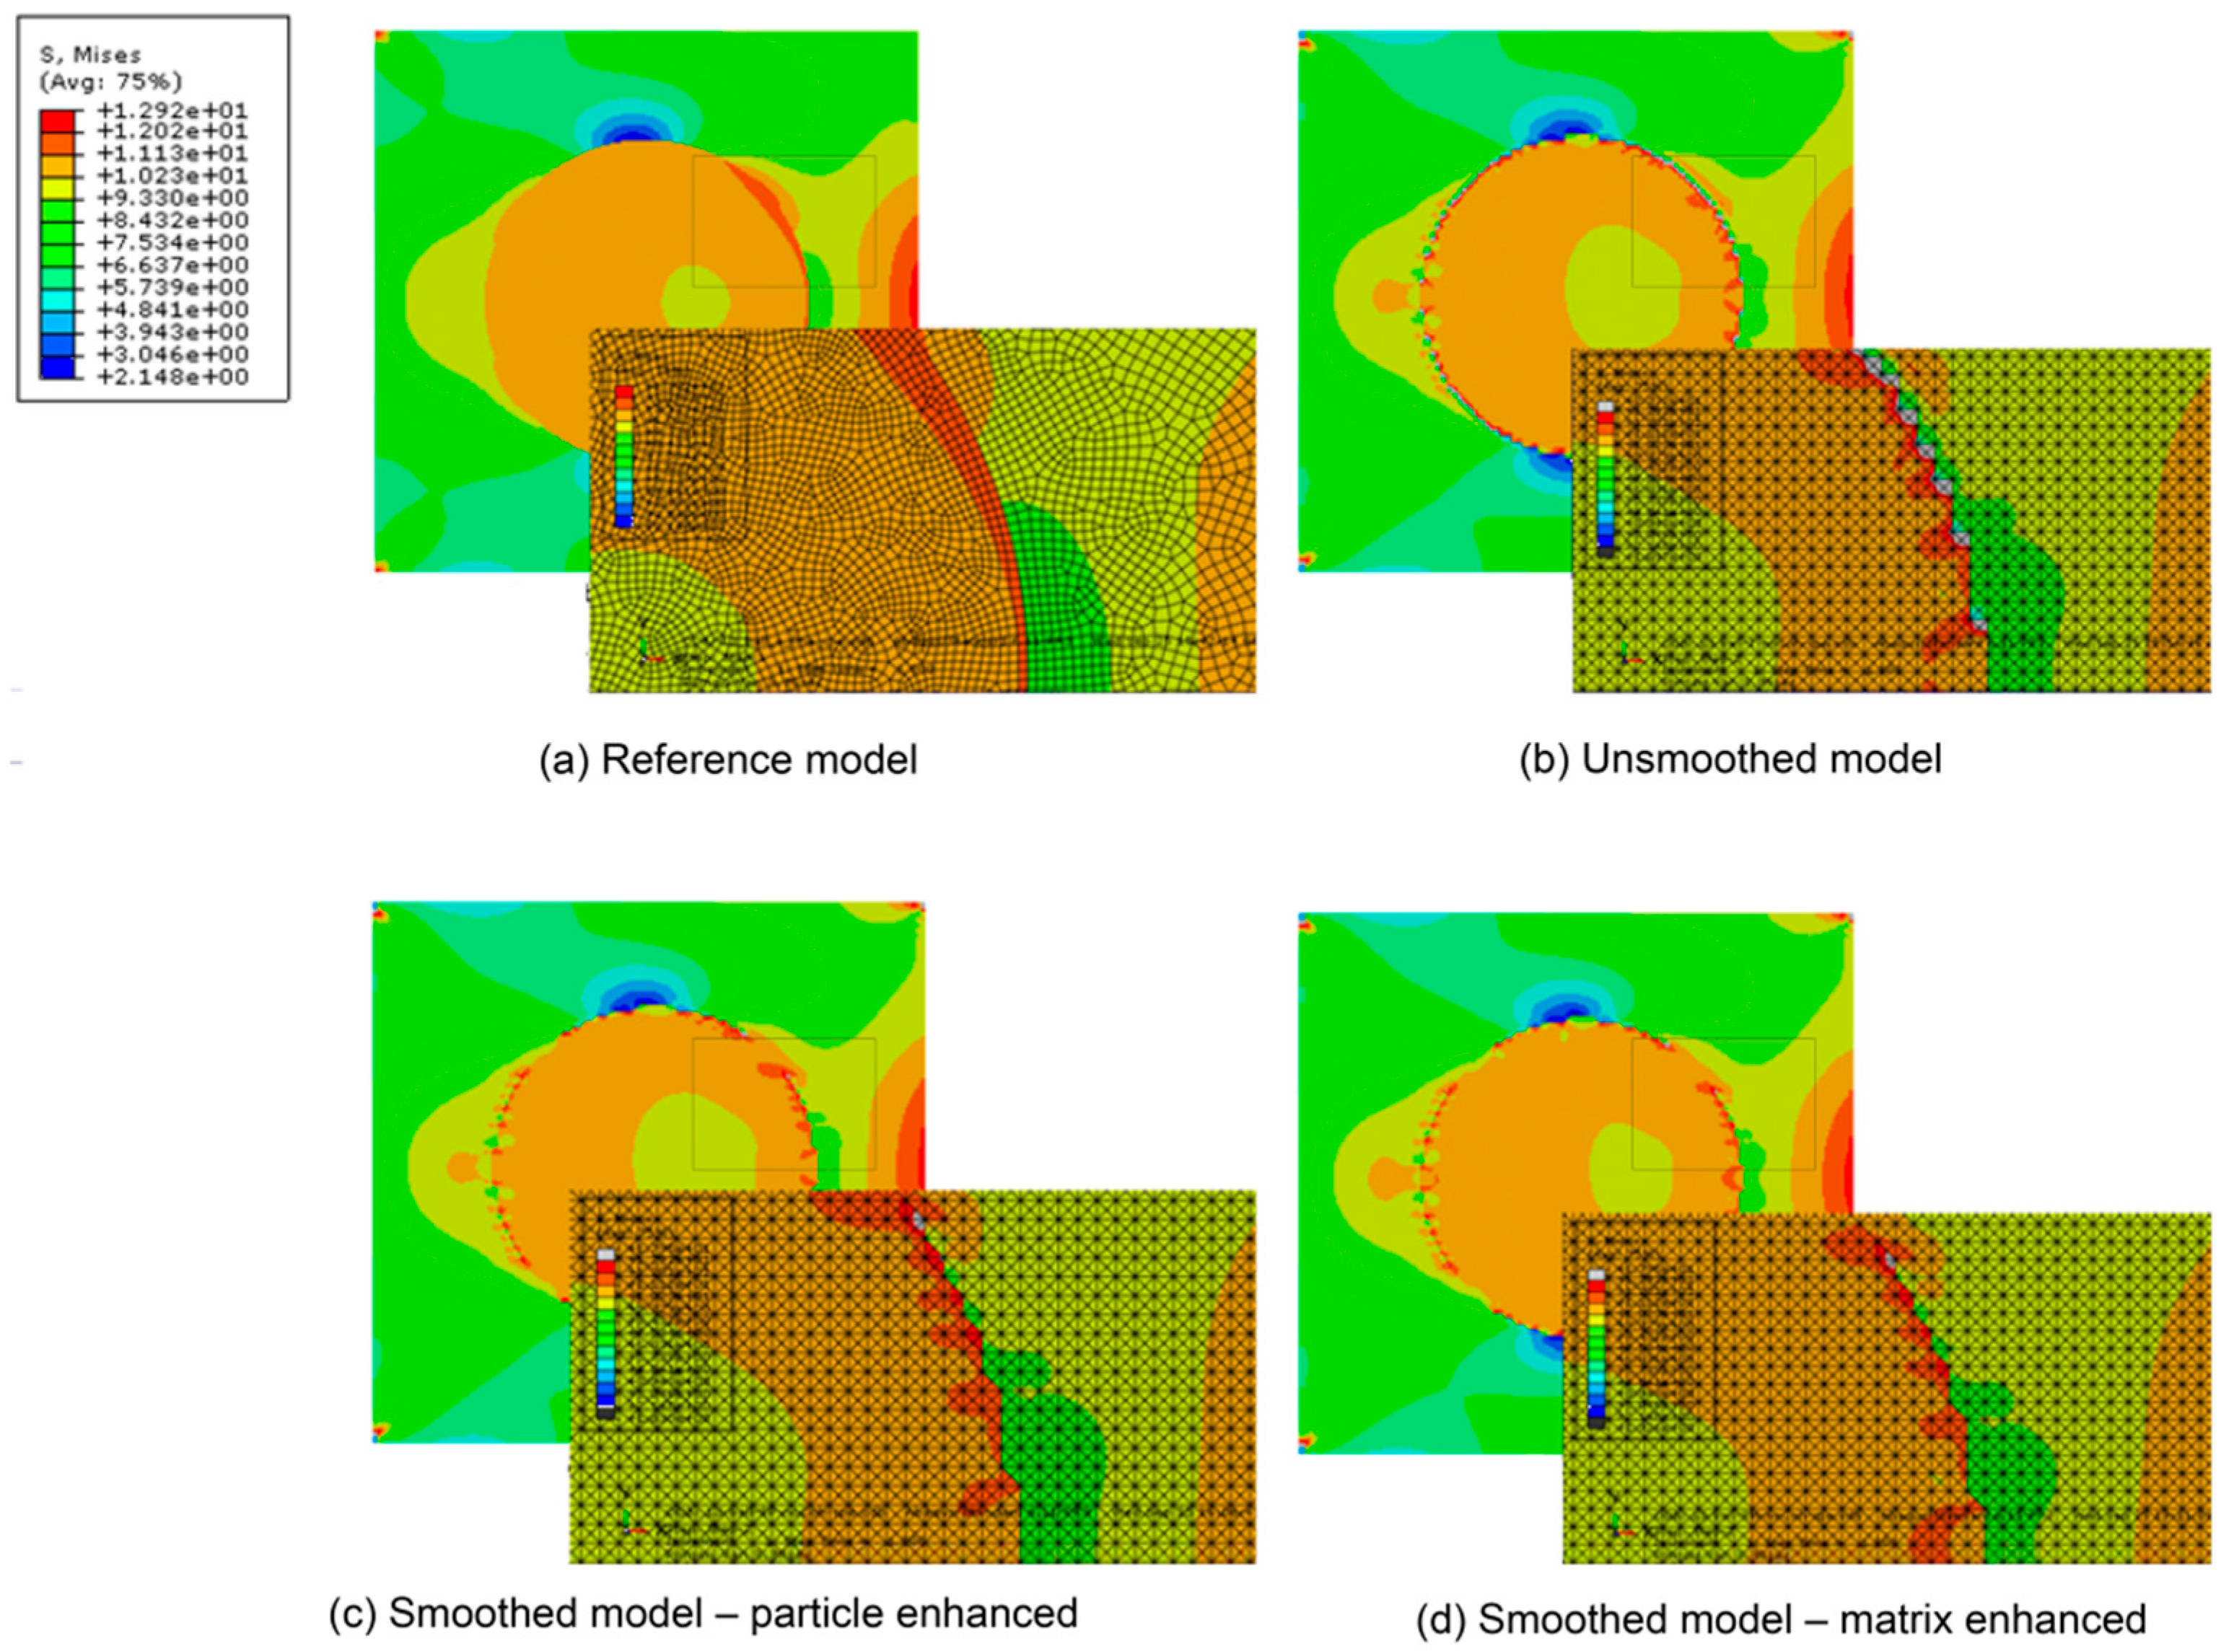
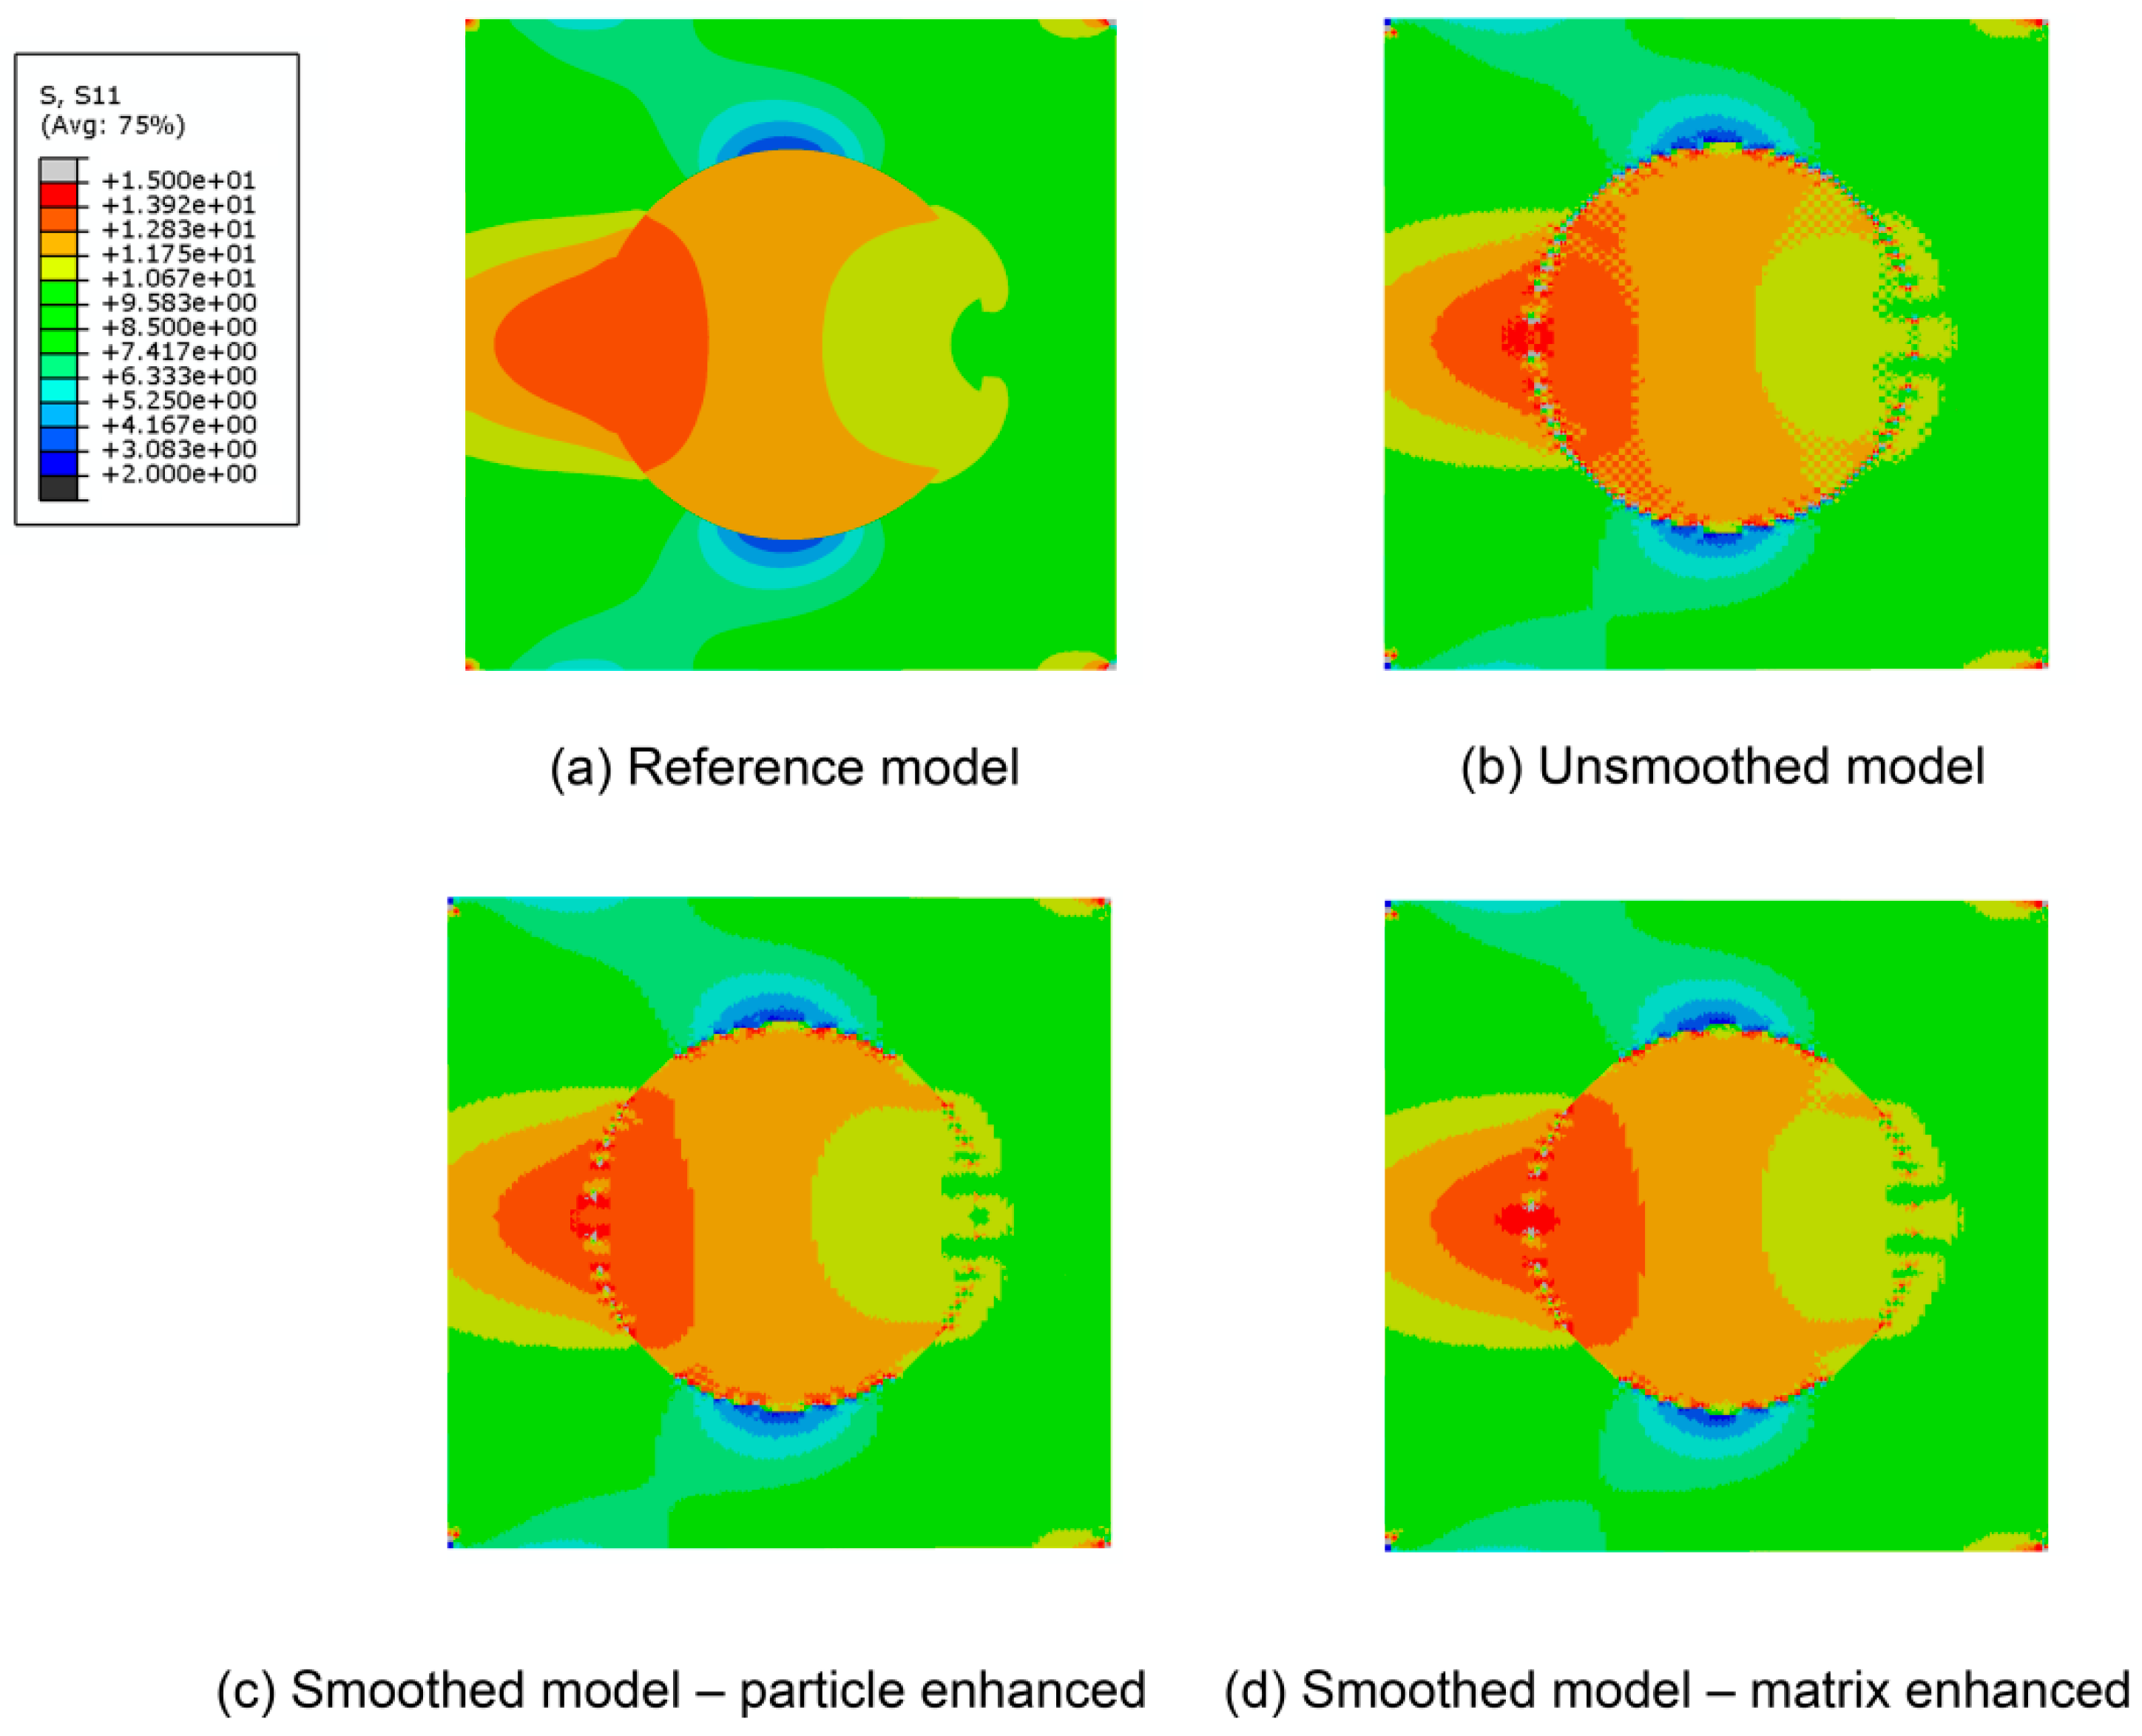
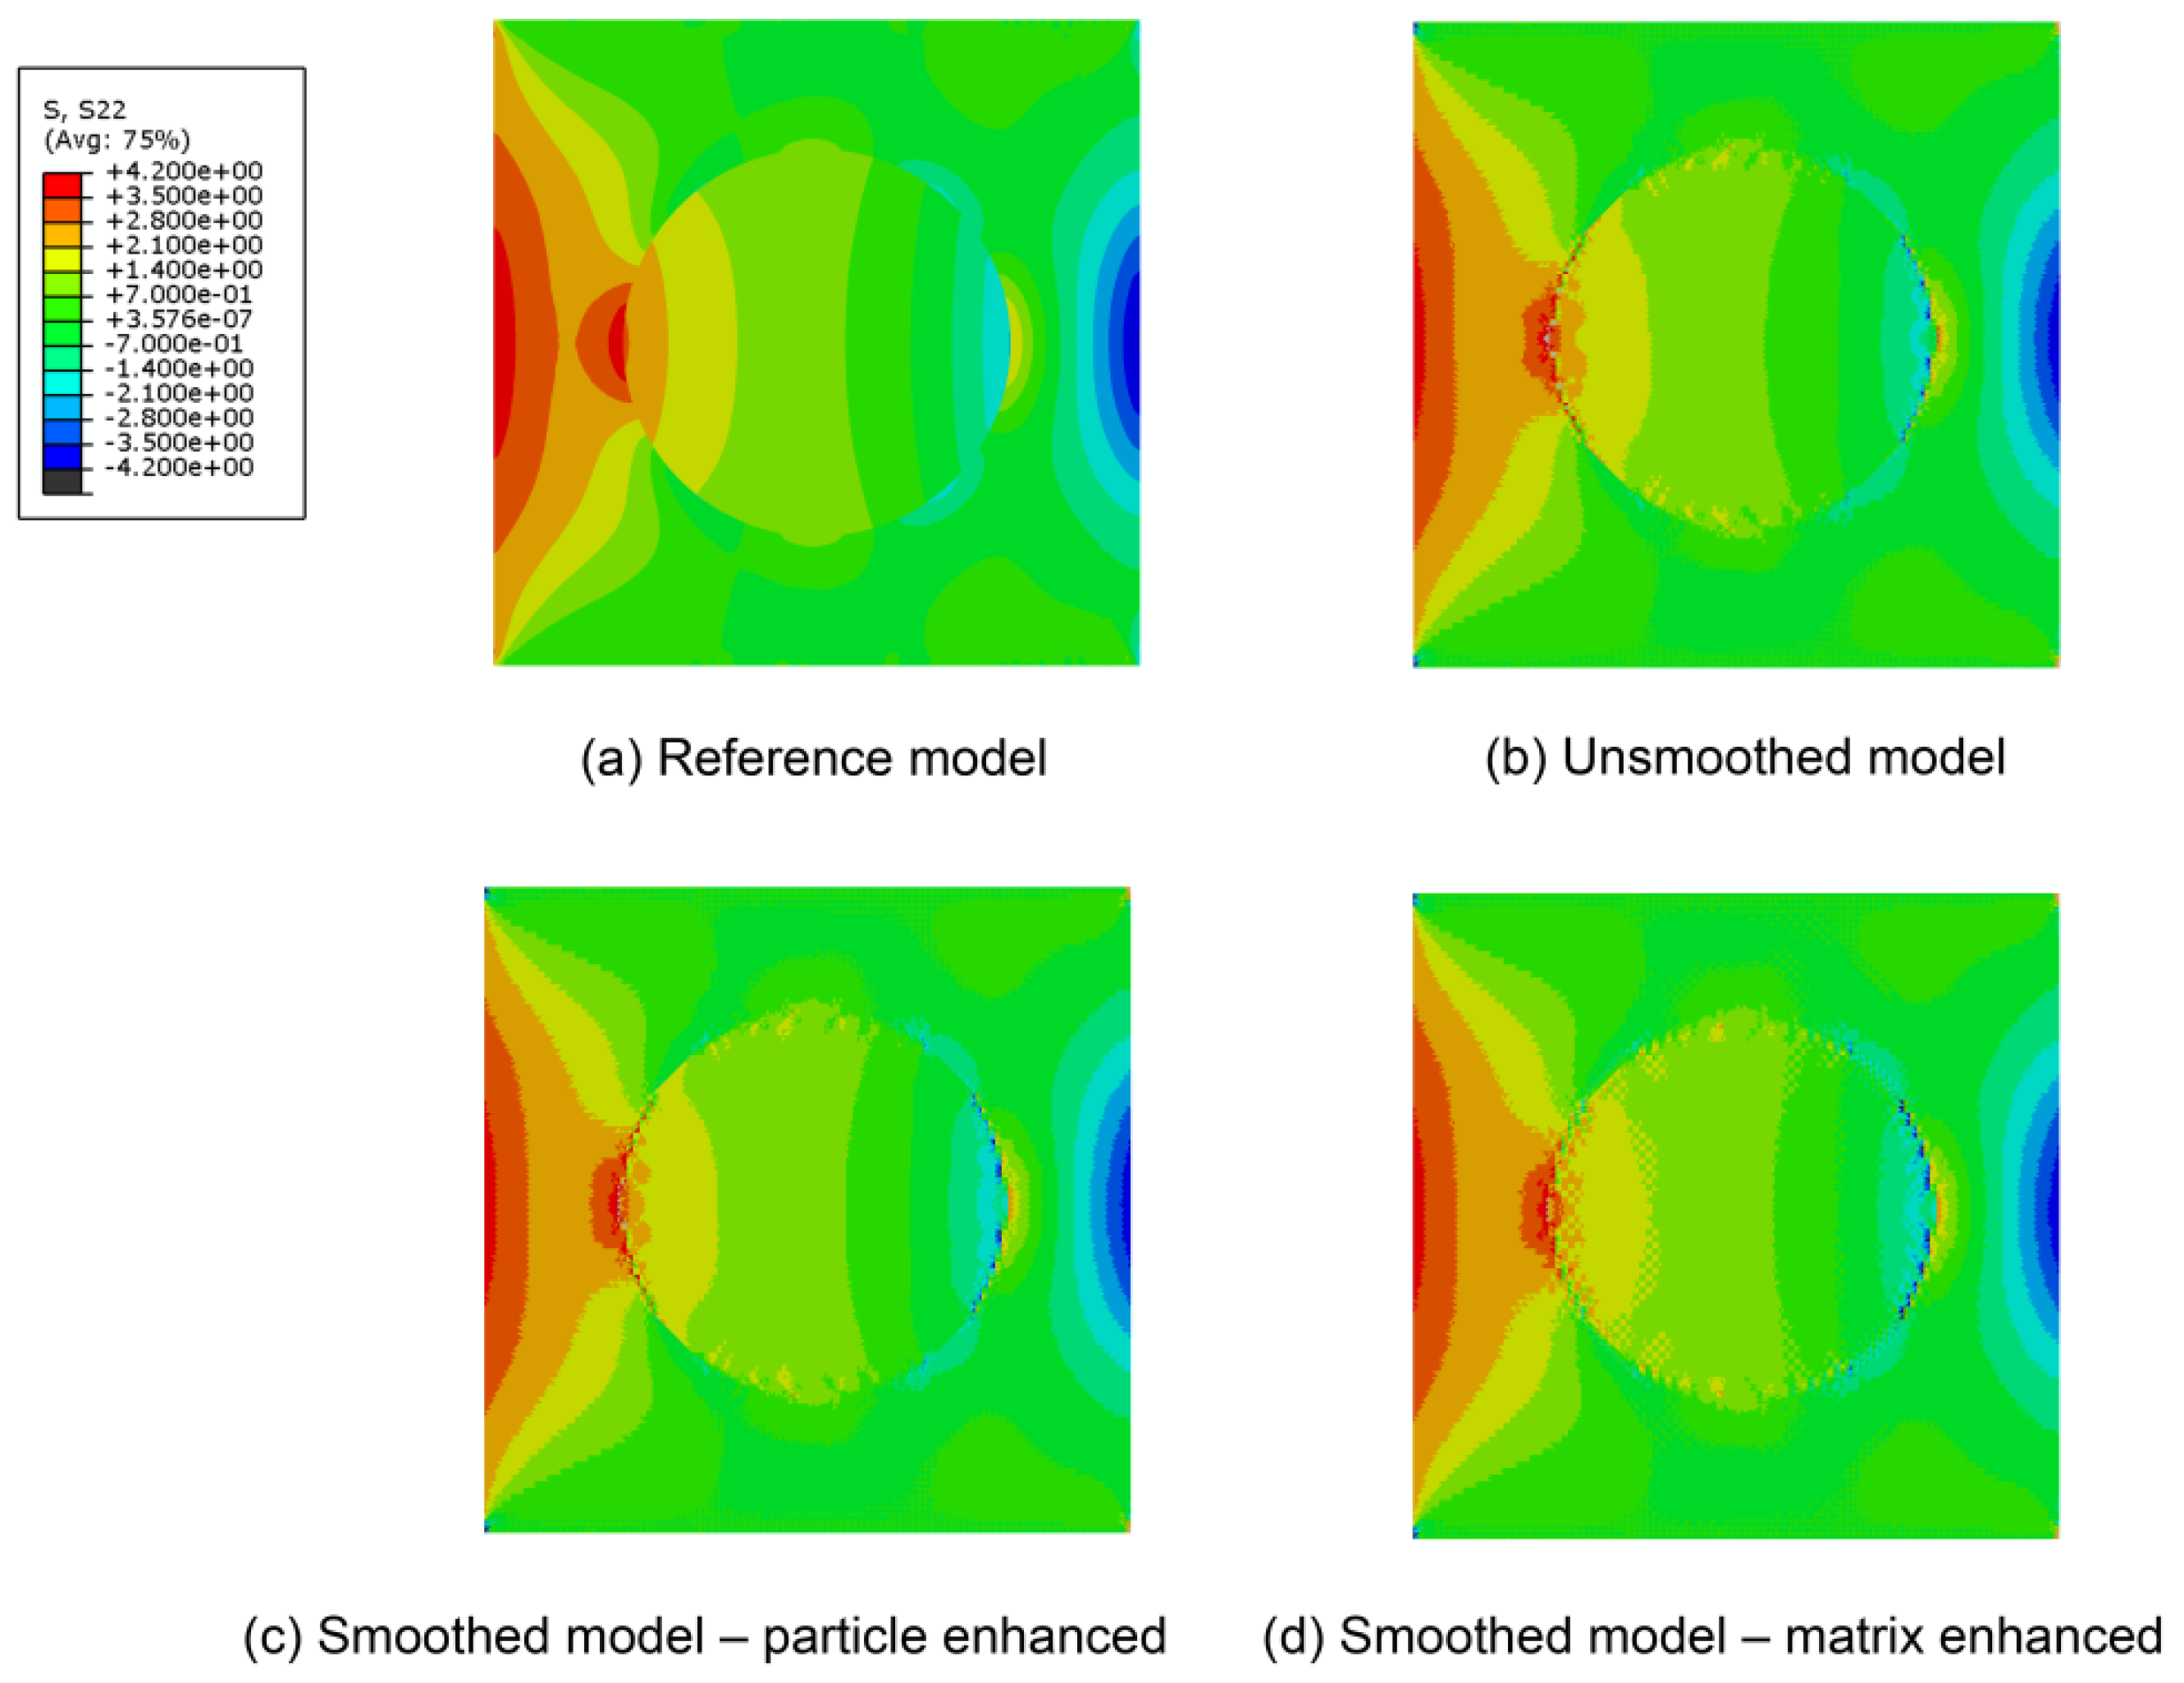
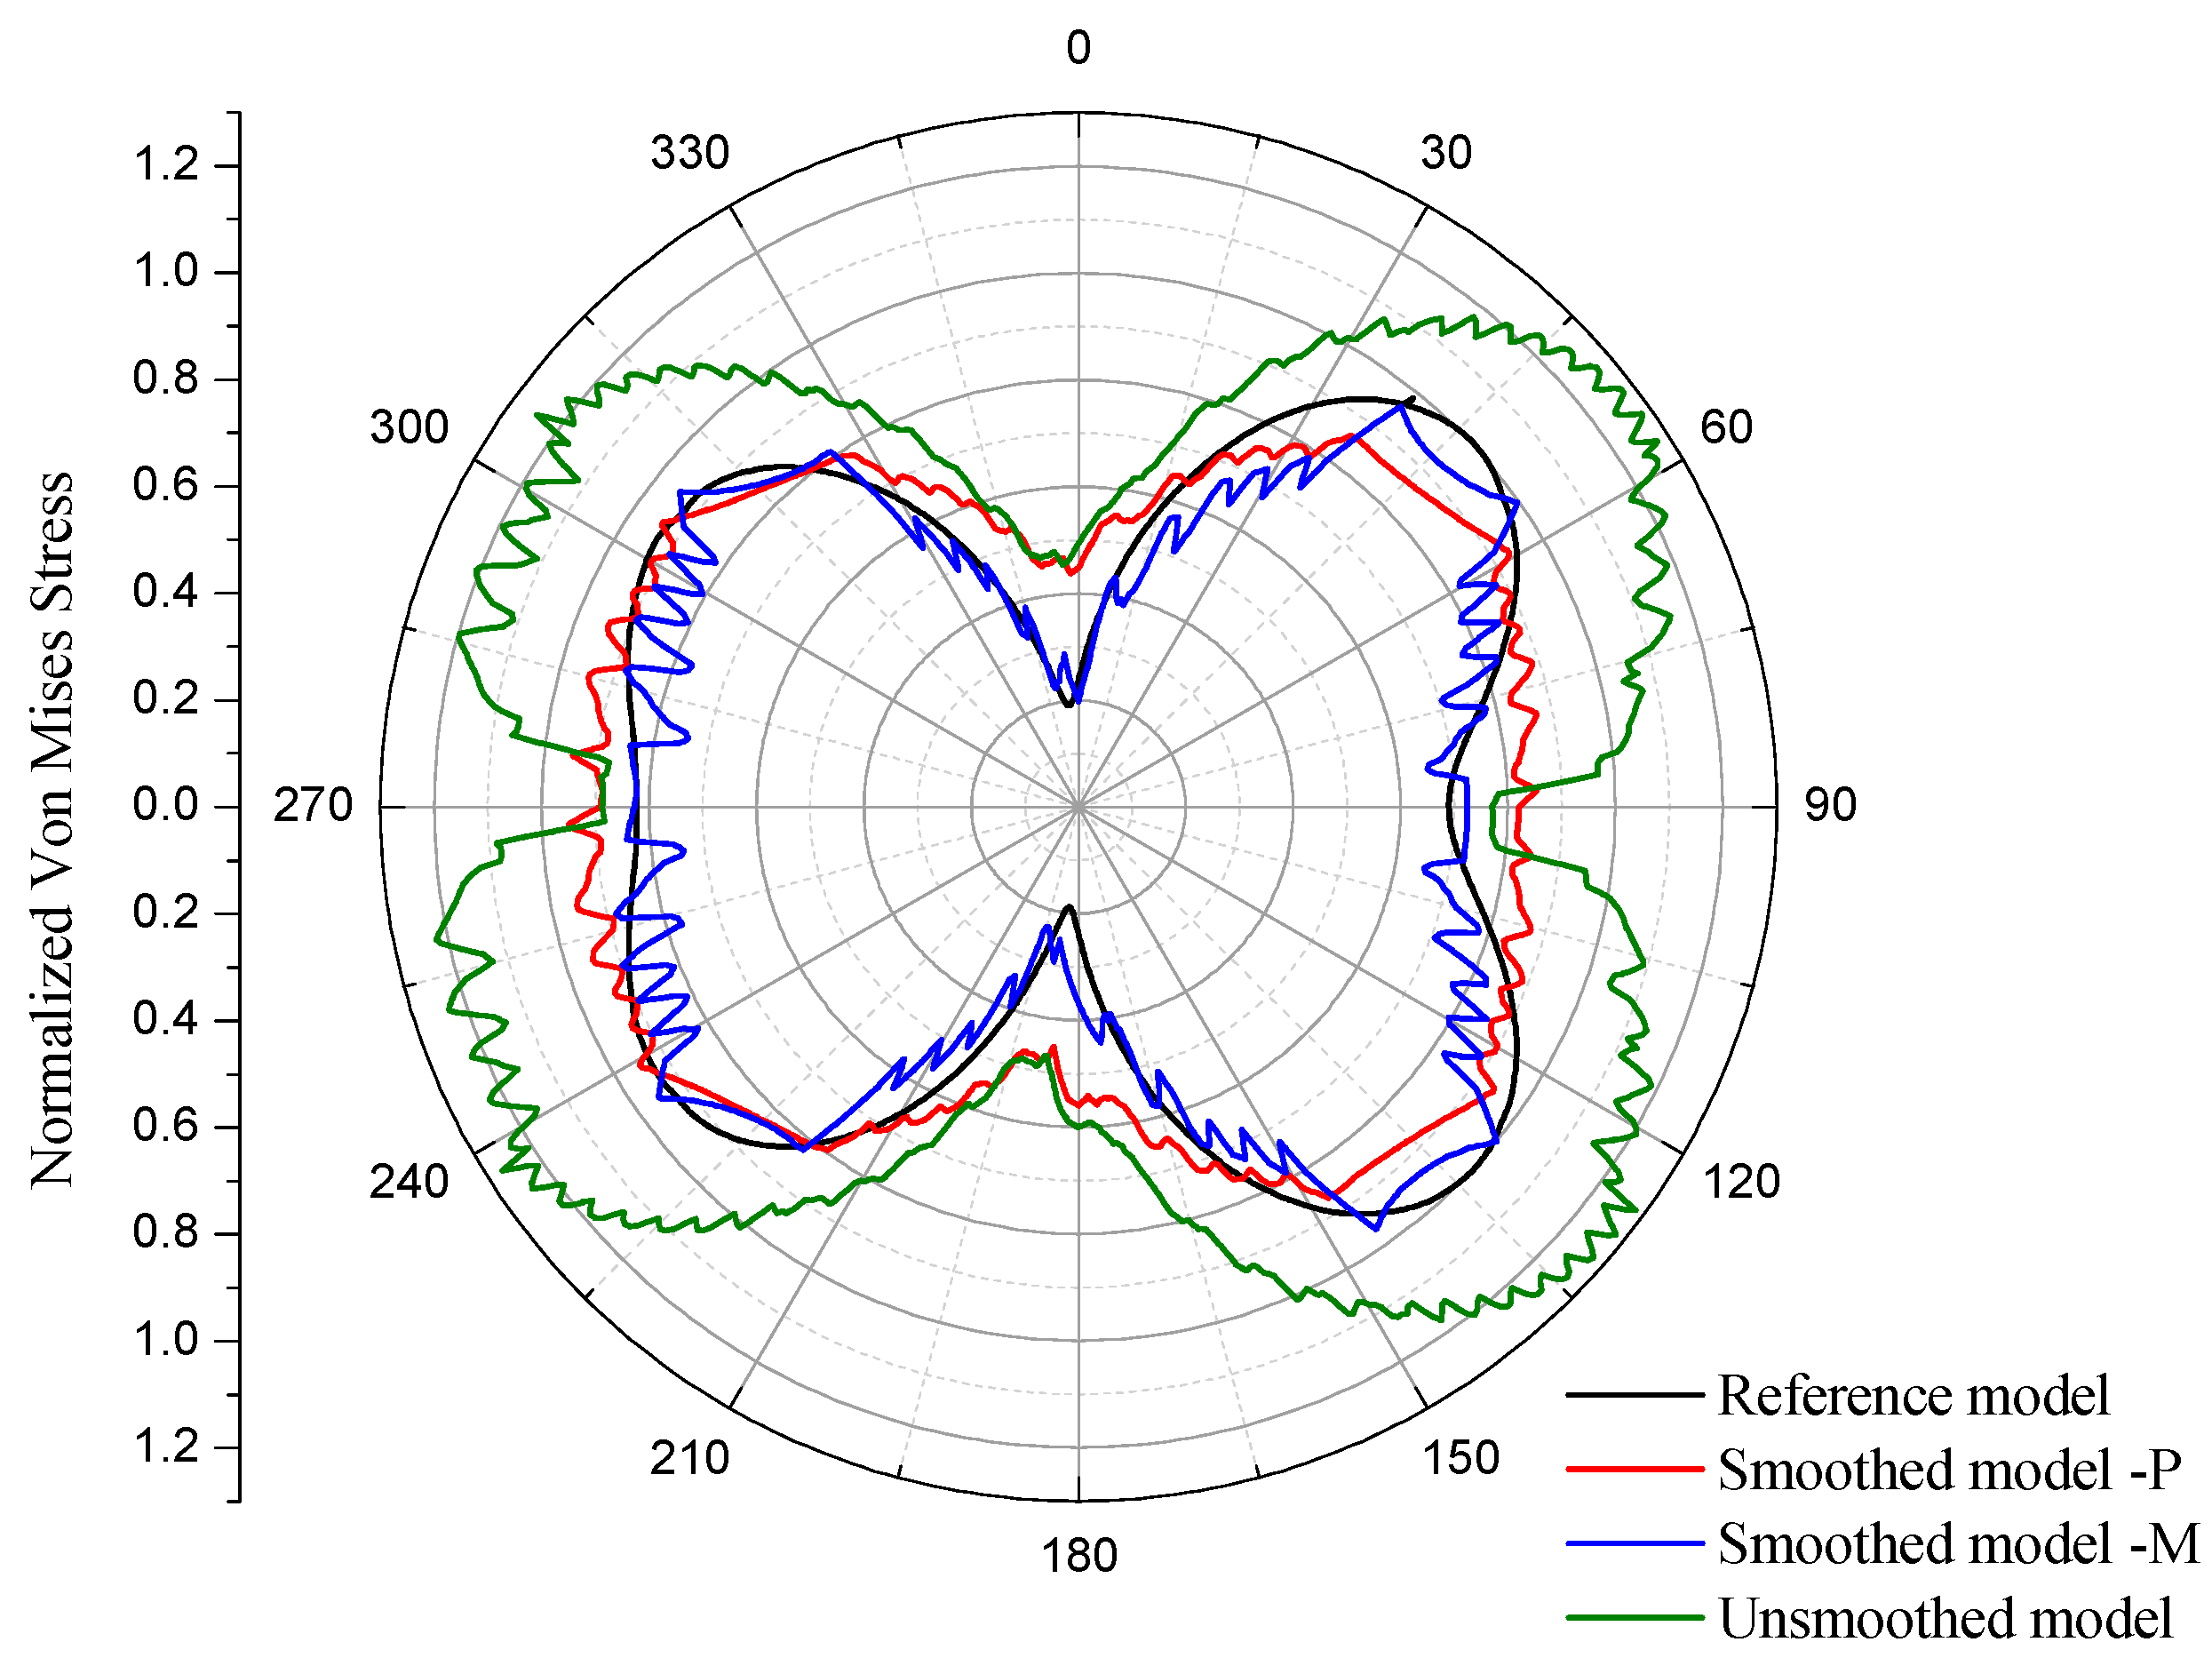
3.1. One Circular Particle Model

3.1.1. Models without the Consideration of Damage

To evaluate the effect of the smoothing method in the reconstruction, an FE model built in ABAQUS with finer mesh is adopted as the referenced model (shown in Figure 5a). Based on this model, the unsmoothed mesh (shown in Figure 5b), the smoothed model with a particle-enhanced mode (shown in Figure 5c) and the smoothed model with a matrix-enhanced mode (shown in Figure 5d) are generated. In the following sections, “Smoothed-P” and “Smoothed-M” represent the models with the particle-enhanced smooth mode and matrix-enhanced smooth mode, respectively. It can be observed in Figure 5 that the rough interfaces of unsmoothed model are effectively improved in the smoothed meshes. Moreover, the “Smoothed-P” model is more similar to the referenced model. The volume fractions of particles in different models are presented in Table 1. The referenced volume fraction is calculated as follows:
f r = π r 2 l 2 ,
where r represent the particle radius, and l represent the edge length of the model. The volume fractions of other models are calculated as follows:
f n = s p S ,
where S is the area of the whole model, and s p is the area of each particle element.
In the following analysis, all the freedoms of nodes on the left boundary is fixed, and a uniaxial tension loading along x+ direction is applied on the right boundary, as shown in Figure 6. The length of each edge is 1, and the maximum element size is 0.01. The reference model contains 11,500 linear quadrilateral elements, and the other models contain 40,000 linear triangular elements, respectively. The elastic modulus ratios of particle Ep to matrix Em is Ep/Em = 5.0, and the Poisson’s ratios of particle and matrix are 0.25. The static analysis is performed in ABAQUS to compare the stress distribution in these models.
The von Mises stress distributions and the detail views at interfaces for (a) the reference model, (b) the unsmoothed model, (c) the smoothed model—particle enhanced, (d) and the smoothed model—matrix enhanced are illustrated in Figure 7. Meanwhile, the x-directional stress distributions and y-directional ones are illustrated in Figure 8 and Figure 9, respectively. It can be observed that the overall stress contours in the smoothed and unsmoothed models all agree well with that in the referenced model. Meanwhile, the stress concentrations are observed at the particle/matrix interface in all models. Elements with stress values higher than the maximum values in the referenced model are colored gray. Obviously, there are much less gray elements in smoothed models than in the unsmoothed model.
In order to compare the stress at the interfaces directly, stresses are normalized by dividing the maximum value of von Mises stress in the referenced model as follows:
σ n = σ σ max r e f
where σ n is the normalized stress, σ is the original stress and σ max r e f is the maximum of von Mises stress in the referenced model.
The normalized von Mises stresses along the particle–matrix interface of these four models are illustrated in a polar coordinate system in Figure 10. The radial distances in these curves represent the normalized stress. It can be observed that the stresses in the unsmoothed model are very different to other ones. While the maximum in the smoothed models and the referenced one are around 1.0, the maximum in the unsmoothed model almost reaches 1.3, i.e., 30% higher than the referenced value. Moreover, at most regions along the interface, stress values in the unsmoothed model are much higher than those in the referenced model. However, the stress value in smoothed models (especially in the “Smoothed-P” model), agree well with the result in the referenced model.
The relative bigger stress values in the unsmoothed model are mainly caused by the rough meshes at interfaces. The comparison indicates that the smoothing method can reduce the artificial stress concentration caused by the jagged mesh at interface effectively. It should be notice that the reduction in artificial stress concentration is a positive effect for the local simulation (e.g., damage and fracture).

3.1.2. Models with the Consideration of Damage

Since the interface debonding is a main failure mode in particle-reinforced materials [23,24,25], the cohesive element framework [26,27] is adopted to represent the damage and failure occurrence in the interface. To evaluate the influence of the smoothing methods, cohesive elements with the same parameters are inserted at the interfaces. Moreover, boundary conditions are the same as those in the case without the consideration of damage, as shown in Figure 11. The simulations are performed on a server with Intel Xeon E5-2678W 3.10 GHz CPU and 256GB Memory. The reference model with 11,500 linear quadrilateral element and 188 cohesive elements takes around 5 min, and other models with 40,000 linear triangular elements and 240 cohesive elements take around 20 min, respectively.
The cracks due to debonding and the stress distributions for (a) the reference model, (b) the unsmoothed model, (c) the smoothed model—particle enhanced, (d) and the smoothed model—matrix enhanced are illustrated in Figure 8. It can be observed that the debonding of interface occurred at both sides of the particles. Since the shape of the particle is circular, the radian of the debonding crack is used to evaluate the level of damage in each model. The radians of the crack regions and relative errors to the referenced model are illustrated in Table 2. It can be observed that errors in the “Smoothed–P” model are around 1%, but in the case of the unsmoothed model it reaches 14% and 19%, respectively. This indicates that the jagged meshes at interface have restricted the propagations of debonding cracks. As well as in the model without the consideration of damage in the above section, the “Smoothed–P” model performs better than the “Smoothed–M” model.

4. Application in Polymer Binder Explosive Model

Polymer binder explosive is a special particle-reinforced material with polymeric matrix and crystal particles. Some researches [10,23] indicate that the sizes, shapes, and distributions of particles influence the damage growing. Therefore, an accurate image-based reconstruction method is very significant for investigating damage following. In this section, the unsmoothed and “smoothed-P” models are adopted to simulate the damage state of this material under quasi-static loading. A digital image in Ref. [24] is utilized to reconstruct the FE model, as shown in Figure 12. The material parameters and cohesive elements’ properties are according to Ref. [10].
Here, the damage increase is evaluated by the total length of cracks. For convenience, the total length in each model is normalized by dividing the whole interface length. The normalized lengths of cracks at different time are illustrated in Figure 13. It can be observed that at the beginning of the crack initiation, the crack length represented by the unsmoothed model is longer than that in smoothed one. This is because, in the unsmoothed model, the bigger level of stress concentration leads to earlier crack initiations. However, with the growth of cracks, the total crack length in the smoothed model becomes greater than that in the unsmoothed one.
The cracks due to debonding at the end of the simulation are shown in Figure 14. It can be observed that not only the crack lengths in these two models are different but also the distributions of the cracks are different. The cracks in the unsmoothed model are more dispersive than that in the smoothed model. According to the above analysis, cracks initiated relatively more easily in the unsmoothed model due to the stress concentrations. However, the rough boundary in the unsmoothed model provides more resistance during the crack propagation. Since the initiated cracks cannot fully propagate, many dispersive cracks appear in the unsmoothed model. Meanwhile, once cracks initiate in the smoothed model, they can fully propagate with less external resistance caused by the rough meshes. Therefore, the simulations with the smoothed models are closer to the actual conditions than unsmoothed ones.

5. Conclusions

In this paper, a double-smoothing image-based reconstruction method for cohesive finite element is proposed. In the present method, two independent smoothing processes are performed to repair the rough meshes in the pixel/voxel-based reconstruction method. The comparison between the unsmoothed model, the referenced model, and the smoothed models is performed in a simple model. The result indicates that the present method improved the quality of the finite element meshes effectively. In particular, the results in the particle-enhanced smoothed model agree well with those in the referenced one. Meanwhile, the artificial resistance due to the jagged element is reduced with the double-smoothing cohesive finite element framework during the crack propagation. Therefore, the particle-enhanced smoothed model is recommended in the simulation of particle-reinforced materials.
Furthermore, smoothed and unsmoothed cohesive finite element frameworks are used to analyze the damage growing in particle-reinforced materials. It can be observed that the artificial resistance due to the jagged element is reduced with the double-smoothing cohesive finite element framework. Therefore, the uses of smoothed models are necessary and will provide more realistic results when the damages evolution are concerned.

Author Contributions

Conceptualization, L.G. and Y.Z.; methodology, X.B.; software, F.X.; validation, K.S., H.X. and X.M.; formal analysis, X.B.; investigation, X.M.; resources, H.X.; data curation, K.S.; writing—original draft preparation, X.B.; writing—review and editing, X.M.; visualization, X.B.; supervision, L.G.; project administration, Y.Z.; funding acquisition, F.X. All authors have read and agreed to the published version of the manuscript.

Funding

This research was funded by National Science Foundation of China (NSFC No.11905215).

Conflicts of Interest

The authors declare no conflict of interest.

References

  1. Ahmed, S.; Jones, F. A review of particulate reinforcement theories for polymer composites. J. Mater. Sci. 1990, 25, 4933–4942. [Google Scholar] [CrossRef]
  2. Ibrahim, I.; Mohamed, F.; Lavernia, E. Particulate reinforced metal matrix composites—A review. J. Mater. Sci. 1991, 26, 1137–1156. [Google Scholar] [CrossRef]
  3. Keiser, D.D.; Robinson, A.B.; Jue, J.-F.; Medvedev, P.; Wachs, D.M.; Finlay, M.R. Microstructural development in irradiated U-7Mo/6061 Al alloy matrix dispersion fuel. J. Nucl. Mater. 2009, 393, 311–320. [Google Scholar] [CrossRef]
  4. Cebral, J.R.; Löhner, R. From medical images to anatomically accurate finite element grids. Int. J. Numer. Methods Eng. 2001, 51, 985–1008. [Google Scholar] [CrossRef]
  5. Chawla, N.; Chawla, K. Microstructure-based modeling of the deformation behavior of particle reinforced metal matrix composites. J. Mater. Sci. 2006, 41, 913–925. [Google Scholar] [CrossRef]
  6. Babout, L.; Maire, E.; Fougeres, R. Damage initiation in model metallic materials: X-ray tomography and modelling. Acta Mater. 2004, 52, 2475–2487. [Google Scholar] [CrossRef]
  7. Bhattacharyya, A.; El-Danaf, E.; Kalidindi, S.R.; Doherty, R.D. Evolution of grain-scale microstructure during large strain simple compression of polycrystalline aluminum with quasi-columnar grains: OIM measurements and numerical simulations. Int. J. Plast. 2001, 17, 861–883. [Google Scholar] [CrossRef]
  8. Terada, K.; Miura, T.; Kikuchi, N. Digital image-based modeling applied to the homogenization analysis of composite materials. Comput. Mech. 1997, 20, 331–346. [Google Scholar] [CrossRef]
  9. Galindez, J.M.; Molinero, J. Assessment of the long-term stability of cementitious barriers of radioactive waste repositories by using digital-image-based microstructure generation and reactive transport modelling. Cem. Concr. Res. 2010, 40, 1278–1289. [Google Scholar] [CrossRef]
  10. Barua, A.; Zhou, M. A Lagrangian framework for analyzing microstructural level response of polymer-bonded explosives. Model. Simul. Mater. Sci. Eng. 2011, 19, 055001. [Google Scholar] [CrossRef]
  11. Guo, H.; Ooi, E.; Saputra, A.; Yang, Z.; Natarajan, S.; Ooi, E.; Song, C. A quadtree-polygon-based scaled boundary finite element method for image-based mesoscale fracture modelling in concrete. Eng. Fract. Mech. 2019, 211, 420–441. [Google Scholar] [CrossRef]
  12. Trawiński, W.; Tejchman, J.; Bobiński, J. A three-dimensional meso-scale modelling of concrete fracture, based on cohesive elements and X-ray μCT images. Eng. Fract. Mech. 2018, 189, 27–50. [Google Scholar] [CrossRef]
  13. Trawiński, W.; Bobiński, J.; Tejchman, J. Two-dimensional simulations of concrete fracture at aggregate level with cohesive elements based on X-ray μCT images. Eng. Fract. Mech. 2016, 168, 204–226. [Google Scholar] [CrossRef]
  14. Saputra, A.; Talebi, H.; Tran, D.; Birk, C.; Song, C. Automatic image-based stress analysis by the scaled boundary finite element method. Int. J. Numer. Methods Eng. 2017, 109, 697–738. [Google Scholar] [CrossRef]
  15. Ren, W.; Yang, Z.; Sharma, R.; Zhang, C.; Withers, P.J. Two-dimensional X-ray CT image based meso-scale fracture modelling of concrete. Eng. Fract. Mech. 2015, 133, 24–39. [Google Scholar] [CrossRef]
  16. Lian, W.-D.; Legrain, G.; Cartraud, P. Image-based computational homogenization and localization: Comparison between X-FEM/levelset and voxel-based approaches. Comput. Mech. 2013, 51, 279–293. [Google Scholar] [CrossRef] [Green Version]
  17. Zhou, W.; Tang, L.; Liu, X.; Ma, G.; Chen, M. Mesoscopic simulation of the dynamic tensile behaviour of concrete based on a rate-dependent cohesive model. Int. J. Impact Eng. 2016, 95, 165–175. [Google Scholar] [CrossRef]
  18. Lengsfeld, M.; Schmitt, J.; Alter, P.; Kaminsky, J.; Leppek, R. Comparison of geometry-based and CT voxel-based finite element modelling and experimental validation. Med. Eng. Phys. 1998, 20, 515–522. [Google Scholar] [CrossRef]
  19. Montero-Chacón, F.; Marín-Montín, J.; Medina, F. Mesomechanical characterization of porosity in cementitious composites by means of a voxel-based finite element model. Comput. Mater. Sci. 2014, 90, 157–170. [Google Scholar] [CrossRef]
  20. Sanz-Herrera, J.; Garcia Aznar, J.M.; Doblaré, M. Micro–macro numerical modelling of bone regeneration in tissue engineering. Comput. Methods Appl. Mech. Eng. 2008, 197, 3092–3107. [Google Scholar] [CrossRef]
  21. Bright, D.S.; Steel, E.B. Two-Dimensional Top Hat Filter for Extracting Spots and Spheres from Digital Images. J. Microsc. 1987, 146, 191–200. [Google Scholar] [CrossRef]
  22. Wiener, N. Extrapolation, Interpolation, and Smoothing of Stationary Time Series; Wiley: New York, NY, USA, 1949. [Google Scholar]
  23. Rae, P.J.; Goldrein, H.T.; Palmer, S.J.P.; Field, J.E.; Lewis, A.L. Quasi-static studies of the deformation and failure of beta-HMX based polymer bonded explosives. Proc. R. Soc. Lond. Ser. A Math. Phys. Eng. Sci. 2002, 458, 743–762. [Google Scholar] [CrossRef]
  24. Rae, P.J.; Palmer, S.J.P.; Goldrein, H.T.; Field, J.E.; Lewis, A.L. Quasi-static studies of the deformation and failure of PBX 9501. Proc. R. Soc. Lond. Ser. A Math. Phys. Eng. Sci. 2002, 458, 2227–2242. [Google Scholar] [CrossRef]
  25. Montero-Chacón, F.; Zaghi, S.; Rossi, R.; Garc’ia-Pérez, E.; Heras, I.; Martinez, X.; Oller, S.; doblaré, M. Multiscale thermo-mechanical analysis of multi-layered materials in solar thermal applications. Finite Elem. Anal. Des. 2017, 127, 1–28. [Google Scholar] [CrossRef] [Green Version]
  26. Xu, X.P.; Needleman, A. Numerical simulations of dynamic crack growth along an interface. Int. J. Fract. 1996, 74, 289–324. [Google Scholar] [CrossRef]
  27. Xu, X.P.; Needleman, A. Numerical Simulations of Fast Crack-Growth in Brittle Solids. J. Mech. Phys. Solids 1994, 42, 1397–1434. [Google Scholar] [CrossRef]
Figure 1. Flow chart of smooth processing in digital image.
Mathematics 08 00543 g001
Figure 2. Schematic of the one-to-four mapping method.
Mathematics 08 00543 g002
Figure 3. Two smoothing mode with the enhancement of particle or matrix.
Mathematics 08 00543 g003
Figure 4. Schematic and pseudocode of the smoothing algorithm.
Mathematics 08 00543 g004
Figure 5. Comparison of four mesh modes: (a) reference model; (b) unsmoothed model; (c) smoothed model-particle enhanced; (d) smoothed model-matrix enhanced.
Mathematics 08 00543 g005
Figure 6. Boundary condition and loading.
Mathematics 08 00543 g006
Figure 7. Von Mises stress distributions and details at interfaces: (a) reference model; (b) unsmoothed model; (c) smoothed model-particle enhanced; (d) smoothed model-matrix enhanced.
Mathematics 08 00543 g007
Figure 8. x-directional stress distributions: (a) reference model; (b) unsmoothed model; (c) smoothed model-particle enhanced; (d) smoothed model-matrix enhanced.
Mathematics 08 00543 g008
Figure 9. y-directional stress distributions: (a) reference model; (b) unsmoothed model; (c) smoothed model-particle enhanced; (d) smoothed model-matrix enhanced.
Mathematics 08 00543 g009
Figure 10. Normalized von Mises at the interfaces of the four models.
Mathematics 08 00543 g010
Figure 11. Cracks due to debonding and von Mises stress distributions: (a) reference model; (b) unsmoothed model; (c) smoothed model-particle enhanced; (d) smoothed model-matrix enhanced.
Mathematics 08 00543 g011
Figure 12. Boundary and loading conditions and detail meshes of the finite element (FE) model.
Mathematics 08 00543 g012
Figure 13. Normalized lengths of cracks in smoothed and unsmoothed model.
Mathematics 08 00543 g013
Figure 14. Cracks due to debonding in the unsmoothed and smoothed model under uniaxial tension: (a) unsmoothed model; (b) smoothed model.
Mathematics 08 00543 g014
Table 1. Volume fractions of particles in different models.
ReferencedUnsmoothedSmoothed-PSmoothed-M
The volume fraction of particle (%)28.2727.5627.1827.92
Table 2. Radians of the debonding cracks.
Radian of the Cracks (Degree)Errors (%)
Left SideRight SideLeft SideRight Side
Referenced model91.5770.1700
Unsmoothed model73.7459.9614.5419.47
Smoothed–P model92.7371.081.291.26
Smoothed–M model87.2165.247.034.77

