Article

Pattern Recognition in Epileptic EEG Signals via Dynamic Mode Decomposition

1
Chubu University Academy of Emerging Sciences, Chubu University, Kasugai, Aichi 487-8501, Japan
2
Department of Mathematics, Texas State University, San Marcos, TX 78666, USA
3
Department of Epilepsy, Movement Disorders and Physiology, Kyoto University Graduate School of Medicine, 54 Shogoin Kawahara-cho, Sakyo-ku, Kyoto 606-8507, Japan
4
Division of Neurology, Kobe University Graduate School of Medicine, Kobe, Hyogo 650-0017, Japan
5
Department of Neurosurgery, Kyoto University Graduate School of Medicine, 54 Shogoin Kawahara-cho, Sakyo-ku, Kyoto 606-8507, Japan
6
Department of Mathematics, College of Engineering and Technology, American University of the Middle East, Egaila, Kuwait
*
Author to whom correspondence should be addressed.
Mathematics 2020, 8(4), 481; https://doi.org/10.3390/math8040481
Submission received: 22 January 2020 / Revised: 22 February 2020 / Accepted: 24 February 2020 / Published: 1 April 2020
(This article belongs to the Section Dynamical Systems)

Abstract

:
In this paper, we propose a new method based on the dynamic mode decomposition (DMD) to find a distinctive contrast between the ictal and interictal patterns in epileptic electroencephalography (EEG) data. The features extracted from the method of DMD clearly capture the phase transition of a specific frequency among the channels corresponding to the ictal state and the channel corresponding to the interictal state, such as direct current shift (DC-shift or ictal slow shifts) and high-frequency oscillation (HFO). By performing classification tests with Electrocorticography (ECoG) recordings of one patient measured at different timings, it is shown that the captured phenomenon is the unique pattern that occurs in the ictal onset zone of the patient. We eventually explain how advantageously the DMD captures some specific characteristics to distinguish the ictal state and the interictal state. The method presented in this study allows simultaneous interpretation of changes in the channel correlation and particular information for activity related to an epileptic seizure so that it can be applied to identification and prediction of the ictal state and analysis of the mechanism on its dynamics.

1. Introduction

Epilepsy is a neurological condition in which patients suffer spontaneous seizures. The seizure is caused by disturbances in the electrical activity of the brain. As proposed in [1], an epileptic seizure is a transient occurrence of signs and/or symptoms due to abnormal, excessive, and synchronous neuronal activity in the brain. Correctly identifying the presence of epileptic activity, characterizing the spatio-temporal patterns of the corresponding brain activity, and predicting the occurrence of seizures are major challenges, and achieving this could significantly improve the quality of life for patients with epilepsy.
Electroencephalogram (EEG) including electrocorticogram (ECoG) is the prime signal that has been widely used for the diagnosis of epilepsy (see, for example, [2]). It is an accurate tool for the identification of various types of abnormalities in the brain. An epileptic seizure is one of those complex abnormalities detected by EEG. A vast number of methods have been developed for automatic detection of seizures from EEG recordings (see [3,4,5]). Extracting features that best describe the behavior of EEGs is of great importance for automatic seizure detection systems’ performance.
It is reported that the epileptic zone may be localized by the abnormal signal pattern of the high-frequency domain so-called persistent high-frequency oscillations (HFOs) [2,6,7]. However, using conventional transformation algorithms to extract features from the EEG signals does not guarantee a high accuracy being achieved [8,9].
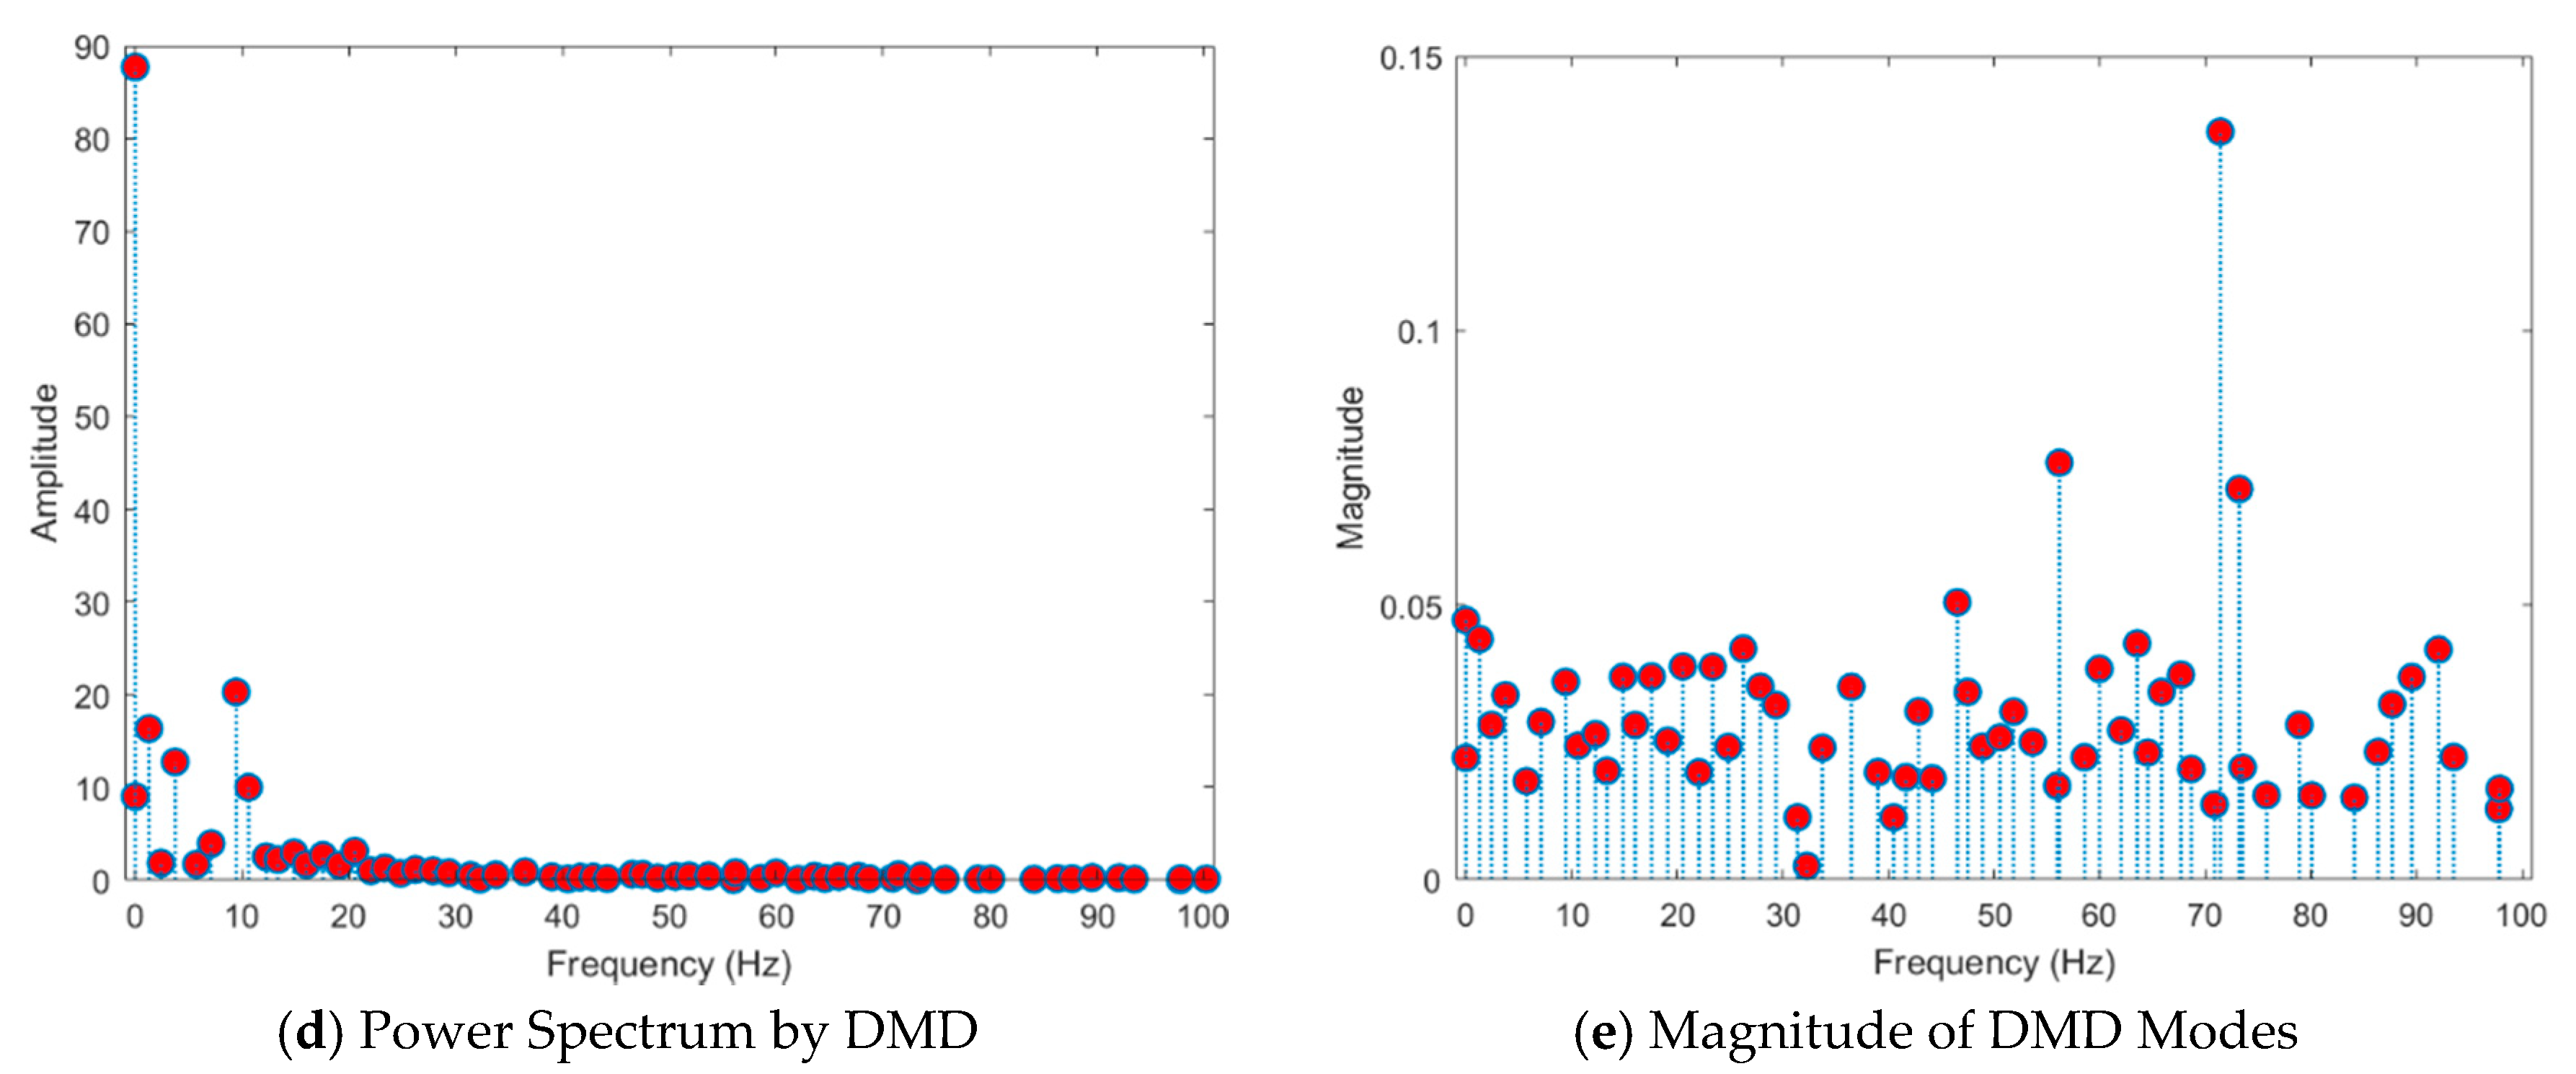
Figure 1b,c exhibit the power spectrum of the signal from a specific channel in which DC shift and HFO occur right before the seizure, and for comparison, Figure 1d shows the magnitude of the DMD mode of the same signal. While the DMD mode can easily identify the singularity of the high-frequency domain, most of the methods based on the power spectrum have some difficulty in making intuitive judgments of the existence of the singularity because the measured energy is relatively small compared to the low frequency. In other words, in the analysis using the power spectrum, it is difficult to visually identify the HFO interval having a relatively small magnitude (or amplitude). However, the magnitude of the DMD mode allows you to visually identify specific frequency bands with abnormal phase transitions whether or not it is in the high frequency.
The Kuramoto model, which explains the synchronization phenomena of the oscillation of coupled signals, analyzes brain connectivity and dynamics [11]. This synchronization phenomenon can be confirmed by comparing the phase difference of a specific frequency band between interacting signals. According to recent research, oscillation amplitudes do not reveal the coordination or communication of neuronal activity across brain regions. In contrast, the phase of an oscillation, which indicates the position of the signal within a given oscillation cycle, has been shown to be critical in the coordination of anatomically distributed processing [12]. Therefore, there has currently been an urgent need for a new analysis tool that can detect the phase transition of high-frequency bands for each condition appearing between the cerebral regions.
A newly developed method based on dynamic mode decomposition (DMD) has been proposed in recent years to extract features from EEG data [13,14]. The phase differences between channels corresponding to each frequency are approximated by the DMD as the form of ‘modes’ corresponding to the signals [15]. As shown in Figure 1, one of the main advantages of DMD is that these modes are provided in linearly independent normalized vectors so that patterns of the phase (i.e., imaginary of mode entries) and its magnitudes (i.e., absolute values of mode entries) in banded high frequencies can be clearly detected as patterns in low-frequency mode.
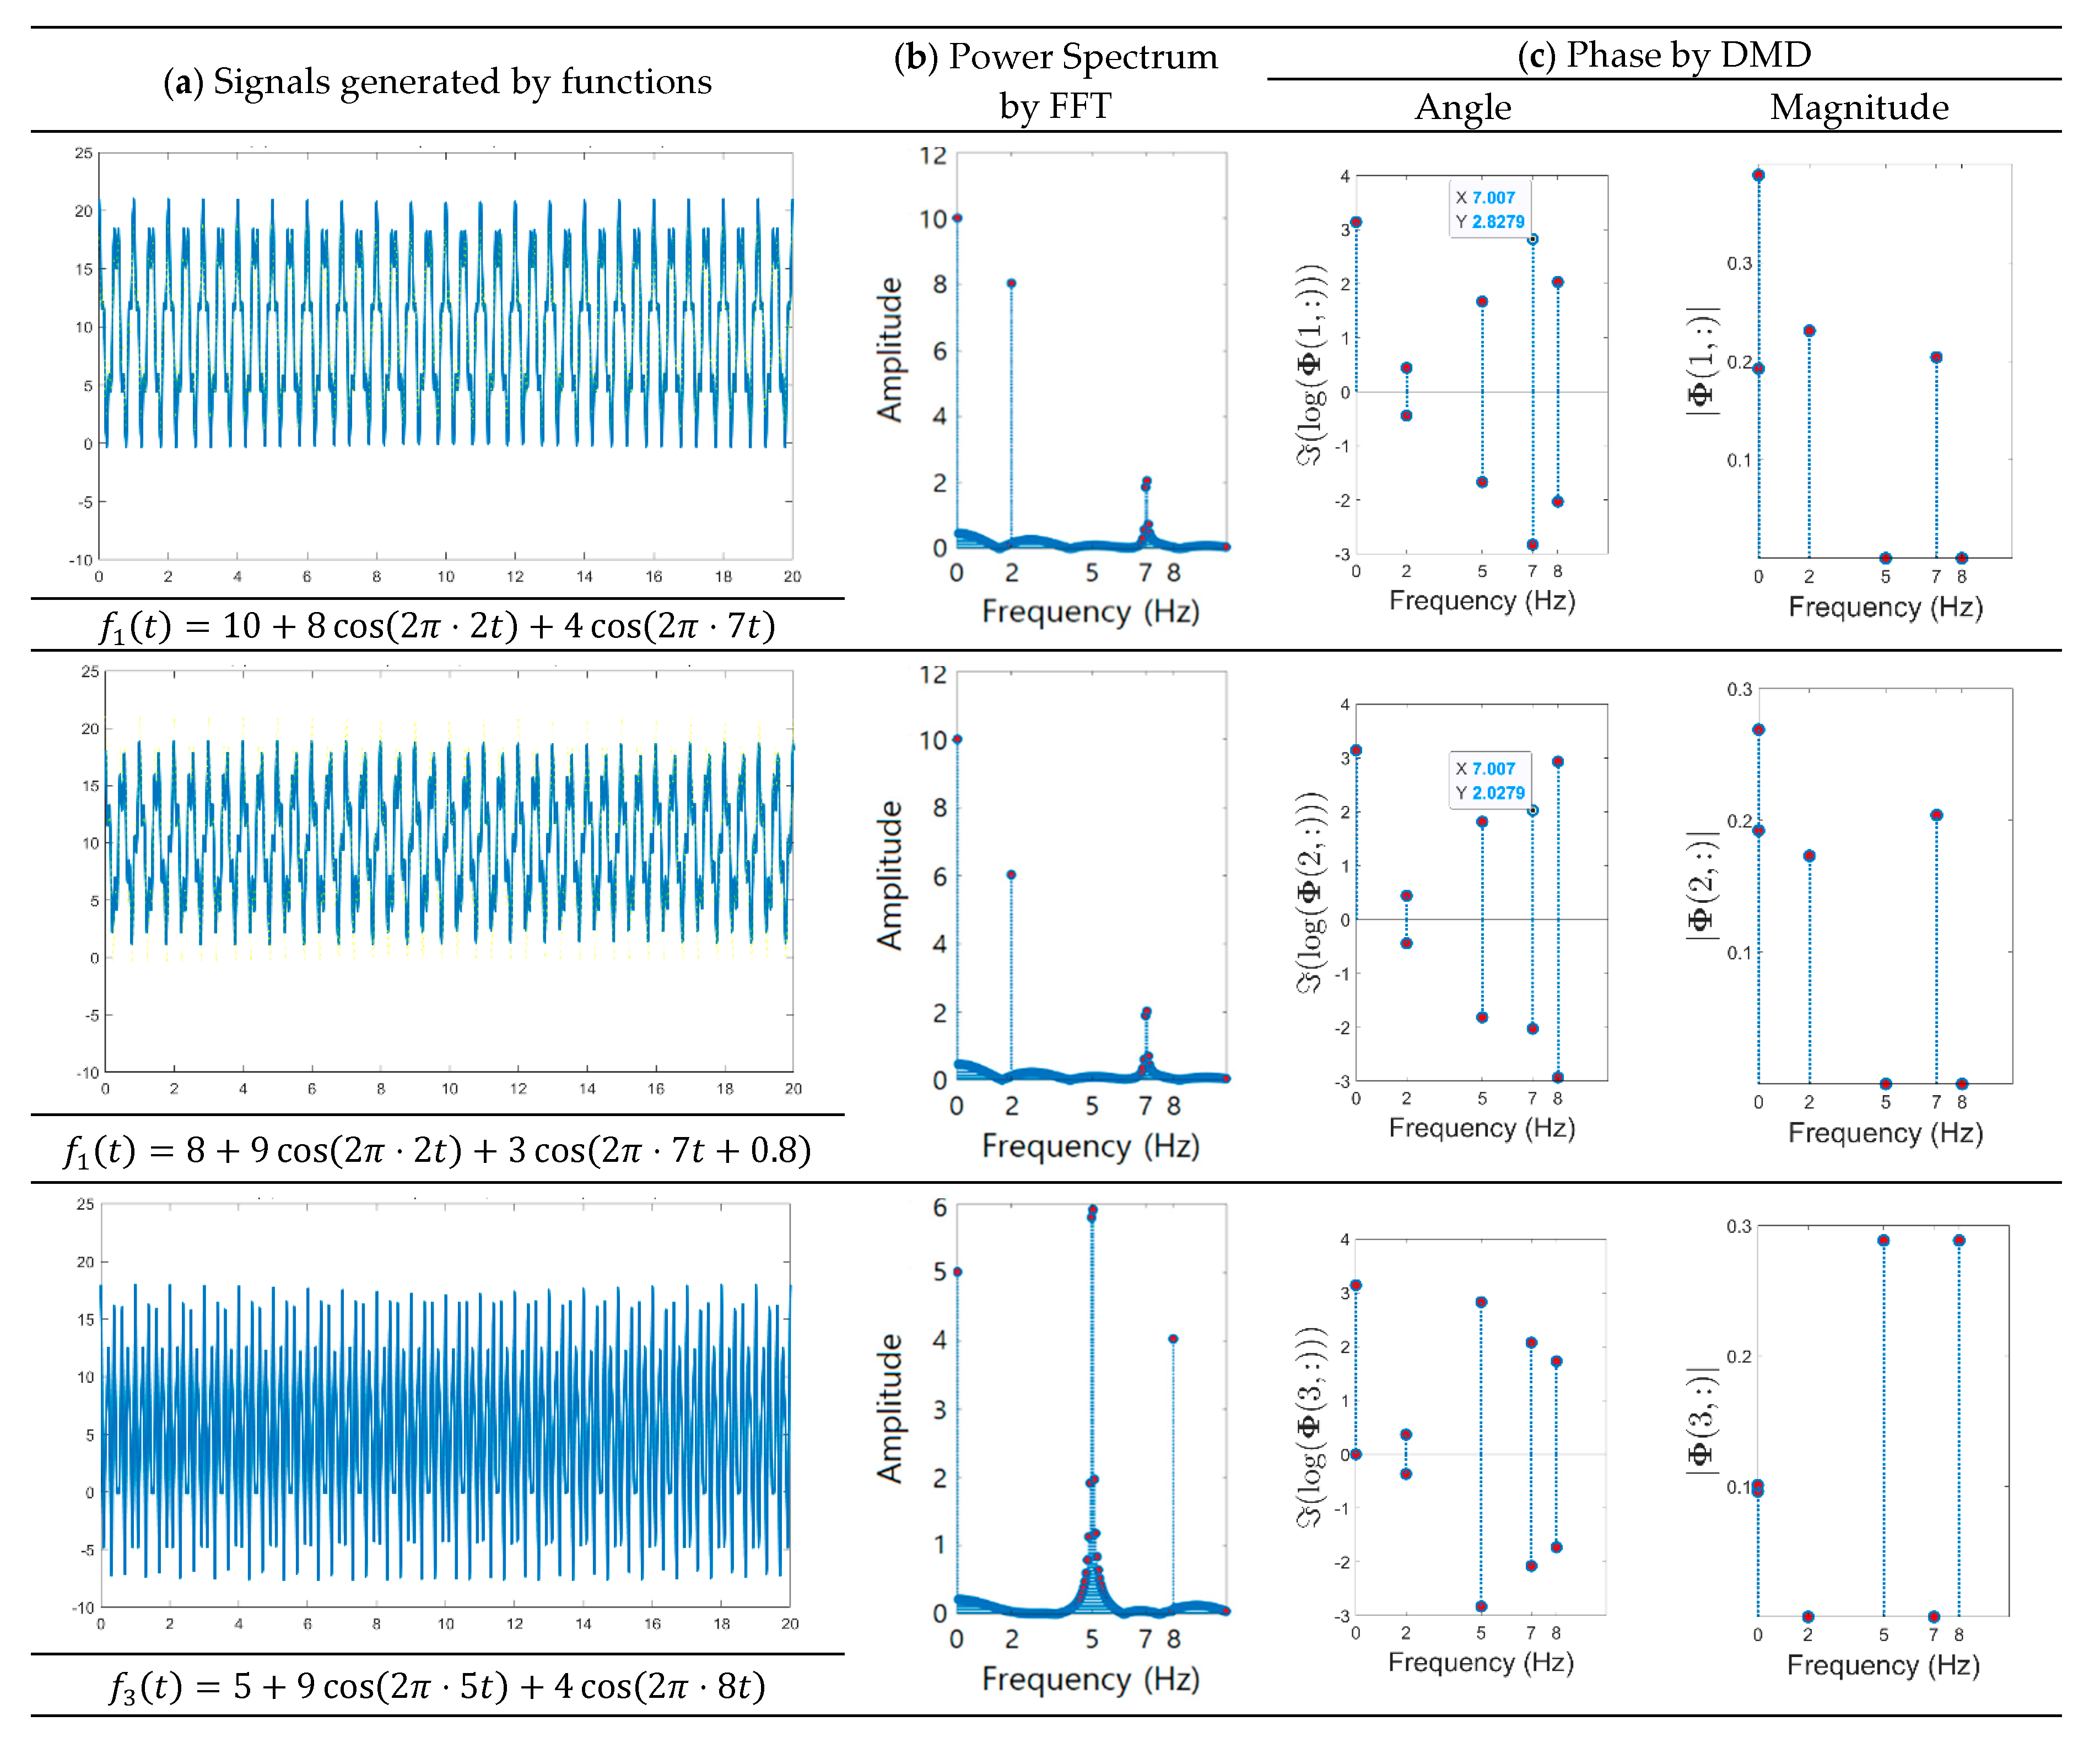
Figure 2 shows that the ‘mode’ of DMD accurately detects two signals that differ in phase. Besides, since the signal of ‘Channel 3’ is not related to the phase difference, the magnitude of the mode corresponding to the frequency of the channel is calculated as zero. On the other hand, in FFT, the phase difference between these two channels cannot be confirmed. The first column in Figure 2 shows the phase angle of the DMD mode obtained from the computation of ( log Φ ) , where Φ is the DMD mode in Equation (11) and ( ) is the imaginary part of a complex number (Note that
x ( t ) = ϕ e i θ t = e i ( θ t + ( log ϕ ) ) + ( log ϕ ) ,
where ( ) is the real part of a complex number.). The second column (b) in Figure 2 displays the magnitude of the mode computed by | Φ | . Since the complex eigenvalues calculated by DMD always consist of conjugate pairs, the phase angles are represented by negative and positive pairs with the same absolute value. The phase angle in the third column in Figure 2 for frequencies whose magnitude is zero is ignored because it is worthless. The absolute value of the phase angle over 7 Hz of the first signal is calculated to be approximately 2.8723 and that of the second signal is approximately 2.0723, so the phase transition from the original signal is exactly 0.8. It should be noted that the mode value of the individual signal is obtained by projecting into a function space that is generated depending on the data so that it may vary depending on how the data is generated. After all, the important value in DMD mode is not the absolute value, but the difference or change of the relative value of magnitude and angle corresponding to each channel and frequency.
In this paper, we introduce a method of classification between the ictal and interictal states in the EEG signals from an individual epileptic patient and examine whether it is effective to recognize spatio-temporal patterns through DMD. In Section 2, we describe the structure of data and the DMD method to be applied and then explain the process of feature extraction for classification. In Section 3, we perform numerical computations and simulations to represent the results of the classification. In Section 4, we interpret the numerical results and discuss how useful the method presented in this study is, and how it differentiates in comparison with existing methods. Finally, in Section 5, we summarize the study and discuss further research topics.

2. Materials and Methods

In this work, ECoG data, a rare type of EEG data, was used. ECoG is an invasive method of measuring the electrical signals with electrodes that are implanted directly on the exposed surface of the brain while the normal EEG is a non-invasive method with electrodes that are placed on the surface of the scalp. The signal-to-noise ratio (SNR) of brain signals in ECoG is relatively high and the impact of artifacts caused by physical movements, electrical activities, and other electrical wearable is almost negligible in ECoG signal. Even in patients with the same type of disease, each of their ECoG data displays their inherent characteristics different from the others. Therefore, when statistically studying ECoG data, instead of using data from multiple patients as a control group, we used one individual patient’s data measured at two or more different timings.
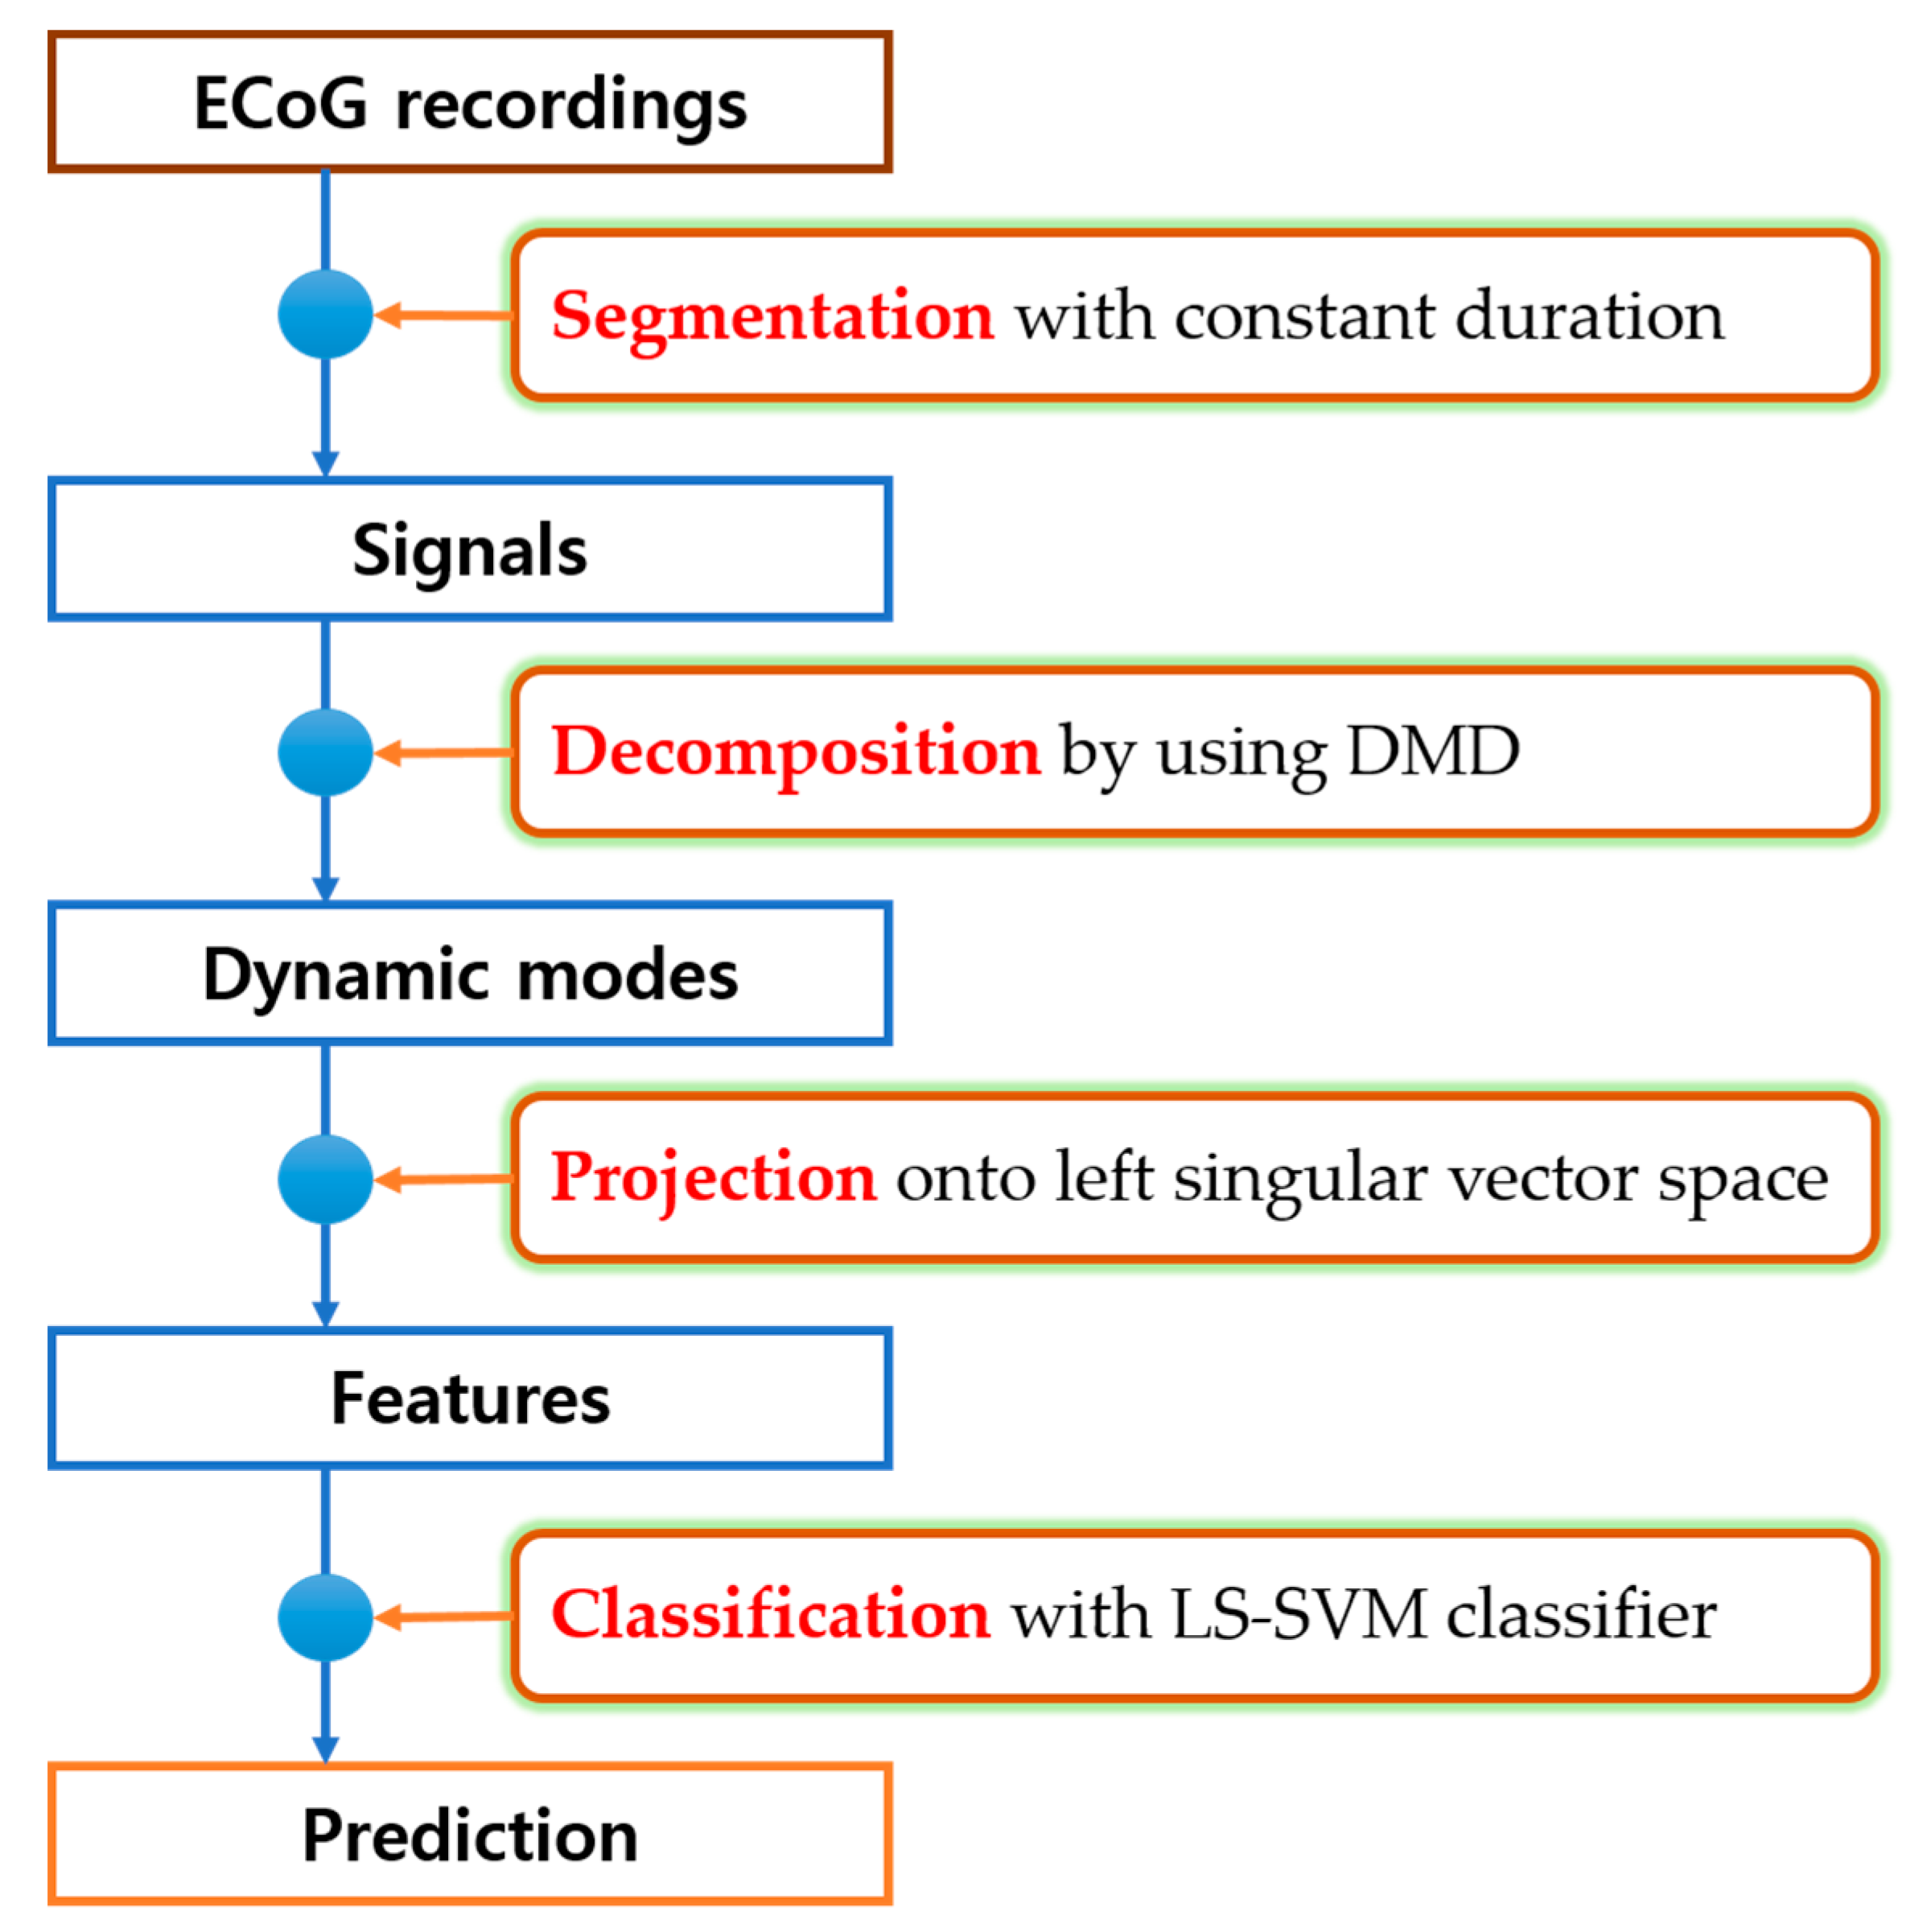
The ECoG recordings were sampled at intervals of 0.2 s, and they were segmented with a one-second duration. Each segmented signal was decomposed by the DMD into a dynamic mode, and the columns of the mode were sorted in descending order of to their frequencies and then vectorized. Those vectorized columns were projected to the approximated left singular vector space, which comes from the subscribed learning process, and then the features were extracted. Finally, the extracted features were regarded as an input variable into a support vector machine (SVM) and then those were classified into ictal and interictal EEG signals. Figure 3 illustrates all the steps in the process described above. In what follows, details of the used ECoG dataset, dynamic mode decomposition, feature extraction, classification, and statistical assessment are described in order.

2.1. Dataset

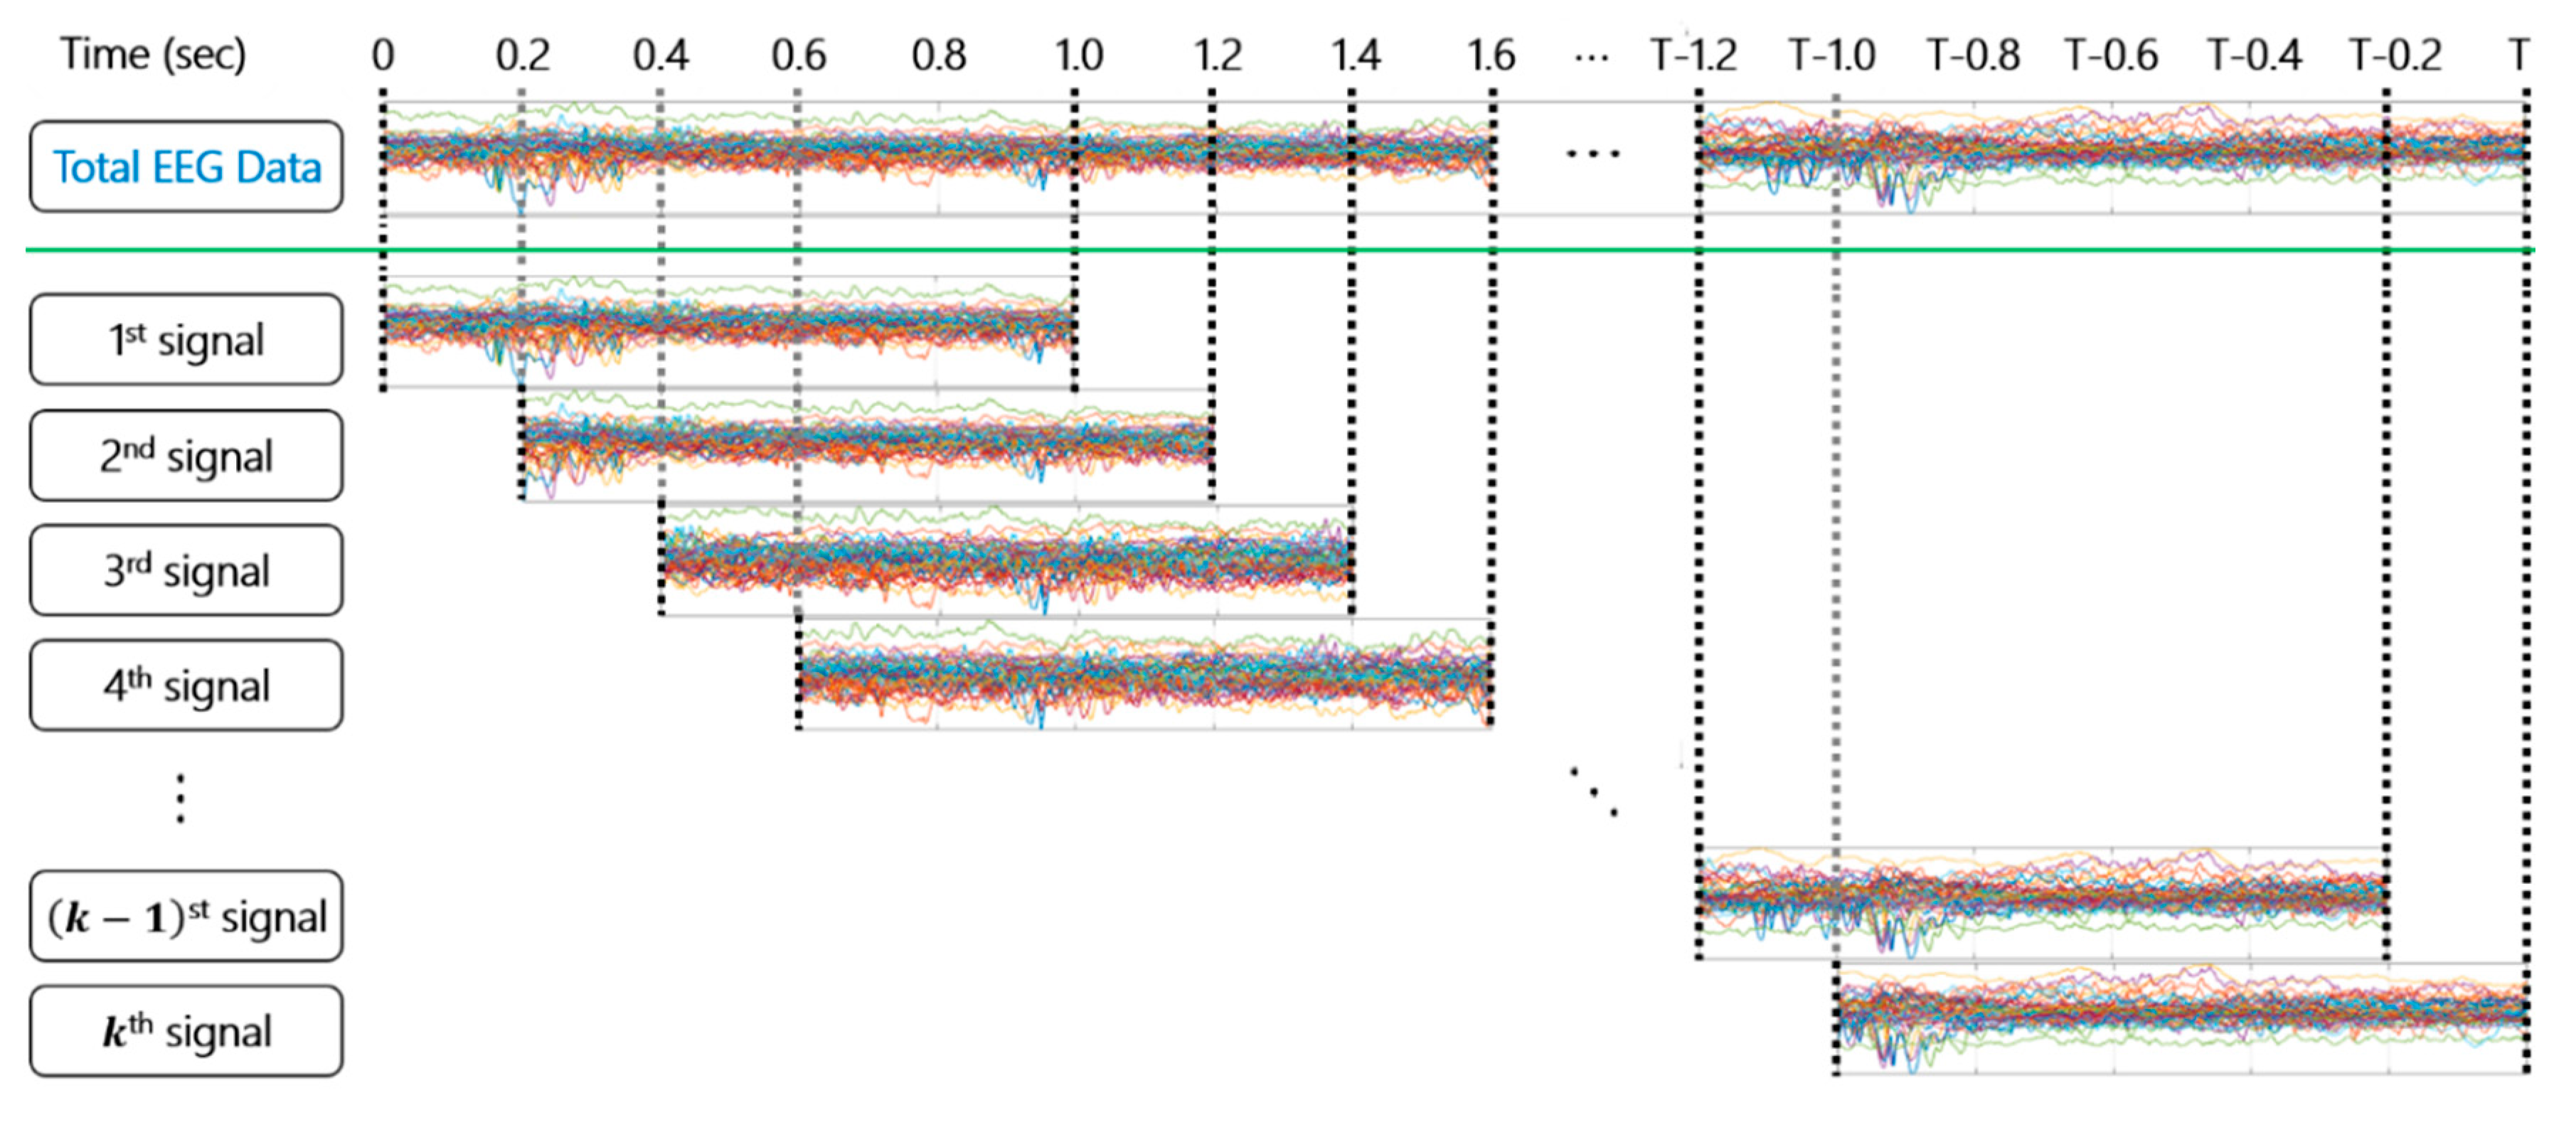
The ECoG dataset of an epileptic patient was provided by Ikeda laboratory at Kyoto University. The recent works in Ikeda laboratory refer to [2,6,16,17] on high-frequency oscillations and other types of oscillations with prominent DC components, which is the so-called DC-shift, in EEG data. The dataset is composed of four distinct ECoG recordings measured through 49 channels; two recordings are in the awake state and the other two are in the sleep state. Each recording is composed of only two types of signals: An ictal signal and an interictal signal. Table 1 displays the detailed information of the four recordings and their settings, and Figure 4 illustrates how to sample the EEG data into signals to be used in this work. Since the sampling rate of the original data provided was very large as 2000 Hz, it was reduced to 250 Hz to match the rate used in most of the previous related studies.

2.2. Dynamic Mode Decomposition

Assume that data is collected from a dynamical system of ordinary differential equations:
d x d t = f ( x ,   t ) ,
where x ( t ) n is a vector representing the state of a dynamical system at time t and f ( ) represent the dynamics. In general, it is impossible to construct an analytic solution to the nonlinear Equation (1), so numerical solutions are used to approximate the dynamics and predict the future states. The DMD procedure constructs the proxy, approximate locally linear dynamical system:
d x d t = A x ,
with initial condition x ( 0 ) and solution:
x ( t ) = k = 1 n ϕ k exp ( ω k t ) b k = Φ exp ( Ω t ) b ,
where ϕ k and ω k are the eigenvectors and eigenvalues of the matrix A , and the coefficients b k are the coordinates of x ( 0 ) in the eigenvector basis.
The continuous dynamics in Equation (2) can be described by an analogous discrete-time system sampled every Δ t in time, such as:
x k + 1 = A x k ,       k = 0 ,   1 ,   2 ,   ,   m ,
where A = exp ( A Δ t ) and m is the number of states. The solution to this system is simply expressed by:
x k = j = 1 n ϕ j λ j k b j = Φ Λ k b ,
where λ j and ϕ j are the eigenvalues and eigenvectors of the discrete-time map A , respectively, and b is the coefficient of the initial condition x 0 = x ( 0 ) in the eigenvector basis so that x 0 = Φ b . The final goal of the DMD algorithm is to produce a low-rank eigendecomposition (Equation (3)) of the matrix A that optimally fits x k for k = 0 ,   1 ,   ,   m in a least-square sense so that:
x k + 1 A x k 2 ,
is minimized for k = 0 ,   1 ,   ,   m 1 .
Let x i n be a column vector containing measurements from n channels at the time instant i in streamlined EEG signals and compose a data matrix:
X = [ x 0 , x 1 , , x m ] n × ( m + 1 ) ,
which represents a segmented EEG signal. In order to minimize the approximation error (Equation (4)), we define two data matrices as follows:
X 1 = [ x 0 , x 1 , , x m 1 ] n × m , X 2 = [ x 1 , x 2 , , x m ]     n × m ,
where X 1 is the data matrix constructed by the measurement vectors for m consecutive time instances from the beginning, and X 2 is the data matrix temporally shifted by the time unit 1 from X 1 . Then, the locally linear approximation (Equation (2)) can be written by:
X 2 A X 1 ,
and the best-fit A matrix is given by:
A = X 2 X 1 ,
where X 1 denotes the Moore–Penrose pseudoinverse of X 1 . The solution of Equation (6) minimizes the error:
X 2 A X 1 F ,
where F is the Frobenius norm given by:
M F =   j = 1 p k = 1 q M j k 2   ,
for M p × q . Thus, the DMD of the pair ( X 1 , X 2 ) is the eigendecomposition of the matrix A . Then, the modes and eigenvalues of the DMD correspond to the eigenvectors and eigenvalues of A , respectively. In practice, if the state dimension n is large, the matrix A may be intractable to analyze directly. Instead, a low-rank approximation A ˜ is implemented by the following algorithm, which is called the DMD algorithm [15,18]:
(a)
Compute the reduced and appropriately truncated SVD [19] of the data matrix X 1 in Equation (5):
X 1 U Σ V ,
where the columns of U n × r and V m × r are orthonormal eigenvectors of X 1 X 1 T and X 1 T X 1 , respectively, the diagonal entries of Σ r × r are the square roots of the non-negative eigenvalues of both X 1 X 1 T and X 1 T X 1 , and r   ( < min { n , m } ) refers to the reduced rank of the approximated matrix given in Equation (7). The columns of U are called the left singular vectors of X 1 .
(b)
Define a low-rank approximation A ˜ of A in Equation (6):
A ˜ = U A U = U X 2 V Σ 1 .
(c)
Compute the eigendecomposition of A ˜ in Equation (8):
A ˜ W = W Λ ,     Λ = diag ( λ 1 ,   λ 2 ,   ,   λ r ) ,
where the columns of W r × r and the diagonal entries of Λ r × r are the eigenvectors and the eigenvalues of A ˜ , respectively.
(d)
Since the eigenvalues in Equation (9) are also the eigenvalues of A , the DMD mode (i.e., the eigenvector of A ) corresponding to the DMD eigenvalue λ i in Equation (9) is given by:
ϕ i U w i ,
where w i is the i th column of W in Equation (9).
Each snapshot x i is approximated by x i A x i 1 , and so, this algorithm allows us to express an approximation of the sample data as a composition of a coupled spatio-temporal model:
x ^ ( t ) = A t x 0 = Φ Λ t c ,
where Φ n × r consists of the columns of ϕ i , and c is a set of weights satisfying x 0 = Φ c . The phase of eigenvalues can be converted to frequency (Hz) by:
f i = ( log ( λ i ) / Δ t ) 2 π ,
where ( ) is the imaginary part of a complex number. f i indicates the frequency of oscillation in the mode ϕ i , whose unit is in cycles per second. Since c in Equation (11) corresponds to the initial value x 0 in Equation (5), the i th entry of c in Equation (11) is accordingly defined to be the spectral amplitude of the frequency f i in Equation (12). Since the size of the operator A in Equation (6) is determined by the dimension of the vector x i in Equation (5), if the spatial resolution of a given signal is less than its temporal resolution then the standard DMD algorithm represented above may fail to extract full spectral information (for example, DMD gives only a scalar linear operator from one-dimension signals).
The spatial resolution for neurological signals is usually less than the temporal resolution. For example, we have 49 channels of electrodes sampling at 2000 Hz. Thus, the standard DMD algorithm must be modified to capture the dynamics of the neurological activity properly. The modification is adopted to augment the data matrix X by stacking h number of observation vectors x i to be given in Equation (15), such that the number of rows in X becomes at least twice the number of columns. A recent experiment has shown that the number of rows in X must be more than twice that of the columns to obtain adequate spectral information from brain signals [20]. Then, a scaled spectral amplitude for c in Equation (11) is given by:
P i = 2 | c i | h ,
where c i is the i th entry of c given in Equation (11). Meanwhile, the DMD mode power is defined by ϕ i 2 2 [14,20].
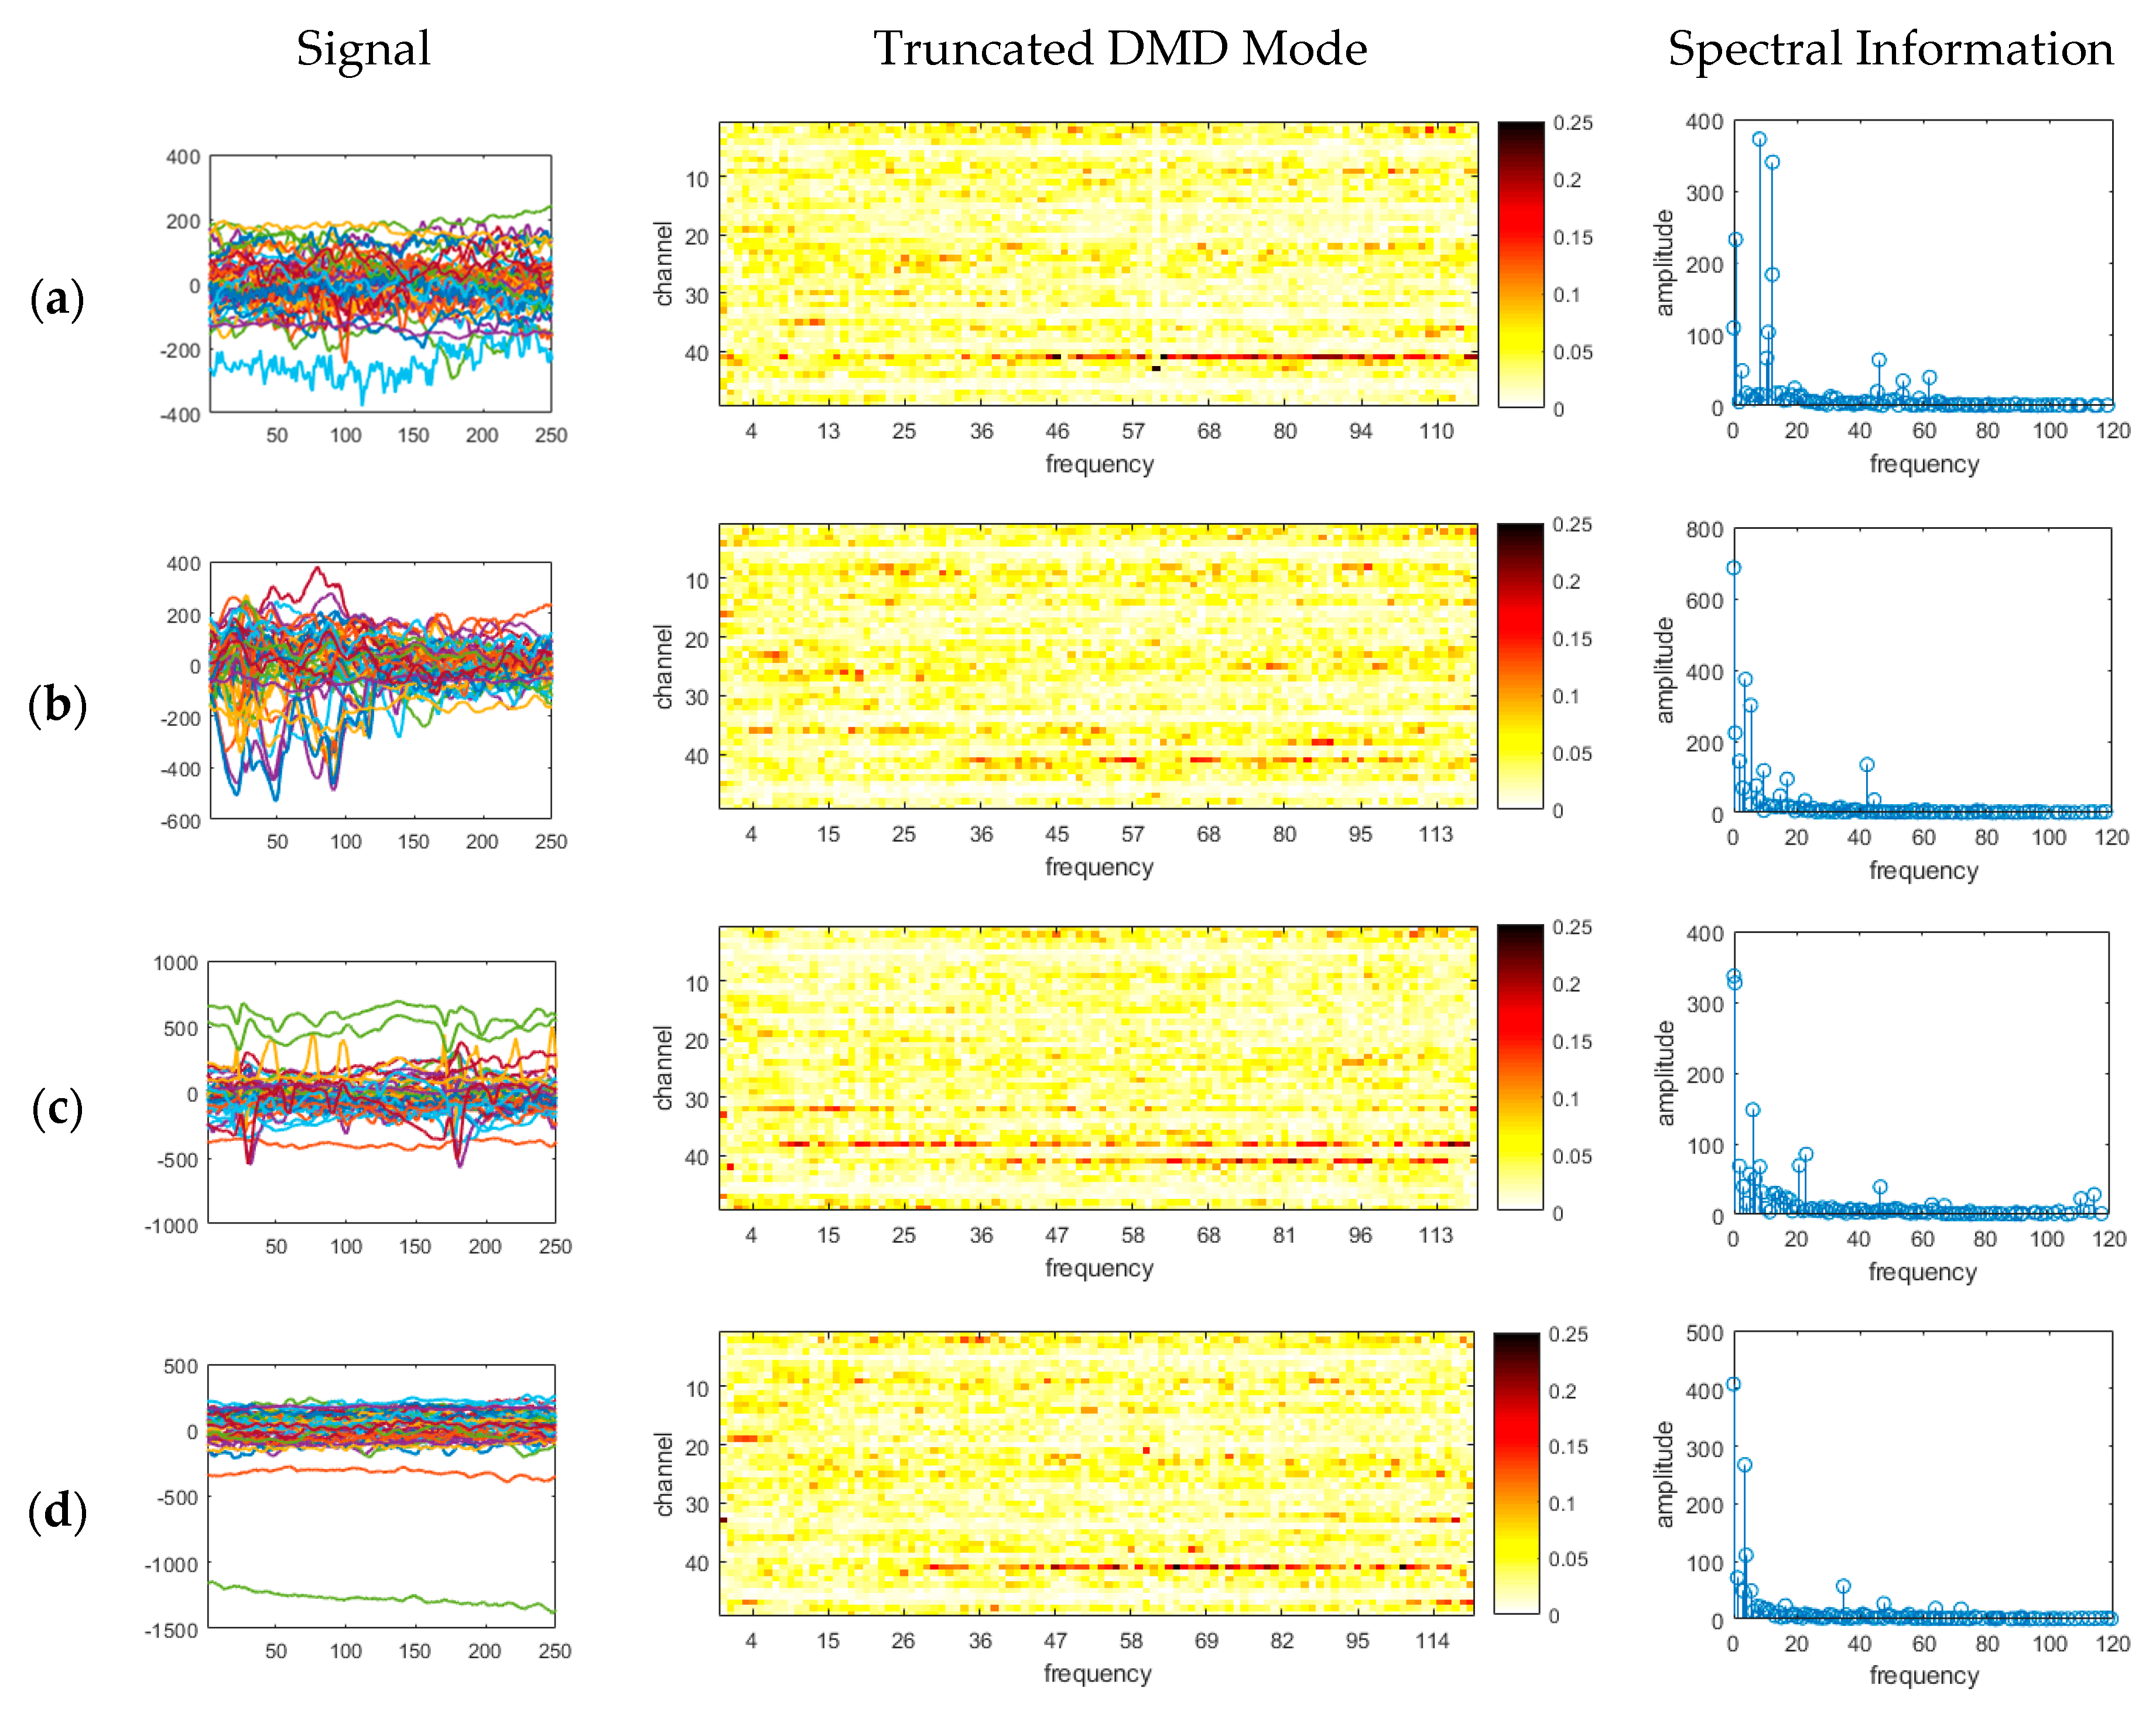
Figure 5 illustrates the variation in the spectral information and DMD modes corresponding to signals from different data regions of the EEG recordings, such as interictal in the sleep state, interictal in awake, ictal in sleep, and ictal in awake. The signals used in this work were obtained from 49 channels with one-second duration and they were resampled by a sampling rate of 250 Hz with 10 stacking numbers, and hence, the data matrix X contains 240 columns and 490 rows (each original signal has 250 columns and 49 rows).
In Figure 5, we see that the amplitudes at high frequencies are relatively much smaller than the amplitudes at other frequencies, but the magnitude of the phase on some narrow-banded low or high frequencies at the channels 33, 38, and 47 in the DMD mode are more significantly larger than that of the others, except channel 41. The DMD mode is given in a complex number, and its magnitude displays the relative influence of all channels on the corresponding frequency in a normalized state. The DMD mode corresponding to the zero frequency indicates the overall shape or the tendency of signals. Inspecting the magnitude of the DMD mode identifies channels with significant phase transition at some special banded frequencies in the signal, such as the channels in which DC shift and HFO occur. Therefore, in order to focus on abnormal spatio-temporal phase patterns of high frequencies from ictal and interictal signals, we do not consider the amplitudes defined in Equation (13) to avoid a biased power spectrum information to low-frequency band.

2.3. Feature Extraction

Each DMD mode is reordered and vectorized for feature extraction. The left singular vectors are obtained by decomposing the matrix constructed with modes computed from training signal set. Then, the features are extracted by projecting the computed modes to the truncated left singular vector space, which is prepared in the previous states.
The feature to be used in the proposed method is a vectorized and reordered DMD mode. The dimension of the feature is reduced by a linear transformation mapped to the space of truncated right-singular vectors, which come from a row-wise stacked feature matrix of modes for training data. The detail of feature extraction is explained below.
For the simplicity of notation without a loss of generality, we define two sets of EEG signals used in testing and learning processes from several regions of EEG recordings as follows:
W train = { X ( j ) n × ( m + 1 ) |   j = 1 , 2 , , I L }   W test   = { X ( j ) n × ( m + 1 ) |   j = I L + 1 , I L + 2 , , I L + I T } ,
where n and ( m + 1 ) are the number of channels and that of snapshots within a fixed time duration (one second in this work), respectively. Note that I L and I T are the numbers of sample signals in the training and testing sets, respectively. The elements of each set are labeled into one of four cases: Ictal in awake state, ictal in sleep, interictal in awake, and interictal in sleep for classification.
Let X ( j ) = [ x 0 ( j ) , x 1 ( j ) , , x m ( j ) ] W train   W test be a j th data matrix of signal sets in Equation (14). Then, the augmented matrix for the decomposition is represented by:
X aug ( j ) = [ x 0 ( j ) x 1 ( j ) x m h + 1 ( j ) x 1 ( j ) x 2 ( j ) x m h + 2 ( j ) x h ( j ) x h + 1 ( j ) x m ( j ) ] n h × ( m h + 1 ) ,
(see [13]). For each X aug ( j ) , we calculate Φ ( j ) n h × r , f ( j ) , and P ( j ) given in Equations (11)–(13), respectively. In this work, to extract optimal features, the low-rank approximation size r is fixed (in this paper, r = 100 ). The discussion for choosing an optimal threshold on the singular values can be found in [21]. Then, the modes can be aligned by frequency into the form:
Φ align ( j ) = [ ϕ σ ( 1 ) ( j ) ,   ϕ σ ( 2 ) ( j ) ,   ,   ϕ σ ( r ) ( j ) ] ,
where σ is a permutation of { 1 , 2 , , r } , satisfying:
f σ ( 1 ) ( j ) f σ ( 2 ) ( j ) f σ ( r ) ( j ) .
A pair of consecutive columns in each Φ align ( j ) mostly consists of a complex conjugate except for ϕ 1 ( j ) and valid spatial information is contained in the first n -rows. Thus, in order to reduce the computational cost in the featuring process without a loss of the information, one can extract submatrix by truncating the columns and the rows by:
Φ trunc ( j ) = Φ algin ( j ) [ 1 : n , 1 : 2 : r ] ,
where Z [ r , c ] denotes a submatrix of Z indexed by sequences r and c , and i : k and i : j : k implies the index sequences { i , i + 1 , i + 2 , , k } and { i , i + j , i + 2 j , , i + t j } , satisfying i + t j k i + ( t + 1 ) j , respectively. Note that in this paper, the size of each Φ trunc is given by 49 × 50 . It is remarkable that most of the entries of Φ trunc ( j ) are close to zero (or almost sparse matrices) and can be clustered into small groups. Therefore, it is naturally assumed that the dynamics of signals in EEG recordings can be described by a few entries of the DMD mode and spectral information. This implies that it is possible to apply low-rank reduction schemes to the modes, such as singular value decomposition (or principal component analysis).
The truncated DMD mode in Equation (17) of every signal in the recordings is gathered to form libraries of DMD mode patterns and supposes that elements of these libraries are labeled into distinct states of regions. The construction of the libraries of DMD mode patterns is performed as follows:
= [ ϕ ˜ 1 ϕ ˜ 2 ϕ I L ] n r × I L T = [ φ ˜ 1 φ ˜ 2 φ ˜ I T ] n r × I T ,
where:
ϕ ˜ i = v e c ( Φ trunc ( i ) ) n r × 1         and         φ ˜ i = v e c ( Φ trunc ( I L + i ) ) n r × 1 ,
where Φ trunc ( j ) is a truncated DMD mode matrix in Equation (17) for the j th signal in W L   W T in Equation (14), and v e c ( M ) represents a column vector obtained by rearranging M = [ m 1 m 2 m k ] l × k by vertically stacking the column vectors m i of the matrix below in the order of the index, that is:
v e c ( M ) = [ m 1 m 2 m k ] l k × 1 .
For purposes of classification, we considered only the absolute value of DMD modes. Therefore, in the featuring process, we use the absolute valued matrices of   and T in Equation (18) denoted by | | and | T | , respectively. The feature is determined in the d -dimensional left singular vector space, using the transformation of each column of | | and | T | in Equation (18) onto the first d left singular vectors of | | obtained by SVD, such as:
| | = U Σ V T   , a L = U d T | | d × I L   ,         and         a T = U d T | T | d × I T ,
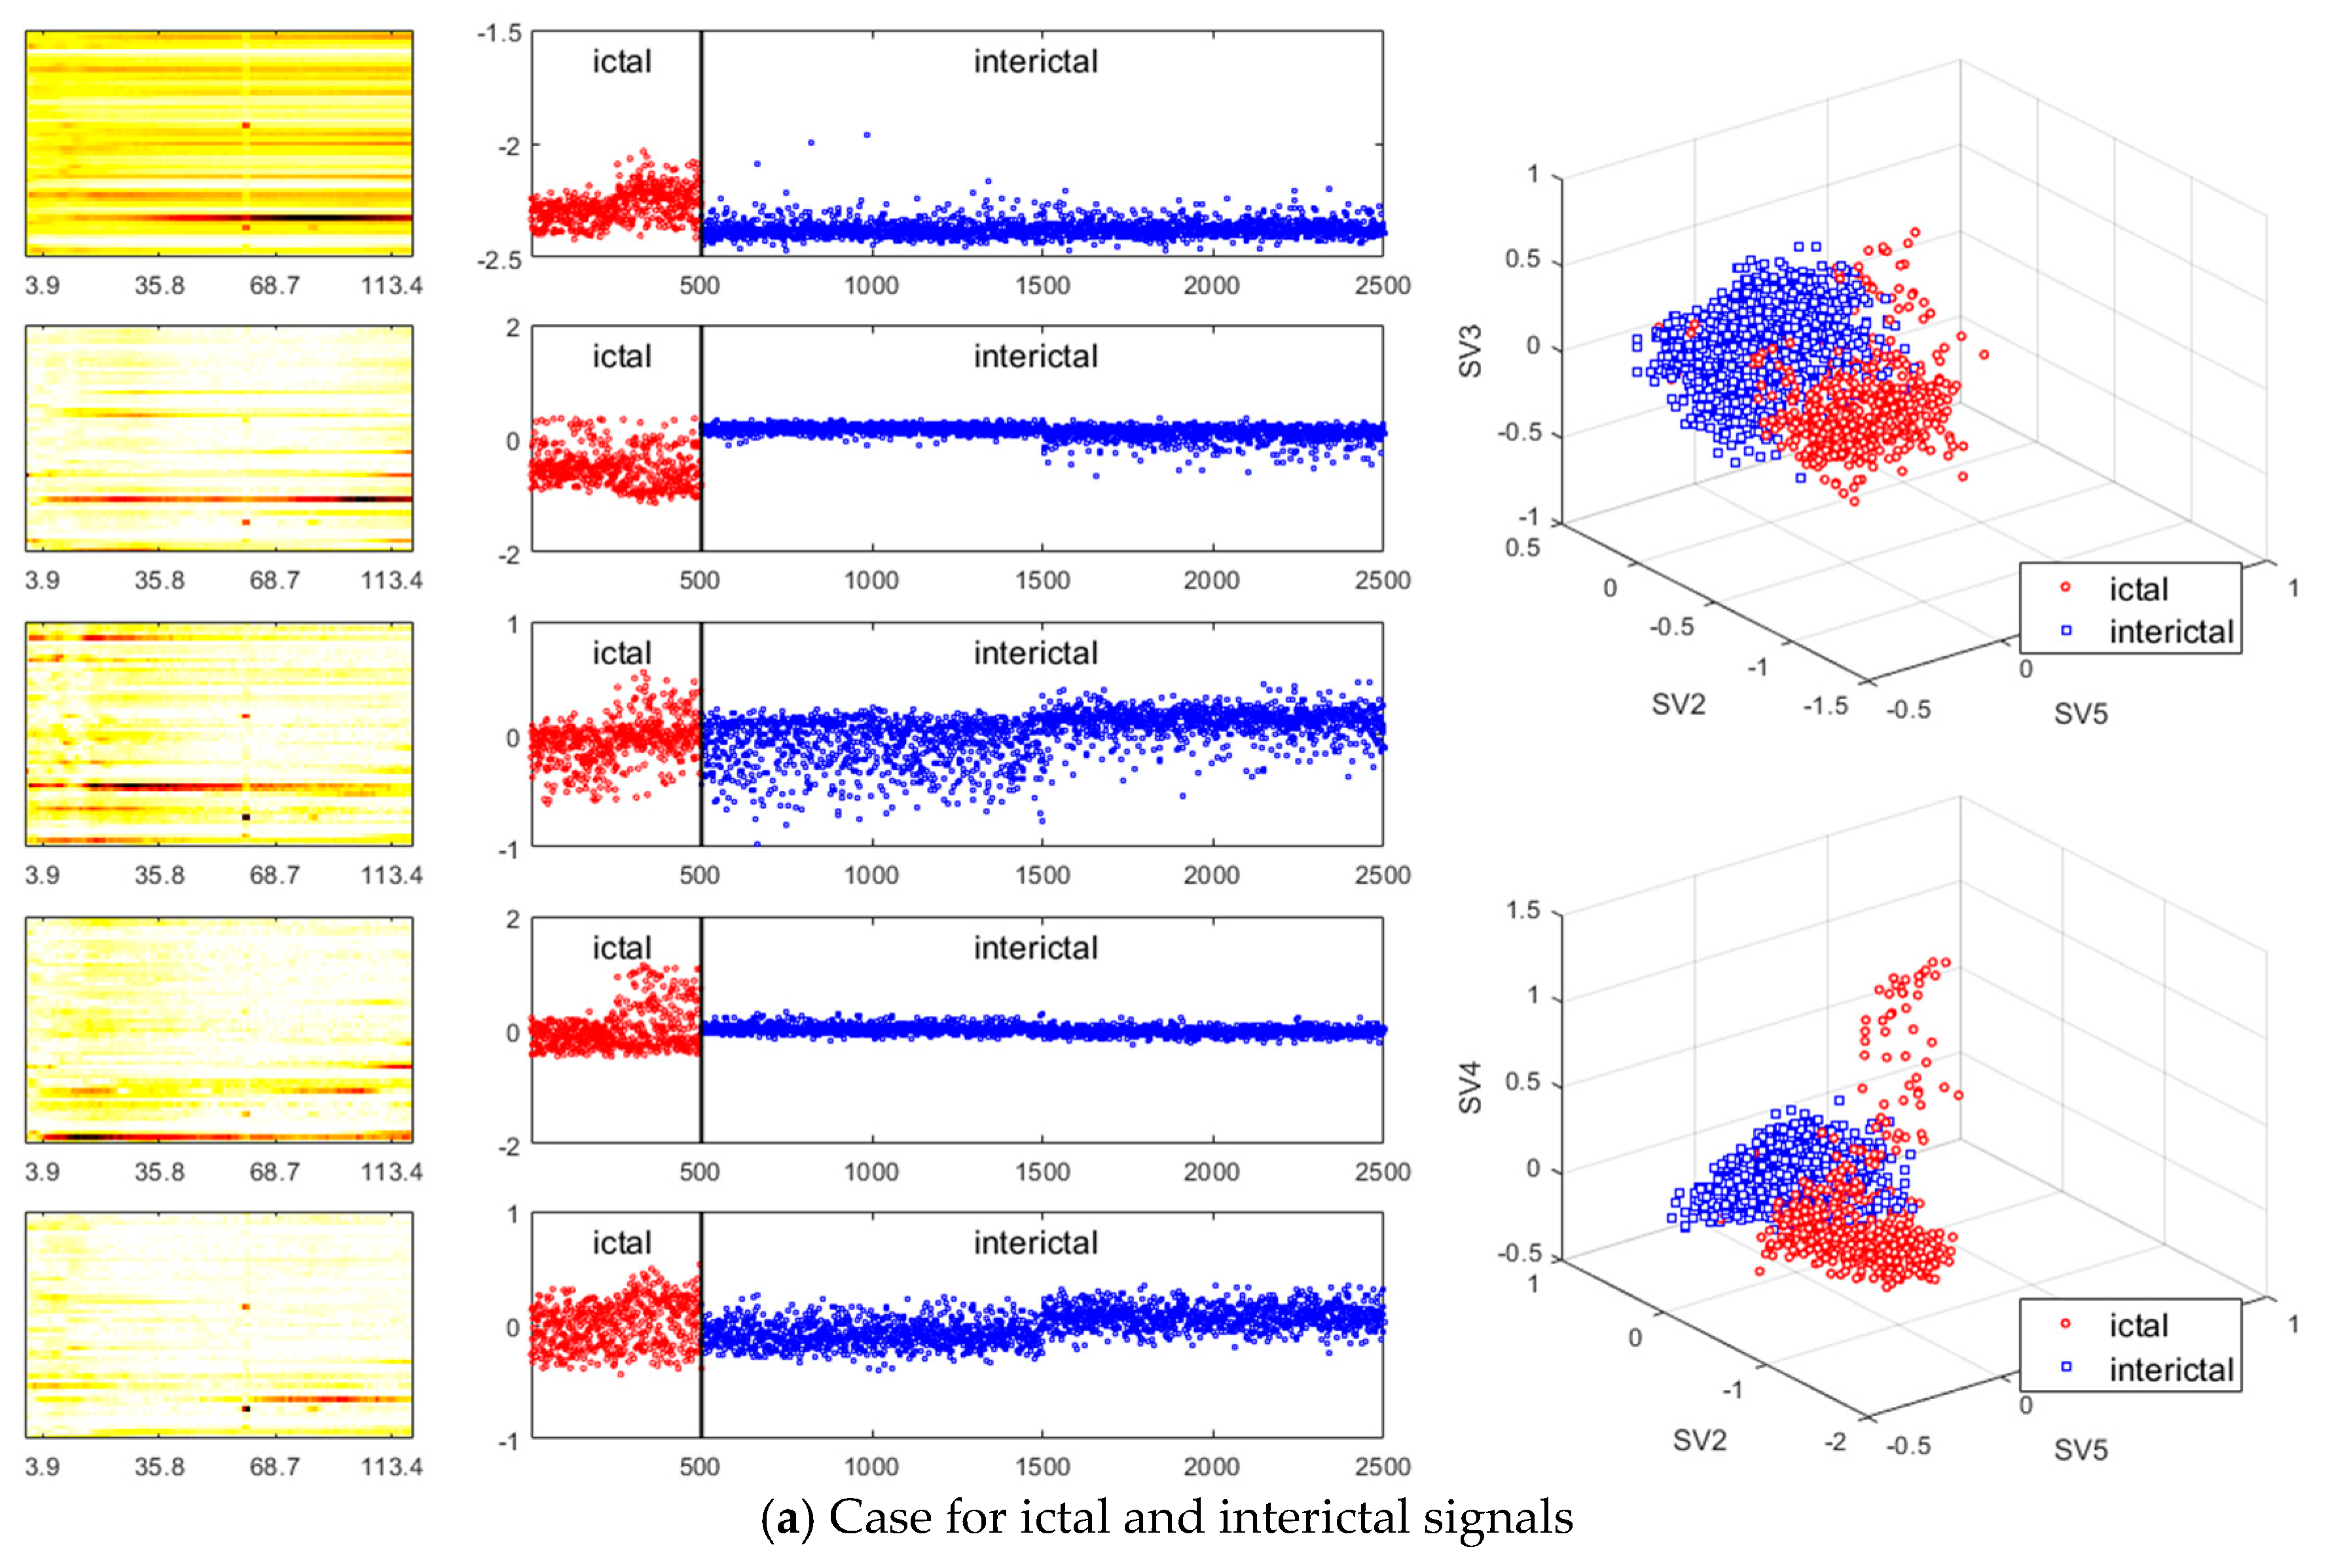
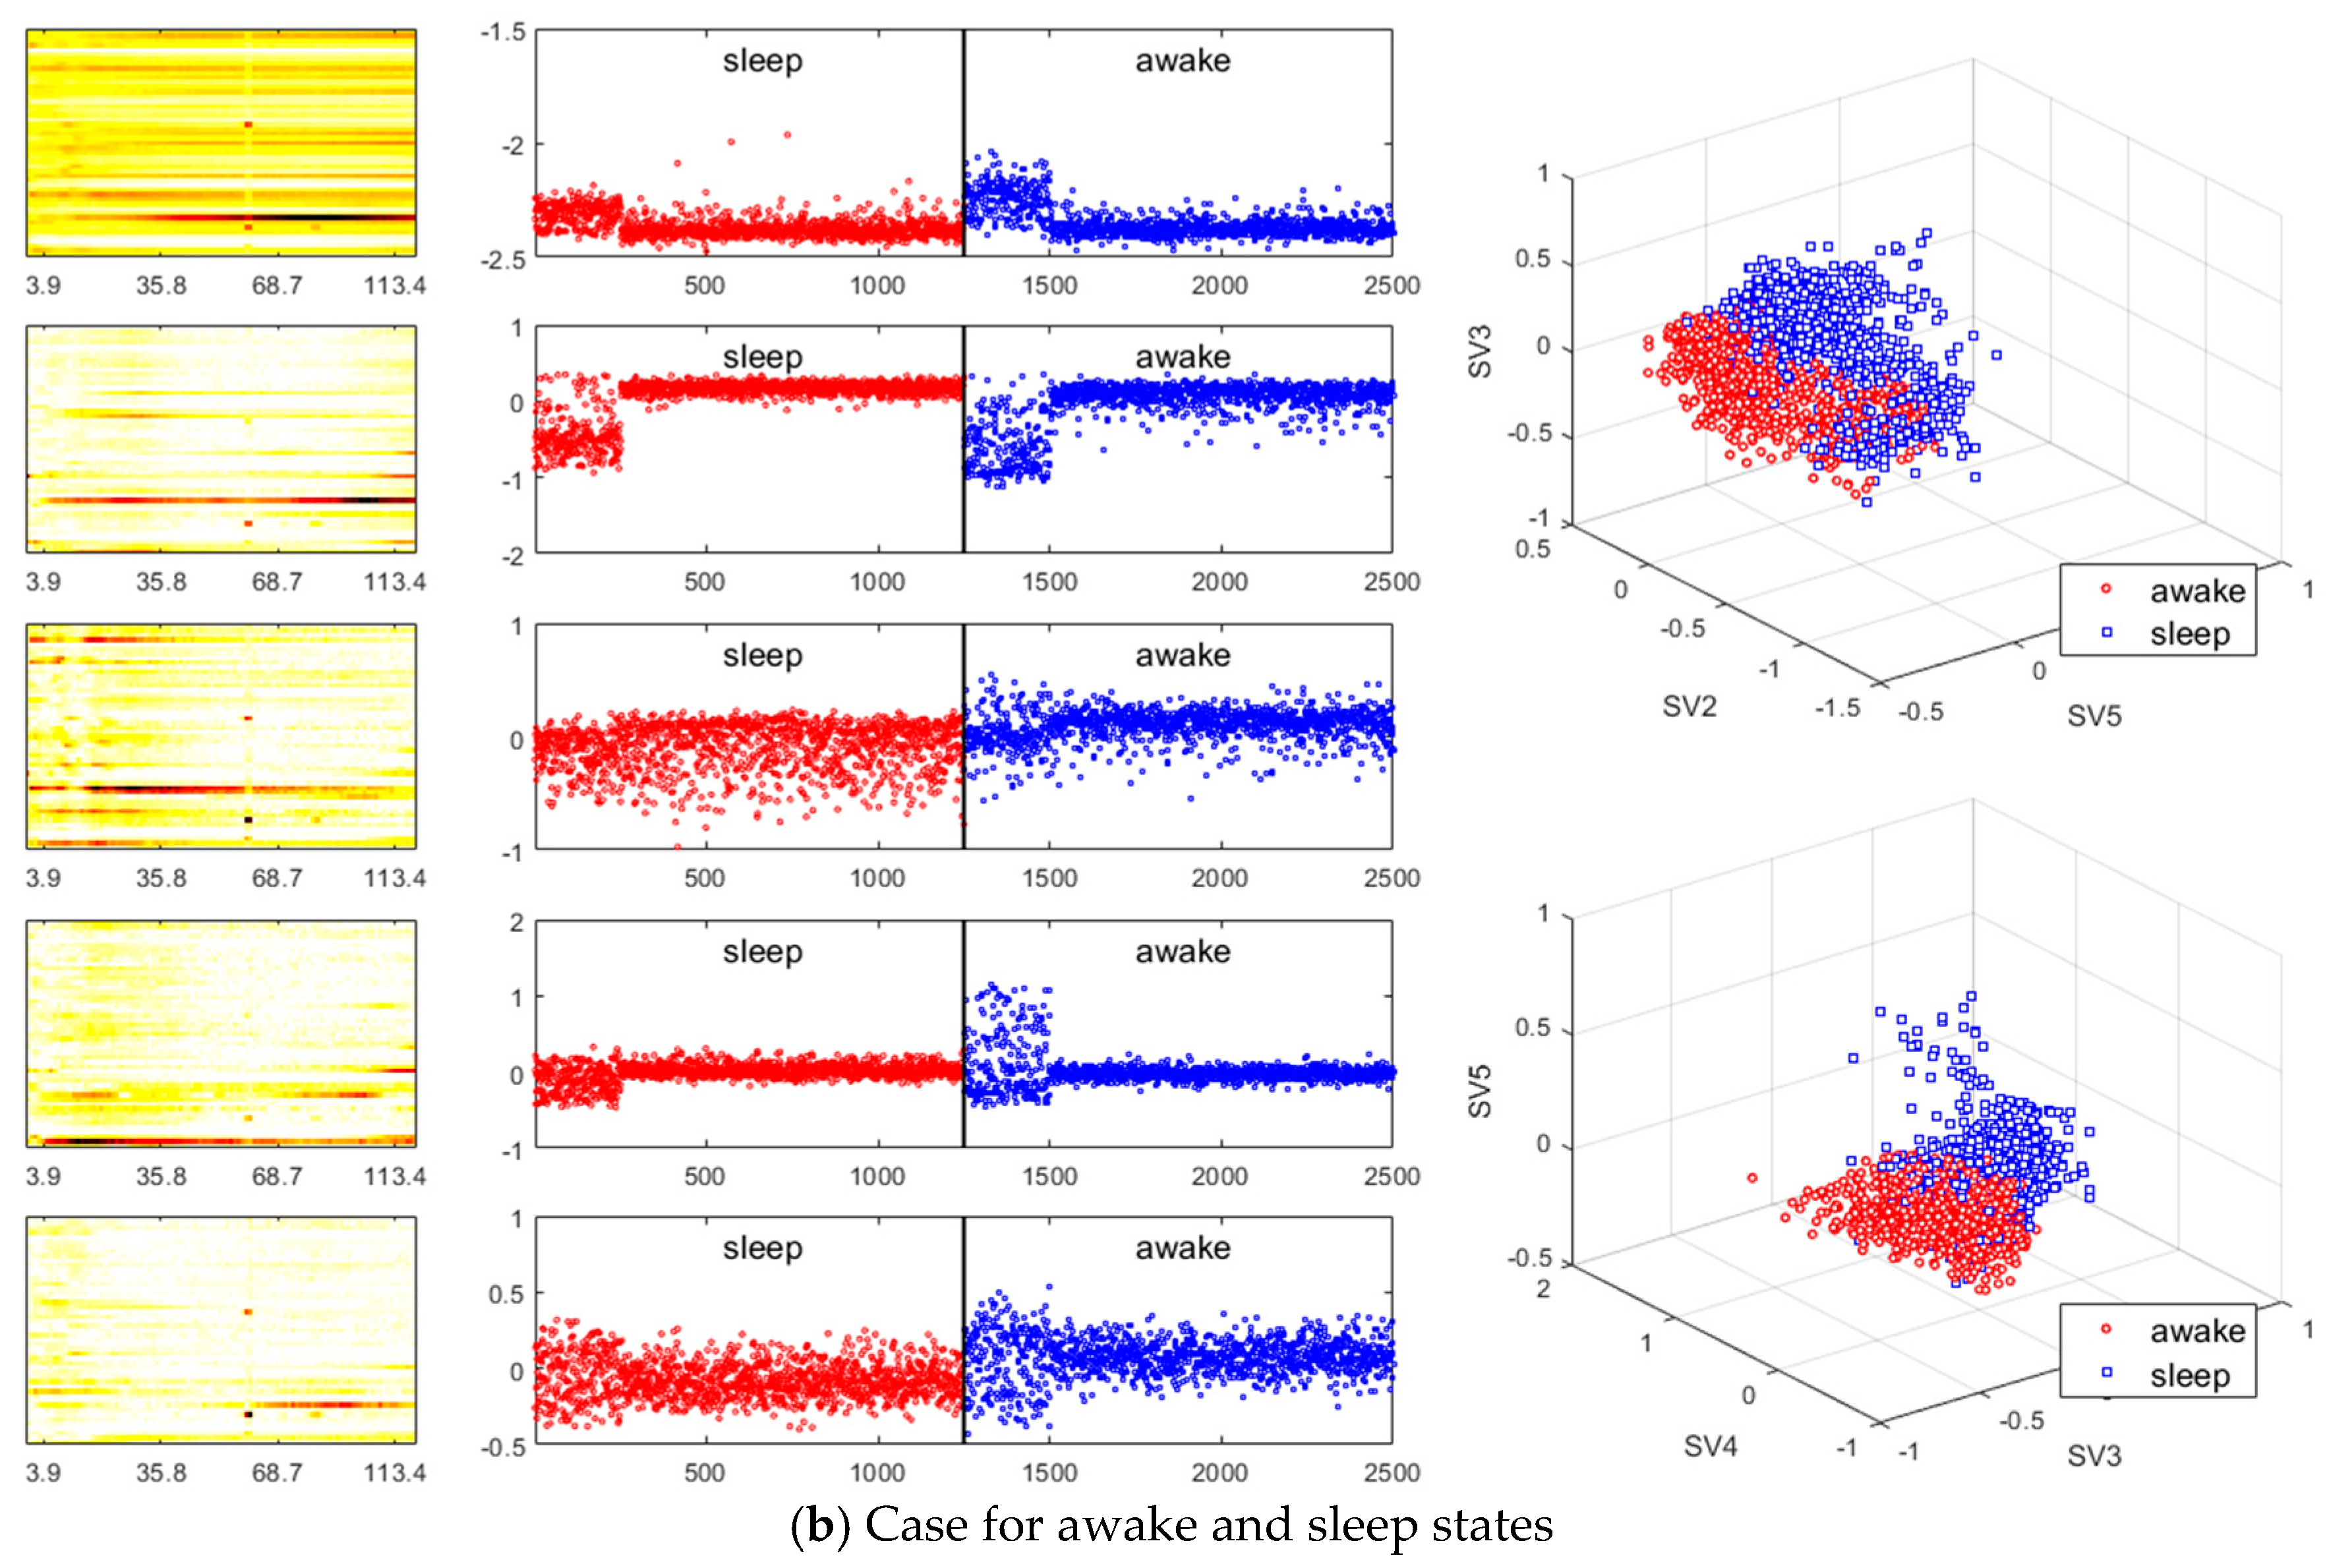
where U n × n and V I L × I L are matrices orthogonal to each other, Σ n × I L is a non-negative diagonal matrix, U d T is the transpose of the first d columns of U , and columns of a L and a T are regarded as the features of the training set and the testing set, respectively. Figure 6 exhibits the patterns of the left singular vector space and the distribution of the features derived from the two distinct training sets W train in Equation (14), each of which is formed by a combination of one of the ictal and interictal signals and one of the awake and sleep states. This provides visual identification of the components contributing to the classification and their distribution. The pattern of the graph shows that the feature components contributing to the classification of the ictal and interictal signals are associated with the high-frequency pattern of the DMD mode, and the components contributing to the classification of the awake and sleep states are associated with the low-frequency pattern. It is also found that such components contain well recognizable unique characteristics for each state. In addition, the SVD precisely detects the high-frequency patterns associated with ictal and interictal signals, and hence, it is more distinct than the low-frequency patterns associated with awake and sleep states. This will be confirmed by numerical simulation in Section 3.

2.4. Classification

The extracted features are to be classified into ictal or interictal signals and also into awake and sleep states by employing a support vector machine (SVM) classifier. As shown in [4], the SVM is one of the most effective classifiers for EEG signals and it can be applied to the signals flexibly in various ways. The SVM algorithm seeks a linear classifier that minimizes the operational error and maximizes the margin hyperplane, and hence, it boosts the performance of classification. In this experiment, we used kernel-based SVM presented in [22], which is known to be useful to deal with nonlinear classification based on a linear discriminant function in a high-dimensional space.

3. Results

Our goal was to use the SVM to classify epileptic EEG signals into ictal or interictal signals, and also into signals in the awake state or those in the sleep state. Some particular properties of spatio-temporal patterns involved in classification are distinctly captured by the algorithm of the DMD combined with SVD as proposed in Section 2. For objective evaluation of the classification, the experimental datasets used in the learning process were selected completely differently from the datasets used in testing process. We constructed 10 training sets W train ’s in Equation (14) by randomly choosing ictal signals in the awake state to 250 signals, ictal in sleep state to 250, interictal in awake state to 1000, and interictal in sleep state to 1000, which were obtained from ‘Pt1_ictal1’ and ‘Pt1_ictal2’ recordings, respectively. The testing set W test in Equation (14) was composed of ictal to 770, interictal with awake state to 14,750, and interictal with sleep state to 14,690 from ‘Pt1_ictal3’ and ’Pt1_ictal4’. After obtaining trained models by multiclass SVM for a L in Equation (19) from each W train , we averaged the confusion matrix values obtained by applying the feature library a T in Equation (19) from W test to each trained model.
In order to measure the accuracy of the classification, the statistical assessment method defined in [23] was used. Since the patterns of interictal and sleep states are stable, the predictions of ictal and awake states were set to positive and those of interictal and sleep states were set to negative. The results show that only the magnitude of the phase can be also taken as a feature to classify the sleep and awake states, yielding the same outcomes as the conventional power spectrum analysis (using FFT and Wavelet).
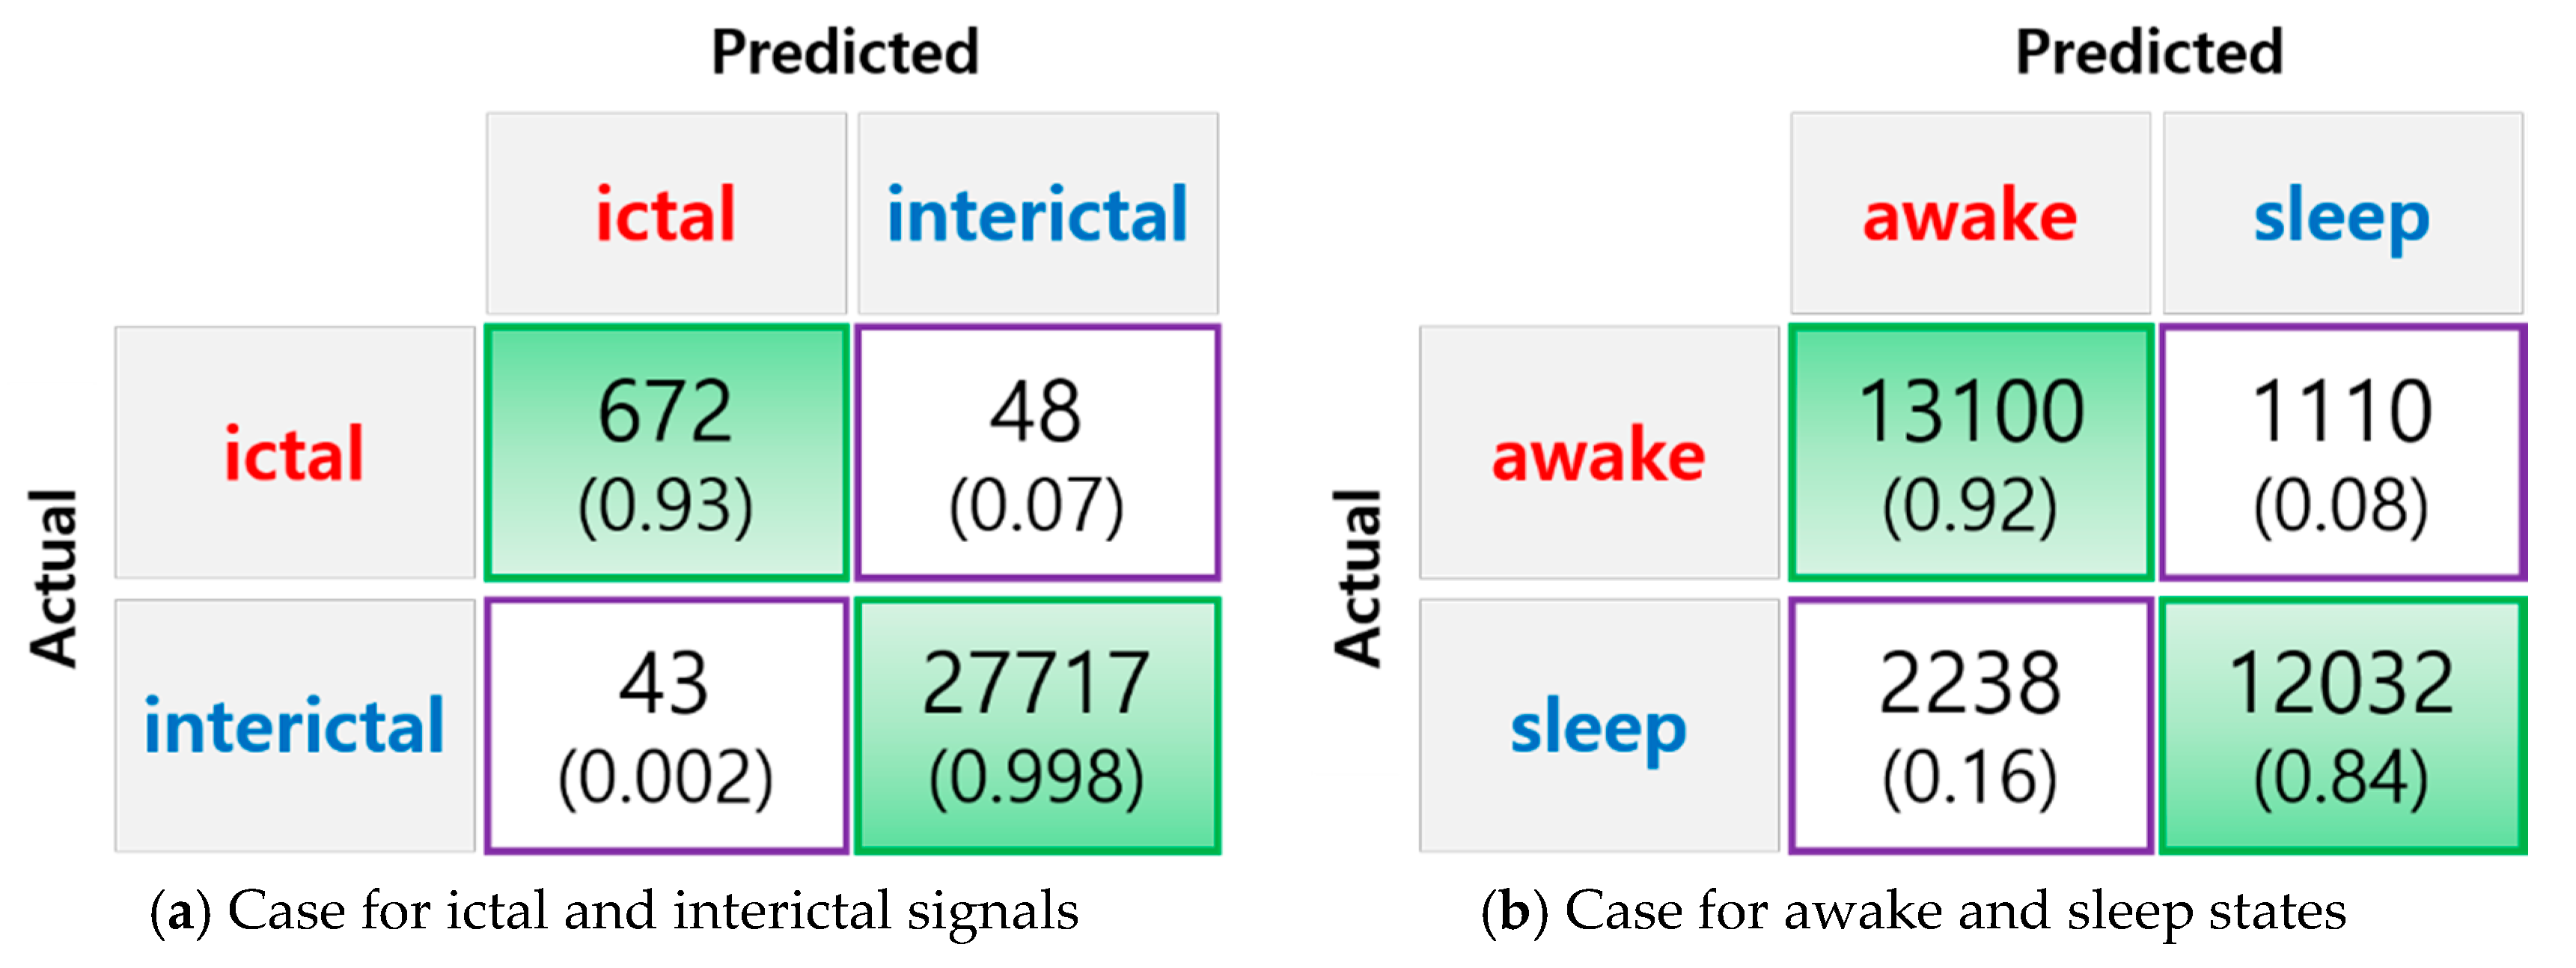
Figure 7 displays the confusion matrices of the testing data by the classifier of ictal and interictal signals and by that of awake and sleep states, and Table 2 reports the assessment of the confusion matrices of Figure 7. The classifier of ictal and interictal signals operates properly, regardless of whether the state of the testing data is awake or sleep. Similarly, the classifier for awake and sleep states also operates properly, regardless of whether the signal of the testing data is ictal or interictal. Since the high-frequency pattern of the DMD mode appears more clearly than other frequencies, it is notable that the classifier for ictal and interictal signals yields remarkable accuracy in classification even though the amount of the training data is insufficient. Consequently, the DMD can precisely capture the patterns of the signals related to an epileptic seizure.

4. Discussion

It is well known that aberrant changes in neural activity in brain neural circuits, such as a soaring synchronization of neuronal firing, can cause epileptic seizures, and that such changes are captured in the form of high-frequency EEG signals [24]. Recently, it has been revealed with valid pieces of evidence through a variety of experiments that both ictal slow shifts and HFOs were located in the same area and were useful to detect the ictal onset zone [25]. The method presented in this paper is to capture such spatio-temporal patterns in the ictal state as they are, and the experimental results show that such patterns are inherent characteristics that can be identified. The differences and advantages of the work presented in this paper compared to the existing studies are as follows:
(a)
Existing studies on the identification of the ictal onset zone mostly focus on increasing statistical accuracy by finding the proper feature method for automatic seizure detection [26,27,28,29]. In the extracted feature, it is difficult to directly understand the mechanisms and characteristics, such as the ictal slow shift and HFO, of the ictal state for the individual patient. Figure 1 and Figure 2 show the method presented in this paper directly interprets the dynamic mode of EEG signal to locate the position of the specific channel and frequency in which the slow shift phenomenon and HFO phenomenon occur and to track the state change over time of the pre-ictal and ictal state. Therefore, it is expected that the method presented in this paper can contribute significantly to further studies related to the prediction of the state of the ictal, which plays an important role in the epilepsy study.
(b)
A method of investigating the correlation between channels was recently proposed in [30] as another way of studying the mechanism of ictal phenomena for the prediction of epilepsy. In the work, it was shown that the information about changes in the network correlation provides insight for epileptic brain behavior, demonstrating that other locations of the brain are involved in the seizure other than the focus, and that there might be early indications for the seizure. The method that we present is to obtain left singular vectors that are clustered into correlated channels through the dimension reduction process for the libraries of the dynamic mode with SVD applied. Each of the left singular vectors is divided into channels that are simultaneously involved in the ictal and interictal and channels that only respond to the ictal state (for example, the figures in the third row of Figure 6a show the components of the channels and frequencies that react in both ictal and interictal states, whereas the figures in its second row identify the components that react in the ictal state only). In other words, the components of the dynamic mode contain information on both the channel and frequency, so a more sophisticated analysis can be made.
(c)
The outcome of machine learning algorithms, such as an artificial neural network (ANN) and support vector machine (SVM) algorithms, can be effectively used as physiological feedback to advanced implantable medical devices (IMDs), which will then expectantly operate in a closed-loop fashion. As a result, the efficacy of the treatment will be improved by delivering intense targeted stimulation [31]. However, due to the inherent uncertainty of the brain signals and because EEG and ECoG vary a lot depending on age, environments, drug intake, etc., it is extremely challenging [32]. In addition, in the case of epilepsy, seizure patterns for each patient not only are unique but also vary with time [33]. As a result, a generic machine learning algorithm will not efficiently work for the same patient as well as for large patient groups [34]. A more common way to approach this problem is to collect continuous EEG and ECoG data, which captures unique ictal patterns and interictal patterns for individual patients. The collected data is then used to train machine learning algorithms and to develop a patient-specific seizure prediction algorithm. However, this approach is not scalable to large patient groups as developing patient-specific machine learning models requires enormous efforts in collecting, labeling, and training the machine learning algorithms. A number of studies are underway on the development of an online seizure advisory system that automates this process [35]. However, due to the risk and complexity involved in ECoG, it is strictly restricted to clinical use. There is no ECoG data obtained from the measurement of healthy individuals’ epilepsy [30]. For this reason, from a clinical point of view, tools for prediction and identification based on ECoG data should be able to produce accurate results for subsequent observational data with the number of measurement data from a patient being minimized. Moreover, the tools should train the ECoG dataset obtained from an individual patient, considering the inherent specificities of the patient. The methodology proposed in this work meets those requirements above. In order to avoid possible errors in the derived results, these tools implement an intuitive configuration and fast calculation speed so that the features created by the tools enable us to instantly interpret the attributes associated with known ictal states and to judge whether and when the epileptic seizure occurs by monitoring the changes of magnitudes (i.e., whether the value is meaningful or not) and imaginary (i.e., phase angle) regarding the modes between channels in some special banded frequencies. Moreover, the methodology allows real-time visual monitoring of the modes.

5. Conclusions

This paper showed that each DMD mode can be configured by calculating the phase per channel for a specific frequency band of the ECoG signal, and the DMD mode allows near-accurate detection of two separate phenomena with distinct dynamic states, such as ictal and interictal. Moreover, existing studies analyzing sleep conditions have used power spectrum analysis to track changes in patterns at specific low frequencies. This paper suggested the possibility that these findings can be induced solely by comparing and analyzing the phase transition between channels.
Numerous studies have recently been conducted to classify epilepsy conditions and develop predictive models using data-based artificial intelligence or machine learning. However, data-based research is bound to show weaknesses in learning using only a small amount of precise and special data, such as ECoG. This is where the precise interpretation based on mathematical theory is needed. From this point of view, we experimentally confirmed that the DMD fits the oscillology model that describes the synchronization of cerebral signals, and if epilepsy can be represented as dynamic data that can be described by mathematical models in complex systems, the research aimed to show that even small amount of data can be interpreted correctly.
Based on the results of this study, we conclude that by analyzing the phase transition between channels of signals measured by using the DMD mode from the cerebral signal, significant results on the change of the dynamic state of the brain can be derived from the small size of data alone. However, this study was limited to one patient, so there are certain limitations. There remains a question of how inherent phase transition associated with sleep conditions or seizures present for each patient have distinct commonalities for certain patterns, and if so, how to generalize them. In addition, since it is necessary to be able to predict the next state from the existing state for practical use, we will develop a model that can predict the state transition of epilepsy using the DMD mode.
In summary, this research deals with the numerical experiment for classification of EEG signals by means of the DMD mode and it reveals that DMD helps visually understand the spatio-temporal patterns corresponding to the low frequency in the sleep state and those corresponding to the high frequency of the ictal state so that the DMD is one of the important tools for analyzing the dynamics involved in the signals of the brain.

Author Contributions

This research was conceptualized by J.-H.S., I.T., and H.K. The ECoG dataset, used in this research, were provided by Ikeda laboratory at Kyoto University with authors, A.I., M.M., R.M., and T.K., and it is curated for this research by J.-H.S. Formal analysis was performed by I.T., J.-H.S., Y.J.L. and H.K. Methodology for this research was developed by J.-H.S., Y.J.L. and H.K. This research project has been administrated by I.T. and H.K. This research was validated by I.T., Y.J.L. and H.K. The original draft and its modifications including all the figures is written by J.-H.S. and H.K. All authors have read and agreed to the published version of the manuscript.

Funding

This work was funded by Grant-in-Aid for JST Strategic Basic Research Programs, ‘An Exploration of the Principle of Emerging Interactions in Spatio-temporal Diversity, CREST Grant Number JPMJCR17A4’ and Scientific Research on Innovative Areas ‘Non-linear Neuro-oscillology: Towards Integrative Understanding of Human Nature, KAKENHI, 15H05878’ from the Ministry of Education, Culture, Sports, Science and Technology, Japan.

Acknowledgments

This work was partially supported by a grant for research from American University of the Middle East. This work was partially supported by the Research Institute for Mathematical Sciences, an International Joint Usage/Research Center located at Kyoto University.

Conflicts of Interest

The authors declare no conflict of interest.

References

  1. Fisher, R.S.; Boas, W.E.; Blume, W.; Elger, C.; Genton, P.; Lee, P.; Engel, J. Epileptic seizures and epilepsy: Definitions proposed by the International League Against Epilepsy (ILAE) and the International Bureau for Epilepsy (IBE). Epilepsia 2005, 46, 470–472. [Google Scholar] [CrossRef] [PubMed]
  2. Inoue, T.; Inouchi, M.; Matsuhashi, M.; Matsumoto, R.; Hitomi, T.; Daifu-Kobayashi, M.; Kobayashi, K.; Nakatani, M.; Kanazawa, K.; Shimotake, A.; et al. Interictal Slow and High-Frequency Oscillations: Is it an Epileptic Slow or Red Slow? J. Clin. Neurophysiol. 2019, 36, 166–170. [Google Scholar] [CrossRef] [PubMed]
  3. Abduhay, E.; Alafeef, M.; Abdelhay, A.; Al-Bashir, A. Classification of Normal, Ictal and Inter-ictal EEG via Direct Quadrature and Random Forest Tree. J. Med. Biol. Eng. 2017, 37, 843–857. [Google Scholar] [CrossRef] [PubMed] [Green Version]
  4. Liang, S.F.; Wang, H.C.; Chang, W.L. Combination of EEG Complexity and Spectral Analysis for Epilepsy Diagnosis and Seizure Detection. EURASIP J. Adv. Signal Process. 2010, 2010, 853434. [Google Scholar] [CrossRef] [Green Version]
  5. Redelico, F.O.; Traversaro, F.; Garcia, M.C.; Silva, W.; Rosso, O.A.; Risk, M. Classification of normal and pre-ictal EEG signals using permutation entropies and a generalized linear model as a classifier. Entropy 2017, 19, 72. [Google Scholar] [CrossRef]
  6. Kanazawa, K.; Matsumoto, R.; Imamura, H.; Matsuhashi, M.; Kikuchi, T.; Kunieda, T.; Mikuni, N.; Miyamoto, S.; Takahashi, R.; Ikeda, A. Intracranially recorded ictal direct current shifts may precede high frequency oscillations in human epilepsy. Clin. Neurophysiol. 2015, 126, 47–59. [Google Scholar] [CrossRef] [Green Version]
  7. Ochoa, J.G.; Rusyniak, W.G. Description of Ictal HFO Mapping in Patients with Both Temporal and Extratemporal Seizure Focus. Neurol. Res. Int. 2016, 5, 1–4. [Google Scholar] [CrossRef]
  8. Parvez, M.Z.; Paul, M. Classification of Ictal and Interictal EEG signals. In Proceedings of the 10th IASTED Conference on Biomedical Engineering, Innsbruck, Austria, 13–15 February 2013; ACTA Press: Alberta, AB, Canada, 2013; pp. 113–141. [Google Scholar]
  9. Rilling, G.; Flandrin, P.; Gonçalves, P. On empirical mode decomposition and its algorithms. In Proceedings of the IEEE-EURASIP Workshop on Nonlinear Signal and Image Processing, Grado, Italy, 8–11 June 2003; pp. 8–11. [Google Scholar]
  10. Kutz, J.N. Data-Driven Modeling & Scientific Computation: Methods for Complex Systems & Big Data; Oxford University Press: Oxford, UK, 2013; pp. 354–357. [Google Scholar]
  11. Ódor, G.; Kelling, J. Critical synchronization dynamics of the Kuramoto model on connectome and small world graphs. Sci. Rep. 2019, 9, 19621. [Google Scholar] [CrossRef]
  12. Lobier, M.; Siebenhühner, F.; Palva, S.; Palva, J.M. Phase transfer entropy: A novel phase-based measure for directed connectivity in networks coupled by oscillatory interactions. Neuroimage 2014, 85, 853–872. [Google Scholar] [CrossRef]
  13. Kutz, J.N.; Brunton, S.L.; Brunton, B.W.; Proctor, J.L. Dynamic Mode Decomposition: Data-Driven Modeling of Complex Systems; SIAM: Philadelphia, PA, USA, 2016; pp. 119–128. [Google Scholar]
  14. Solaija, M.S.J.; Saleem, S.; Khurshid, K.; Hassan, S.A.; Kamboh, A.M. Dynamic Mode Decomposition Based Epileptic Seizure Detection from Scalp EEG. IEEE Access. 2018, 6, 38683–38692. [Google Scholar] [CrossRef]
  15. Tu, J.H.; Rowley, C.W.; Luchtenburg, D.M.; Brunton, S.L.; Kutz, J.N. On dynamic mode decomposition: Theory and applications. J. Comput. Dyn. 2014, 1, 391–421. [Google Scholar] [CrossRef] [Green Version]
  16. Murai, T.; Hitomi, T.; Matsuhashi, M.; Matsumoto, R.; Kawamura, Y.; Kanda, M.; Takahashi, R.; Ikeda, A. Scalp-EEG could record both ictal DC shift and HFO together even with time constant 2 sec. J. Clin. Neurophysiol. 2019, in press. [Google Scholar]
  17. Ikeda, A.; Taki, W.; Kunieda, T.; Terada, K.; Mikuni, N.; Nagamine, T.; Yazawa, S.; Ohara, S.; Hori, T.; Kaji, R.; et al. Focal ictal DC shifts in human epilepsy as studied by subdural and scalp recording. Brain 1999, 122, 827–838. [Google Scholar] [CrossRef] [PubMed] [Green Version]
  18. Schmid, P.J. Dynamic mode decomposition of numerical and experimental data. J. Fluid Mech. 2010, 656, 5–28. [Google Scholar] [CrossRef] [Green Version]
  19. Antoulas, A.C. Approximation of Large-Scale Dynamical System; SIAM: Philadelphia, PA, USA, 2005; pp. 31–57. [Google Scholar]
  20. Brunton, L.A.; Johnson, J.G.; Ojemann, J.G.; Kutz, J.N. Extracting spatial–temporal coherent patterns in large-scale neural recordings using dynamic mode decomposition. J. Neurosci. Methods 2016, 258, 1–15. [Google Scholar] [CrossRef] [Green Version]
  21. Gavish, M.; Donoho, D.L. The optimal hard threshold for singular values is 4 / 3 . IEEE Trans. Inf. Theory 2014, 60, 5040–5053. [Google Scholar] [CrossRef]
  22. Kecman, V.; Huang, T.-M.; Vogt, M. Iterative Single Data Algorithm for Training Kernel Machines from Huge Data Sets: Theory and Performance. In Support Vector Machines: Theory and Applications; Wang, L., Ed.; Springer: Berlin, Germany, 2005; pp. 255–274. [Google Scholar]
  23. Sokolova, M.; Lapalme, G. A systematic analysis of performance measures for classification tasks. Inf. Process Manag. 2009, 45, 427–437. [Google Scholar] [CrossRef]
  24. Focus on Epilepsy. Available online: https://www.nature.com/articles/nn.3964.pdf (accessed on 19 May 2019).
  25. Imamura, H.; Matsumoto, R.; Inouchi, M.; Matsuhashi, M.; Mikuni, N.; Takahashi, R.; Ikeda, A. Ictal wideband ECoG: Direct comparison between ictal slow shifts and high frequency oscillations. Clin. Neurophysiol. 2011, 122, 1500–1504. [Google Scholar] [CrossRef]
  26. Chen, Z.; Huang, L.; Shen, Y.; Wang, J.; Zhao, R.; Dai, J. A new algorithm for classification of ictal and pre-ictal epilepsy ECoG using MI and SVM. In Proceedings of the 2017 International Conference on Signals and Systems(ICSigSys), Sanur, Indonesia, 16–18 May 2017; pp. 212–216. [Google Scholar]
  27. Lu, Y.; Ma, Y.; Chen, C.; Wang, Y. Classification of single-channel EEG signals for epileptic seizures detection based on hybrid features. Technol. Health Care 2018, 26, 337–346. [Google Scholar] [CrossRef] [Green Version]
  28. Nandy, A.; Alahe, M.A.; Nasim Uddin, S.M.; Alam, S.; Nahid, A.; Awal, M.A. Feature Extraction and Classification of EEG Signals for Seizure Detection. In Proceedings of the 2019 International Conference on Robotics, Electrical and Signal Processing Techniques (ICREST), Dhaka, Bangladesh, 10–12 January 2019; pp. 480–485. [Google Scholar]
  29. Zhou, M.; Tian, C.; Cao, R.; Wang, B.; Niu, Y.; Hu, T.; Guo, H.; Xiang, J. Epileptic Seizure Detection Based on EEG Signals and CNN. Front. Aging Neurosci. 2018, 12. [Google Scholar] [CrossRef] [Green Version]
  30. Yekutieli, Z.; Ben-Jacob, E. ECoG Correlation Variation for Epilepsy Research. Epilepsy J. 2018, 4, 1–6. [Google Scholar] [CrossRef]
  31. Ramgopal, S.; Thome-Souza, S.; Jackson, M.; Kadish, N.E.; Fernández, I.S.; Klehm, J.; Bosl, W.; Reinsberger, C.; Schachter, S.; Loddenkemper, T. Seizure detection, seizure prediction, and closed-loop warning systems in epilepsy. Epilepsy Behav. 2014, 37, 291–307. [Google Scholar] [CrossRef] [PubMed] [Green Version]
  32. Andrzejak, R.G.; Chicharro, D.; Elger, C.E.; Mormann, F. Seizure prediction: Any better than chance? Clin. Neurophys. 2009, 120, 1465–1478. [Google Scholar] [CrossRef]
  33. Freestone, D.R.; Karoly, P.J.; Cook, M.J. A forward-looking review of seizure prediction. Curr. Opin. Neurol. 2017, 30, 167–173. [Google Scholar] [CrossRef]
  34. Cook, M.J.; O’Brien, T.J.; Berkovic, S.F.; Murphy, M.; Morokoff, A.; Fabinyi, G.; D’Souza, W.; Yerra, R.; Archer, J.; Litewka, L.; et al. Prediction of seizure likelihood with a long-term, implanted seizure advisory system in patients with drug-resistant epilepsy: A first-in-man study. Lancet Neurol. 2013, 12, 563–571. [Google Scholar] [CrossRef]
  35. Karuppiah Ramachandran, V.R.; Alblas, H.J.; Le, D.V.; Meratnia, N. Towards an Online Seizure Advisory System—An Adaptive Seizure Prediction Framework Using Active Learning Heuristics. Sensors 2018, 18, 1698. [Google Scholar] [CrossRef] [Green Version]
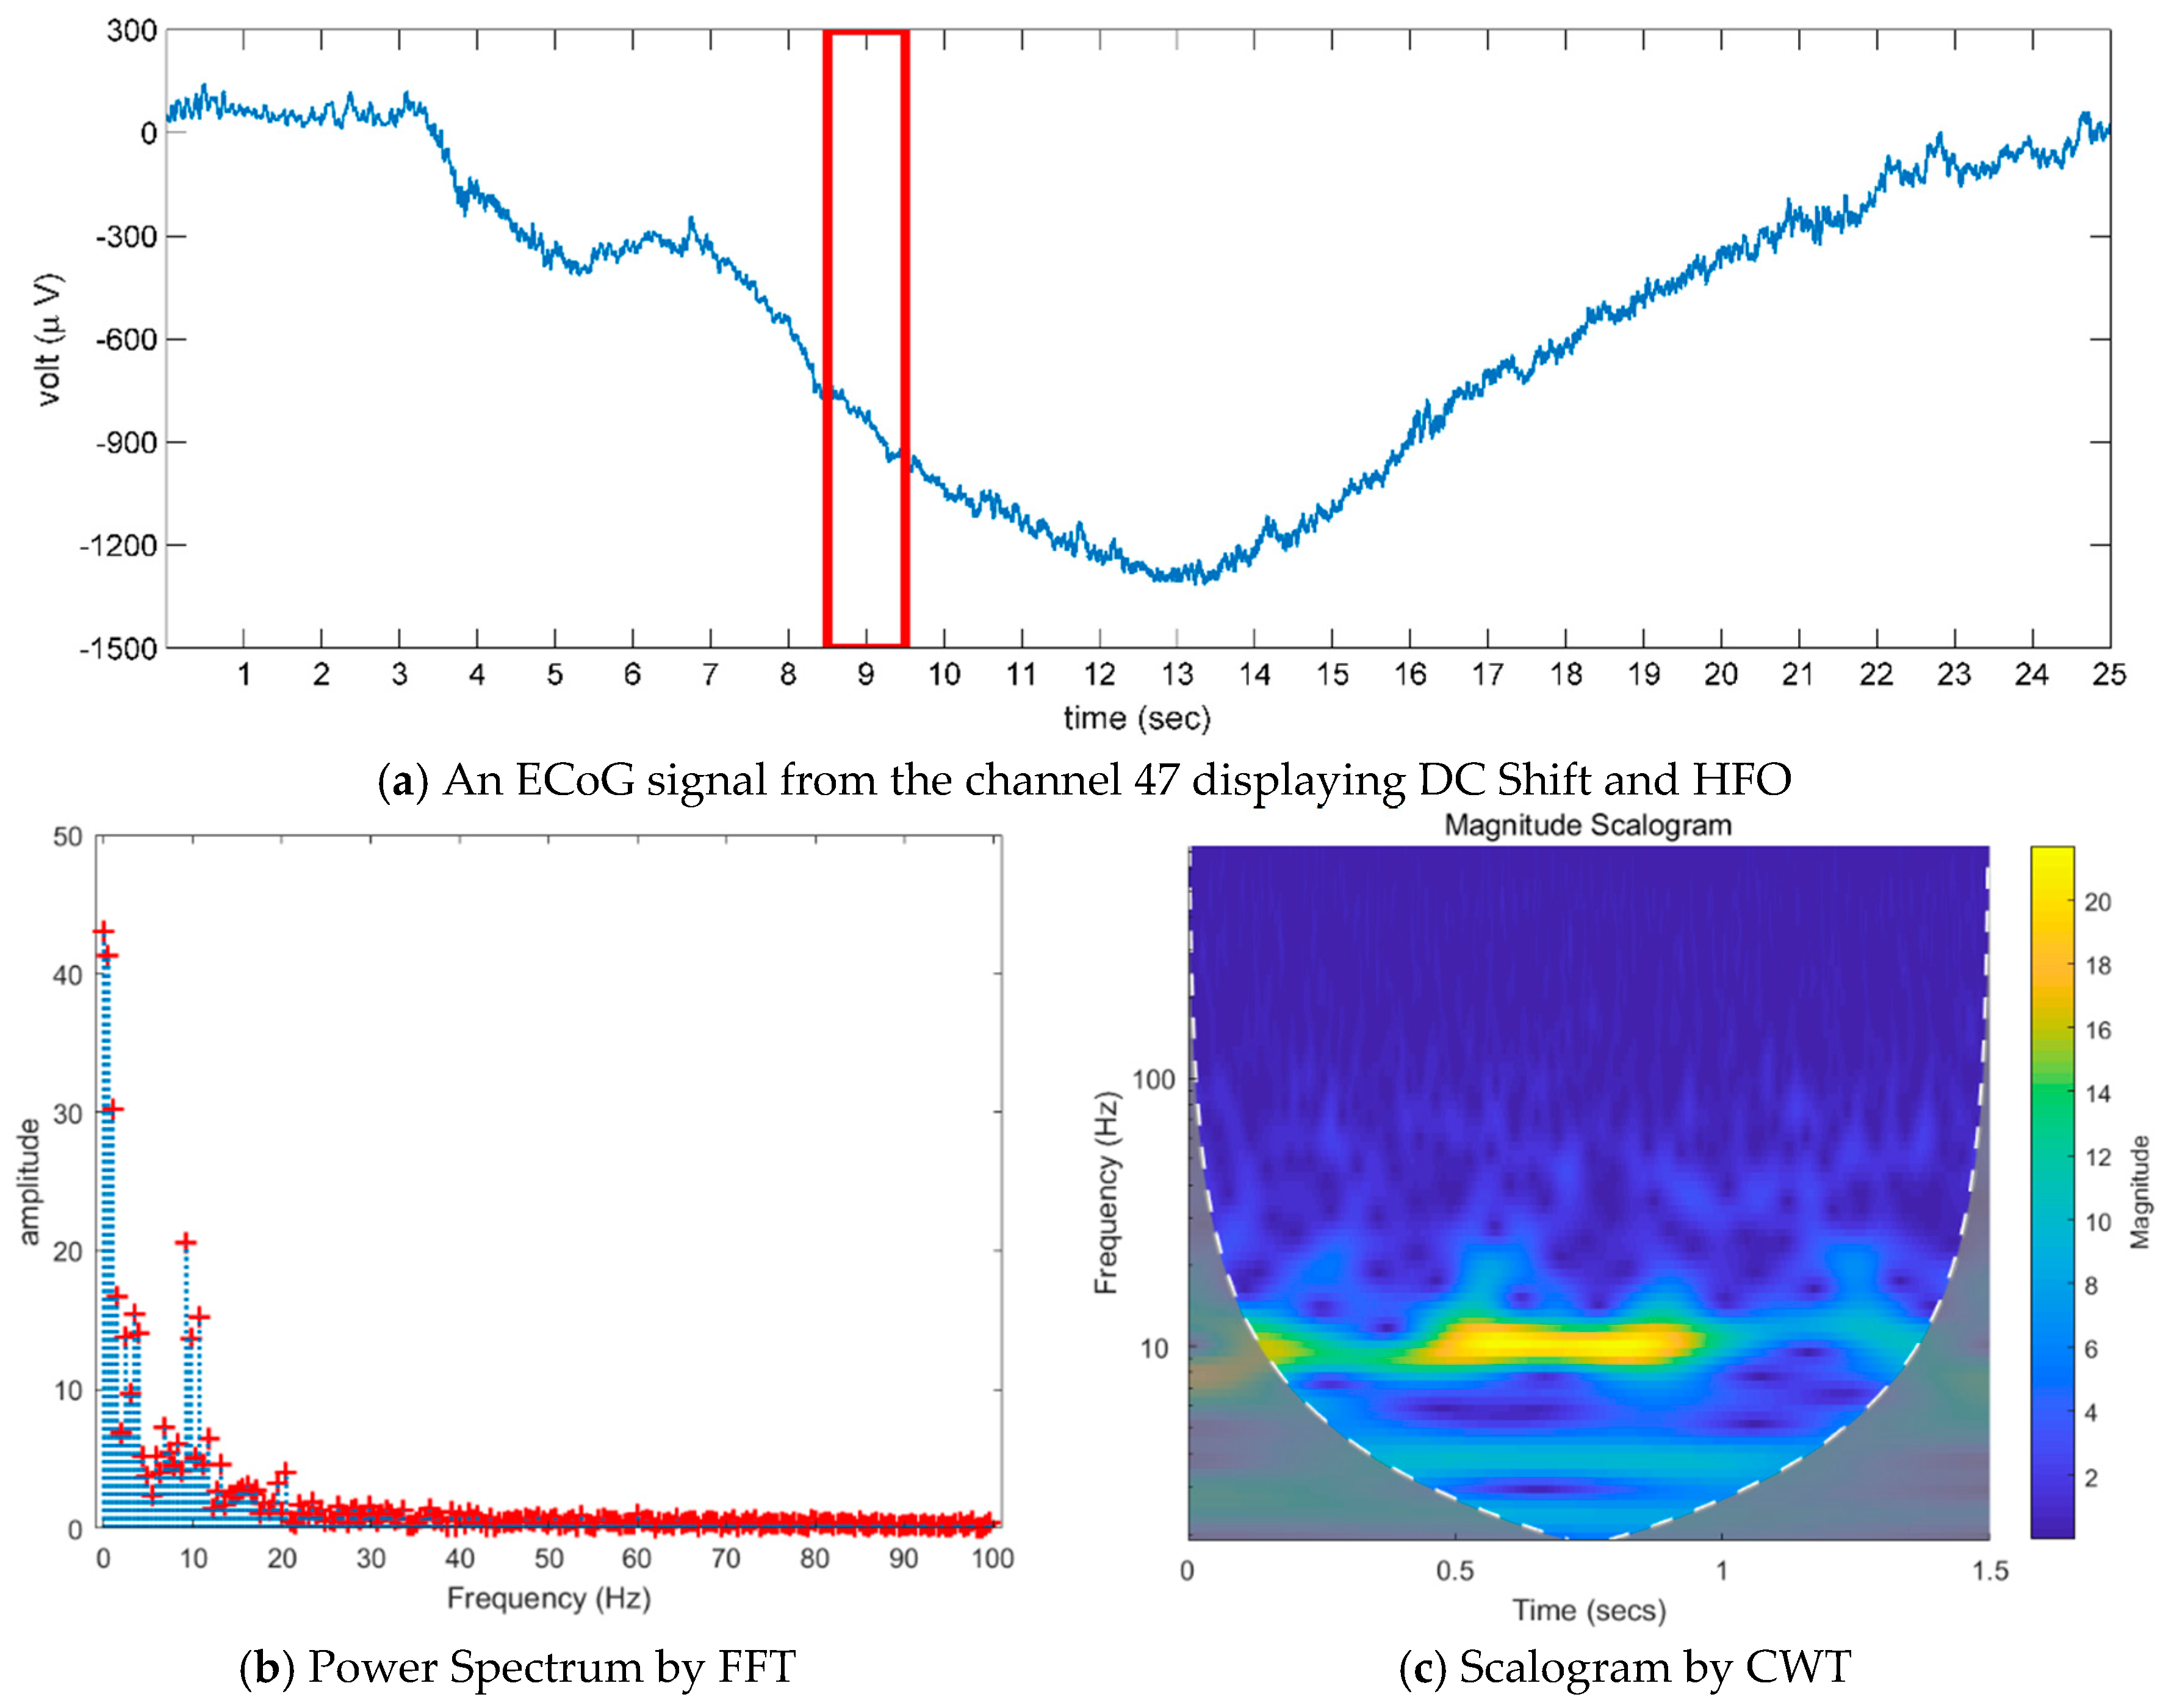
Figure 1. An ECoG signal for a specific channel including the DC shift and the HFO phenomena and three different kinds of transformations. This illustrates that the DMD method provides much clearer visibility for the HFO zone than the two other methods, fast Fourier transform (FFT) and continuous wavelet transform (CWT) (a) The ECoG signal from the channel 47 with 2000 Hz of sampling rate and one-second time lapse of window size. The red rectangle indicates the time frame to be used for the three types of transformations. (b) The power spectrum information based on FFT. (c) Scalogram by CWT. It characterizes the periods of increased volatility, obtaining the CWT of the data using the analytic Morlet wavelet [10]. (d) The power spectrum information based on DMD. (e) The magnitudes of DMD modes.
Mathematics 08 00481 g001aMathematics 08 00481 g001b
Figure 2. Comparison of analysis of the signals from three specific channels by FFT and by DMD. (a) The shape of the signals and the functions defined for the signals. The first and second signals are derived with the same eigenfunction, and there is a phase difference of 0.8 for the second eigenfunction with period 7. (b) Power spectrum graphs by calculating each channel by fast Fourier transformation. Phase transition for channels 1 and 2 cannot be determined. (c) Graphs of mode values calculated by dynamic mode decomposition on the signals.
Mathematics 08 00481 g002
Figure 3. Suggested steps for classification of ECoG recordings.
Mathematics 08 00481 g003
Figure 4. Sampling process for training data. A total of k signals are presented above. Each EEG signal was obtained for one second of time lapse, and it consists of a total of 250 uniformly chosen snapshots from 2000 snapshots for each signal. Note that after the i th EEG signal is obtained, the next EEG signal, the ( i + 1 ) st EEG signal is then obtained with 0.2 s of waiting time. Therefore, the adjacent EEG signals have data in common for 0.8 s, equivalently, 200 snapshots.
Mathematics 08 00481 g004
Figure 5. Examples of the patterns of DMD modes (a) for interictal signals in the awake state, (b) for interictal in sleep, (c) for ictal in awake, and (d) for ictal in sleep. This displays the truncated DMD mode in Equation (10) and the spectral information in Equations (13) for a segmented signal. The high-frequency pattern of the ictal signal appears more clearly than that of the interictal signal does.
Mathematics 08 00481 g005
Figure 6. Patterns of left singular vector space and distribution of feature, which refer to the columns of U d and a L in Equation (19), respectively. The five images in the first column are obtained from reshaping the magnitudes of the first five singular vectors into the form of the DMD mode. Here, the horizontal axis represents frequency and the vertical one channel. In each image in the second column, all the components of features associated with each singular vector are plotted. Here, each red circle represents an ictal signal or awake state as implying positivity, while each blue rectangle represents an interictal signal or sleep state as implying negativity. Here, the horizontal axis represents the index of the signal, and the vertical one weight. The images in the third column represent the distribution of features in three-dimensional space according to the components of the singular vector.
Mathematics 08 00481 g006aMathematics 08 00481 g006b
Figure 7. The ensemble average of confusion matrices for classification. The values in each table are averages of the confusion matrices obtained from 10 experiments. In this case, the values in the parentheses are row-wise normalized.
Mathematics 08 00481 g007
Table 1. Details of four epileptic ECoG recordings used in the dataset. The entire dataset was obtained from one patient. All of the recordings were resampled at 250 Hz (250 per second) and contain the spatial information of 49 channels for each snapshot. Each EEG signal corresponds to a matrix of one-second duration snapshots combined in the column direction, and it was collected every 0.2 s.
Record NameStateNo. of Snapshots (Total/Ictal)Time (sec) (Total/Ictal)No. of Signals (Total/Ictal)Type
Pt1_ictal1Awake692,000/13,2012768/52.811,835/264Training
Pt1_ictal2Sleep735,000/16,2342940/64.914,690/325Training
Pt1_ictal3Sleep737,750/24,4072951/97.614,750/489Testing
Pt1_ictal4Awake734,750/11,5452939/46.214,690/231Testing
Table 2. Statistics for the confusion matrices in Figure 7. The measurements in the table have the following meanings: ‘ Accuracy ’ represents the overall effectiveness of a classifier, ‘ Sensitivity ’ represents the effectiveness of a classifier to identify positive labels, and ‘ Specificity ’ represents how effectively a classifier identifies negative labels. In the formulas for these measurements, the values TP , FN , TN , and FP are used, and they mean ‘true positive’, ‘false negative’, ‘true negative’, and ‘false positive’, respectively. These values are obtained directly from the confusion matrix.
StatisticsMeasurement
AccuracySensitivitySpecificity
TP + TN TP + TN + FP + FN TP TP + FN TN TN + FP
Ictal vs. Interictal99.68%93.99%99.83%
Awake vs. Sleep88.24%85.41%91.55%