


Abstract
An optimal restoration strategy for supply chain networks can efficiently schedule the repair activities under resource limits. However, a wide range of previous studies solve this problem from the perspective of cost-effectiveness instead of a resilient manner. This research formulates the problem as a network maximum-resilience decision. We develop two metrics to measure the resilience of the supply chain networks, i.e., the resilience of cumulative performance loss and the resilience of restoration rapidity. Then, we propose a bi-objective nonlinear programming model, which aims to maximize the network resilience under the budget and manpower constraints. A modified simulated annealing algorithm is employed to solve the model. Finally, a testing supply chain network is utilized to illustrate the effectiveness of the proposed method framework. The results show that the optimal restoration schedule generated by the proposed model is a tradeoff between the cumulative performance loss and the restoration rapidity. Additionally, the sensitivity analysis of parameters indicates that decision-maker’s preference, tolerance factor of delivery time, number of work crews, and availability of budget all have significant impacts on the restoration schedule.
1. Introduction
With the development of the manufacturing industry, improvement of living standards for citizens and growth in global trade, various countries have built huge and complex supply chain networks, which contribute significantly to economic and social prosperity [1]. However, due to natural disasters, man-made hazards, and internal failures, supply chain networks have become a vulnerable system and are more inclined to suffer from unexpected disruptions [2,3,4], which may bring about tremendous losses and additional costs. As such, it is essential for decision-makers to recover the supply chain networks after a disruption occurs so that the networks can return to operation as soon as possible. To this end, a restoration strategy for supply chain networks has attracted the attention of many researchers. Particularly, the main purpose of the strategy is to save restoration costs, improve recovery rapidity, and reduce economic losses [5].
There are two research streams in the existing literature focusing on network restoration problems. One of the two streams defines restoration optimization as an optimal resource allocation problem, which determines which network components to repair [6,7]. For example, Zhang et al. employ an inoperability input–output model for allocating restoration resources of a disrupted infrastructure network [8]. The other stream denotes the restoration problem as a resource constrained project scheduling problem, which identifies the precedence relationship among all the restoration activities [9,10]. For instance, Nurre et al. use a discrete event simulation model to determine how to schedule repair tasks for infrastructure systems [11]. However, it is rare in literature to concentrate on this problem taking network resilience into account. The interaction between the restoration decision and the evolution of network performance during the recovery process has not been completely considered. Additionally, a comprehensive and accurate evaluation of the supply chain network resilience has not been well investigated.
In view of this, the paper aims to investigate the optimization of the restoration schedule for supply chain networks from the perspective of resilience. This work makes the following three contributions. (1) We develop two metrics to assess the cumulative performance loss and restoration rapidity of the supply chain network. (2) We propose a bi-objective nonlinear programming model to formulate the restoration optimization problem aiming to maximize the network resilience subject to resource constraints. (3) We illustrate the proposed method on a testing supply chain network and analyze the effects of relative model parameters on the restoration results.
The remainder of this paper is organized as follows. Section 2 reviews the previous studies on the network restoration modeling approach. Section 3 develops a mathematical model to formulate the restoration problem and presents the model solution. Section 4 tests the proposed method framework using a case study and analyzes the sensitivity of relevant parameters. Conclusions and future work are discussed in Section 5.
2. Literature Review
In the literature, there is a wide range of studies that have been carried out focusing on the network restoration problem [12,13,14], which aims to determine the selection of facilities in the network to be maintained and the maintenance time sequence of these facilities [15,16]. For instance, Liu et al. proposed a two-stage stochastic programming model to generate an optimal strategy to determine what bridges need maintenance in a highway network with uncertainty [17]. Chen and Miller-Hooks presented a stochastic mixed-integer programming model to obtain a recovery scheduling for intermodal freight transportation networks with a fixed budget under different disruptive events [18]. In this section, we mainly review the approaches that have been adopted to solve this problem. The existing approaches can be classified into two groups, i.e., the mathematical programming approach [19,20] and the simulation-based approach [21,22]. The approach employed in this research falls in the first group.
The mathematical programming approach formulates the restoration problem as a nonlinear or linear mathematical model. Mixed-integer programming (MIP) and its variants are commonly used methods, which determine whether or not every single component in the network is to be restored using a binary variable. For example, Ciric and Popovic develop a MIP model combined with a heuristic approach with multiple objectives to solve a distribution network restoration problem [15]. To make the post-disaster restoration planning of infrastructure networks, Fang and Sansavini propose a mixed-integer binary linear programming model maximizing the network performance subject to the investment cost and network connectivity [23]. González et al. develop a MIP model subject to budget, resources, and operational constraints to generate a minimum-cost restoration strategy of a partially destroyed infrastructure network [24]. These applications of MIP models assume that all the model parameters are deterministic, e.g., complete information on resources and known duration of the restoration activities. However, in the real world, some uncertainties may exist in the restoration decision-making process. Hence, the decisions generated by the deterministic MIP models are probably suboptimal or even infeasible. To fill this gap, many other researchers have applied stochastic programming (SP) to deal with this problem. For instance, Fang and Sansavini put forward a two-stage stochastic optimization model considering the effects of uncertain restoration time and availability of resources to determine the optimal post-disruption restoration strategy of critical infrastructure networks [25]. Sanci and Daskin propose an SP model integrating facility location and network restoration decisions with uncertain durations of recovery tasks for restoration decisions in relief networks [26]. Xu et al. present a stochastic integer programming model to schedule the repair activities taking the uncertainty of restoration times into account [27]. It is easy to understand that the models mentioned above are NP hard, which are difficult to obtain the optimal solution even if for small problems [28]. Hence, most of the previous studies solved the scheduling models with heuristic and metaheuristic algorithms, e.g., tabu search, genetic algorithm, simulated annealing algorithm, particle swarm algorithm.
The simulation-based approach is another technique employed to solve the restoration problems. Schmitt and Singh develop a discrete-event simulation to assess the effects of inventory placement and back-up on reducing the disruption risks for a multi-echelon supply chain network [29]. Carvalho et al. illustrate an ARENA-based simulation model on an automotive supply chain to evaluate how different mitigation strategies improve supply chain performance [30]. Xu et al. utilize the AnyLogic software combined with a resilience model to simulate the structural evolution mechanism of random disruptions at suppliers and recovery policies for supply chain networks [31]. For the supply chain network recovery problem, the inventory model is also used as a simulation method, which optimizes the inventory system responding to disruptions. Hishamuddin et al. present an inventory-based recovery model with consideration of the interaction between the inventory system and the recovery schedule, which minimizes the total relevant costs during the recovery time window [32].
3. Methodology
3.1. Assumption
This research is carried out based on the following assumptions:
- (1)
- Each disrupted link in the supply chain network is not operational until it is completely recovered.
- (2)
- All supplies are delivered from the supply nodes to the demand nodes through the fastest path in the network.
- (3)
- Each work crew can only work on the restoration of a disrupted link at a time.
- (4)
- Each link is restored only by one work crew.
- (5)
- Each restoration activity is non-preemptive, i.e., each restoration activity is implemented only once over the restoration time horizon.
- (6)
- The amount of demands from supply nodes to demand nodes is fixed and does not vary over the restoration time horizon.
3.2. Notation
The notations used in this study are given as follows:
Sets and Indices
A Set of links in the supply chain network, indexed by .
T Set of discrete-time periods, indexed by .
Set of available work crews, indexed by .
N Set of all nodes in the network, indexed by .
Set of supply nodes in the network, .
Set of demand nodes in the network, .
Set of disrupted links in the network, .
Set of origin-destination (OD) pairs between supply node and demand node , indexed by .
Set of paths that connect OD pair k at time t, indexed by , , .
Parameters
Amount of demands between supply node and demand node .
Travel time of link in the network.
Pre-disruption delivery time from supply node and demand node .
Travel time of the pth path from supply node and demand node at time t, , .
Minimum delivery time from supply node and demand node , .
Cost of restoration for link in the network.
Duration of restoration for link in the network.
Maximum acceptable makespan of the entire restoration process.
B Budget limit of the restoration.
Tolerance factor of delivery time.
Decision Variables
Resilience of cumulative loss.
Resilience of restoration rapidity.
M Makespan of the entire restoration process.
Supply chain network performance at time t, .
Variable indicating whether or not the demand is satisfied at time t, .
C Total cost of all the restoration activities.
Flow through the link from node i to node j at time t, .
Binary variable that represents , if link lies on the pth path, otherwise, , , .
Binary variable that represents , if link is to be restored by work crew r at time t, otherwise, , , .
3.3. Problem Statement
We define a bi-directional supply chain network as an undirected network G=(N, A), where N is a set of all nodes and is a set of all links. Moreover, there is a set of supply nodes and a set of demand nodes . The disrupted links in the supply chain network are denoted as . There exists a fixed amount of demands from supply nodes to demand nodes in the supply chain network.
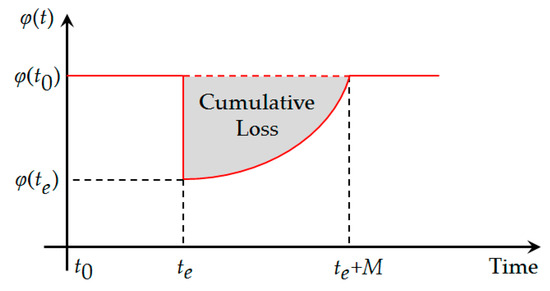
Figure 1 presents the post-disruption recovery process of supply chain networks. Assume that a disruptive event occurs at time , which destroys a set of links in the network. As a result, the performance of the supply chain network will drop to from in the pre-disruption period. Responding to the disruption immediately, a restoration strategy is determined and implemented at time to gradually restore the network performance to a target value at time . The makespan of the restoration strategy is M.
Figure 1.
Post-disruption recovery process of supply chain networks.
Herein, the network performance is time-dependent, which is defined as the total OD demand satisfaction ratio [2,12,18] in this work. is formulated as in Equation (1).
where is the satisfied OD demands at time t. indicates whether or not the demand from supply node i to demand node j is satisfied. Since we assume that all supplies are delivered from the supply nodes to the demand nodes by the fastest path, the minimum travel time between each OD pair at time t is solved by the Dijkstra method [33,34] formulated in Equations (3) and (4).
3.4. Resilience Metrics
3.4.1. Resilience of Cumulative Loss
According to the definition of the network performance in Section 3.3, when a disruptive event occurs, the network performance will not be returned to its original level until all the road segments are restored. The fraction of OD demand at time t, t that can be satisfied post-disruption is defined as the network performance loss [2]. The cumulative loss of network performance is illustrated by the shaded area in Figure 1 and formulated by Equation (5). The level to which the cumulative loss is reduced represents the effectiveness of the restoration strategy [35].
Hence, we define the normalized resilience of cumulative loss () as in Equation (6). There is a positive correlation between and the effectiveness of the restoration strategy, i.e., the higher is, the more effective the restoration strategy.
3.4.2. Resilience of Restoration Rapidity
In addition to the cumulative loss of performance, restoration rapidity is another important metric to evaluate the effectiveness of the restoration process [36]. Restoration rapidity measures the recovery speed, which has a great priority of the restoration strategy. Hence, we employ the resilience of restoration rapidity () as another resilience metric in this work, which is normalized and formulated as in Equation (7). The higher is, the faster the supply chain network is recovered.
3.5. Modeling
For supply chain networks, recovering the network performance as quickly as possible and satisfying the OD demands to the greatest extent are the two top priorities during the restoration process. Therefore, the optimal restoration schedule should aim to accomplish these two objectives. Additionally, to avoid falling to get a unique optimal solution, a bi-objective programming model is feasible in this work. In this subsection, we propose a bi-objective nonlinear programming model formulated in Equations (8)–(19), which focuses on the optimal restoration schedule for supply chain networks.
Subject to constraints:
Equation (8) is an objective function, which maximizes the resilience of cumulative loss for the supply chain networks during the restoration makespan M. Another objective function in Equation (9) aims to maximize the resilience of restoration rapidity. Equation (10) defines the total restoration costs, i.e., the sum of restoration costs of all damaged links to be recovered . The total restoration costs C cannot exceed the availability of budget B as shown in Equation (11). Equation (12) indicates the flow conservation at each transshipment node [35]. Equation (13) defines the makespan M of the restoration schedule, which is the maximum end time of all the damaged links to be restored . Equation (14) ensures that the restoration of each link is non-preemptive, i.e., the restoration of each link is implemented only once over the restoration time horizon. Equation (15) guarantees that each work crew cannot finish the restoration of the link prior to it restoration duration. in Equation (16) define the ongoing restorations of disrupted links at time t by work crew . These constraints ensure that each work crew can concentrate on the restoration of at most one disrupted link. Similarly, the amount of the links restored simultaneously cannot exceed the number of work crews at time t as shown in Equation (17). Equation (18) sets the flow on the link as nonnegative values. Equation (19) represents the binary restoration variables for disrupted links .
3.6. Model Solution
Before the algorithm, we first transform the bi-objective model into a single-objective model using different weight factors to both of the objective functions as in Equation (20).
Herein, is the weight factor, which indicates the decision-maker’s preference.
Then, we employ the simulated annealing (SA) algorithm. It is not difficult to know that the optimal restoration strategy for supply chain networks is an NP-hard combinational optimization problem [37]. SA has been proven as an effective algorithm to solve this type of problem [38,39,40]. SA is a local search algorithm based on the concept of physical annealing of solids, which can escape from being trapped into local optima by accepting worse solutions with a low possibility. This algorithm starts with an initial solution and a high initial temperature. Then, it performs the iteration following the principle as “new solution generation objection function value calculation acceptance or rejection of new solutions” with an annealing schedule [41]. The solution at the end of the iteration is considered optimal. The framework of the SA algorithm for solving the proposed equivalent single-objective model is presented in Algorithm 1.
| Algorithm 1 Pseudo code of SA procedure |
| //Initialization Randomly generate an initial solution , and the initial objection function value is ; ; w=0; //The outer iteration times ; //Initial Temperature ; //Freezing Temperature while not stop //The search loop under the temperature for l = 1 to L //The inner iteration times Generate a new feasible solution based on the current solution , and calculate the objection function value . if ; if ; ; continues; end if Calculate the acceptance probability ; if random(0,1) < P ; end if end for //Drop down the temperature ; =+1 end while end procedure |
4. Case Study
4.1. Supply Chain Network and Basic Data
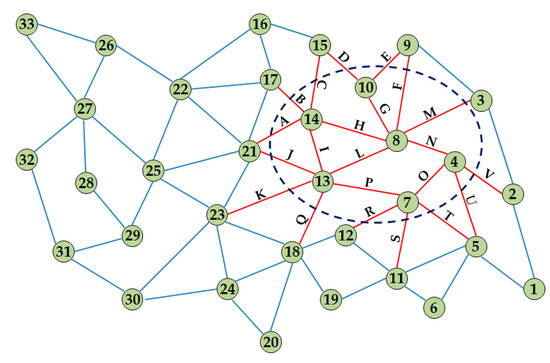
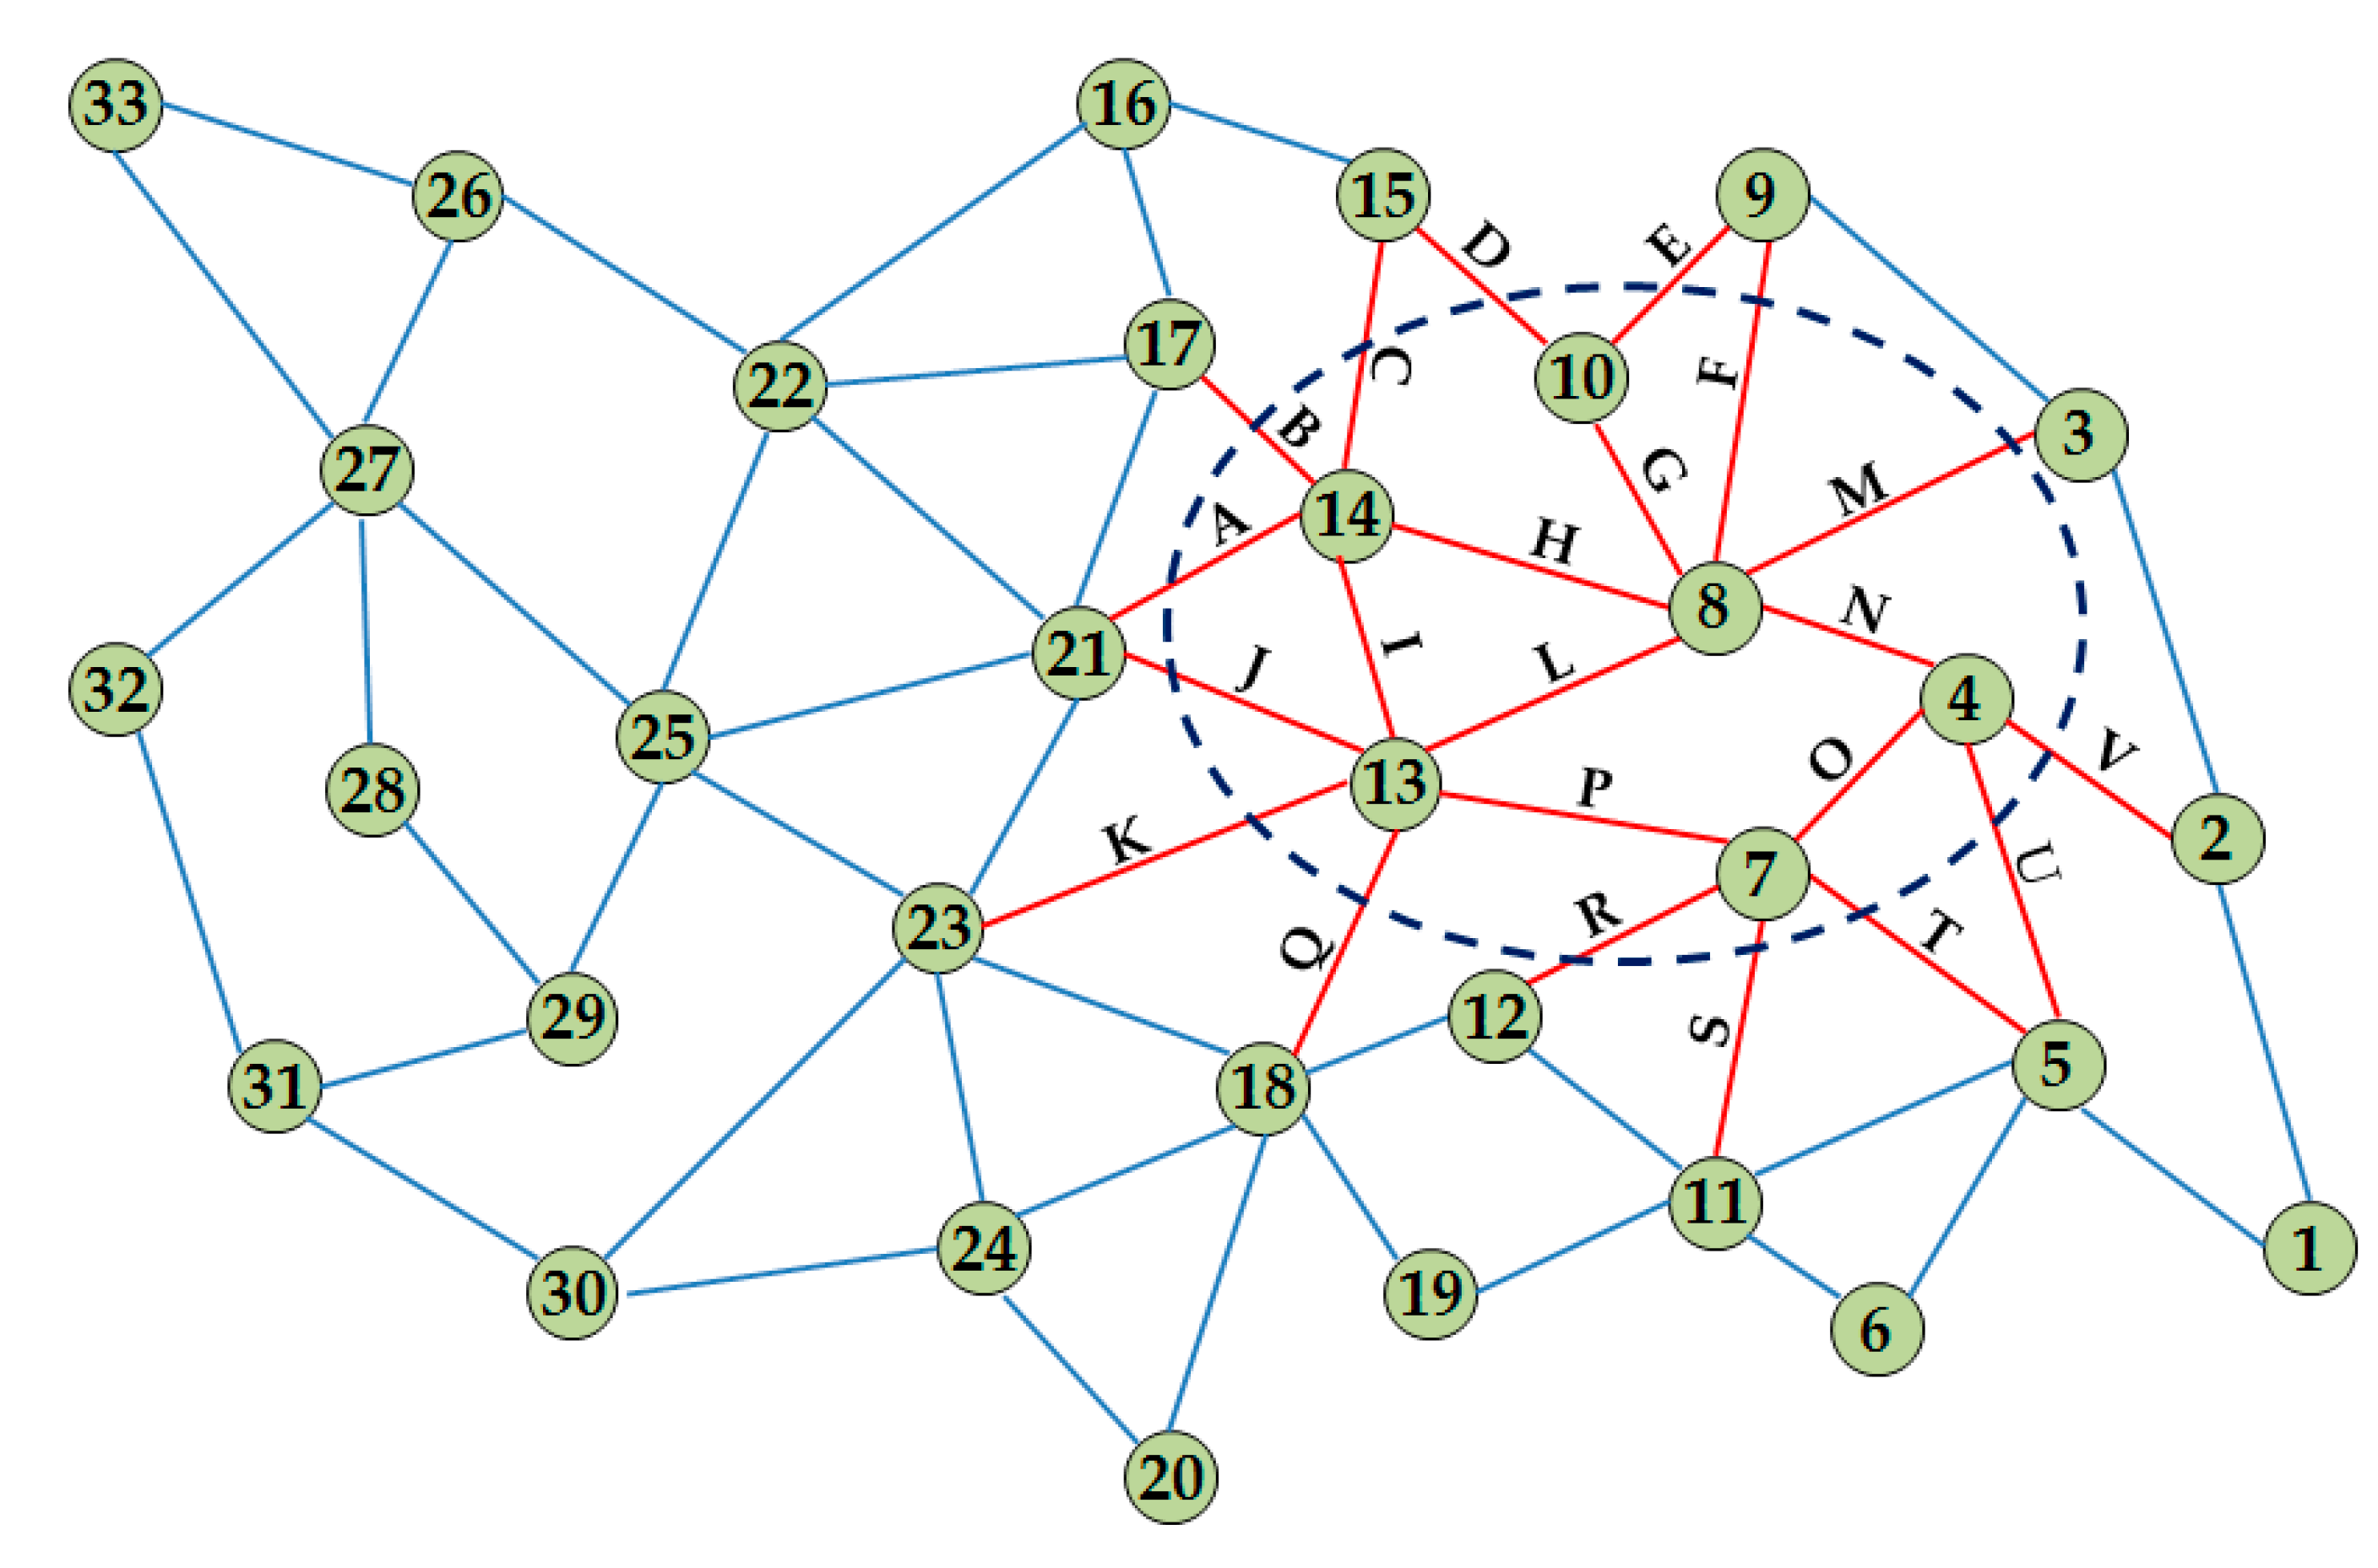
We use the supply chain shown in Figure 2 to demonstrate the effectiveness of the proposed method framework. The network consists of 33 nodes and 62 road segments (each road segment has two links). The characteristics of all links are presented in Table 1, where a is the road segment ID; each link is from node i to node j; and the unit of is h. The daily demands of the 39 OD pairs are listed in Table 2, where k is the ID of each OD pair and the unit of is freight-unit.
Figure 2.
Layout of the supply chain network.
Table 1.
Characteristics of all links.
Table 2.
OD pairs and their demands.
Assume that a disaster occurs at t = 1, which incurs complete damages to the 22 road segments in the dashed-line circle shown in Figure 2. Namely, every single damaged road segment is disrupted in both directions. Decision-makers plan to restore the disrupted roads with an available budget of 2000 fund-units. The restoration duration and cost of each disrupted road segment are presented in Table 3, where the units of and are fund-unit and day, respectively.
Table 3.
Restoration duration and cost of each disrupted road segment (RS).
The other parameters are valued as follows:
, , = 0.5, = 200, = 0.01,
The procedure is implemented using the commercial solvers CPLEX (version 12.7.1). All experiments are conducted on a Windows 10 PC with an Intel Core i7-9700 CPU (4.6 GHz) and 16.0 GB DDR4 (2400 MHz).
4.2. Results
4.2.1. Pre-Disruption Path
The pre-disruption fastest path between each OD pair generated by the Dijkstra method shown in Equations (3) and (4) is illustrated in Table 4.
Table 4.
Pre-disruption fastest path (FP) between each OD pair.
4.2.2. Optimal Restoration Schedule
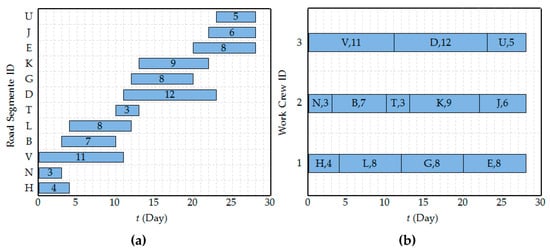
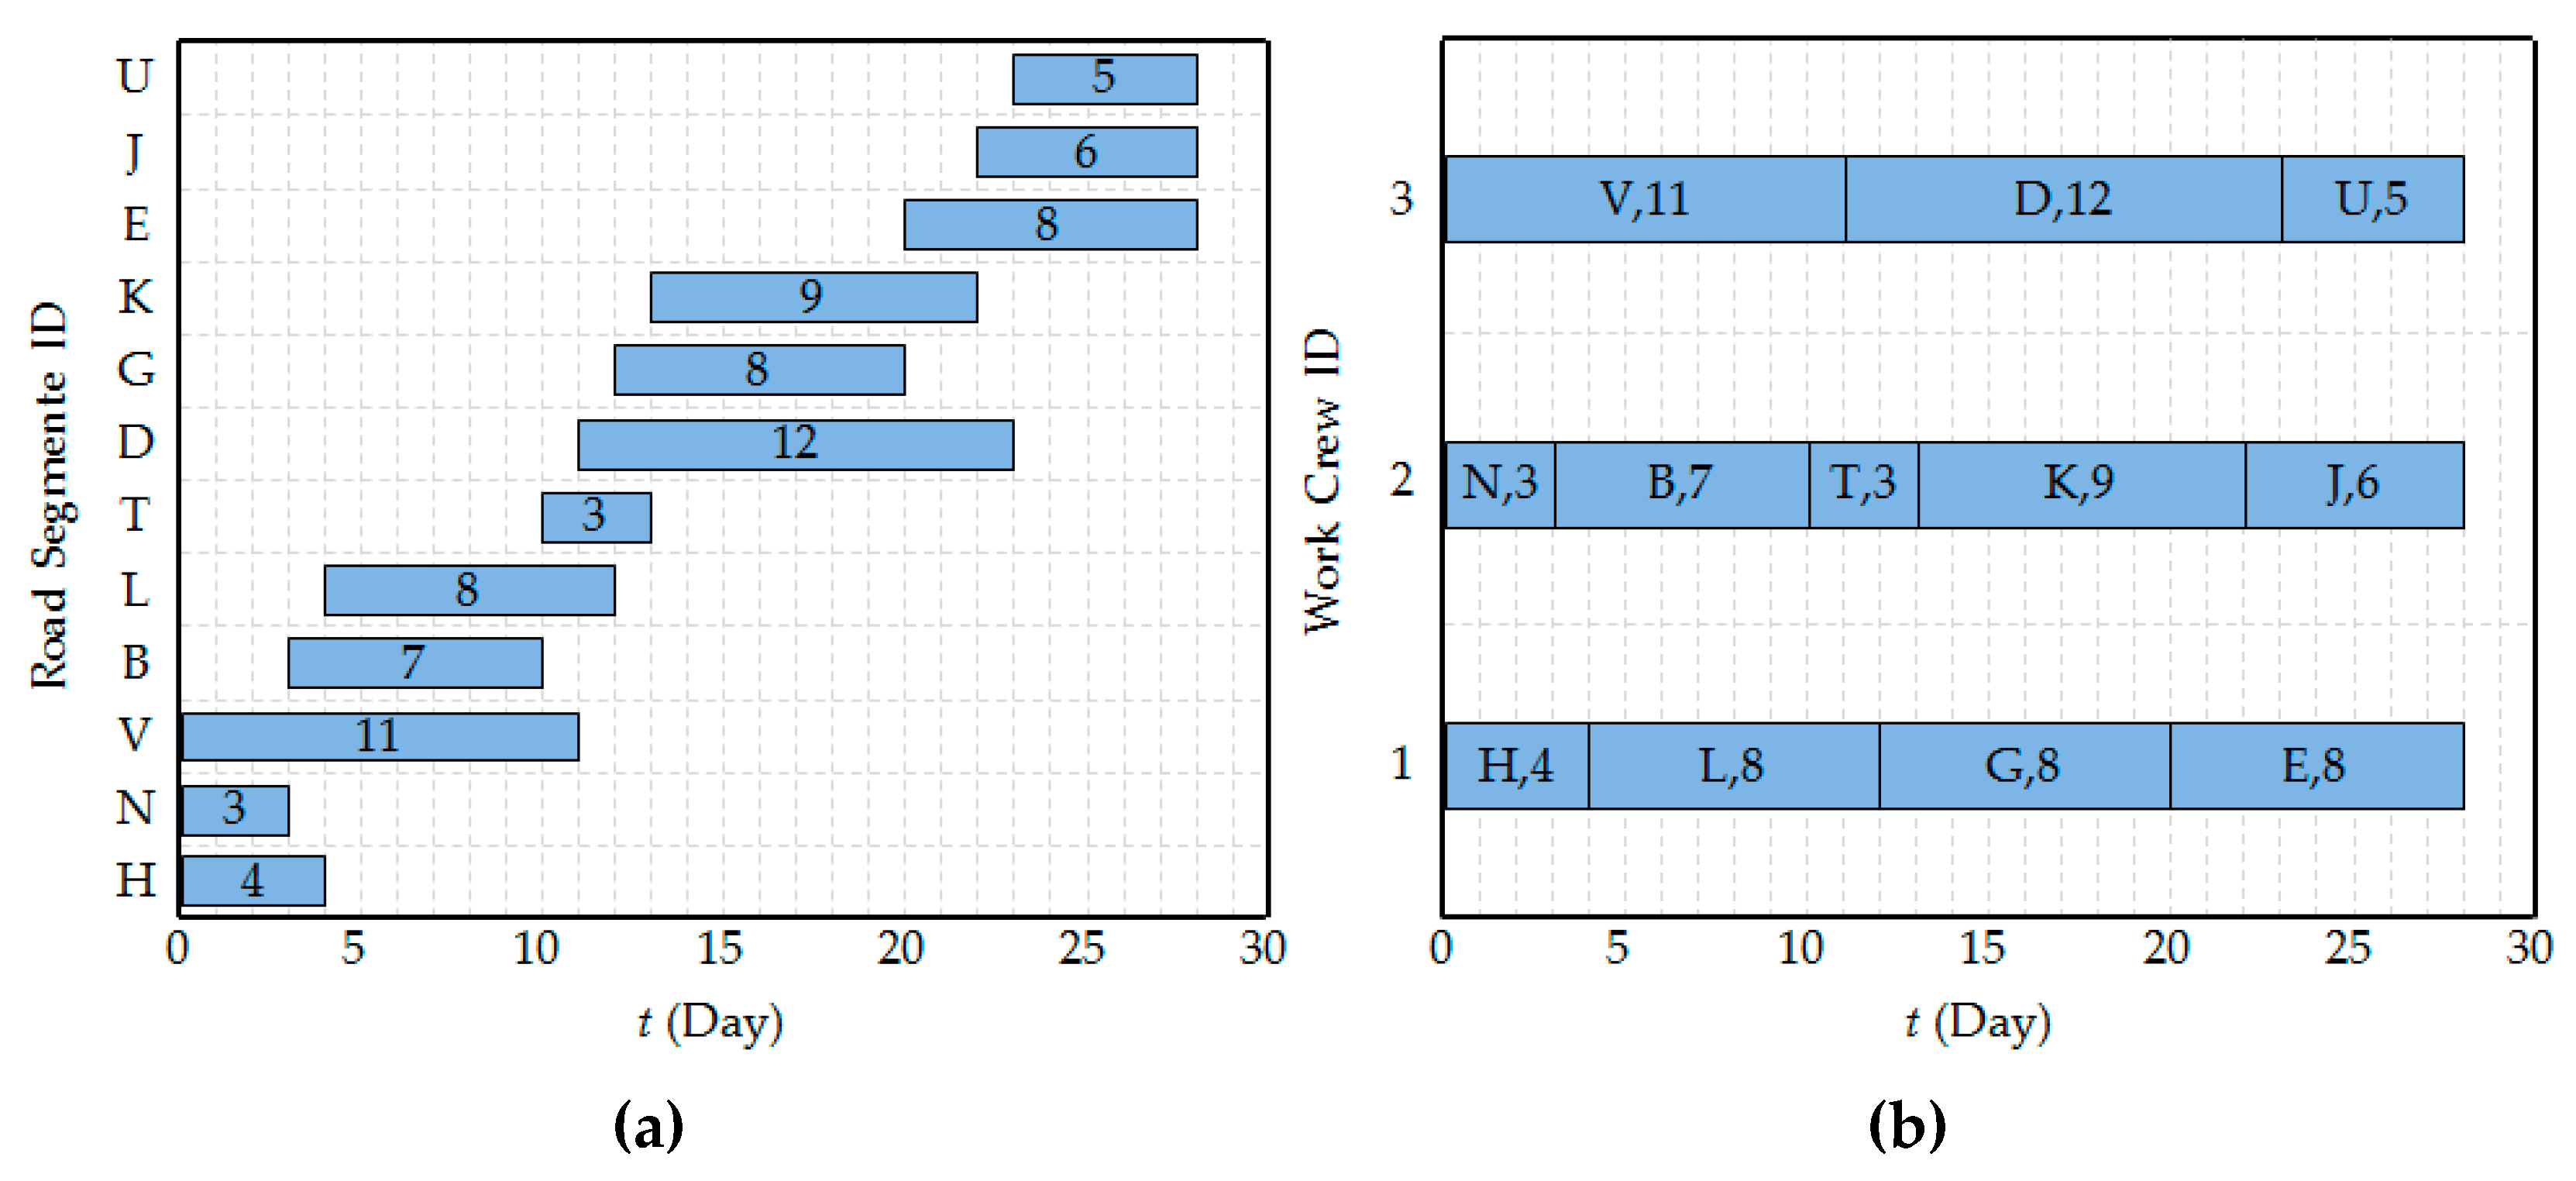
Figure 3 represents the result of the optimal restoration schedule generated by the proposed model. The budget of 2000 fund-units can cover 12 road segments to be restored, which exhausts 1880 fund-units. The time sequence of all restoration activities is shown in Figure 3a, where the number on each bar means the duration of each restoration activity. Figure 3b indicates the assignment of road segments to three work crews, where the letter and number on each bar are the road segment ID and the duration of its restoration activity, respectively. Specifically, work crew 1 will work on the restoration of road segments H, L, G, and E, work crew 2 will undertake the restoration of road segments N, B, T, K, and J, and road segments V, D, and U are recovered by work crew 3. Additionally, the makespan of the optimal restoration strategy is 28 days.
Figure 3.
Optimal restoration schedule. (a) Time sequence of restoration activities; (b) job sequence of work crews.
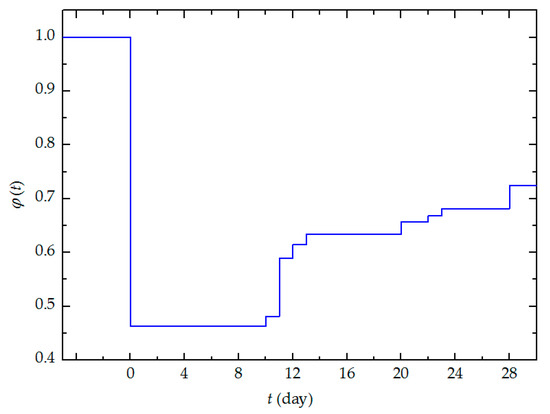
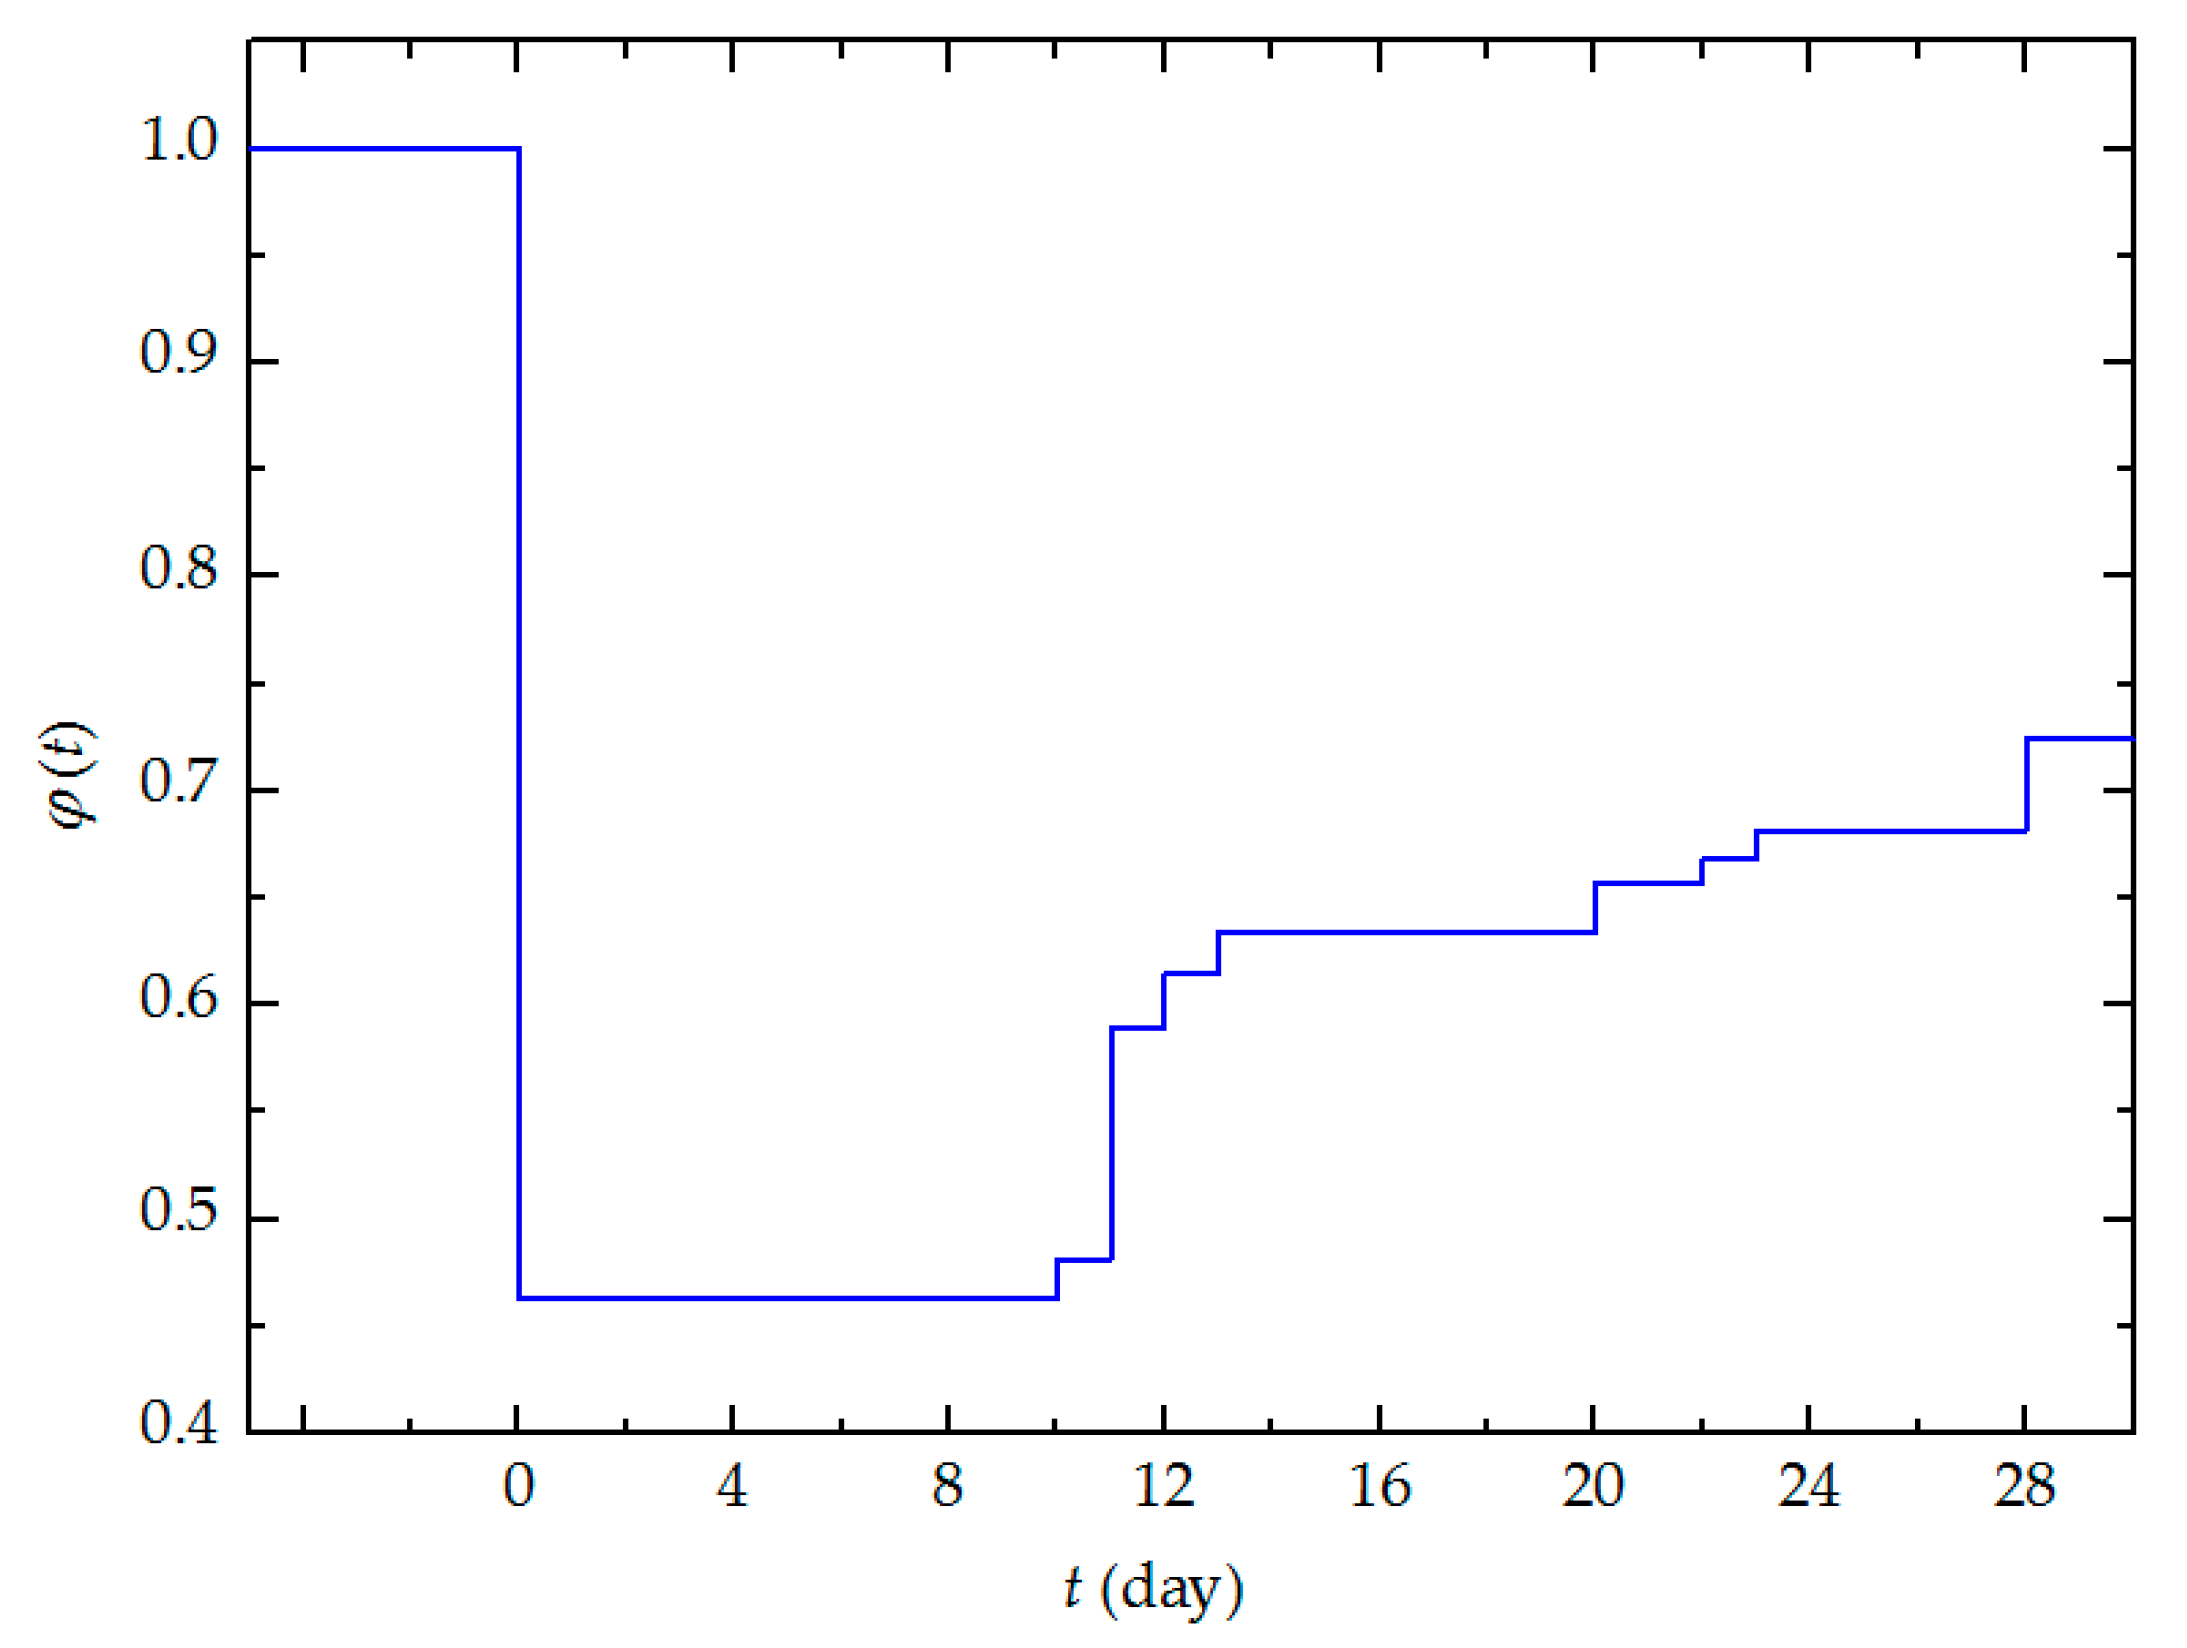
Figure 4 presents the performance recovery trajectory of the supply chain network. The network performance drops to 0.463 from its original value with the occurrence of a disaster at time t = 1. Apparently, does not rise immediately after the restoration activities start but begins to rise at time t = 10 when the restorations of road segments H, N, and B are finished, which reveals that only when all road segments or links on a path have been recovered, can the network performance be improved. has a significant increase, i.e., from 0.481 to 0.589 at time t = 11 when road segment V is operational. After all the 12 road segments are recovered, the network performance can ultimately reach 0.724.
Figure 4.
Performance recovery trajectory of the supply chain network.
In the previous studies, a restoration strategy based on the cost-effective approach was applied, which aims to cover as many facilities to be maintained in the network as possible until the funds are exhausted [19]. We compare the resilience-based strategy (RBS) generated by our model and the cost-effective strategy (CES) in this subsection. Table 5 indicates that the critical road segments to be maintained of the two strategies are quite different. Compared with the RBS, CES is involved with more road segments to be maintained having a longer makespan and exhausting more funds. However, the CES has a lower , i.e., more cumulative loss of network performance, which reveals the CES cannot satisfy the OD demand well during the restoration process.
Table 5.
Restoration results (RR) of the RBS and CES.
4.3. Sensitivity Analysis
In this subsection, we discuss the effects of four parameters, i.e., decision-maker’s preference, tolerance factor of delivery time, number of work crews, and availability of budget on the results of the optimal restoration schedule by sensitivity analysis. The sensitivity analysis is conducted by assuming all the other parameters are fixed.
4.3.1. Decision-Maker’s Preference
Table 6 lists three restoration schedules for different . Apparently, has a significant effect on the restoration scheduling scheme for the disrupted supply chain network. The three restoration schedules are different from each other both in the restoration time sequence and job sequence. The higher is, the higher and the lower the restoration schedule derives, which means less cumulative performance loss during the makespan but slower restoration rapidity of the supply chain performance. Additionally, the higher generates a restoration result with more road segments to be repaired and more budget exhaustion. Hence, decision-makers have to determine an appropriate tradeoff between the two objectives.
Table 6.
Restoration results for different .
4.3.2. Tolerance Factor of Delivery Time
Tolerance factor of delivery time is the threshold for OD demand satisfaction, which affects the evaluation of supply chain network performance. From the restoration results for different presented in Table 7, the variation of makes the restoration schedule changes greatly. With an increase of , and increase with different rates but C, M, and N all decrease. As such, if the availability of the budget is insufficient to recover the network performance as much as possible, decision-makers should adjust to make a balance between the monetary resource and the OD demands.
Table 7.
Restoration results for different .
4.3.3. Number of Work Crews
Table 8 shows the different restoration schedules when varies from 3 to 7 with an interval of 2. has no impact on the road segments to be restored but affects the time sequence of each restoration activity. Obviously, more work crews can shorten the makespan and increase and . However, the increase of reduces the growth rate of and , which reveals that the marginal benefit of manpower resources decreases. Thus, decision-makers should carefully determine an appropriate to avoid wasting manpower resources. Additional experiments indicate that = 5 can generate an optimal restoration schedule in this case study, which can make the best use of the manpower resources.
Table 8.
Restoration results for different .
4.3.4. Availability of Budget
Table 9 presents different restoration results under three scenarios of budget limit. The restoration schedules of B = 2000 and B = 2500 are quite different both in the road segments to be restored and time sequence of restoration activities. Compared with B = 2000, the restoration schedule with B = 2500 is involved with three more road segments, which extends the makespan by eight days. As such, with an increase of monetary resources, increases rapidly while decreases. The restoration schedules of B = 2500 and B = 3000 are the same. Additional experiments show that the restoration schedule does not change when B exceeds 2500 in this case study, which reveals that increasing the budget alone and keeping the number of work crews constant cannot improve the restoration schedule. As a result, decision-makers should guarantee that the monetary resources and the manpower resources are matched.
Table 9.
Restoration results for different B.
5. Conclusions
Supply chain networks play a significant role in commodity circulation, promoting economic prosperity and social development. Due to frequent natural disasters and manmade hazards, supply chain networks are more inclined to suffer from unexpected interruptions. As such, decision-makers have to deal with the post-disruption restoration for supply chain networks to satisfy the transportation demands of various goods. In this situation, an efficient restoration strategy is highly desired. Most of the existing literature defines this problem from the perspective of cost-effectiveness instead of a resilient manner.
This paper focuses on optimizing the post-disruption supply chain network restoration strategy from a perspective of resilience. We employ two resilience metrics to measure the effectiveness of the restoration process, i.e., cumulative performance loss and restoration rapidity. Then, we formulate the optimization problem as a bi-objective nonlinear programming model aiming to maximize the network resilience under the budget and manpower constraints. Then, a modified SA algorithm is utilized to solve the model. Finally, the proposed method is demonstrated using a testing supply chain network to generate the optimal post-disaster restoration strategy. The main results are summarized as follows:
- (1)
- The proposed method framework can generate an efficient restoration strategy from a perspective of resilience considering the tradeoff between the cumulative performance loss and the restoration rapidity, which can provide an effective reference for decision-makers to schedule the restoration activities for a disrupted supply chain network.
- (2)
- Decision-maker’s preference has a great impact on the road segments to be repaired and the time sequence of restoration activities. With an increase of the tolerance factor of delivery time, the resilience of the supply chain network increase with different rates but the total restoration costs, makespan, and the number of road segments to be restored all decrease.
- (3)
- More work crews can shorten the makespan and increase the resilience but may decrease the marginal benefit of manpower resources when the number of work crews exceeds a certain level. Likewise, more availability of budget can improve the supply chain network performance but increasing budget alone and keeping the number of work crews constant cannot improve the restoration schedule when the monetary resources exceed a certain level.
Compared with the work in [19,42,43], the proposed method framework is developed in a resilient manner, which highlights the ability for the supply chain networks to resist the disruptive events within a reasonable timeframe [44]. As demonstrated in the case study, the optimal restoration strategy generated by the proposed method framework can provide a reference to schedule the restoration activities efficiently when supply chain networks are disrupted by disasters. Specifically, decision makers should (i) carefully make a reasonable tradeoff between the recovery speed and network performance loss, (ii) determine a feasible tolerance factor of delivery time to obtain a balance between the budget and the OD demands, (iii) match the manpower resource and monetary resource well avoiding unilateral increase of either of the two resources, which is in line with the previous study in [12].
However, several limitations still exist in our work, and future work will focus on two aspects: (1) Consider the case in which the demands vary during the recovery process and the duration of each restoration activity is uncertain, and (2) consider more disruption scenarios in which disasters incur different types of damages to the road segments.
Author Contributions
X.M. designed research methods and wrote the manuscript; X.L. collected and analyzed the data; C.Y. edited and revised the manuscript; J.Z. drew the figures. All authors have read and agreed to the published version of the manuscript.
Funding
This research was funded by the Fundamental Research Funds for the Central Universities (Grant number 300102238501), National Natural Science Foundation of China (Grant number 71701022), Natural Science Basic Research Plan in Shaanxi Province of China (Grant number 2018JQ7002), National Key R & D project (Grant number 2017YFC0803906), and Transportation Research Project of Ministry of Transportation in Shaanxi Province (Grant number 18-26R).
Conflicts of Interest
The authors declare no conflict of interest.
References
- Crainic, T.G. Service network design in freight transportation. Eur. J. Oper. Res. 2000, 122, 272–288. [Google Scholar] [CrossRef] [Scilit]
- Miller-Hooks, E.; Zhang, X.; Faturechi, R. Measuring and maximizing resilience of freight transportation networks. Comput. Oper. Res. 2012, 39, 1633–1643. [Google Scholar] [CrossRef] [Scilit]
- SteadieSeifi, M.; Dellaert, N.P.; Nuijten, W.; Van Woensel, T.; Raoufi, R. Multimodal freight transportation planning: A literature review. Eur. J. Oper. Res. 2014, 233, 1–15. [Google Scholar] [CrossRef] [Scilit]
- Darayi, M.; Barker, K.; Santos, J.R. Component importance measures for multi-industry vulnerability of a freight transportation network. Netw. Spat. Econ. 2017, 17, 1111–1136. [Google Scholar] [CrossRef] [Scilit]
- Zhu, E.; Crainic, T.G.; Gendreau, M. Scheduled service network design for freight rail transportation. Oper. Res. 2014, 62, 383–400. [Google Scholar] [CrossRef] [Scilit]
- Wang, S.; Sarker, B.R.; Mann, L., Jr.; Triantaphyllou, E. Resource planning and a depot location model for electric power restoration. Eur. J. Oper. Res. 2004, 155, 22–43. [Google Scholar] [CrossRef] [Scilit]
- Matisziw, T.C.; Murray, A.T.; Grubesic, T.H. Strategic network restoration. Netw. Spat. Econ. 2010, 10, 345–361. [Google Scholar] [CrossRef] [Scilit]
- Zhang, C.; Kong, J.-J.; Simonovic, S.P. Restoration resource allocation model for enhancing resilience of interdependent infrastructure systems. Saf. Sci. 2018, 102, 169–177. [Google Scholar] [CrossRef] [Scilit]
- Karakoc, D.B.; Almoghathawi, Y.; Barker, K.; González, A.D.; Mohebbi, S. Community resilience-driven restoration model for interdependent infrastructure networks. Int. J. Disaster Risk Reduct. 2019, 38, 101228. [Google Scholar] [CrossRef] [Scilit]
- Lambrechts, O.; Demeulemeester, E.; Herroelen, W. Proactive and reactive strategies for resource-constrained project scheduling with uncertain resource availabilities. J. Sched. 2008, 11, 121–136. [Google Scholar] [CrossRef] [Scilit]
- Nurre, S.G.; Cavdaroglu, B.; Mitchell, J.E.; Sharkey, T.C.; Wallace, W.A. Restoring infrastructure systems: An integrated network design and scheduling (INDS) problem. Eur. J. Oper. Res. 2012, 223, 794–806. [Google Scholar] [CrossRef] [Scilit]
- Li, Z.; Jin, C.; Hu, P.; Wang, C. Resilience-based transportation network recovery strategy during emergency recovery phase under uncertainty. Reliab. Eng. Syst. Saf. 2019, 188, 503–514. [Google Scholar] [CrossRef] [Scilit]
- Cho, S.; Gordon, P.; Richardson, H.W.; Moore, J.E.; Shinozuka, M. Analyzing transportation reconstruction network strategies: A full cost approach. Rev. Urban Reg. Dev. Stud. 2000, 12, 212–227. [Google Scholar] [CrossRef] [Scilit]
- Çelik, M. Network restoration and recovery in humanitarian operations: Framework, literature review, and research directions. Surv. Oper. Res. Manag. Sci. 2016, 21, 47–61. [Google Scholar] [CrossRef] [Scilit]
- Ciric, R.M.; Popovic, D.S. Multi-objective distribution network restoration using heuristic approach and mix integer programming method. Int. J. Electr. Power Energy Syst. 2000, 22, 497–505. [Google Scholar] [CrossRef] [Scilit]
- Xu, M.; Ouyang, M.; Mao, Z.; Xu, X. Improving repair sequence scheduling methods for postdisaster critical infrastructure systems. Comput. Aided Civ. Infrastruct. Eng. 2019, 34, 506–522. [Google Scholar] [CrossRef] [Scilit]
- Liu, C.; Fan, Y.; Ordóñez, F. A two-stage stochastic programming model for transportation network protection. Comput. Oper. Res. 2009, 36, 1582–1590. [Google Scholar] [CrossRef] [Scilit]
- Chen, L.; Miller-Hooks, E. Resilience: An indicator of recovery capability in intermodal freight transport. Transp. Sci. 2012, 46, 109–123. [Google Scholar] [CrossRef] [Scilit]
- Karlaftis, M.G.; Kepaptsoglou, K.L.; Lambropoulos, S. Fund allocation for transportation network recovery following natural disasters. J. Urban Plan. Dev. 2007, 133, 82–89. [Google Scholar] [CrossRef] [Scilit]
- Hackl, J.; Adey, B.T.; Lethanh, N. Determination of near-optimal restoration programs for transportation networks following natural hazard events using simulated annealing. Comput. Aided Civ. Infrastruct. Eng. 2018, 33, 618–637. [Google Scholar] [CrossRef] [Scilit]
- Nagata, T.; Sasaki, H. A multi-agent approach to power system restoration. IEEE Trans. Power Syst. 2002, 17, 457–462. [Google Scholar] [CrossRef] [Scilit]
- Tabucchi, T.; Davidson, R.; Brink, S. Simulation of post-earthquake water supply system restoration. Civ. Eng. Environ. Syst. 2010, 27, 263–279. [Google Scholar] [CrossRef] [Scilit]
- Fang, Y.; Sansavini, G. Emergence of antifragility by optimum postdisruption restoration planning of infrastructure networks. J. Infrastruct. Syst. 2017, 23, 04017024. [Google Scholar] [CrossRef] [Scilit]
- González, A.D.; Dueñas-Osorio, L.; Sánchez-Silva, M.; Medaglia, A.L. The interdependent network design problem for optimal infrastructure system restoration. Comput. Aided Civ. Infrastruct. Eng. 2016, 31, 334–350. [Google Scholar] [CrossRef] [Scilit]
- Fang, Y.-P.; Sansavini, G. Optimum post-disruption restoration under uncertainty for enhancing critical infrastructure resilience. Reliab. Eng. Syst. Saf. 2019, 185, 1–11. [Google Scholar] [CrossRef] [Scilit]
- Sanci, E.; Daskin, M.S. Integrating location and network restoration decisions in relief networks under uncertainty. Eur. J. Oper. Res. 2019, 279, 335–350. [Google Scholar] [CrossRef] [Scilit]
- Xu, N.; Guikema, S.D.; Davidson, R.A.; Nozick, L.K.; Çağnan, Z.; Vaziri, K. Optimizing scheduling of post-earthquake electric power restoration tasks. Earthq. Eng. Struct. Dyn. 2007, 36, 265–284. [Google Scholar] [CrossRef] [Scilit]
- Ransikarbum, K.; Mason, S.J. Multiple-objective analysis of integrated relief supply and network restoration in humanitarian logistics operations. Int. J. Prod. Res. 2016, 54, 49–68. [Google Scholar] [CrossRef] [Scilit]
- Schmitt, A.J.; Singh, M. A quantitative analysis of disruption risk in a multi-echelon supply chain. Int. J. Prod. Econ. 2012, 139, 22–32. [Google Scholar] [CrossRef] [Scilit]
- Carvalho, H.; Barroso, A.P.; Machado, V.H.; Azevedo, S.; Cruz-Machado, V. Supply chain redesign for resilience using simulation. Comput. Ind. Eng. 2012, 62, 329–341. [Google Scholar] [CrossRef] [Scilit]
- Xu, M.; Wang, X.; Zhao, L. Predicted supply chain resilience based on structural evolution against random supply disruptions. Int. J. Syst. Sci. Oper. Logist. 2014, 1, 105–117. [Google Scholar] [CrossRef] [Scilit]
- Hishamuddin, H.; Sarker, R.A.; Essam, D. A recovery model for a two-echelon serial supply chain with consideration of transportation disruption. Comput. Ind. Eng. 2013, 64, 552–561. [Google Scholar] [CrossRef] [Scilit]
- Deng, Y.; Chen, Y.; Zhang, Y.; Mahadevan, S. Fuzzy Dijkstra algorithm for shortest path problem under uncertain environment. Appl. Soft Comput. 2012, 12, 1231–1237. [Google Scholar] [CrossRef] [Scilit]
- Shin, K.; Shin, Y.; Kwon, J.-H.; Kang, S.-H. Development of risk based dynamic backorder replenishment planning framework using Bayesian Belief Network. Comput. Ind. Eng. 2012, 62, 716–725. [Google Scholar] [CrossRef] [Scilit]
- Almoghathawi, Y.; Barker, K.; Albert, L.A. Resilience-driven restoration model for interdependent infrastructure networks. Reliab. Eng. Syst. Saf. 2019, 185, 12–23. [Google Scholar] [CrossRef] [Scilit]
- Henry, D.; Ramirez-Marquez, J.E. Generic metrics and quantitative approaches for system resilience as a function of time. Reliab. Eng. Syst. Saf. 2012, 99, 114–122. [Google Scholar] [CrossRef] [Scilit]
- De, P.; Dunne, E.J.; Ghosh, J.B.; Wells, C.E. Complexity of the discrete time-cost tradeoff problem for project networks. Oper. Res. 1997, 45, 302–306. [Google Scholar] [CrossRef] [Scilit]
- Černý, V. Thermodynamical approach to the traveling salesman problem: An efficient simulation algorithm. J. Optim. Theory Appl. 1985, 45, 41–51. [Google Scholar] [CrossRef] [Scilit]
- Vincent, F.Y.; Redi, A.P.; Hidayat, Y.A.; Wibowo, O.J. A simulated annealing heuristic for the hybrid vehicle routing problem. Appl. Soft Comput. 2017, 53, 119–132. [Google Scholar]
- Ezugwu, A.E.-S.; Adewumi, A.O.; Frîncu, M.E. Simulated annealing based symbiotic organisms search optimization algorithm for traveling salesman problem. Expert Syst. Appl. 2017, 77, 189–210. [Google Scholar] [CrossRef] [Scilit]
- Ingber, L. Simulated annealing: Practice versus theory. Math. Comput. Model. 1993, 18, 29–57. [Google Scholar] [CrossRef] [Scilit]
- Vahdani, B.; Zandieh, M.; Roshanaei, V. A hybrid multi-stage predictive model for supply chain network collapse recovery analysis: A practical framework for effective supply chain network continuity management. Int. J. Prod. Res. 2011, 49, 2035–2060. [Google Scholar] [CrossRef] [Scilit]
- Das, K.; Chowdhury, A.H. Designing a reverse logistics network for optimal collection, recovery and quality-based product-mix planning. Int. J. Prod. Econ. 2012, 135, 209–221. [Google Scholar] [CrossRef] [Scilit]
- Ouyang, M.; Wang, Z. Resilience assessment of interdependent infrastructure systems: With a focus on joint restoration modeling and analysis. Reliab. Eng. Syst. Saf. 2015, 141, 74–82. [Google Scholar] [CrossRef] [Scilit]

© 2020 by the authors. Licensee MDPI, Basel, Switzerland. This article is an open access article distributed under the terms and conditions of the Creative Commons Attribution (CC BY) license (http://creativecommons.org/licenses/by/4.0/).