Article

Promoters versus Adversaries of Change: Agent-Based Modeling of Organizational Conflict in Co-Evolving Networks

by
Evangelos Ioannidis
1,*,
Nikos Varsakelis
2 and
Ioannis Antoniou
1
1
Complex Systems Analysis Laboratory (COSAL), Faculty of Sciences, School of Mathematics, Aristotle University of Thessaloniki, 541 24 Thessaloniki, Greece
2
Complex Systems Analysis Laboratory (COSAL), Faculty of Economic and Political Sciences, School of Economics, Aristotle University of Thessaloniki, 541 24 Thessaloniki, Greece
*
Author to whom correspondence should be addressed.
Mathematics 2020, 8(12), 2235; https://doi.org/10.3390/math8122235
Submission received: 23 November 2020 / Revised: 10 December 2020 / Accepted: 15 December 2020 / Published: 17 December 2020
(This article belongs to the Section Network Science)

Abstract

:
The social adoption of change is usually hard because in reality, forces opposing the social adoption of change manifest. This situation of organizational conflict corresponds to the case where two competing groups of influential agents (“promoters” versus “adversaries” of change) operate concurrently within the same organizational network. We model and explore the co-evolution of interpersonal ties and attitudes in the presence of conflict, taking into account explicitly the microscopic “agent-to-agent” interactions. In this perspective, we propose a new ties-attitudes co-evolution model where the diffusion of attitudes depends on the weights and the evolution of weights is formulated as a “learning mechanism” (weight updates depend on the previous values of both weights and attitudes). As a result, the co-evolution is intrinsic/endogenous. We simulate representative scenarios of conflict in 4 real organizational networks. In order to formulate structural balance in directed networks, we extended Heider’s definition of balance considering directed triangles. The evolution of balance involves two stages: first, negative links pop up disorderly and destroy balance, but after some time, as new negative links are formed, a “new” balance is re-established. This “new” balance is emerging concurrently with the polarization of attitudes or domination of one attitude. Moreover, same-minded agents are positively linked and different-minded agents are negatively-linked. This macroscopic self-organization of the system is due only to agent-to-agent interactions, involving feedbacks on weight updates at the local microscopic level.

1. Introduction

Individuals in teams, organizations, and societies have their own opinions, emotions, behaviors, and attitudes. The analysis of the dependence of the emerging dynamics of attitudes (opinions, emotions, behaviors) on the local interactions among individuals is a key question of social dynamics. Statistical physics and agent-based modeling on social dynamics has led to both discrete and continuous models of opinion dynamics [1,2,3,4,5]. In discrete models, the opinion of each individual is a discrete variable. The states represent the possible opinions, at least two: yes/no, support/opposition, Windows/Linux, Android/iOS, buying/selling [6,7,8], or three: increase/decrease/invariant, support/opposition/neutral [9]. The Voter model [6,7] and the Majority model [8] are the main classes of discrete opinion models. Continuous models are relevant when opinions range over continuous values. For instance, the degree of satisfaction, desire, or preference regarding a politician or a product. The Deffuant–Weisbuch (DW) model [10,11] and the Hegselmann–Krause (HK) model [12] are the main classes of continuous opinion models. Both continuous opinion models (DW and HK) assume moreover that influence is possible only if opinions are close enough. This is the so-called “tolerance” value ε [2], also known as “confidence bound” [2] or “relative agreement” [13,14,15]. This modeling assumption incorporates the fact of life, that interpersonal influence may only be realized, if the opinions of the communicating individuals are close enough. The number of individuals communicating with some agent is the main distinction between the continuous opinion models. In the HK model, each individual simultaneously communicates with all “compatible” neighbors, while in the DW model each individual communicates with only one randomly selected neighbor at a time. Continuous opinion models have been analyzed in terms of certain network features, as for example the degree of agents [16,17], the directedness of the interpersonal influence [18,19], the presence of negative interpersonal influence [15,20,21,22,23,24], the presence of mass media [20,22,24,25], the extent of confidence bound [10,11,25,26,27,28], the presence or absence of extremists [13,14,23,26], the initial distribution of opinions [15,28].
Models of opinion influence are also applicable for modeling attitude change [29,30]. Companies and organizations are aware of the need to change effectively in short time intervals [31] in order to remain competitive in the present socio-economic environment of rapid change [32]. Jacob Moreno introduced networks in social psychology and studied human groups in terms of sociograms [33]. Nowadays, network theory has already been applied successfully to real organizations [34,35,36] and in the management of organizational change [37,38,39,40]. Innovation adoption in social contexts is neither straightforward, nor certain [31,41,42]. Consequently, the challenge of change management is to realize attitude change towards the direction of the desired innovation [43,44,45,46,47,48]. Organizational change should take into account the attitude of individuals (positive or negative) towards innovation adoption. The goal of change agents is to initiate “cascades of change,” steering the individuals towards the desired attitude [49]. This is in close analogy with the engagement of the so-called informed agents, who pull opinions towards the desired opinion [50,51,52,53]. Attitude change in organizational networks, involves 2 key questions namely:
(Q1) 
How is the dynamics of attitude change influenced by the position of change agents?
(Q2) 
How is the dynamics of attitude change influenced by the way individuals select other individuals for communication?
Concerning the influence of the position of change agents (Q1), we recently found that hubs (agents with high degree) are the best candidates for change agents [30]. However, senior employees are not always performing as the best change agents [30]. Concerning the influence of the communication policy among the individuals (Q2), we found that communicating with “local hubs,” avoiding random contacts, results in much faster adoption of change [30].
The analysis of opinion spread was initially studied on “frozen” (static) networks [10,11,12,13,14,15,16,17,18,20,26]. In reality, however, two serious additional facts should be taken into account. First, “forces” opposing the social adoption of innovation and change manifest, resulting in competing concurrent spreading processes [54,55,56]. Second, the network itself is evolving because the social ties change, due to the interplay between attitudes’ dynamics (change of agents’ attributes) and ties’ dynamics (change of network structure), resulting in network co-evolution [57,58,59,60,61,62,63,64,65,66]. Although both issues have been studied separately, both issues have not been taken into account together, neither in some agent-based model nor in some real organizational network. This fact motivates us to extend the existing agent-based models in order to include both above issues, namely: (a) the competition of two groups of influential spreaders, operating concurrently in the network (two concurrent competing spreading processes on the network), and (b) the simultaneous interdependent evolution of interpersonal ties with attitudes (the two spreading processes are not taking place on a static network). We shall explore and formulate network co-evolution as “learning” at the microscopic level of “agent-to-agent” interaction, in the presence of conflict.
Opposition is a “fact of life” as clearly pointed out by Niccolò Machiavelli in The Prince (chapter 6) [67]: “… there is nothing more difficult to carry out, nor more doubtful of success, nor more dangerous to handle, than to innovate. For the innovator has enemies in all those who profit by the existing order, and only lukewarm defenders in all those who would profit by the new order, this lukewarmness arising partly from fear of their adversaries, who have the laws in their favor; and partly from the incredulity of mankind, who do not truly believe in anything new until they have had the actual experience of it”. This situation corresponds to the case where two competing groups of influential agents (the “promoters” versus the “adversaries” of change) operate concurrently within the same organizational network. The co-existence of “promoters” and “adversaries” in the same organizational network, may result in the emergence of both attitude polarization and structural imbalance, due to the conflicting “pulls” of the opposing influential agents. In this perspective, we shall investigate the co-evolutionary dynamics in 4 real organizational networks, depending on the following 3 conditioning factors:
(Q3) 
How is the dynamics of attitude change and structural balance influenced by the number of the opposing influential agents within the network?
(Q4) 
How is the dynamics of attitude change and structural balance influenced by the position of the opposing influential agents within the network?
(Q5) 
How is the dynamics of attitude change and structural balance influenced by the “learning” rate of the interpersonal social ties?
We address the above questions in the context of a proposed network-based mathematical model. The relevant definitions and assumptions of the model, as well as the necessary background concerning structural balance in directed signed networks, are presented in Section 2. In Section 3, we specify the scenarios of organizational conflict, as well as the 4 real organizational networks to be analyzed. The results on the dynamics of attitude change, signed links, and structural balance are presented in Section 4. The impact of conditioning factors (Q3), (Q4), (Q5) is discussed in Section 5. Our conclusions are summarized in Section 6.

2. The Model

Attitude change dynamics is formulated in dynamic networks of agents influencing each other, assuming that each agent selects another agent to communicate, at each time t = 0 ,   1 ,   . We provide below the relevant definitions and modeling assumptions.
Definition 1.
(Attitude).
The individual’s degree of like or dislike is known as attitude, referring to persons, events, places, things, issues. Attitudes are judgments involving affection [68]. Carl Jung defined attitude as “the readiness of the psyche to act or react in a certain way” [69]. The attitude of agent κ at time t is denoted by   ψ κ ( t ) , taking real values within the interval   [ 1 ,   1 ] , assessing the degree of “positivity” or “negativity” [13,14,15,21,70].
Definition 2.
(Attitude Networks).
Attitude networks are graphs with agents (nodes) κ = 1 ,   2 ,   ,   N linked via communication channels with the additional activation field ψ :   X × T [ 1 ,   1 ] : ( κ ,   t )   ψ κ ( t ) , where X = { 1 ,   2 ,   ,   N } is the set of agents (nodes) and   T = { 0 ,   1 , } is the discrete time model. The value ψ κ ( t ) indicates the attitude of agent κ at time t . We denote by w λ κ ( t ) = w λ κ ( t ) the directed weight of influence [10,11,13,14,16,17,18,26] of agent λ on agent κ , for attitude change, taking values in the interval [ 1 ,   1 ] (Table 1). The sign of weights (positive or negative) is interpreted as “attractive” or “repulsive” interpersonal social ties [15,20,21].
Assumption 1.
(One Agent is Selected at a Time).
The change of attitude of each agent κ during the time interval ( t ,   t + 1 ] is the difference: ψ κ ( t + 1 ) ψ κ ( t ) . The durations ( t ,   t + 1 ] are specified so that the attitude of each agent may change by one “link event” only among the “in-neighbors”. The set of in-neighbors X κ i n ( t ) of agent κ , consists of first neighbors λ of agent κ , who are able to exert influence directly on agent κ at time t . This influence is realized via the incoming links w λ κ ( t ) to agent κ . Therefore: X κ i n ( t ) = { λ N : w λ κ ( t ) 0 } . This selection of durations avoids the reduction of efficiency and reliability, associated with multi-tasking (parallel communication with multiple agents), due to cognitive limitations or time constraints of individuals [71,72,73]. On the other hand, an agent may influence more than one “followers” at the same time. At each time t , attention is focused on one source of communication only. This is also the basic assumption in the Deffuant-Weisbuch models [10,11,13,14,15,16,17,18,20,26]. In this first exploratory work, we do not consider the coarser description involving large durations, where there can be many “simultaneous” influencers, as in the Hegselmann–Krause models [12,74,75].
Definition 3.
(Internal Communications—Selection Rule for Communication).
The selection of the in-neighbor λ by agent κ for communication is the value of the Selection (Decision) Function D κ ( t ) , specified by the corresponding Selection Probability p λ κ ( t ) [30]: D κ ( t ) = λ means that agent λ was selected by agent κ at time t with probability p λ κ ( t ) .
Assumption 2.
(Random Selection Rule).
In this work, we assume that the selection rule depends on the presence of links. This assumption for random selection has been used in several communication network agent-based models [10,11,13,14,15,16,17,18,20,26]. For each agent κ , the random selection function at time t is:
D κ ( t ) = λ   ,   w i t h   p r o b a b i l i t y   p λ κ ( t ) = w λ κ ( t ) 0 ν = 1 Ν w ν κ ( t ) 0
The term Q is the Iverson bracket [76] which converts Boolean values to numbers 0 ,   1 :
Q   = { 1 ,   i f   Q   i s   T r u e 0 ,   i f   Q   i s   F a l s e
For a given selection rule D κ ( t ) , we adopt the following local learning rule for weights evolution, described below for selected (Assumption 3.1) and non-selected (Assumption 3.2) agents.
Assumption 3.1.
(Weight update for selected agents).
If the in-neighbor agent λ is selected by agent ( D κ ( t ) = λ ) , the corresponding weight w λ κ ( t ) may change due to Learning, depending on the Relevance Feedback. We consider both positive (amplifying) and negative (damping) feedbacks. The Relevance Feedback of agent κ from agent λ is assessed by the function: F λ κ ( t ) = 1 | ψ λ ( t ) ψ κ ( t ) | , taking values 1 F λ κ ( t ) 1 , depending on the difference of attitudes | ψ λ ( t ) ψ κ ( t ) | , with 0 | ψ λ ( t ) ψ κ ( t ) | 2 . This assessment of relevance or affinity of attitudes incorporates the Homophily Principle [77,78,79,80], i.e., “love of the same”. In this perspective, if the difference of attitudes | ψ λ ( t ) ψ κ ( t ) | is low, the Relevance Feedback F λ κ ( t ) from the corresponding social interaction is high (homophily). On the contrary, if the difference of attitudes | ψ λ ( t ) ψ κ ( t ) | is high, the relevance feedback F λ κ ( t ) from the corresponding social interaction is low (heterophobia). If | ψ λ ( t ) ψ κ ( t ) | = 0 (same attitudes), we have F λ κ ( t ) = 1 which is equal to the positive extreme of the relevance feedback. On the contrary, if | ψ λ ( t ) ψ κ ( t ) | = 2 (opposing extreme attitudes), we have F λ κ ( t ) = 1 which is equal to the minimum (negative) extreme of the relevance feedback. The Learning of agent κ from agent λ is assessed by the function L λ κ ( t ) = · F λ κ ( t ) 0 + ( 1 ) · F λ κ ( t ) < 0 , where ( 0 ,   0.5 ) is a constant, implying the “Learning” rate of the interpersonal ties. Concerning the influence of the learning rate on network dynamics (Q5), we consider three different cases with values: 10%, 20%, 40%. The learning function L λ κ ( t ) takes values 0 L λ κ ( t ) 1 , according to the sign of relevance feedback F λ κ ( t ) . In this way, the weights dynamics is conditioned by a “slow-positive” and “fast-negative” relevance feedback F λ κ ( t ) . The reason underlying this assumption is that trust, and therefore influence, builds up slowly but may be torn down quickly [81]. In this perspective, if the Relevance Feedback is non-negative F λ κ ( t ) 0 , Learning L λ κ ( t ) is low (below 0.5) and equals ( 0 ,   0.5 ) . On the contrary, if the Relevance Feedback is negative F λ κ ( t ) < 0 , Learning L λ κ ( t ) is high (above 0.5) and equals 1 [ 0.5 ,   1 ) . Assumption 3.1 defines the following weight update:
w λ κ ( t + 1 ) = ( 1 L λ κ ( t ) ) · w λ κ ( t ) + L λ κ ( t ) · F λ κ ( t )
Assumption 3.2.
(Weight update for non-selected agents).
If the in-neighbor a gent λ is not selected by agent ( D κ ( t ) λ ) , the corresponding weight w λ κ ( t ) is subjected to decay with time t . In this first exploratory work, we shall assume the simplest case of linear decay, with decay constant ζ ( 0 ,   1 ) . The parameter ζ corresponds to the “speed of weakening” of social ties resulting from the passage of time. A lower value of decay constant ζ makes the weight w λ κ ( t ) vanish more quickly. We assume for simplicity the same decay constant ζ = 0.95 for all agents κ = 1 ,   2 , , N . In other words, each influence weight w λ κ ( t ) is weakening by 5 % for each time t not selected. Assumption 3.2 defines the following weight update:
w λ κ ( t + 1 ) = w λ κ ( t ) · ζ
Combining Assumptions 3.1 and 3.2, we have the Weights Evolution Formula:
w λ κ ( t + 1 ) = D κ ( t ) = λ   ·   [ ( 1 L λ κ ( t ) ) · w λ κ ( t ) + L λ κ ( t ) · F λ κ ( t ) ] + D κ ( t ) λ   ·   w λ κ ( t ) · ζ    
Remark 1.
Dynamical emergence of negative social ties due to negative feedbacks.
Although initially ( t = 0 ) all weights may be non-negative w λ κ ( t ) 0 for all λ , κ = 1 ,   2 , , N , the weights evolution Formula ( 1 ) allows the dynamical emergence of negative social ties. This is the case where, at some time t , the relevance feedback is negative F λ κ ( t ) < 0 , which is of course the result of some social interaction between two agents with strongly opposing attitudes | ψ λ ( t ) ψ κ ( t ) | > 1 . The role of negative ties and conflict has already pointed out, as for example in organizational networks [82] and online social networks [83]. The weights evolution Formula ( 1 ) is consistent with the range of weights values [ 1 , 1 ] (Definition 2).
Assumption 4.
(Adaptive Bound for Attitude Change).
Individuals resisting attitude change [31] “filter” relevant social influences from their in-neighbors, applying a “filtering rule,” formulated in terms of the distance | ψ λ ( t )   ψ κ ( t ) | of the attitudes [30]. The selecting agent κ can be influenced by the selected in-neighbor λ , only if the distance of their attitudes is not greater than the “tolerance” value ε λ κ ( t )   :   | ψ λ ( t )   ψ κ ( t ) | ε λ κ ( t ) . This criterion for social influence is known as “bounded confidence” [2]. We assume adaptive bound ε λ κ ( t ) = w λ κ ( t ) + 1 , taking values 0 ε λ κ ( t ) 2 , depending on the evolving weights (Equation ( 1 ) ), which take values 1 w λ κ ( t ) 1 (Table 1). This assumption is justified as follows: (a) if the influence weight w λ κ ( t ) is low, then the tolerance value ε λ κ ( t ) for attitude change should also be low, (b) as the range of values of the difference | ψ λ ( t )   ψ κ ( t ) | is the interval [ 0 , 2 ] , the “tolerance” value ε λ κ ( t ) should also have the same range. For w λ κ ( t ) = 1 (perfect attraction), we have ε λ κ ( t ) = 2 which is equal to the maximum possible distance | ψ λ ( t )   ψ κ ( t ) | . On the contrary, for w λ κ ( t ) = 1 (perfect repulsion), we have ε λ κ ( t ) = 0 which means that there is no “window” for influence.
Definition 4.
(Influence for Attitude Change).
The influence Φ λ κ   ( t ) of agent λ on the selecting agent κ , for attitude change, during the time interval ( t ,   t + 1 ] is:
Φ λ κ   ( t ) = D κ ( t ) = λ   ·   w λ κ ( t ) · | ψ λ ( t )   ψ κ ( t ) | ε λ κ   ( t )   ·   ( ψ λ ( t )   ψ κ ( t ) )      
If D κ ( t ) = λ   =   1 the agent λ was selected by agent κ at time t for communication (Definition 3, Assumption 2). The bracket | ψ λ ( t )   ψ κ ( t ) | ε λ κ ( t ) guarantees that attitude influence may take place only if | ψ λ ( t )   ψ κ ( t ) | ε λ κ ( t ) (Assumption 4). The assumption that attitude influence is proportional to the attitude difference ψ λ ( t )   ψ κ ( t ) , is common in social influence models. For instance: Formulas (1) and (2) in [10], Formulas (1) and (2) in [11], Formulas (5) and (6) in [13], Formulas (5) and (6) in [14], Formula (3) in [26], Formula (1) in [18], Formula (1) in [20], Formulas (3) and (4) in [15], Formula (3) in [16], Formula (8) in [17], Formula (1) in [21]. Equation ( 2 ) is in fact a generalization of all the above models, incorporating the implementation of different selection rules (Definition 3) as realized in [30]. The analogous equation for modeling knowledge diffusion, incorporating selection rules and prioritizations, has also been studied [84,85,86].
Definition 5.
(Attitude Change Dynamics Equation).
The dynamics of attitude change is formulated as the following difference equation for each agent κ , during the time interval ( t ,   t + 1 ] :
ψ κ ( t + 1 ) = ψ κ ( t ) + Φ κ   ( t )
where Φ κ   ( t ) is the attitude change formula of agent κ :
Φ κ   ( t ) = ψ κ ( t ) < 0 · m a x { λ = 1 Ν Φ λ κ   ( t ) ,   1 ψ κ ( t ) } + ψ κ ( t ) 0 · m i n { λ = 1 Ν Φ λ κ   ( t ) ,   1 ψ κ ( t ) }  
where Φ λ κ   ( t ) is the influence for attitude change from the in-neighbor agent λ (Definition 4).
The terms m a x { λ = 1 Ν Φ λ κ   ( t ) ,   1 ψ κ ( t ) } and m i n { λ = 1 Ν Φ λ κ   ( t ) ,   1 ψ κ ( t ) } are introduced in ( 4 ) in order to keep the attitude values bounded within the interval [ 1 ,   1 ] (Definition 1). The difference Equation ( 3 ) is a generalization of the discrete diffusion equation in networks.
In this work, the emerging dynamics of attitude change (solutions of Equation   ( 3 ) ) is analyzed in terms of Attitude Diagrams and Change Adoption Diagrams. The definitions are provided below.
Definition 6.
(Attitude Diagram (AD)).
The Attitude Diagram is the temporal plot of ψ κ ( t ) of agent κ , κ = 1 , 2 , , N . We distinguish three kinds of attitude corresponding to intervals specified by the accepted deviation δ > 0 :
  • Positive attitude interval: Ξ + = [ 1 δ , 1 ]
  • Negative attitude interval: Ξ = [ 1 , 1 + δ ]
  • Neutral/Non-Extreme attitude interval: Ξ 0 = ( 1 + δ , 1 δ )
Agents are characterized at each time t according to their attitude ψ κ ( t ) as follows:
  • Supporters: ψ κ ( t ) Ξ +
  • Opponents: ψ κ ( t ) Ξ
  • Neutrals: ψ κ ( t ) Ξ 0
Definition 7.
(Change Adoption Diagram (CAD)).
The Change Adoption Diagram is the temporal plot of the percentages of supporters, opponents and neutrals defined as follows:
  • Percentage of supporters: 𝓅 + ( t ) = κ = 1 Ν ψ κ ( t ) Ξ + N
  • Percentage of opponents: 𝓅 ( t ) = κ = 1 Ν ψ κ ( t ) Ξ N
  • Percentage of neutrals: 𝓅 0 ( t ) = κ = 1 Ν ψ κ ( t ) Ξ 0 N
By definition we have: 𝓅 + ( t ) + 𝓅 ( t ) + 𝓅 0 ( t ) = 1 .
Remark 2.
Ties-Attitudes Co-evolution via local “agent-to-agent” interactions.
The co-evolution of social ties and attitudes is formulated in terms of evolution equations for ties ( 1 ) and attitudes ( 3 ) . This Ties-Attitudes co-evolution equation is a non-linear stochastic difference equation, incorporating the actual interplay of ties (weights) with attitudes in time. The interdependence of ties with attitudes is formulated at the local microscopic level of agent-to-agent interaction , which is twofold (Figure 1). On one hand, there is an update of agents’ attitude due to the diffusion process. On the other hand, at the same time, there is a mutually dependent update of agents’ social ties due to the “experience” of communication (feedback) with the selected agent. The simultaneous update of attributes and weights is a key distinction of our model with other agent-based models of network co-evolution, where the updates of attributes and weights, are not realized simultaneously. More specifically, at each time step, a random choice for either diffusion or rewiring is proposed [87,88], excluding simultaneous update. The weights evolve to the value w λ κ ( t + 1 ) depending on the previous values of both weights w λ κ ( t ) and attitudes ψ κ ( t ) (Equation ( 1 ) ). This is a learning mechanism [89]. As a result, co-evolution is intrinsic/endogenous. In our model, learning is achieved via relevance feedback (Assumption 3.1), in other words via (social) experience. As learning results from communication with some neighbor, the weights evolution Formula ( 1 ) is completely different from the classical Hebbian Learning Rule [90]. However, the concept of “learning through experience” is ancient. Around 350 BC, Aristotle wrote in the Nicomachean Ethics (Book II.1, 1103): “for the things we have to learn before we can do them, we learn by doing them”.
The theory of structural balance, as well as the significant role of positive and negative ties, have been empirically verified at social networks [91,92,93,94]. The social balance theory of attitude change proposed by Heider based on triangles [95,96]. Harary and Cartwright formulated Heider’s theory mathematically using signed graphs [97,98]. A triangle is considered as “balanced” if the multiplication of the signs of the links is positive. A balanced triangle consists of three positive links or two negatives links with one positive link. Harary and Cartwright proved [98] the following Structure Theorem: A graph is balanced, if and only if, its nodes can be partitioned into two mutually exclusive classes such that: two nodes in the same class are connected by positive paths, and two nodes in different classes are connected by negative paths. Rapoport noted in page 541 of [99] that the Structure Theorem generates 4 aphorisms corresponding to a balanced graph:
  • My friend’s friend is my friend (triangle category I)
  • My friend’s enemy is my enemy (triangle category II)
  • My enemy’s friend is my enemy (triangle category III)
  • My enemy’s enemy is my friend (triangle category IV)
Although social influence, trust and friendship are directed (asymmetric) relations, structural balance was formulated in terms of undirected triangles (symmetric relations) [95,96,97,98,99]. In order to extend structural balance for directed networks, we have to consider signed directed triangles. The number of signed directed triangles is 64 (there are 2 3 possible signed undirected triangles and ( 2 3 ) 2 signed directed triangles). Only 8 triangles (Table 2) from the 64 possible directed triangles are balanced (compatible with categories I, II, III, IV above). Structural balance in directed networks involves “in-triangles” so that the Degree of Balance is defined as the ratio of the number of balanced in-triangles over the number of in-triangles. These concepts are formulated below (Definitions 8 and 9) for directed signed networks, extending the original definitions of Harary and Cartwright [98] for undirected signed networks.
Definition 8.
(in-Triangle of Agent κ).
For any triad of agents κ ,   λ ,   μ , there are 2 in-Triangles of agent κ , satisfying the condition:
w λ κ ( t ) · w μ λ ( t ) · w μ κ ( t ) 0 + w μ κ ( t ) · w λ μ ( t ) · w λ κ ( t ) 0 1
The bracket w λ κ ( t ) · w μ λ ( t ) · w μ κ ( t ) 0 corresponds to Table 2 (a) where agent λ is the “middle agent” and the bracket w μ κ ( t ) · w λ μ ( t ) · w λ κ ( t ) 0 corresponds to Table 2 (b) where agent μ is the “middle agent”. The number of in-Triangles of agent κ is:
t r i κ i n ( t ) = λ = 1 Ν μ = 1 Ν ( ( w λ κ ( t ) · w μ λ ( t ) · w μ κ ( t ) 0 + w μ κ ( t ) · w λ μ ( t ) · w λ κ ( t ) 0 ) · κ λ · λ μ · κ μ )
Taking into account Table 2, the number of Balanced Directed Triangles of agent κ is:
t r i κ b a l ( t ) = λ = 1 Ν μ = 1 Ν ( ( w λ κ ( t ) · w μ λ ( t ) · w μ κ ( t ) > 0 + w μ κ ( t ) · w λ μ ( t ) · w λ κ ( t ) > 0 ) · κ λ · λ μ · κ μ )
Definition 9.
(Degree of Balance in Directed Networks).
The Degree of Balance of a Directed Network is the ratio:
𝓉 𝓇 𝒾 b a l ( t ) = t r i b a l ( t ) t r i i n ( t )
where:
t r i i n ( t ) = κ = 1 Ν t r i κ i n ( t ) is the number of in-Triangles, and
t r i b a l ( t ) = κ = 1 Ν t r i κ b a l ( t ) is the number of Balanced (Directed) Triangles
In this work, the emerging dynamics of signed links (solutions of Equation   ( 1 ) ) and structural balance is analyzed in terms of Signed Links Diagrams and Balance Diagrams. The definitions are provided below.
Definition 10.
(Signed Links Diagram (SLD)).
The Signed Links Diagram is the temporal plot of the percentages of positive i n k s + ( t ) and negative i n k s ( t ) links in the network:
i n k s + ( t ) = κ = 1 Ν λ = 1 Ν ( w κ λ ( t ) > 0 · κ λ ) κ = 1 Ν λ = 1 Ν ( w κ λ ( t ) 0 · κ λ )
i n k s ( t ) = κ = 1 Ν λ = 1 Ν ( w κ λ ( t ) < 0 · κ λ ) κ = 1 Ν λ = 1 Ν ( w κ λ ( t ) 0 · κ λ )
Definition 11.
(Balance Diagram (BD)).
The Balance Diagram is the temporal plot of 𝓉 𝓇 𝒾 b a l ( t ) (Definition 9).

3. The Scenarios of Organizational Conflict

We investigate the case where two competing groups of influential agents (“promoters” versus “adversaries” of change) operate concurrently within the same organizational network. The social outcome of the co-existence of promoters and adversaries in the same organizational network is characterized by conflicting “pulls” towards the two extremes of attitude + 1 and 1 . We assume that initially ( t = 0 ) all agents, except from the promoters and adversaries, are:
  • Same-minded: all agents share the same “neutral” attitude ψ κ ( t ) , taking random values in a narrow interval, as for instance [ 0.05 , + 0.05 ] , and moreover
  • Positively-linked: all weights w λ κ ( t ) are non-negative
Due to the above two initial conditions, only “attractive” interactions are possible in the network, according to the Attitude Change Dynamics Equation ( 3 ) . Therefore, if there is no external intervention, the final distribution of attitudes ψ κ ( t ) is expected lie within the same interval [ 0.05 , + 0.05 ] . However, we assume that some of the agents act as “promoters” or “adversaries”:
  • Promoters influence individuals towards the promoting attitude ψ + = 1 , while at the same time,
  • Adversaries influence individuals towards the adverse attitude ψ = 1
Promoters and adversaries are purposely disseminating targeted messages, beliefs, values and behaviors, influencing the individuals of the network so that their attitude (of the individuals) to become eventually close to the “target” attitude ψ t a r g e t , which is equal to ψ + = 1 (if the influential agent is a “promoter”) or equal to ψ = 1 (if the influential agent is an “adversary”). We assume that “promoters” ( ψ + = 1 ) and “adversaries” ( ψ = 1 ) have always the same attitude, like “informed” or “stubborn” agents [50,51,52,53].
Promoters and adversaries are triggering attitude polarization within the network. As we have taken into account co-evolution (Remark 2), the triggering of attitude polarization comes with the corresponding structural change of the interpersonal social ties among the communicating individuals (Equation ( 1 ) ). In this perspective, as the weight evolution Formula ( 1 ) allows the emergence of negative weights (Remark 1), we shall investigate the dynamics of structural balance [96] in the network. The analysis is performed in the 4 real organizational networks, already discussed previously [30]:
  • An organizational network of a “Consulting Company” (CC) of size 46 [100].
  • An organizational network of a “Research Team of a Manufacturing Company” (MC) of size 77 [100].
  • A partnership network of a “Corporate Law Firm” (LF) of size 71 [101].
  • An organizational network of a “IT Department of a Fortune 500 Company” (IT) of size 56 [102].
All above networks are directed and weighted, with initial non-negative weights. The weights are constructed from the relevant datasets: [103] for CC and MC, [104] for LF, and [102] for IT (see Supplementary Material SM I).
The influence of the position of promoters and adversaries (Q4) is discussed for nodes with low, medium, and high degree centrality (Table 3) following the line of thought of [105]. The centrality of the initiators (nodes initiating spread) may influence significantly the emerging dynamics of the system [106]. The positive weighted out-Degree d e g κ o u t + ( t ) is defined as the sum of the positive outgoing weights w κ ν ( t ) to all first neighbors: d e g κ o u t + ( t ) = ν = 1 Ν ( w κ ν ( t ) · w κ ν ( t ) > 0 ) . In Table 3, “low centrality” means that the influential agents are randomly selected from the subset of agents who have at time t = 0 : d e g κ o u t + ( t ) 25 % · d e g κ o u t + ( t ) ¯ , where d e g κ o u t + ( t ) ¯ is the average value of all agents κ = 1 , 2 , , Ν . In this perspective, “medium centrality” corresponds to influential agents who have: d e g κ o u t + ( t ) 50 % · d e g κ o u t + ( t ) ¯ and “high centrality” corresponds to influential agents who have: d e g κ o u t + ( t ) 100 % · d e g κ o u t + ( t ) ¯ . Concerning the influence of the number of promoters and adversaries (Q3) we also consider three different cases, namely: 5% versus 5%, 10% versus 10%, 15% versus 15% (Table 3).

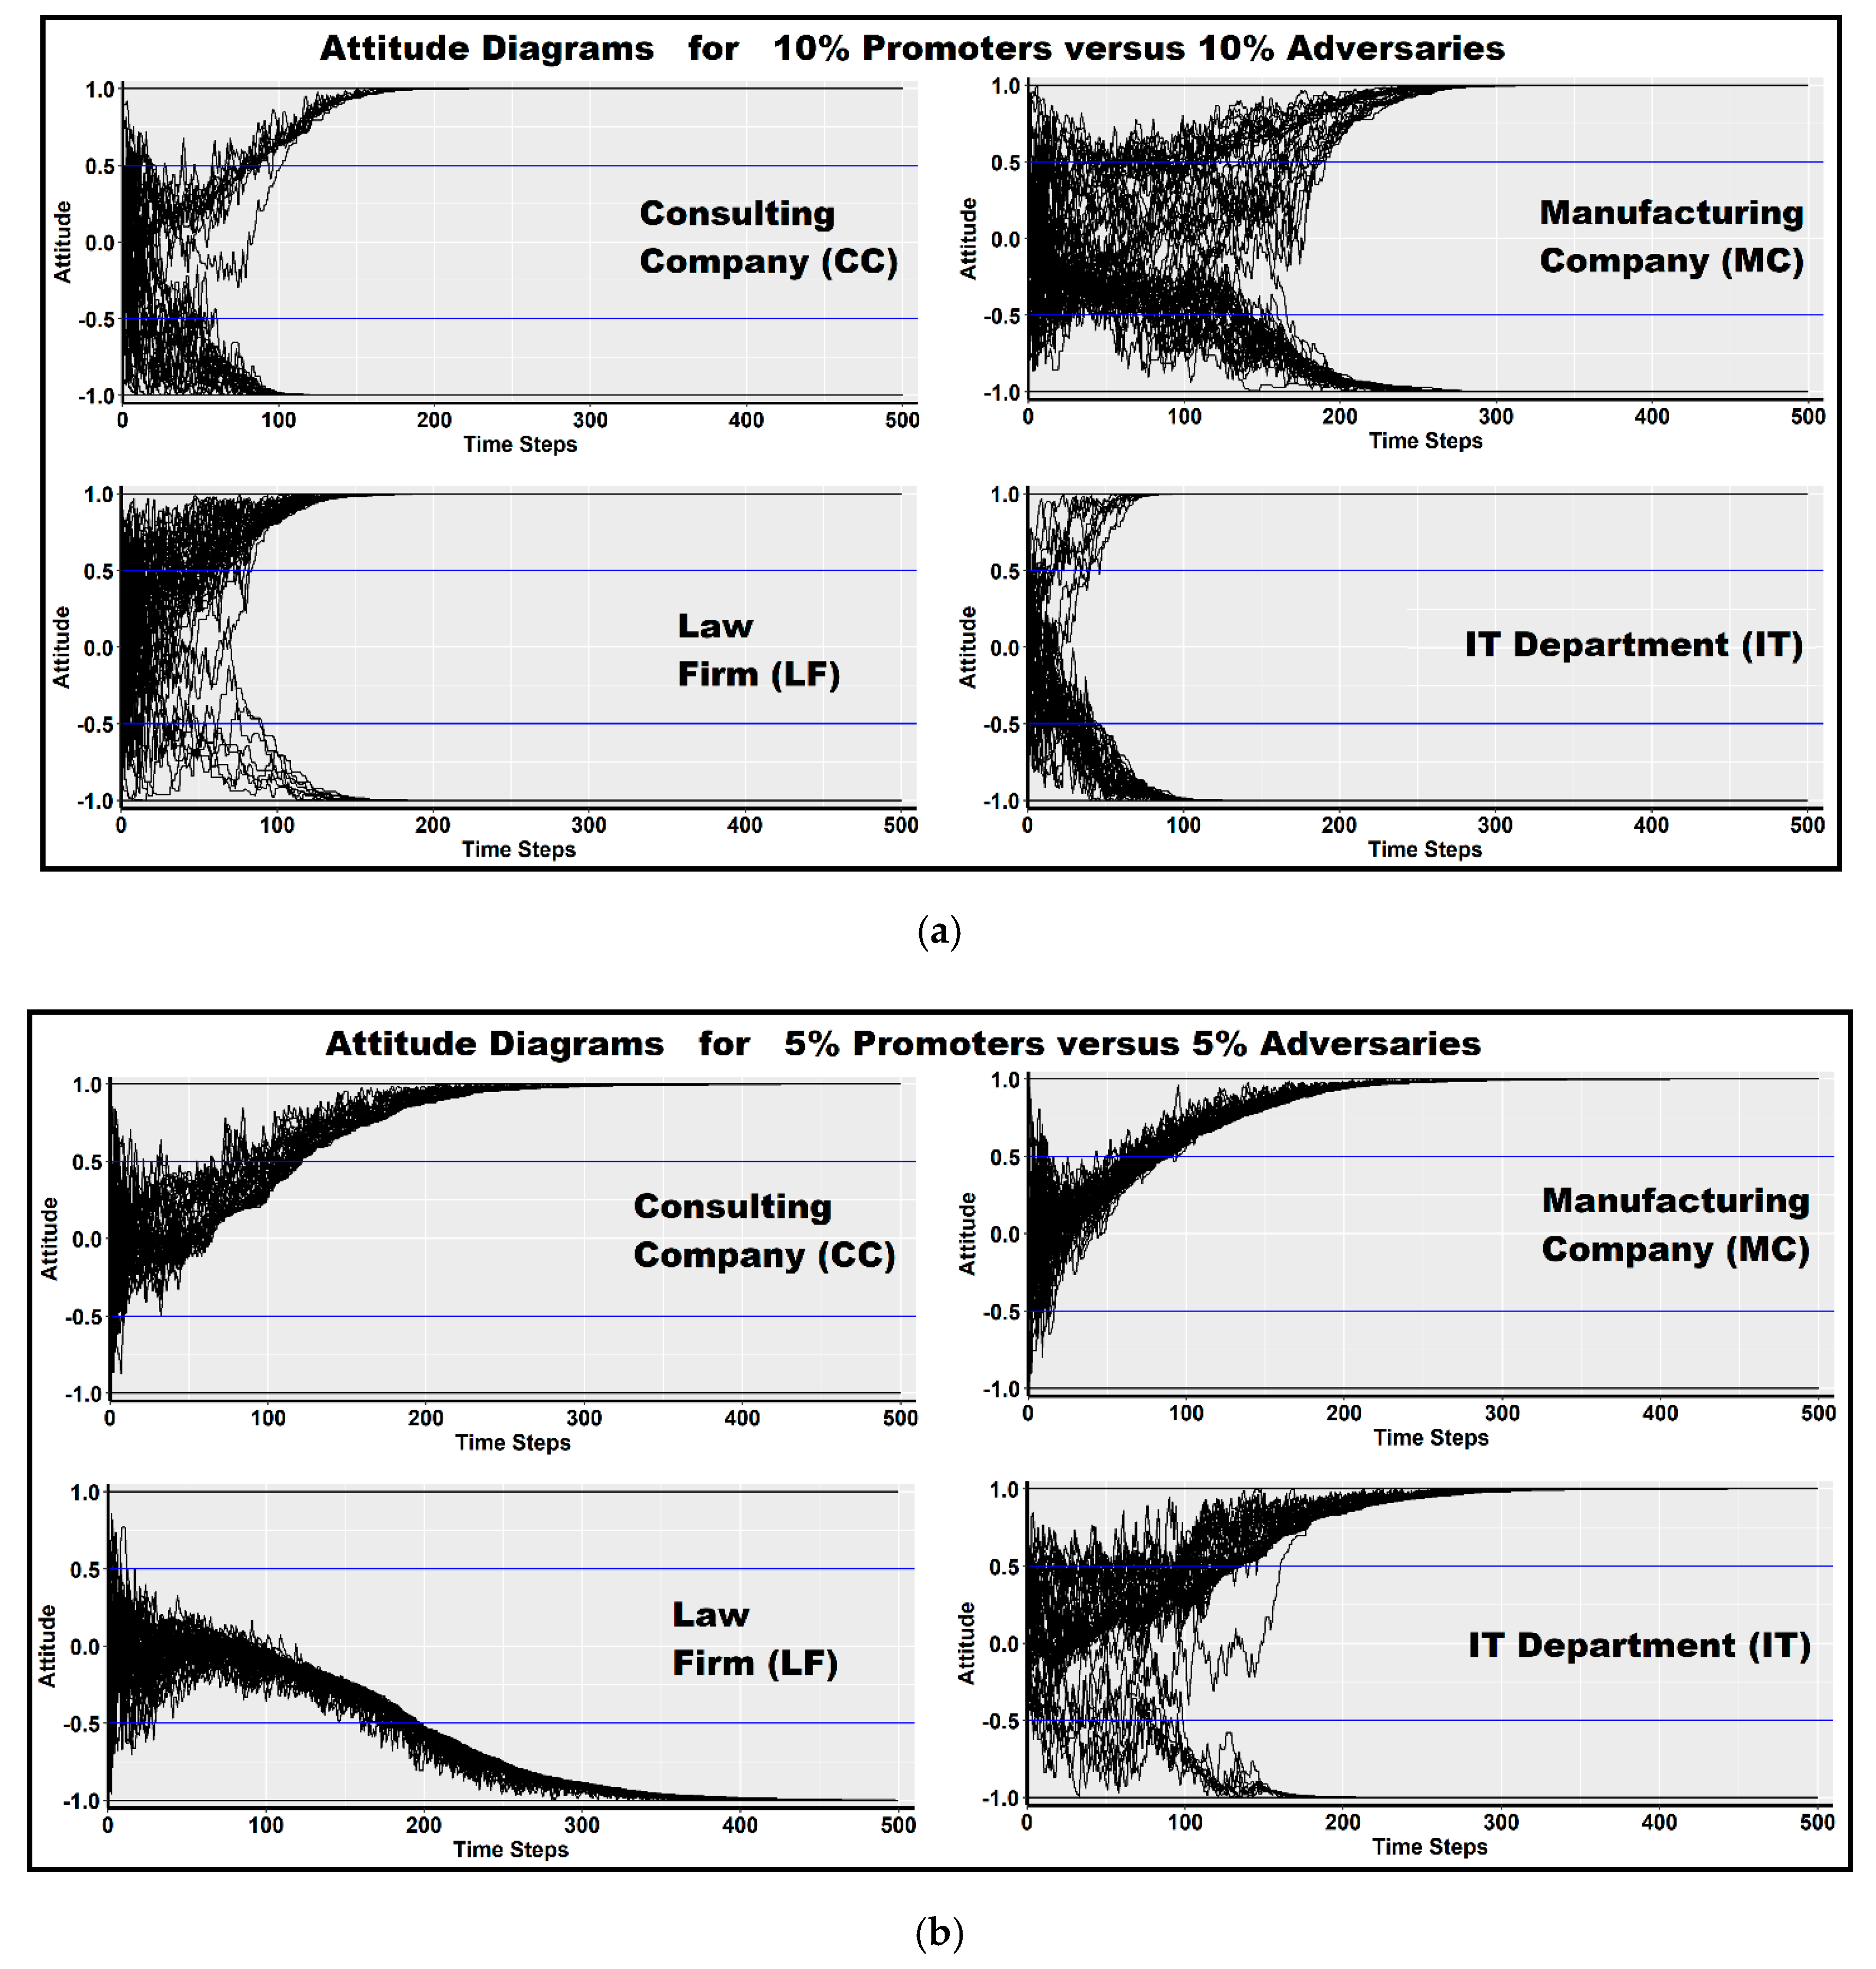
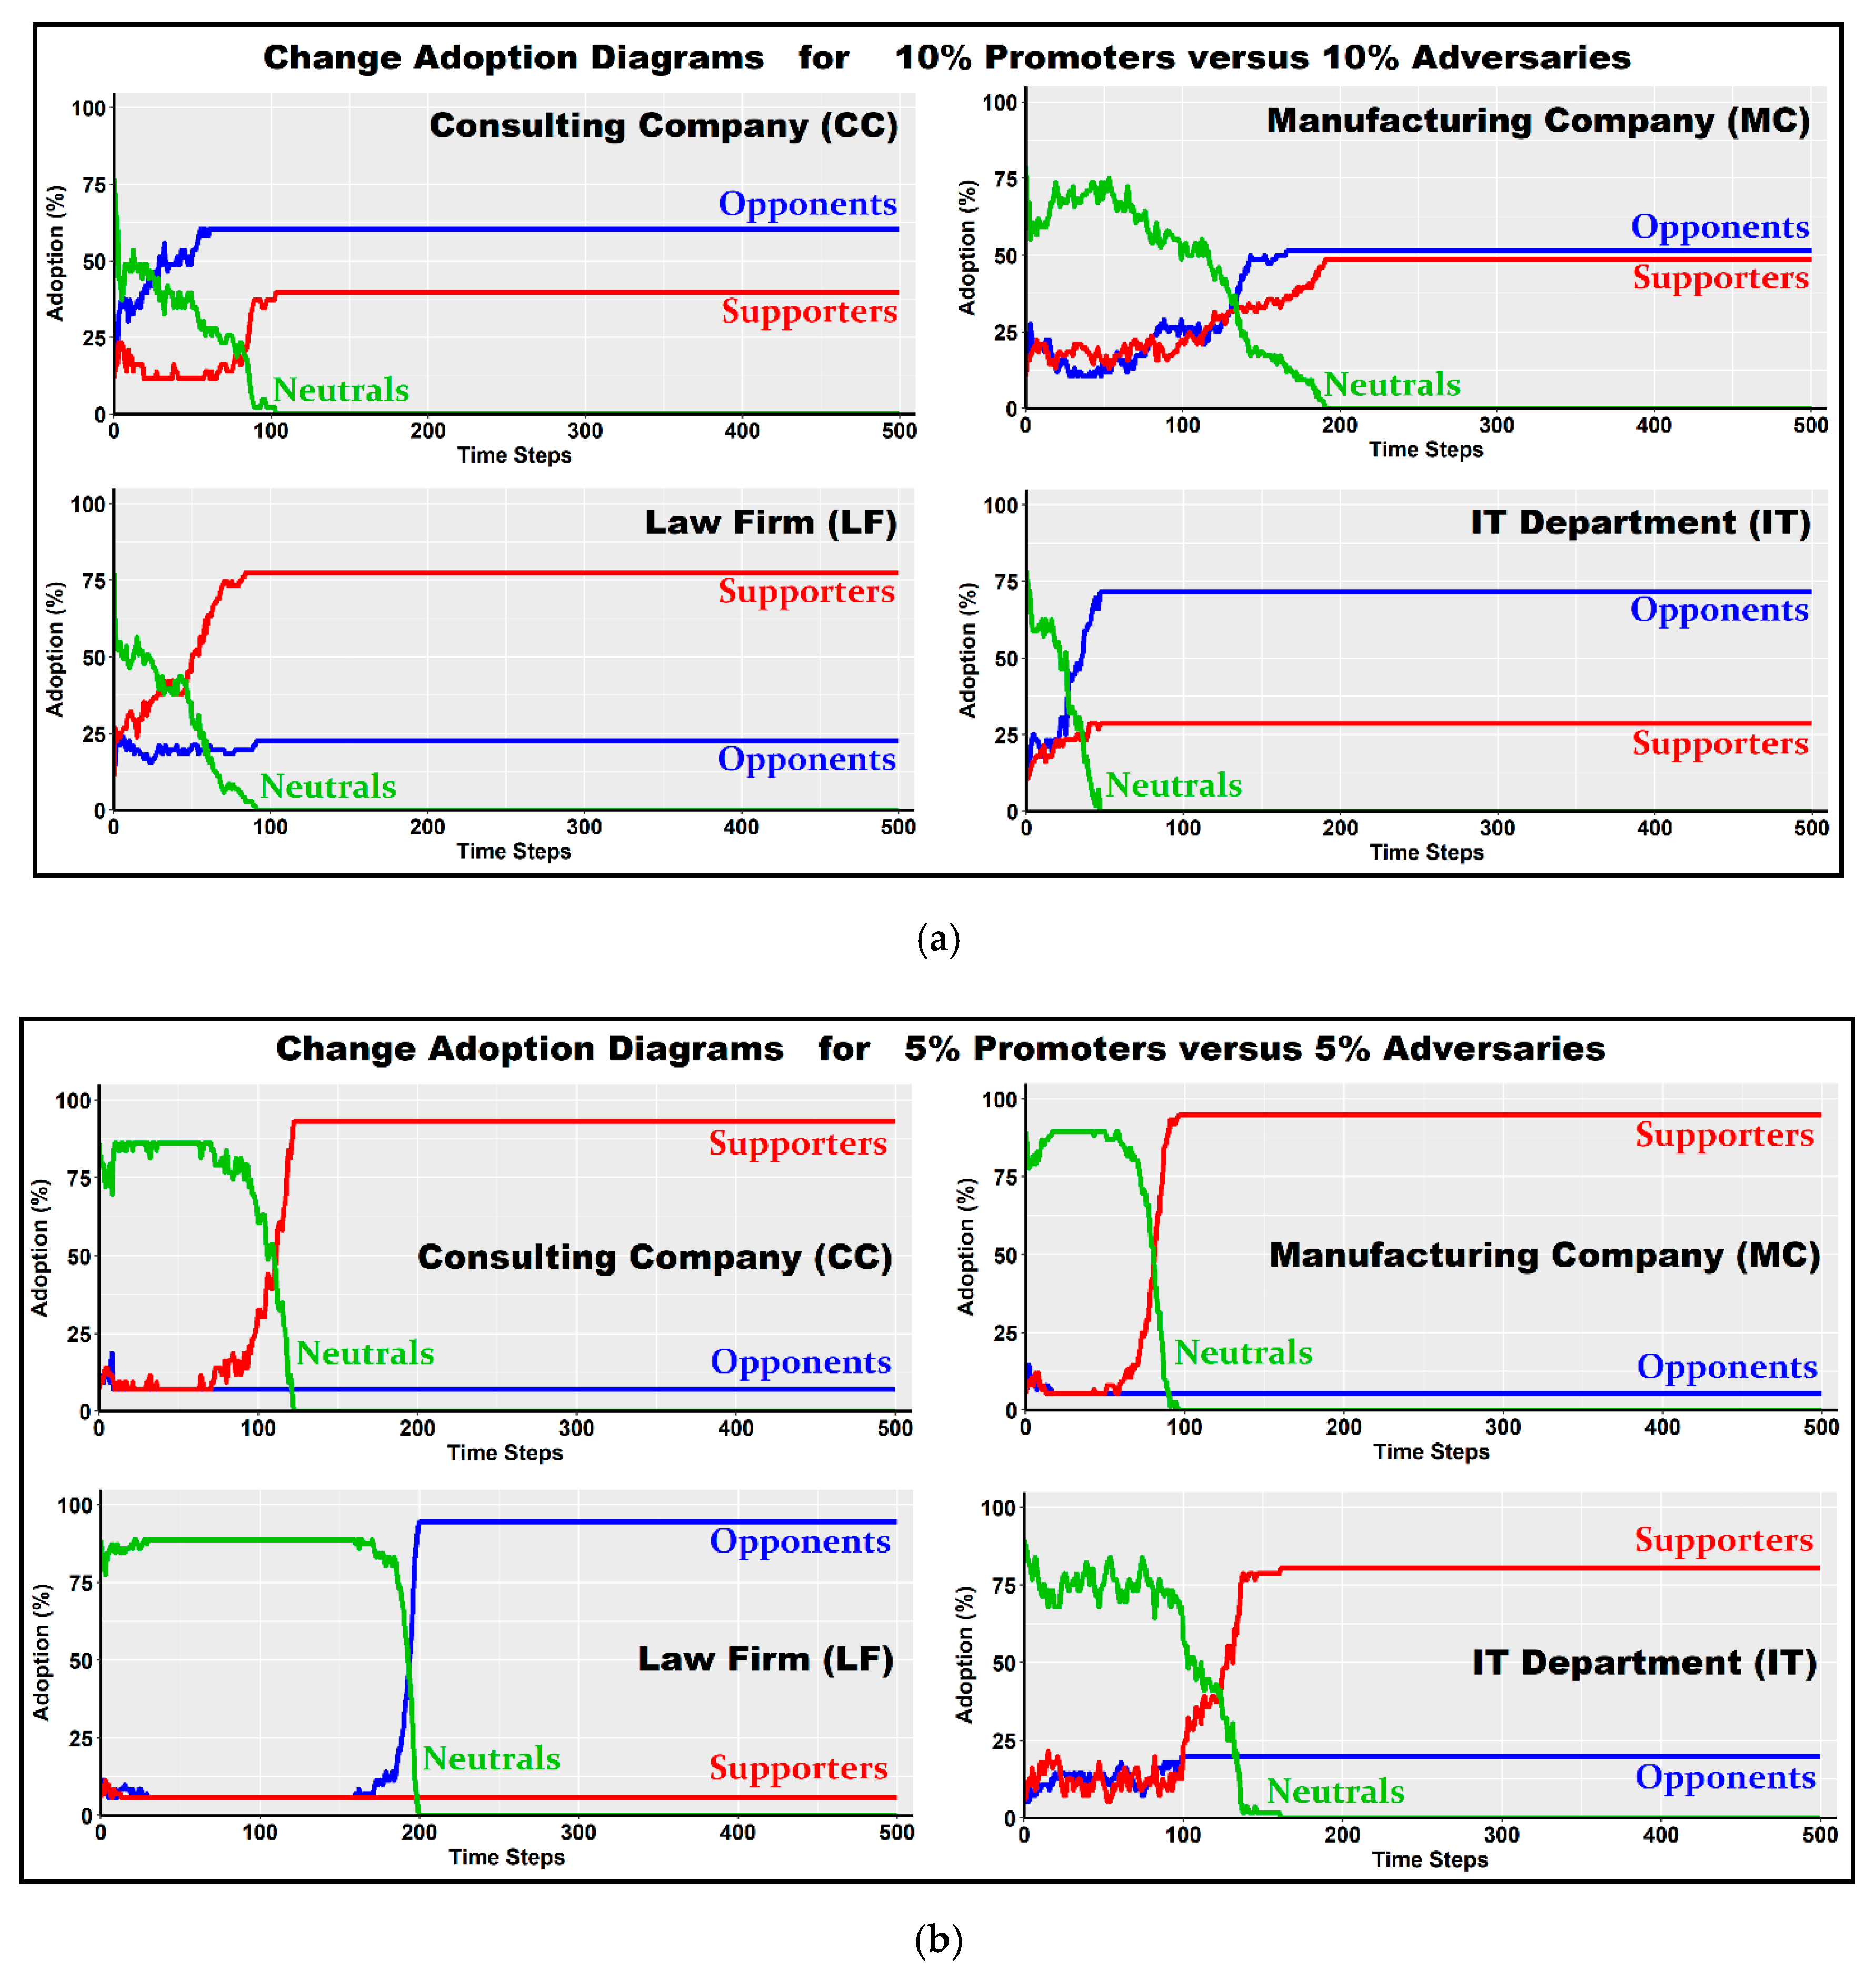
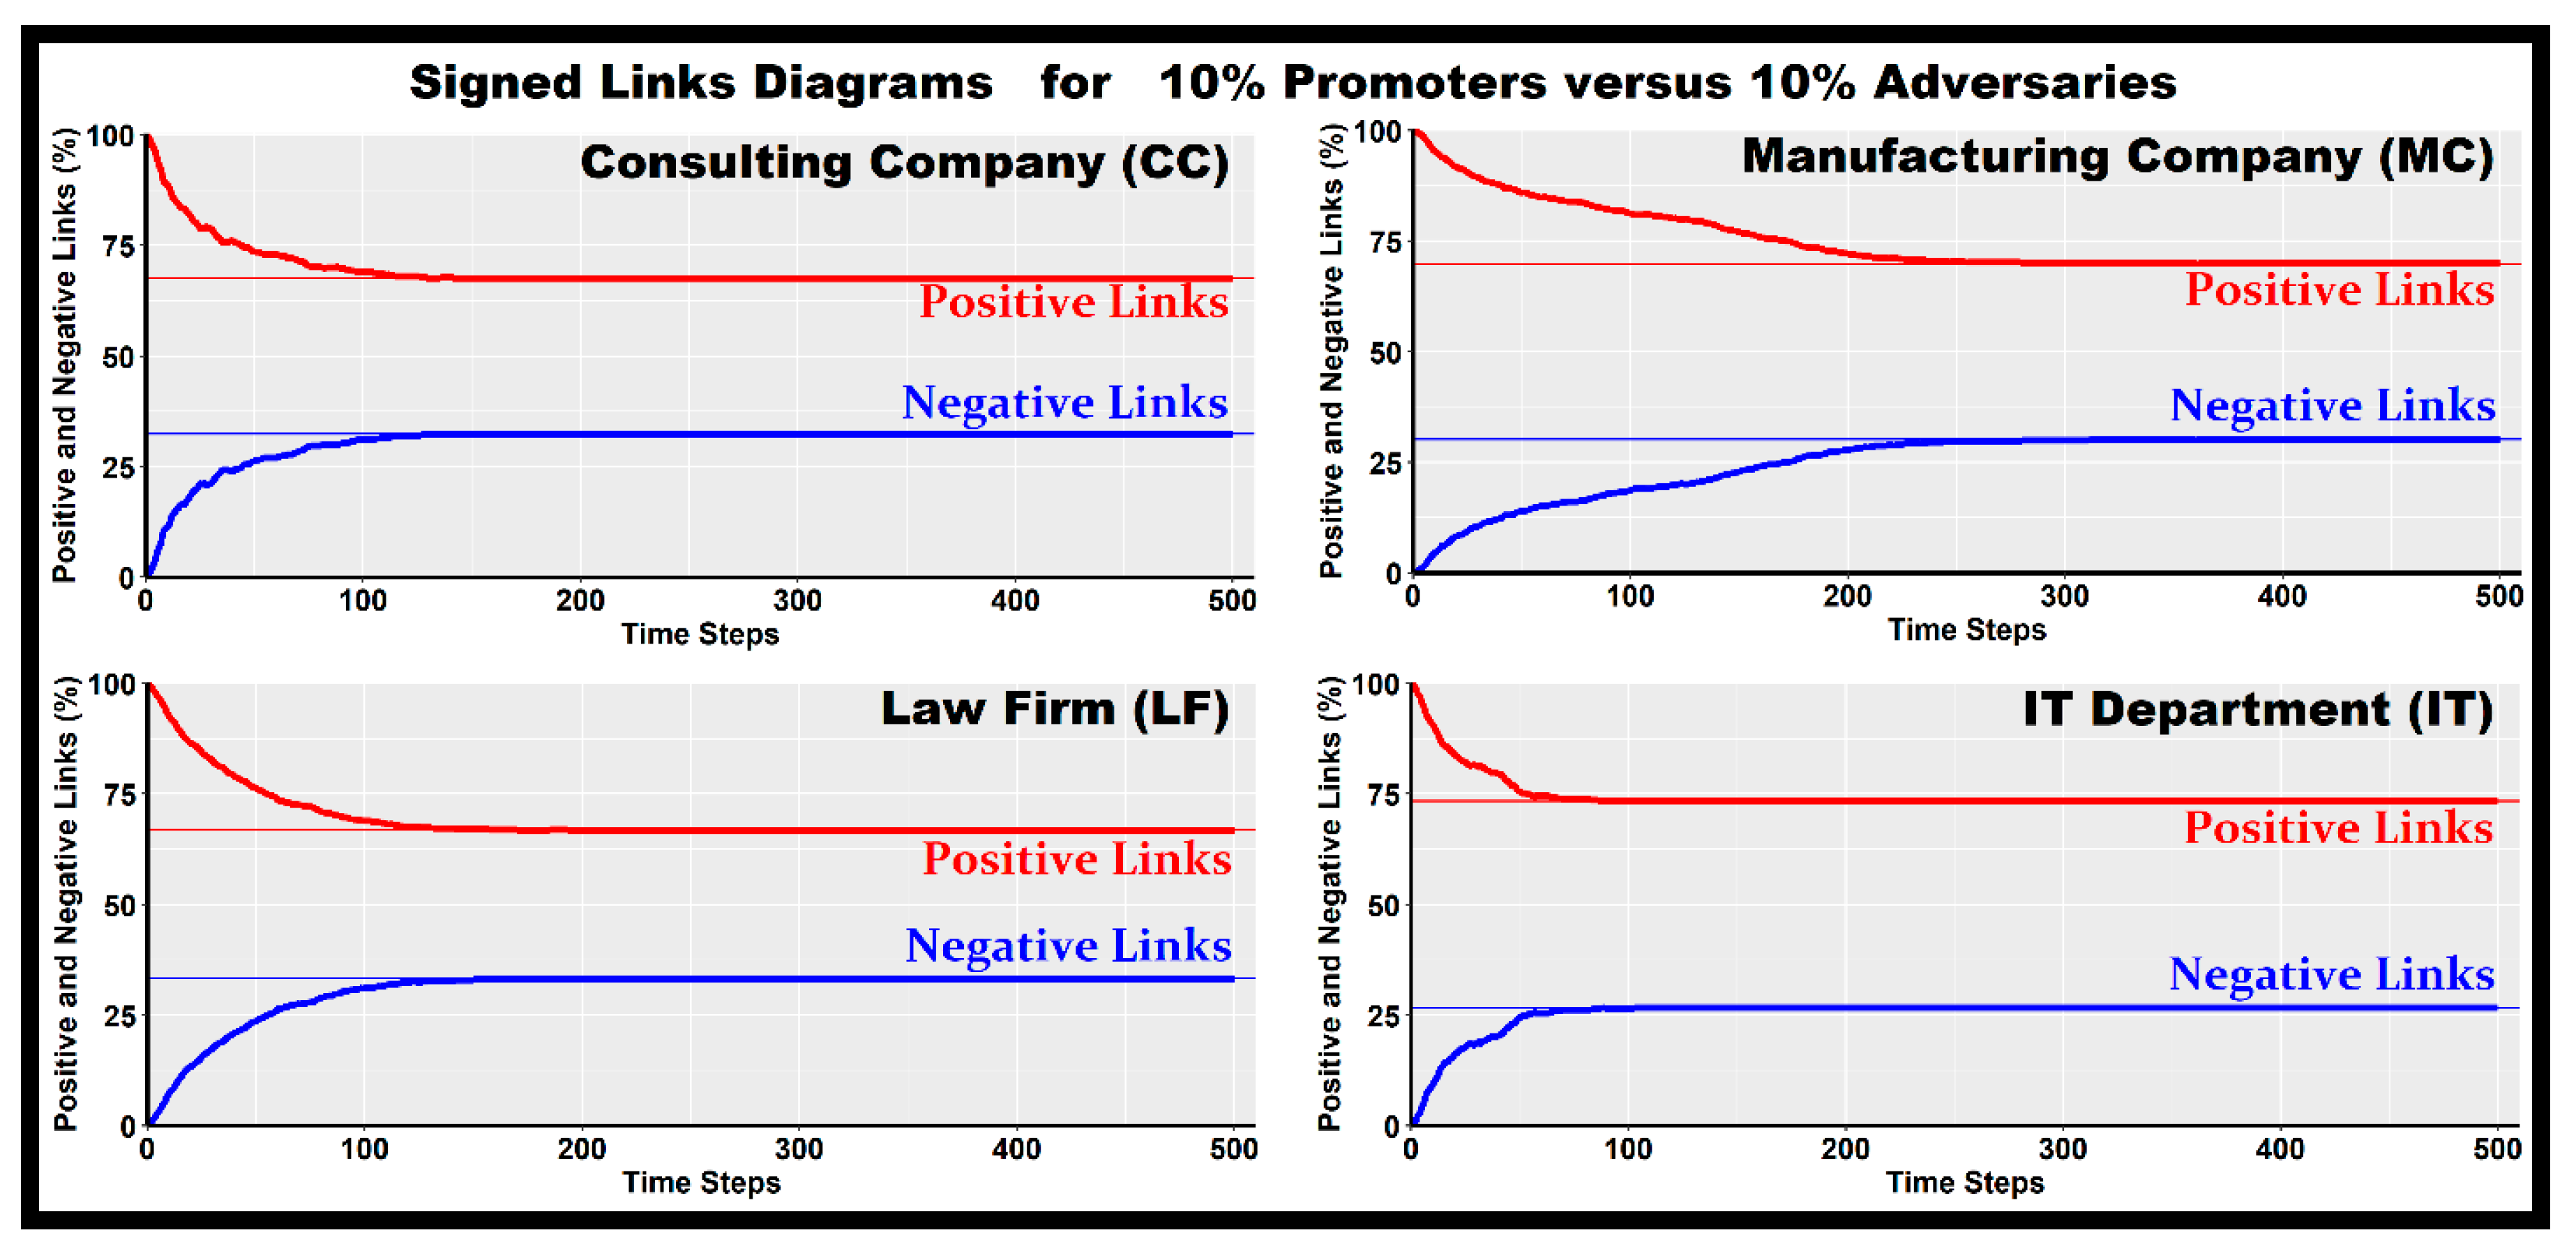
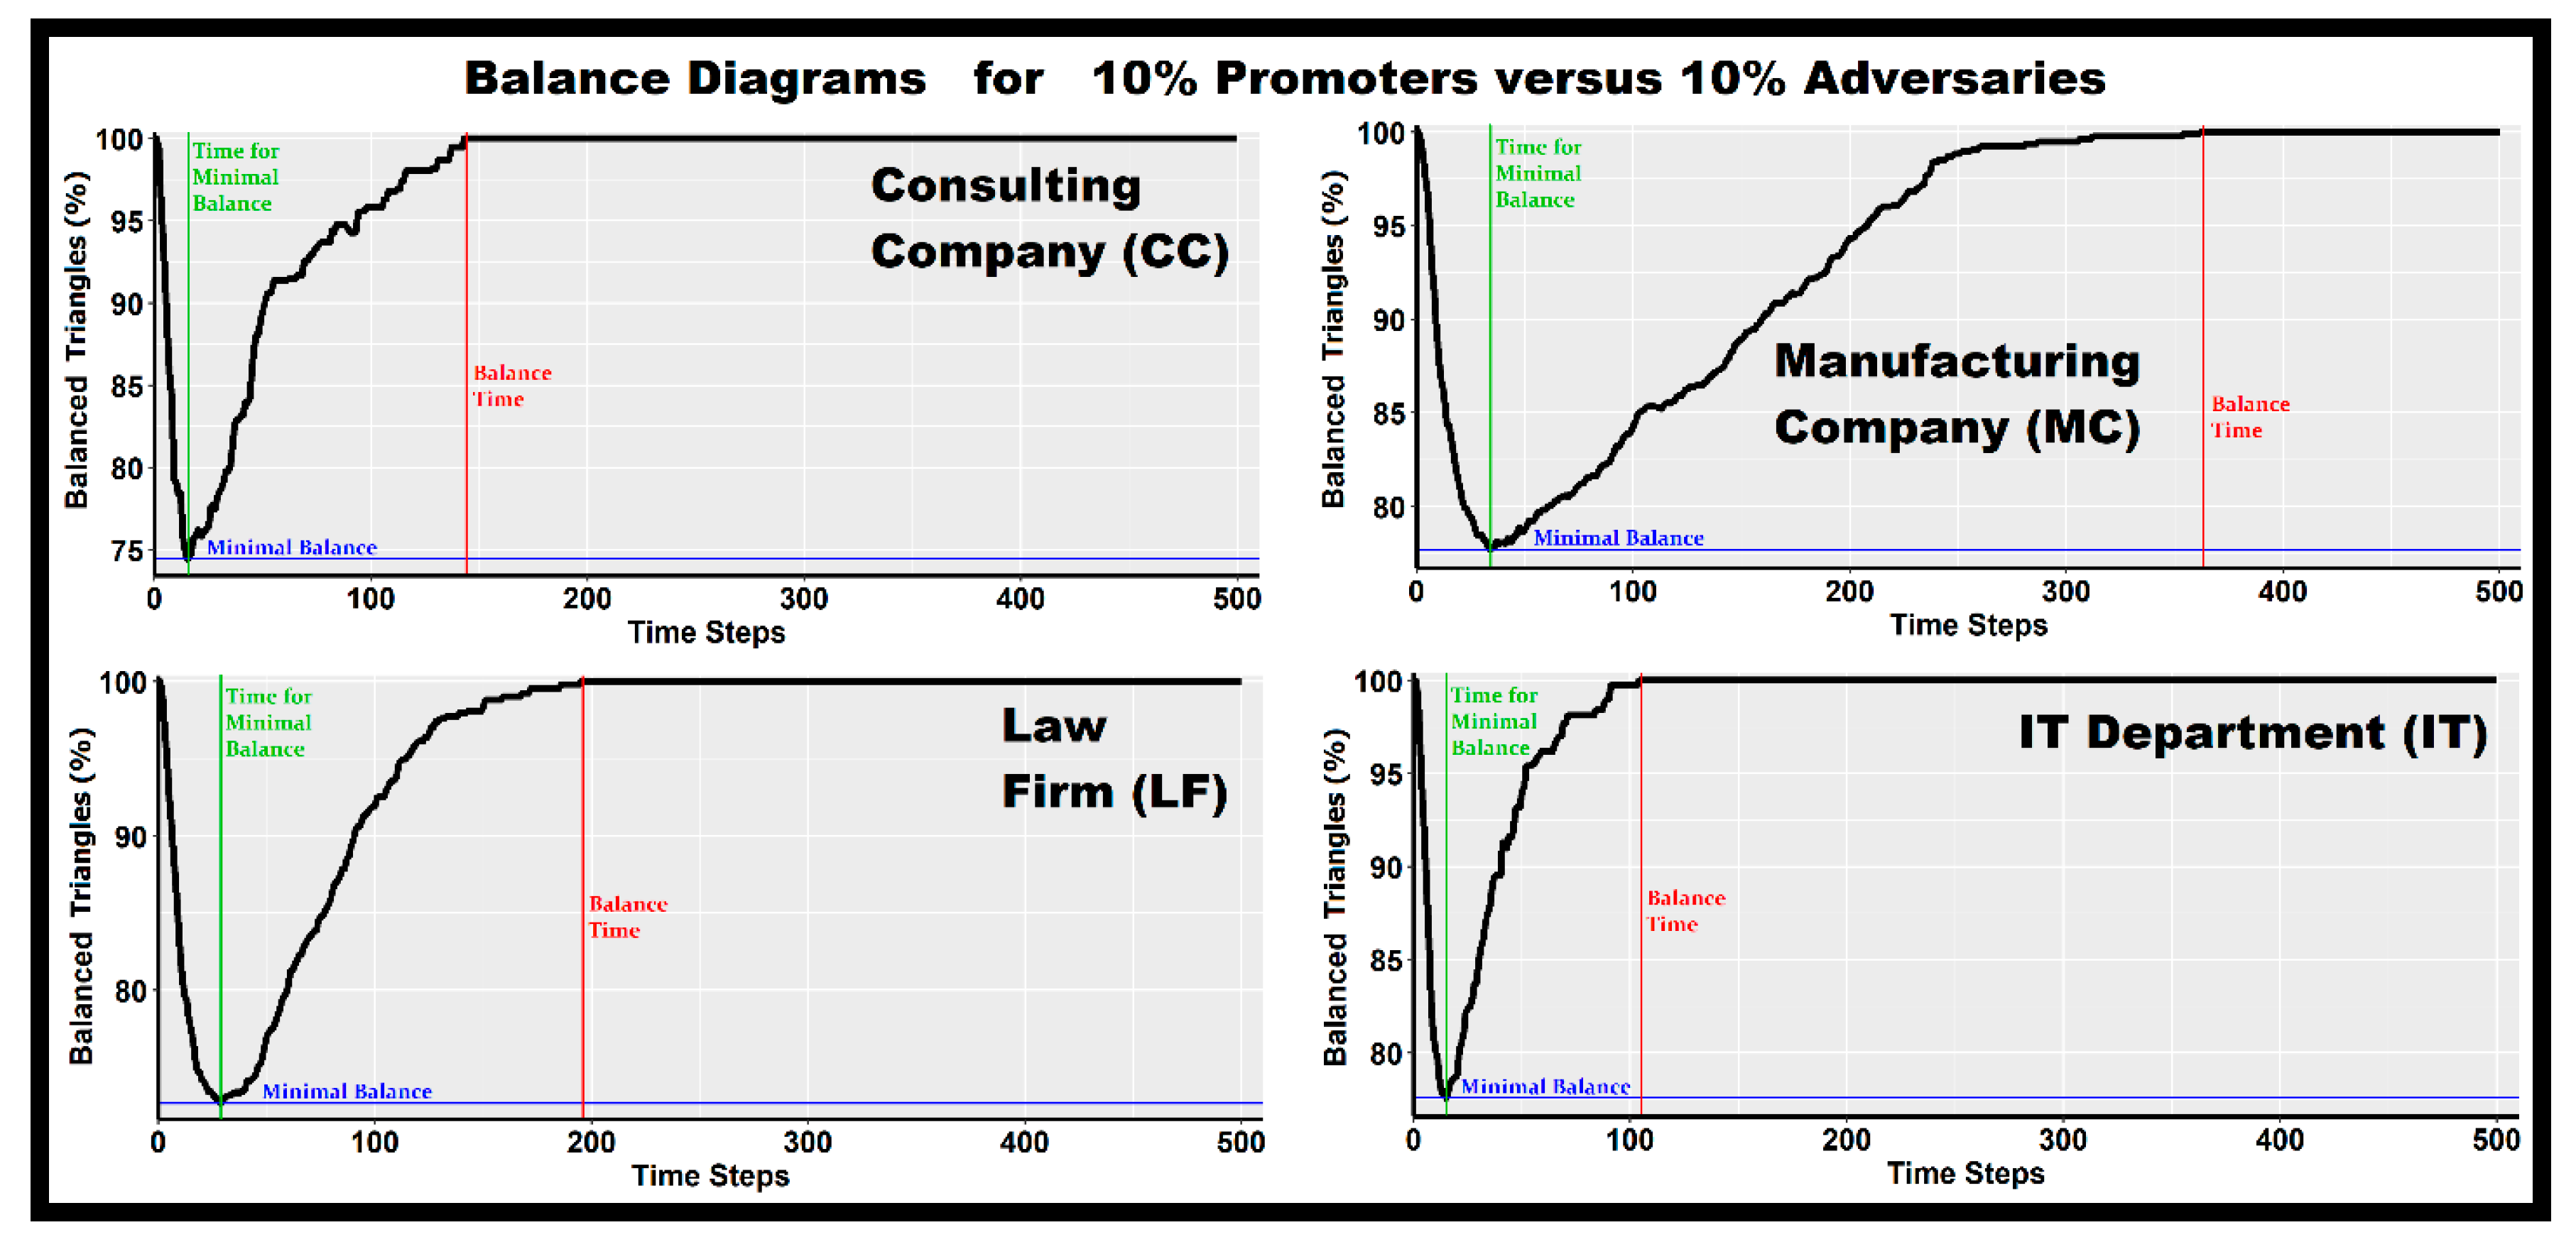
4. The Dynamics of Attitude Change, Signed Links and Structural Balance

The dynamics of attitude change is analyzed in terms of Definitions 6 and 7, while the dynamics of signed links and structural balance is analyzed in terms of Definitions 10 and 11. The Attitude Diagrams for the 4 real organizational networks are presented in Figure 2a,b, and the corresponding Change Adoption Diagrams in Figure 3a,b. The Signed Links Diagrams for the 4 real organizational networks are presented in Figure 4 and the corresponding Balance Diagrams in Figure 5.
Remark 3.
Emergence of Attitude Polarization or Attitude Domination, depending on the number of promoters and adversaries.
The co-existence of promoters and adversaries may drive the network to the polarization of attitudes (all agents eventually adopt extreme attitudes ψ + = 1 , ψ = 1 , Figure 2a and Figure 3a) or to the domination of one attitude (Figure 2b and Figure 3b). Polarization emerges if the number of promoters and adversaries is 10% versus 10% (Figure 2a and Figure 3a) or higher 15% versus 15% (see Supplementary Material SM II). Domination emerges for lower numbers 5% versus 5% and may be complete (CC, MC, LF networks in Figure 2b and Figure 3b) or “partial” (IT network in Figure 2b and Figure 3b). Concerning “the emergence of the dominant group,” we performed several multiple simulations from the same starting point. We found that the dominant group may be either the “promoters” of change or the “adversaries” of change, with a probability of 50%. This is not astonishing because the number of promoters and adversaries is the same and moreover, they have more or less the same degree centrality (Table 3).
Remark 4.
Negative links emerge dynamically (no extrinsic intervention) and approach Equilibrium monotonically.
Although initially all agents are positively linked ( w λ κ ( t ) 0 ) , negative links are emerging, reaching eventually a maximum value (blue horizontal lines in Figure 4). The emergence of negative weights is due to the weights evolution Formula ( 1 ) (Remark 1). The dynamics of positive links are symmetric to the dynamics of negative links. Positive links are decreasing, reaching eventually a minimum value (red horizontal lines in Figure 4), as negative links are increasing. The dynamics of both positive and negative links appear to be monotonic.
Remark 5.
Self-Organization of Balance.
The network is initially fully balanced (Figure 5) due to the absence of negative links (Figure 4). As negative links emerge disorderly, network balance decreases rapidly up to a minimal value (blue horizontal lines in Figure 5). After some time (green vertical lines in Figure 5), as new negative links emerge, a “new” 100% balance is progressively re-established. This “new” balance, however, is including both positive and negative links. This macroscopic outcome is due to a diffusion process involving feedbacks on weight updates, realized via agent-to-agent interactions at the local microscopic level. This “micro-macro link” is a new example of self-organization. The initial balanced positive triangles become unbalanced due to the emergence of negative links, but eventually, the network is “learning” and therefore a “new” balance is established including both positive and negative links. It is also remarkable that the decrease of network balance is realized faster than the re-establishment of balance. This fact is due to the weights evolution Formula ( 1 ) which incorporates a “slow-positive” and “fast-negative” effect of the sign of the relevance feedback on the weights dynamics (Assumption 3.1).
Remark 6.
Balance emerges concurrently with Polarization or Domination.
The co-evolutionary dynamics (Equations ( 1 ) and ( 3 ) ) results in a new self-organization process of attitudes and social ties. The presence of promoters and adversaries transforms the network of initially same-minded and positively-linked agents in two ways: a network of agents with polarized attitudes or with one dominating attitude (Remark 3) while in parallel, the network balance of initial positive links is destroyed as negative links appear, and eventually a “new” balance emerges such that same-minded agents are positively-linked and different-minded agents are negatively-linked (Remarks 4 and 5). The proposed mechanism (Equations ( 1 ) and ( 3 ) ) provides a dynamical justification for the emergence of structural balance, concurrently with the polarization or domination of attitudes in finite time.

5. Conditioning Factors

Based on the previous analysis (Section 4) we can estimate how the co-evolving dynamics of attitudes (Remark 3) and balance (Remarks 4–6) are influenced by the number of promoter and adversaries (Q3), the position of promoter and adversaries (Q4) and the learning rate (Q5). The impact of conditioning factors (Q3), (Q4), (Q5) on the emerging dynamics of attitudes is assessed in terms of Attitude Diagrams (Definition 6) and Change Adoption Diagrams (Definition 7). Polarization emerges for 10% versus 10% or higher 15 versus 15%, while domination emerges for lower numbers 5% versus 5% (see Supplementary Material SM II) (Q3). The Attitude Diagrams and the Change Adoption Diagrams remain qualitatively the same, if the position of promoters and adversaries (Q4) or the learning rate (Q5) vary according to Table 3. The impact of conditioning factors (Q3), (Q4), (Q5) on balance dynamics is assessed in terms of Signed Links Diagrams (Definition 10) and Balance Diagrams (Definition 11). If the number of promoters and adversaries increases, then the number of Final Negative Links is getting higher while the number of Final Positive Links is getting lower (see Supplementary Material SM II) (Q3). The Signed Links Diagrams and the Balance Diagrams remain qualitatively the same, if the position of promoters and adversaries (Q4) or the learning rate (Q5) vary according to Table 3.
A quantitative assessment of the impact of conditioning factors (Q3), (Q4), (Q5) on the dynamics of signed links and structural balance is provided in terms of the following 5 estimations:
  • The relative change (%) of the number of final positive links (FPL) (Red line in Figure 4)
  • The relative change (%) of the number of final negative links (FNL) (Blue line in Figure 4)
  • The relative change (%) of the value of minimal balance (MB) (Blue line in Figure 5)
  • The relative change (%) of the time to achieve minimal balance (MBT) (Green line in Figure 5)
  • The relative change (%) of the time for the re-establishment of balance (BT) (Red line in Figure 5)
These estimations are summarized in Table 4 considering 100 independent simulations of each examined scenario (Table 3). The numerical results for the 4 organizational networks are provided (see Supplementary Material SM III).
Remark 7.
The impact of conditioning factors on the dynamics of Balance and Links.
From Table 4 we observe the following three:
(a)
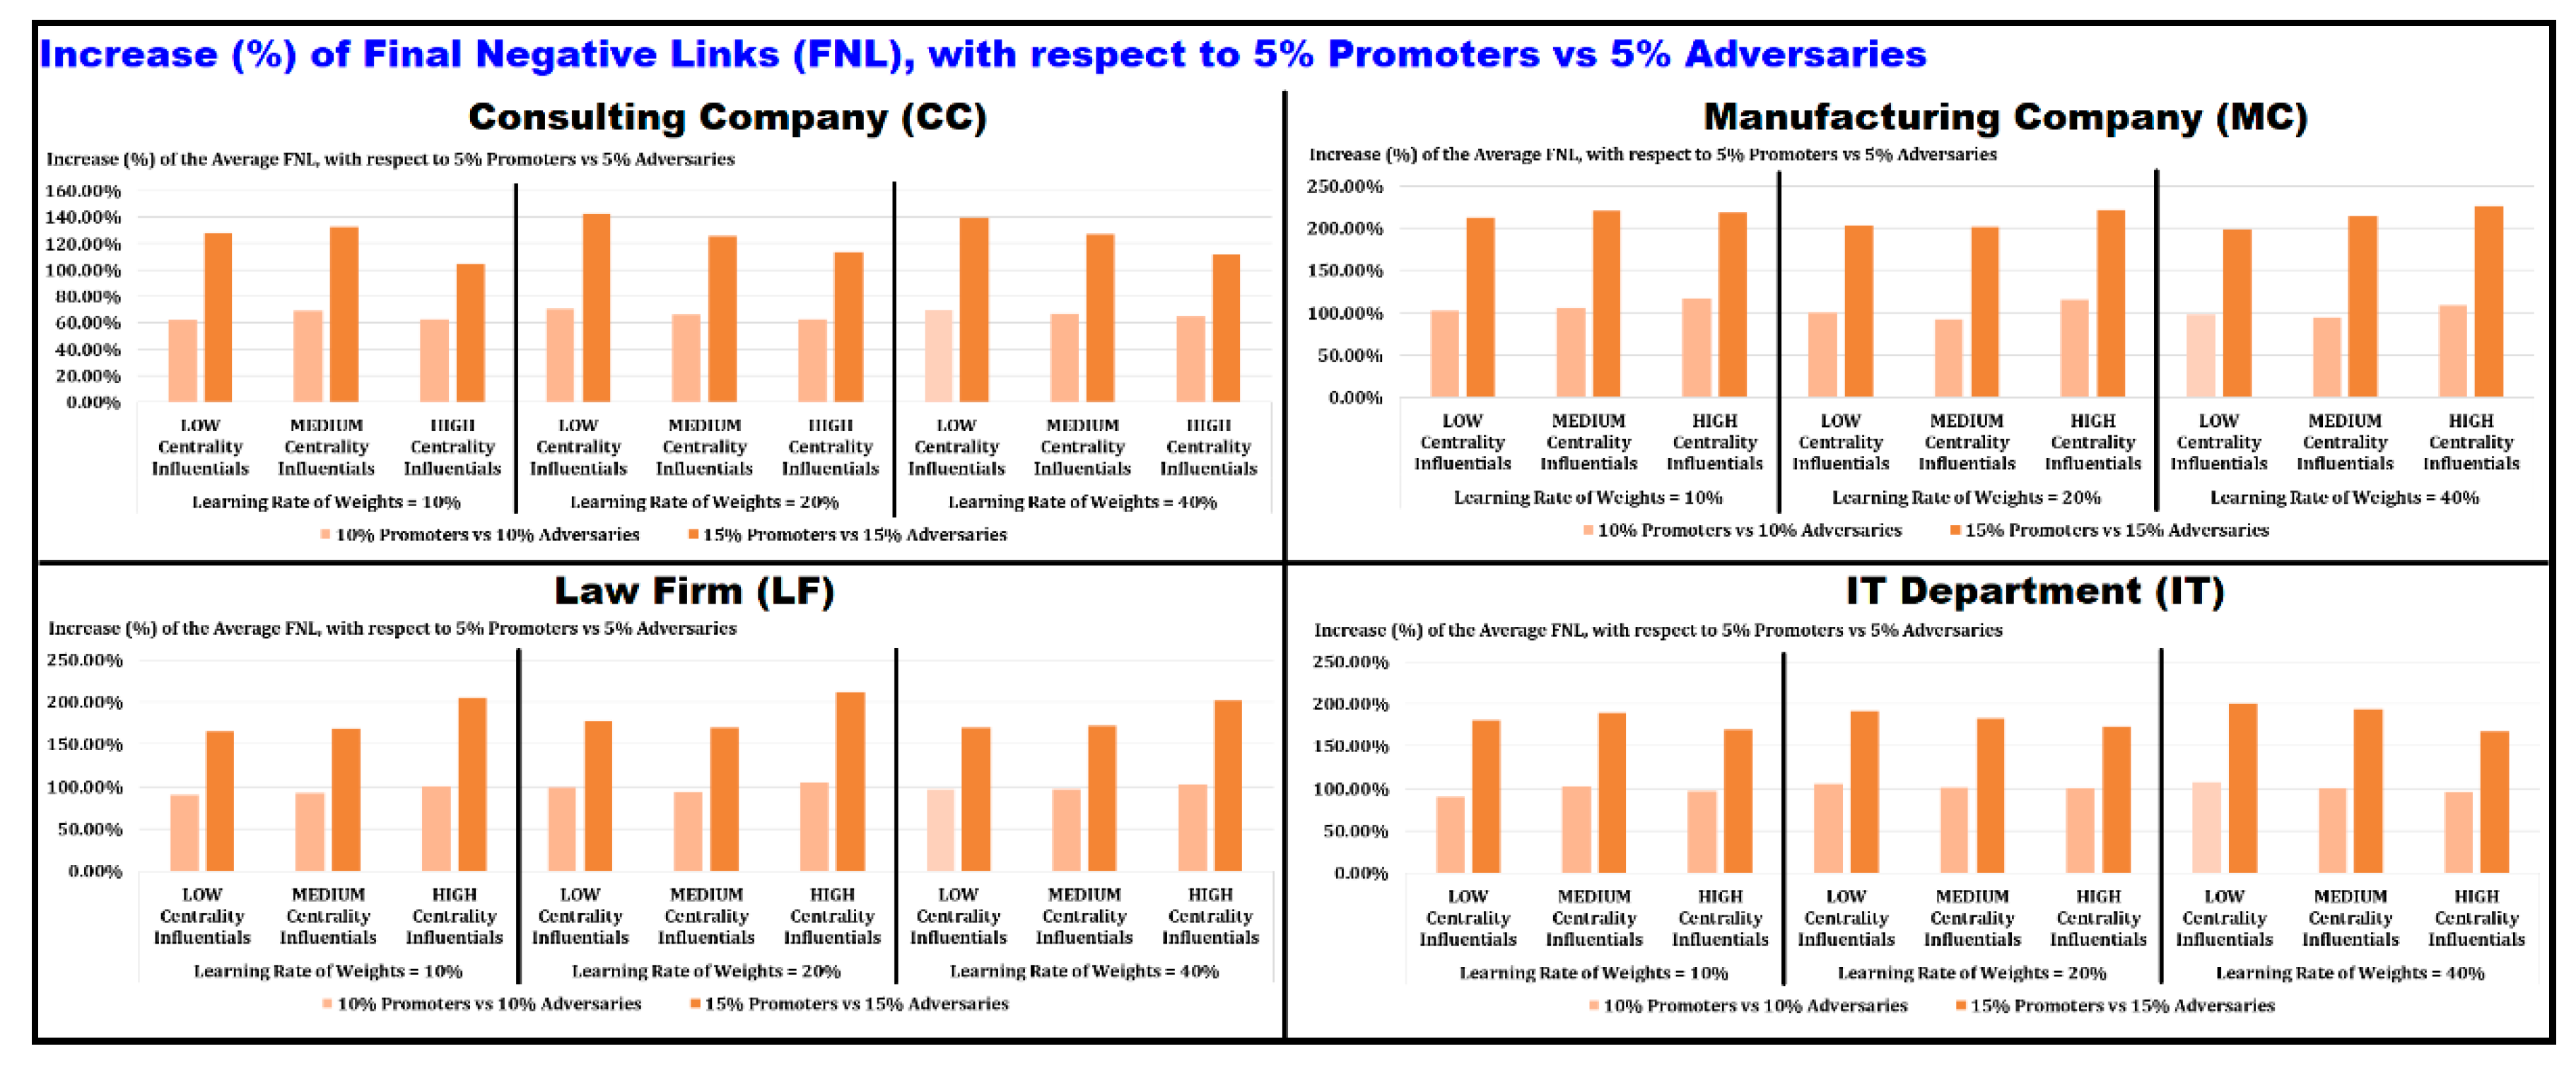
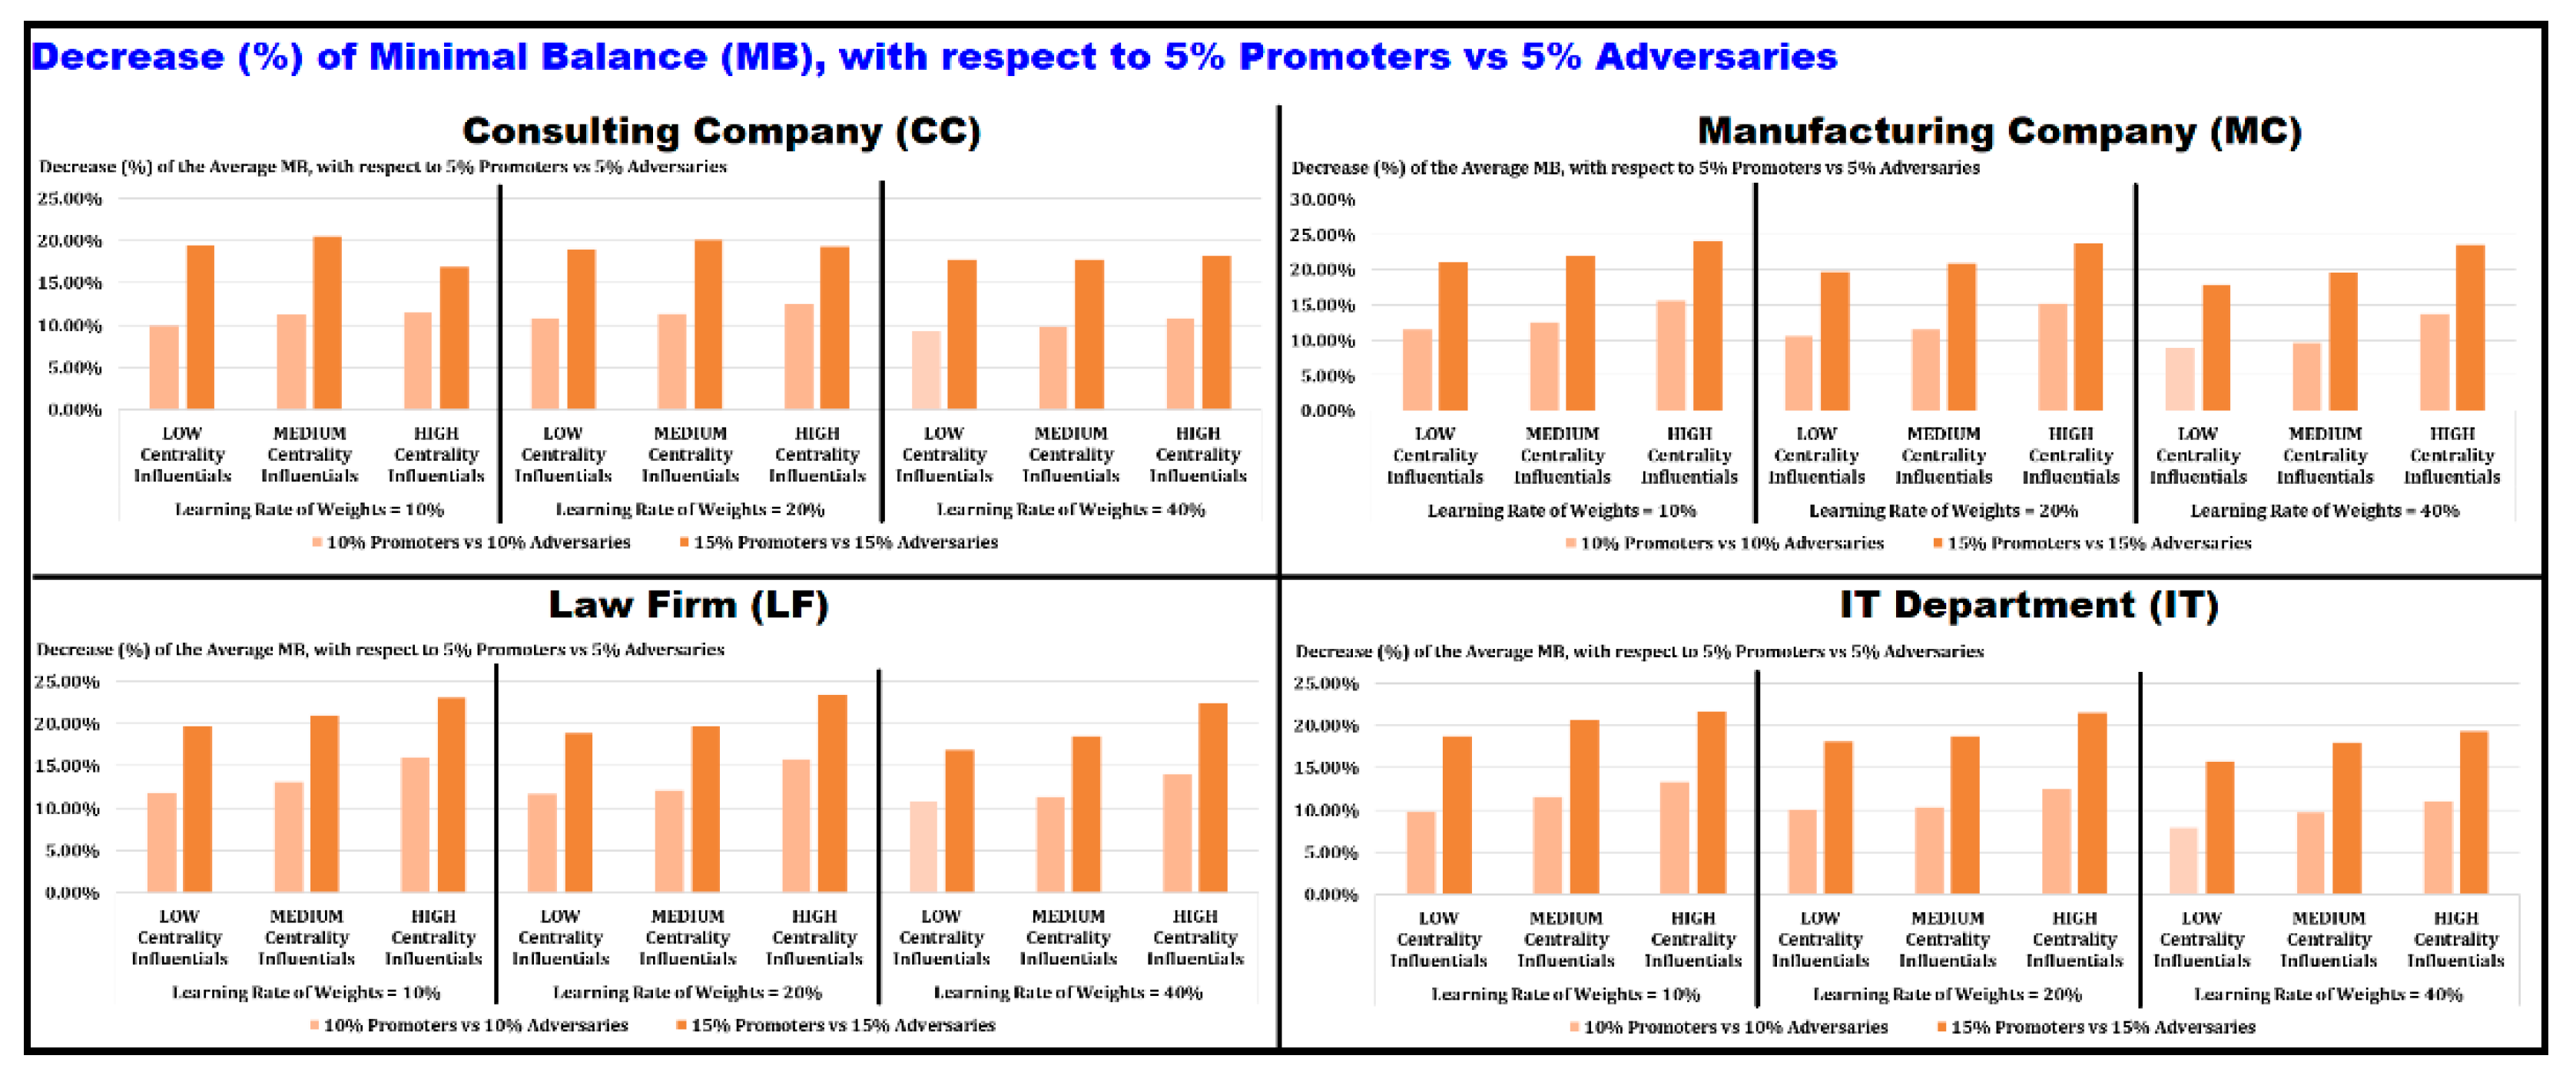
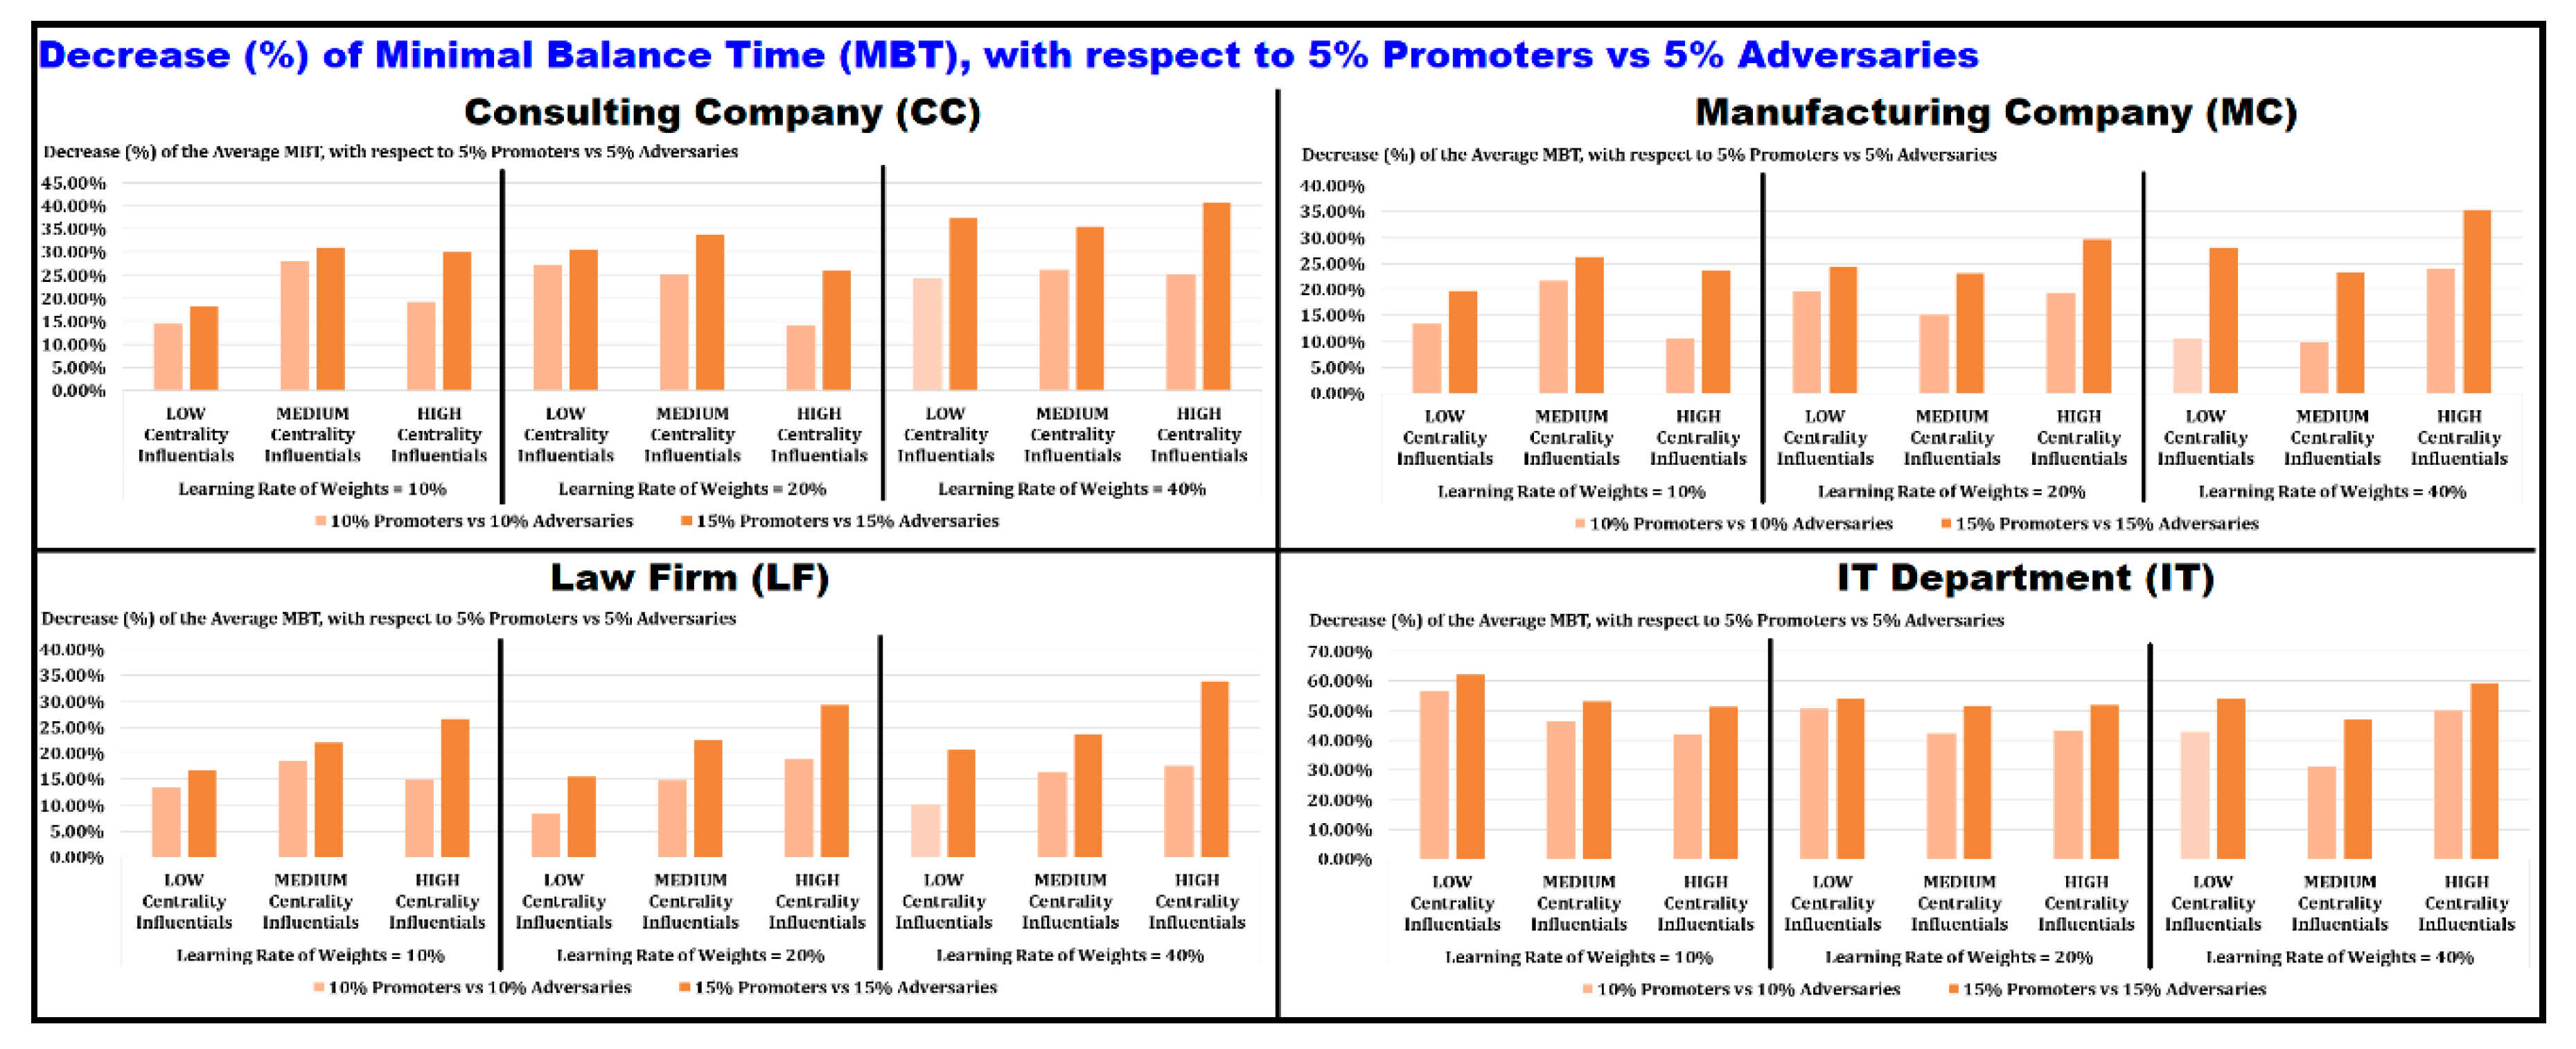
As the number of promoters and adversaries increases (Q3), the Minimal Balance and the Minimal Balance Time decrease. For Balance Time we observe a mixed picture: for the MC and LF networks the Balance Time is increasing, while for CC and IT networks there is no clear pattern of change. The Final Positive Links decrease while the Final Negative Links increase. If the number of promoters and adversaries keeps increasing, it is possible that the Final Negative Links become higher than the Final Positive Links. However, this has no impact on the re-establishment of balance. More specifically: once balance is re-established, it remains stable (see Supplementary Material SM V).
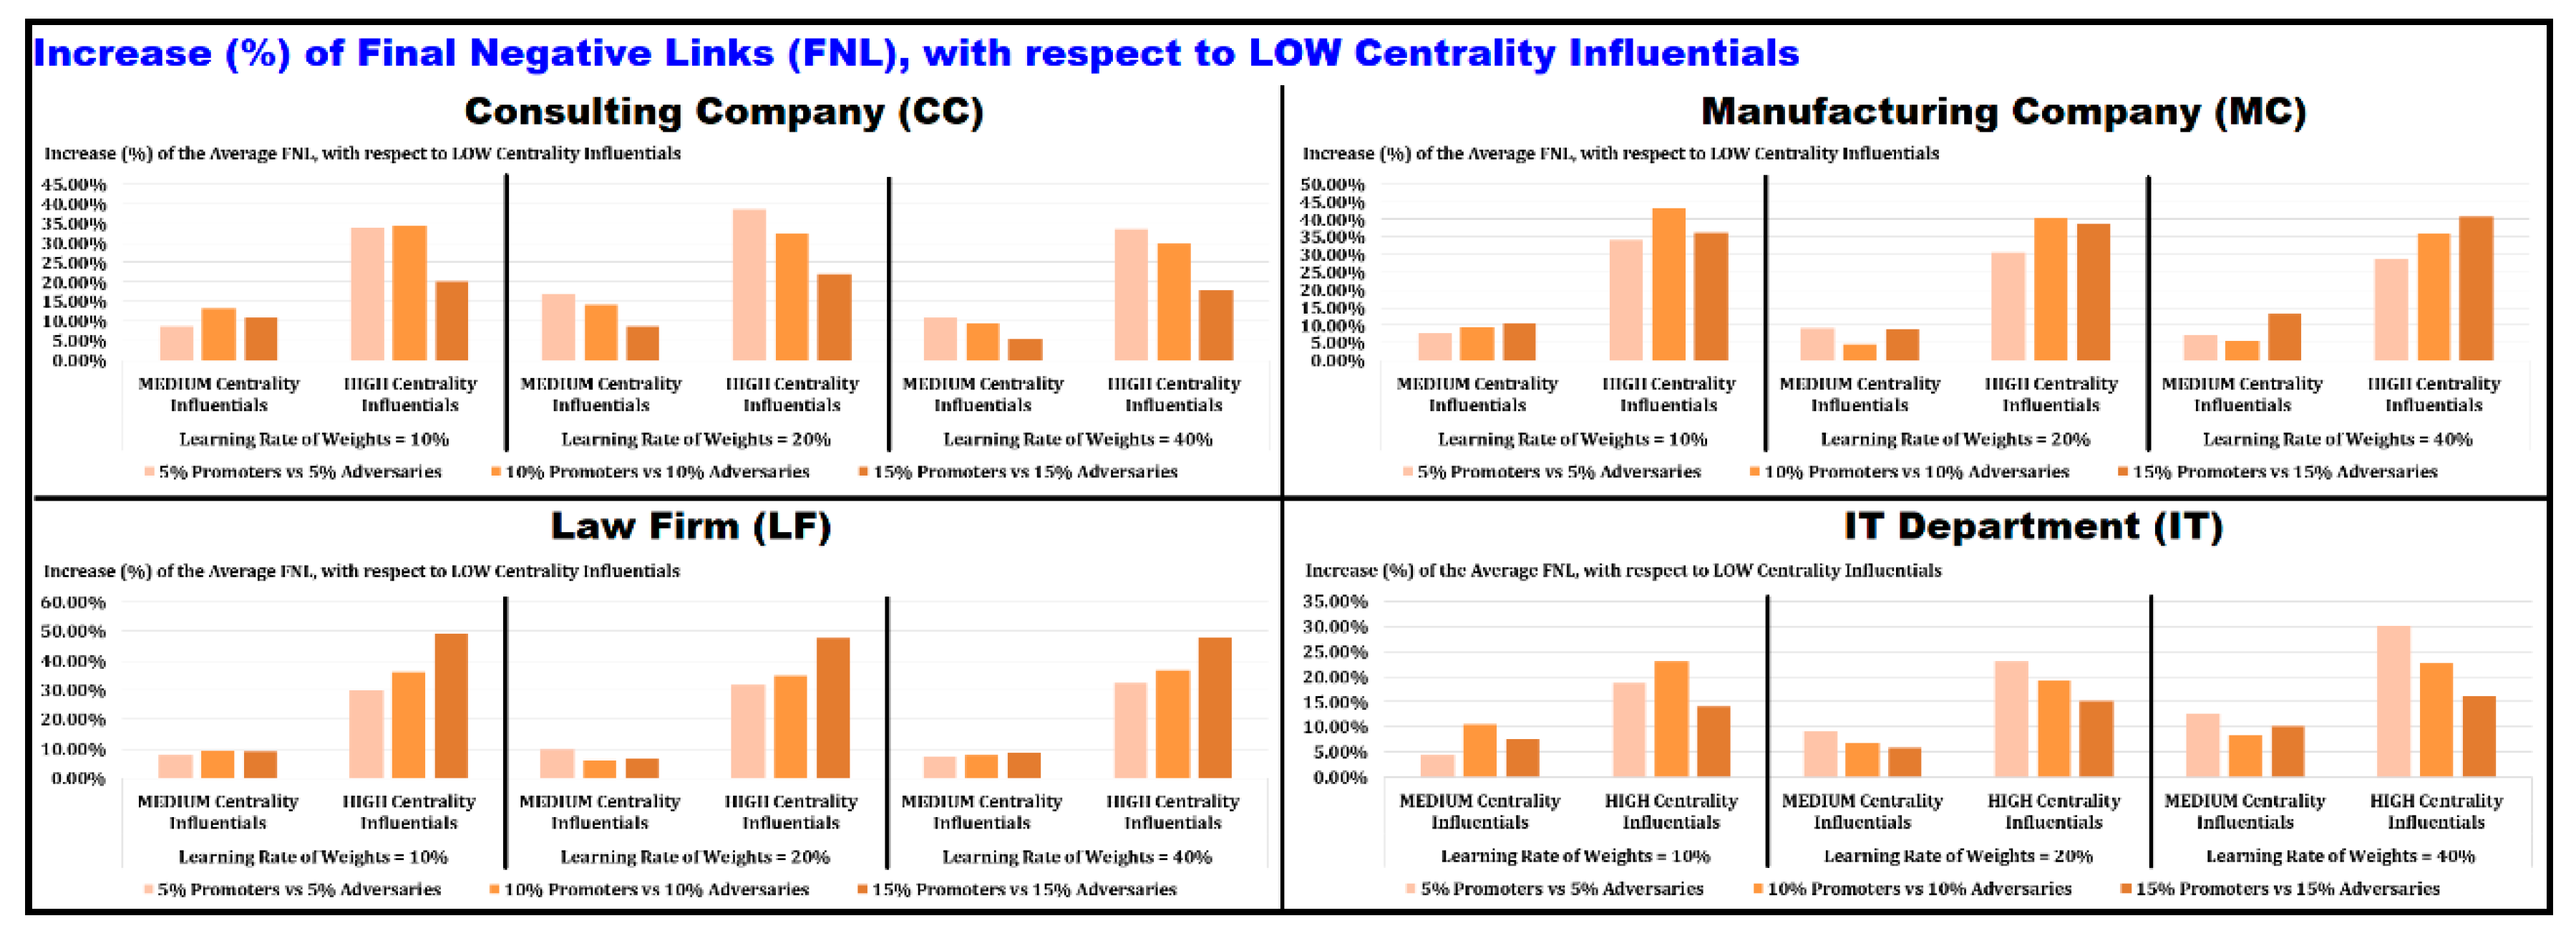
(b)
As the centrality of promoters and adversaries increases (Q4), the Minimal Balance decreases, while the Minimal Balance Time and the Balance Time have no clear pattern of change. The Final Positive Links decrease while the Final Negative Links increase.
(c)
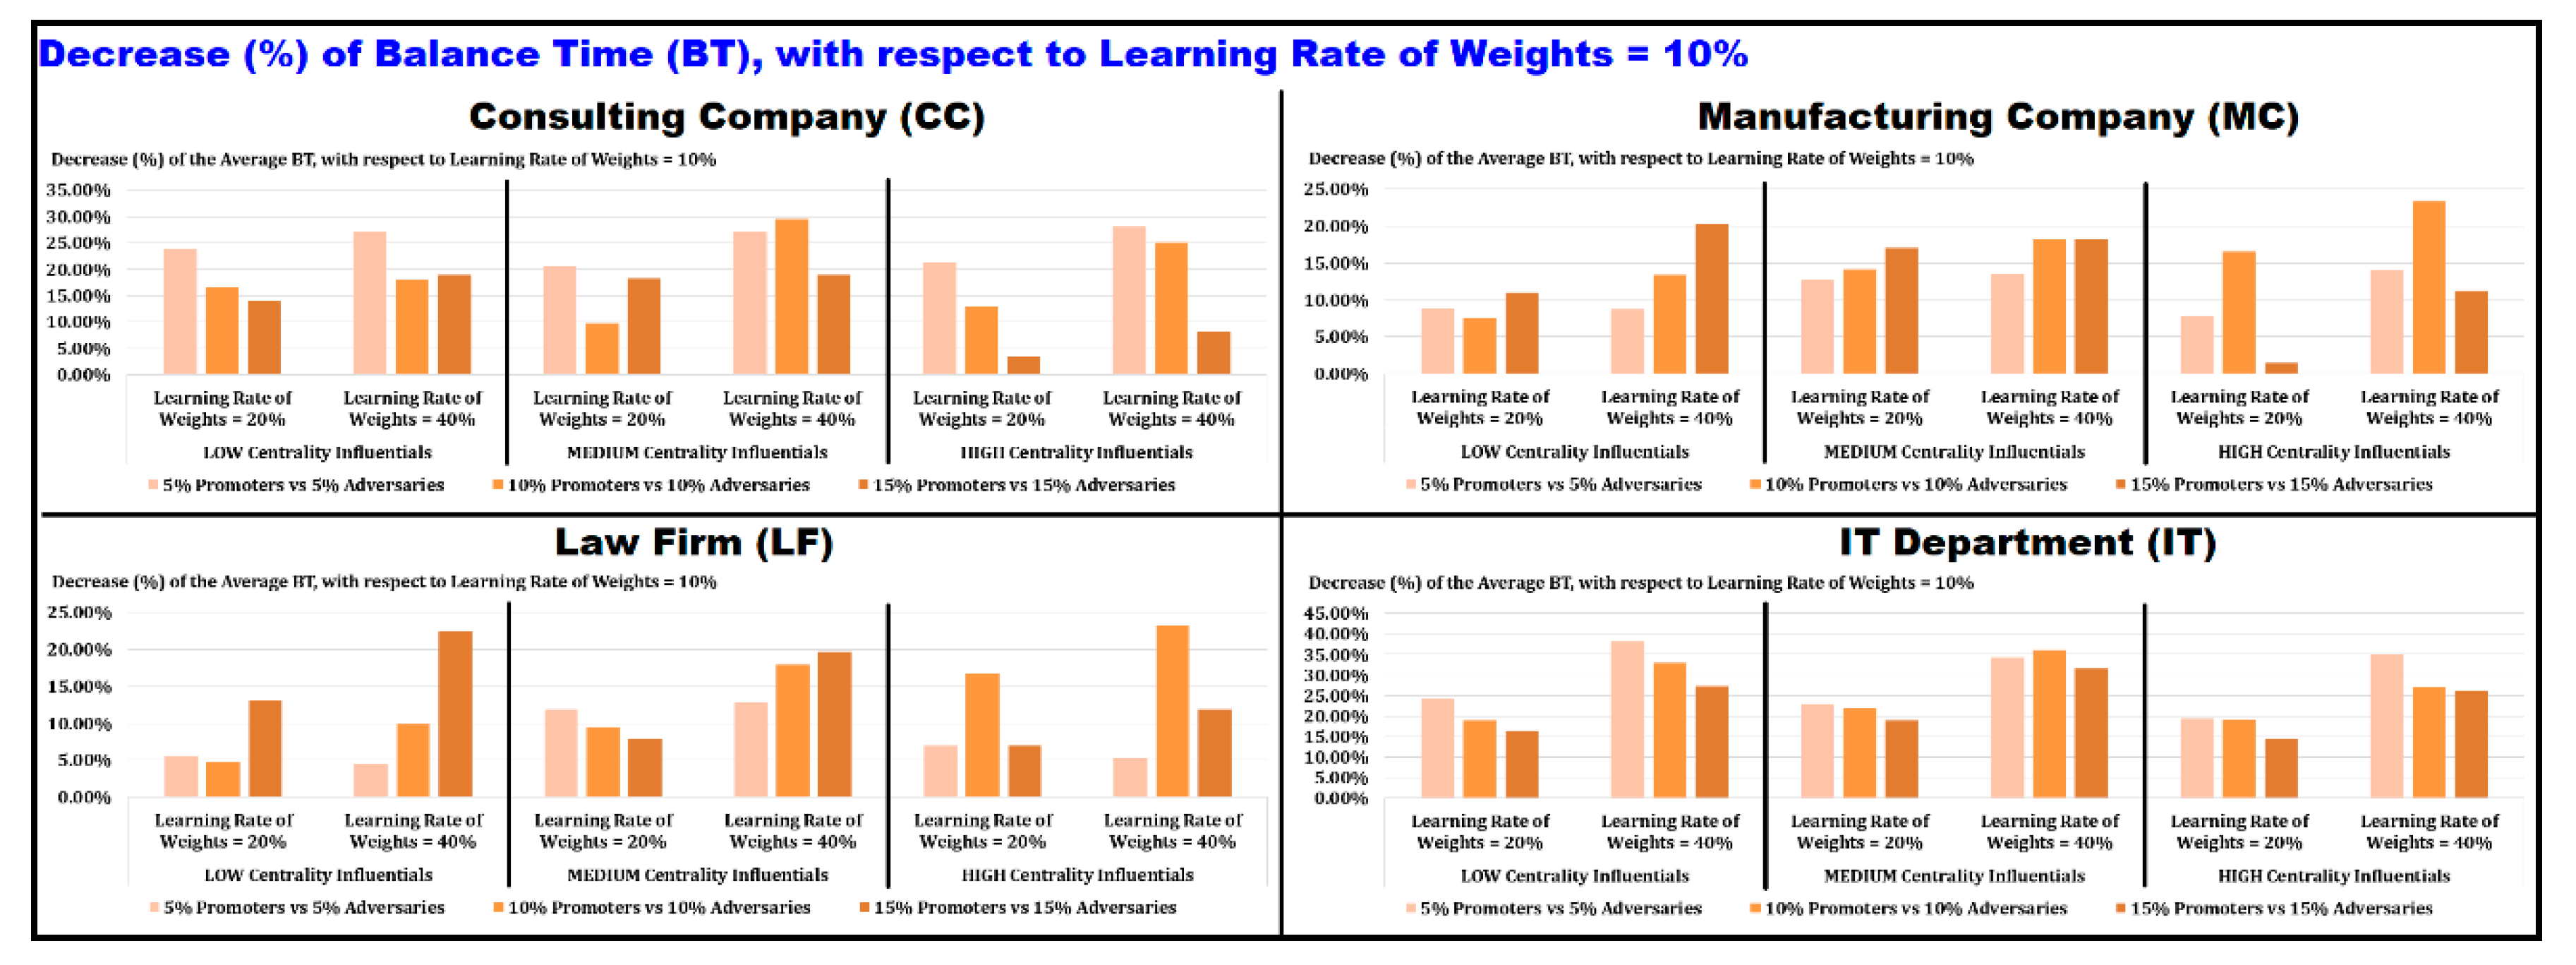
As the learning rate increases (Q5), the Minimal Balance increases, the Balance Time decreases, while for the Minimal Balance Time there is no clear pattern of change. The impact on the Final Positive Links and on the Final Negative Links is negligible.
The dynamics of Signed Links is illustrated further in terms of bar charts indicating:
The relative increase (%) of Final Negative Links, as the number of promoters and adversaries increases (Figure 6). The relative increase (%) of Final Negative Links, as the centrality of promoters and adversaries increases (Figure 7).
The dynamics of Balance is illustrated further in terms of bar charts indicating: The relative decrease (%) of Minimal Balance, as the number of promoters and adversaries increases (Figure 8). The relative decrease (%) of Minimal Balance Time, as the number of promoters and adversaries increases (Figure 9). The relative decrease (%) of Balance Time, as the learning rate increases (Figure 10).
Remark 8.
The number of promoters and adversaries has the strongest impact on the dynamics of Singed Links and Balance.
The number of promoters and adversaries (Q3) has the strongest impact on the dynamics of signed links and balance, compared to the impact of the position of promoters and adversaries (Q4) and the learning rate (Q5). This finding is observed in Figs. 6-7 as well as in more detail in the Supplementary Material SM IV.
Remark 9.
Increasing the learning rate of weights results in faster re-establishment of Balance.
In order to re-establish balance faster, after the emergence of negative weights (Remarks 4 and 5), the learning rate of the agents should be increased (Figure 10). In this perspective, societies with low learning rates may experience longer durations of structural imbalance.

6. Conclusions

The development of “new mathematical formalisms for the co-evolutionary dynamics of states and interactions” has been identified by Thurner, Hanel, and Klimek as one of the key directions of future research in the theory of complex systems (Chapter 7 of [107]). In this direction, we have modeled and explored the co-evolution of interpersonal ties and attitudes in organizational networks in the presence of conflict, in terms of the Ties-Attitudes co-evolution Equations ( 1 ) and ( 3 ) . We extended the initial analysis, restricted to one spreading process taking place in a “frozen” (static) network [10,11,13,14,15,16,17,18,20,26], in two ways. Firstly, we considered two competing groups of influential agents (the “promoters” versus the “adversaries” of change) operating concurrently within the same organizational network. Secondly, we formulated the co-evolution of attitudes and network structure at the local microscopic level of agent-to-agent interaction. The model describes the “structural plasticity” of the network as a “learning mechanism” (weight updates depend on the previous values of both weights and attitudes). As a result, co-evolution is intrinsic/endogenous. The simultaneous update of attributes and weights, at the local microscopic level, is a key distinction of our model with other agent-based models of network co-evolution, where the updates of attributes and weights, are not realized simultaneously.
We simulated representative scenarios of conflict (solutions of the Ties-Attitudes co-evolution Equations ( 1 ) and ( 3 ) ) in 4 real organizational networks. The co-existence of promoters and adversaries leads to the following remarkable effects:

6.1. Emergence of Attitude Polarization or Attitude Domination (Remark 3)

The co-existence of promoters and adversaries in the co-evolving network may drive the network to two kinds of equilibria: either polarization of attitudes (all agents eventually adopt extreme attitudes) or domination of one attitude. The dominant group appears to emerge randomly. The investigation of scenarios and mechanisms of domination for different percentages of promoters and adversaries, equal or not, should also involve detailed analysis of centralities of promoters and adversaries, which goes beyond the scope of this first exploratory work.

6.2. Intrinsic Emergence of Negative Links, Even Absent Initially (Remark 4)

Although initially all agents are positively linked, negative links are emerging, reaching eventually a maximum value (blue horizontal lines in Figure 5). The emergence of negative weights is due to the feedbacks on weight updates (Remark 1). The dynamics of both positive and negative links are symmetric and monotonic. The role of negative relationships and conflict in organizational networks has already been highlighted [108,109,110,111] and moreover, it has recently advanced to multiplex conflict relationships [112].

6.3. Self-Organization of Balance in Directed Signed Networks (Remark 5)

As negative links emerge, network balance decreases rapidly up to a minimal value and afterwards, a “new” balance including both positive and negative links is eventually re-established. The macroscopic emergence of balance due to microscopic local agent-to-agent interactions is an example of “micro-macro link”. Self-organization manifests because negative links emerge, until balance of signed directed triangles is re-established. This re-establishment of balance may be seen as learning of the social network. In order to formulate structural balance in directed networks, we extended Heider’s definition of balance considering directed triangles (Section 4).

6.4. Balance Emerges Concurrently with Polarization or Domination (Remark 6)

The initial balanced network of same-minded and positively linked agents evolves to a “new” balanced network where same-minded agents are positively-linked and different-minded agents are negatively-linked. This “new” balance emerges concurrently with polarization or domination of attitudes.

6.5. The Impact of Conditioning Factors (Remarks 8 and 9)

The number of promoters and adversaries has the strongest impact on the dynamics of signed links and balance, compared to the impact of the position of promoters and adversaries and the learning rate of weights (Remark 8). For a fixed number and positions of promoters and adversaries, increasing the learning rate of weights results in faster re-establishment of balance in the system (Remark 9).
Plan and Simulate Intentional “Divide and Rule” Scenarios
The proposed network co-evolution model (ties-attitudes co-evolution model ( 1 ) and ( 3 ) ) allows to design control scenarios involving conflict. For example, the planning and simulation of slow or fast re-establishment of balance, or the intentional emergence of structural split and polarization. The action of promoters and adversaries resembles the action of driver nodes [105] for network control.

Supplementary Materials

The following are available online at https://www.mdpi.com/2227-7390/8/12/2235/s1, SM I: Weights of the 4 Real Organizational Networks, SM II: Figures of AD, CAD, SLD, BD, SM III: Spreadsheets of FPL, FNL, MB, MBT, BT, SM IV: Figures of FPL, FNL, MB, MBT, BT, SM V: Figures for 20% vs. 20% and 25% vs. 25%.

Author Contributions

Conceptualization, E.I., N.V., and I.A.; methodology, E.I., N.V., and I.A.; software, E.I., N.V., and I.A.; validation, E.I., N.V., and I.A.; formal analysis, E.I., N.V., and I.A.; investigation, E.I., N.V., and I.A.; resources, E.I., N.V., and I.A.; data curation, E.I., N.V., and I.A.; writing—original draft preparation, E.I., N.V., and I.A.; writing—review and editing, E.I., N.V., and I.A.; visualization, E.I., N.V., and I.A.; supervision, E.I., N.V., and I.A.; project administration, E.I., N.V., and I.A. All authors have read and agreed to the published version of the manuscript.

Funding

This research received no external funding.

Acknowledgments

Results presented in this work have been produced using the AUTH Compute Infrastructure and Resources. We appreciate the highly efficient technical support for the computations by the members of the Scientific Computing Office (IT AUTH).

Conflicts of Interest

The authors declare no conflict of interest.

References

  1. Galam, S. Sociophysics: A personal testimony. Phys. A Stat. Mech. Its Appl. 2004, 336, 49–55. [Google Scholar] [CrossRef] [Green Version]
  2. Castellano, C.; Fortunato, S.; Loreto, V. Statistical physics of social dynamics. Rev. Mod. Phys. 2009, 81, 591–646. [Google Scholar] [CrossRef] [Green Version]
  3. Lorenz, J.; Rauhut, H.; Schweitzer, F.; Helbing, D. How social influence can undermine the wisdom of crowd effect. PNAS 2011, 108, 9020–9025. [Google Scholar] [CrossRef] [Green Version]
  4. Mavrodiev, P.; Tessone, C.; Schweitzer, F. Quantifying the effects of social influence. Sci. Rep. 2013, 31–36. [Google Scholar] [CrossRef] [Green Version]
  5. Schweitzer, F. Sociophysics. Phys. Today 2018, 71. [Google Scholar] [CrossRef] [Green Version]
  6. Clifford, P.; Sudbury, A. A model for spatial conflict. Biometrika 1973, 60, 581–588. [Google Scholar] [CrossRef]
  7. Holley, R.; Liggett, T. Ergodic Theorems for Weakly Interacting Infinite Systems and the Voter Model. Ann. Probab. 1975, 3, 643–663. Available online: http://www.jstor.org/stable/2959329 (accessed on 20 November 2020). [CrossRef]
  8. Galam, S. Minority opinion spreading in random geometry. Eur. Phys. J. B 2002, 25, 403–406. [Google Scholar] [CrossRef] [Green Version]
  9. Castelló, X.; Eguíluz, V.; Miguel, M. Ordering dynamics with two non-excluding options: Bilingualism in language competition. New J. Phys. 2006, 8, 308. [Google Scholar] [CrossRef]
  10. Deffuant, G.; Neau, D.; Amblard, F.; Weisbuch, G. Mixing Beliefs among Interacting Agents. Adv. Complex Syst. 2000, 3, 87–98. [Google Scholar] [CrossRef]
  11. Weisbuch, G.; Deffuant, G.; Amblard, F.; Nadal, J.-P. Meet, Discuss, and Segregate! Complex 2002, 7, 55–63. [Google Scholar] [CrossRef] [Green Version]
  12. Hegselmann, R.; Krause, U. Opinion dynamics and bounded confidence models, analysis, and simulation. J. Artif. Soc. Soc. Simul. 2002, 5. Available online: http://jasss.soc.surrey.ac.uk/5/3/2.html (accessed on 20 November 2020).
  13. Deffuant, G.; Amblard, F.; Weisbuch, G.; Faure, T. How can extremism prevail? A study based on the relative agreement interaction model. J. Artif. Soc. Soc. Simul. 2002, 5. Available online: http://jasss.soc.surrey.ac.uk/5/4/1.html (accessed on 20 November 2020).
  14. Amblard, F.; Deffuant, G. The role of network topology on extremism propagation with the relative agreement opinion dynamics. Phys. A Stat. Mech. Its Appl. 2004, 343, 725–738. [Google Scholar] [CrossRef] [Green Version]
  15. Kurmyshev, E.; Juárez, H.; González-Silva, R. Dynamics of bounded confidence Opinion in heterogeneous Social Networks: Concord against partial antagonism. Phys. A Stat. Mech. Its Appl. 2011, 390, 2945–2955. [Google Scholar] [CrossRef] [Green Version]
  16. Jalili, M. Social Power and Opinion Formation in Complex Networks. Phys. A Stat. Mech. Its Appl. 2013, 392, 959–966. [Google Scholar] [CrossRef]
  17. Jalili, M. Effects of leaders and social power on opinion formation in complex networks. Simulation 2013, 89, 578–588. [Google Scholar] [CrossRef]
  18. Gandica, Y.; Castillo-Mussot, M.; Vázquez, G.; Rojas, S. Continuous opinion model in small-world directed networks. Phys. A Stat. Mech. Its Appl. 2010, 389, 5864–5870. [Google Scholar] [CrossRef] [Green Version]
  19. Qu, B.; Li, Q.; Havlin, S.; Stanley, E.; Wang, H. Nonconsensus opinion model on directed networks. Phys. Rev. E 2014, 90. [Google Scholar] [CrossRef] [Green Version]
  20. Martins, T.V.; Pineda, M.; Toral, R. Mass media and Repulsive interactions in continuous-opinion dynamics. EPL Europhys. Lett. 2010, 91. [Google Scholar] [CrossRef]
  21. Fan, P.; Wang, H.; Yu, W.; Li, P.; Hu, Y. Opinion Dynamics in Social Networks with Heterogeneous Relationships. J. Inf. Comput. Sci. 2014, 11, 1831–1841. [Google Scholar] [CrossRef]
  22. Quattrociocchi, W.; Caldarelli, G.; Scala, A. Opinion dynamics on interacting networks: Media competition and social. Sci. Rep. 2014, 4, 4938. [Google Scholar] [CrossRef] [Green Version]
  23. Fan, K.; Pedrycz, W. Emergence and spread of extremist opinions. Phys. A Stat. Mech. Its Appl. 2015, 436, 87–97. [Google Scholar] [CrossRef]
  24. Fan, K.; Pedrycz, W. Evolution of public opinions in closed societies influenced by broadcast media. Phys. A Stat. Mech. Its Appl. 2017, 472, 53–66. [Google Scholar] [CrossRef]
  25. Pineda, M.; Buendía, G. Mass media and heterogeneous bounds of confidence in continuous opinion dynamics. Phys. A Stat. Mech. Its Appl. 2015, 420, 73–84. [Google Scholar] [CrossRef] [Green Version]
  26. Weisbuch, G.; Deffuant, G.; Amblard, F. Persuasion Dynamics. Phys. A Stat. Mech. Its Appl. 2005, 353, 555–575. [Google Scholar] [CrossRef] [Green Version]
  27. Song, X.; Shi, W.; Tan, G.; Ma, Y. Multi-level tolerance opinion dynamics in military command and control networks. Phys. A Stat. Mech. Its Appl. 2015, 437, 322–332. [Google Scholar] [CrossRef]
  28. Jin, C.; Li, Y.; Jin, X. Political opinion formation: Initial opinion distribution and individual heterogeneity of tolerance. Phys. A Stat. Mech. Its Appl. 2017, 467, 257–266. [Google Scholar] [CrossRef]
  29. Jager, W.; Amblard, F. A Dynamical Perspective on Attitude Change. 2004. Available online: https://pdfs.semanticscholar.org/77f4/142ef3fd9bd33c96a5ef72391151c4a6b6c7.pdf (accessed on 20 November 2020).
  30. Ioannidis, E.; Varsakelis, N.; Antoniou, I. Change Agents and Internal Communications in Organizational Networks. Phys. A Stat. Mech. Its Appl. 2019, 528. [Google Scholar] [CrossRef]
  31. Kotter, J.; Schlesinger, L. Choosing Strategies for Change; Harvard Business Review: Cambridge, MA, USA, 2008. [Google Scholar]
  32. Antoniou, I.; Reeve, M.; Stenning, V. The Information Society as a Complex System. J. Univers. Comput. Sci. 2000, 6, 272–288. [Google Scholar] [CrossRef]
  33. Moreno, J. Who Shall Survive? A New Approach to the Problem of Human Interrelations; Nervous and Mental Disease Publishing: Washington, DC, USA, 1934. [Google Scholar]
  34. Brass, D. Being in the Right Place: A Structural Analysis of Individual Influence in an Organization. Adm. Sci. Q. 1984, 29, 518–539. [Google Scholar] [CrossRef]
  35. Brass, D.; Galaskiewicz, J.; Greve, H.; Tsai, W. Taking stock of networks and organizations: A multilevel perspective. Acad. Manag. J. 2004, 47, 795–817. [Google Scholar] [CrossRef] [Green Version]
  36. Borgatti, S.P.; Mehra, A.; Brass, D.J.; Labianca, G. Network Analysis in the Social Sciences. Science 2009, 323, 892–895. [Google Scholar] [CrossRef] [Green Version]
  37. Labianca, G.; Gray, B.; Brass, D. A Grounded Model of Organizational Schema Change During Empowerment. Organ. Sci. 2000, 11, 235–257. [Google Scholar] [CrossRef]
  38. Cross, R.; Parise, S.; Weiss, L. The role of networks in organizational change. Mckinsey Q. 2007. Available online: https://www.mckinsey.com/business-functions/organization/our-insights/the-role-of-networks-in-organizational-change (accessed on 20 November 2020).
  39. Johnson-Cramer, M.; Parise, S.; Cross, R. Managing Change Through Networks and Values. Calif. Manag. Rev. 2007, 49, 85–109. [Google Scholar] [CrossRef]
  40. Cross, R.; Ernst, C.; Pasmore, B. A bridge too far? How boundary spanning networks drive organizational change and effectiveness. Organ. Dyn. 2013, 42, 81–91. [Google Scholar] [CrossRef]
  41. Rogers, E.M. Diffusion of Innovations; Free Press: Hong Kong, China, 1962. [Google Scholar]
  42. Galavan, R.; Murray, J.; Markides, C. Strategy, Innovation, and Change: Challenges for Management; Oxford University Press: Oxford, UK, 2008. [Google Scholar]
  43. Dalton, N.; Benson, J. Innovation and Change in Japanese Human Resource Management. Asia Pac. J. Hum. Resour. 2002, 40, 345–362. [Google Scholar] [CrossRef]
  44. Kenny, J. Effective project management for strategic innovation and change in an organizational context. Proj. Manag. J. 2003, 34, 43–53. [Google Scholar] [CrossRef]
  45. Hegger, D.; Van Vliet, J.; Van Vliet, B. Niche Management and its Contribution to Regime Change: The Case of Innovation in Sanitation. Technol. Anal. Strateg. Manag. 2007, 19, 729–746. [Google Scholar] [CrossRef]
  46. Michaelis, B.; Stegmaier, R.; Sonntag, K. Affective Commitment to Change and Innovation Implementation Behavior: The Role of Charismatic Leadership and Employees’ Trust in Top Management. J. Chang. Manag. 2009, 9, 399–417. [Google Scholar] [CrossRef]
  47. Musteen, M.; Barker, V.; Baeten, V. The Influence of CEO Tenure and Attitude Toward Change on Organizational Approaches to Innovation. J. Appl. Behav. Sci. 2010, 46, 360–387. [Google Scholar] [CrossRef]
  48. Volberda, H.; Van Den Bosch, F.; Mihalache, O. Advancing Management Innovation: Synthesizing Processes, Levels of Analysis, and Change Agents. Organ. Stud. 2014, 35, 1245–1264. [Google Scholar] [CrossRef] [Green Version]
  49. Battilana, J.; Casciaro, T. Change Agents, Networks, and Institutions: A Contingency Theory of Organizational Change. Acad. Manag. J. 2012, 55, 381–398. [Google Scholar] [CrossRef] [Green Version]
  50. Afshar, M.; Asadpour, M. Opinion Formation by Informed Agents. J. Artif. Soc. Soc. Simul. 2010, 13. [Google Scholar] [CrossRef]
  51. AskariSichani, O.; Jalili, M. Influence maximization of informed agents in social networks. Appl. Math. Comput. 2015, 254, 229–239. [Google Scholar] [CrossRef]
  52. Fan, K.; Pedrycz, W. Opinion evolution influenced by informed agents. Phys. A Stat. Mech. Its Appl. 2016, 462, 431–441. [Google Scholar] [CrossRef]
  53. Cho, J.-H. Dynamics of Uncertain and Conflicting Opinions in Social Networks. IEEE Trans. Comput. Soc. Syst. 2018, 5, 518–531. [Google Scholar] [CrossRef]
  54. Török, J.; Iñiguez, G.; Yasseri, T.; Miguel, M.S.; Kaski, K.; Kertész, J. Opinions, Conflicts, and Consensus: Modeling Social Dynamics in a Collaborative Environment. Phys. Rev. Lett. 2013, 110, 8–12. [Google Scholar] [CrossRef] [Green Version]
  55. Li, Q.; Braunstein, L.; Havlin, S.; Stanley, E. Strategy of competition between two groups based on an inflexible contrarian opinion model. Phys. Rev. E 2011, 84, 6. [Google Scholar] [CrossRef] [Green Version]
  56. Khalil, N.; Toral, R. The noisy voter model under the influence of contrarians. Phys. A Stat. Mech. Its Appl. 2019, 515, 81–92. [Google Scholar] [CrossRef] [Green Version]
  57. Zimmermann, M.G.; Eguíluz, V.M.; Miguel, M.S. Coevolution of dynamical states and interactions in dynamic networks. Phys. Rev. E 2004, 69, 1–4. [Google Scholar] [CrossRef] [Green Version]
  58. Vazquez, F.; Eguíluz, V.M.; Miguel, M.S. Generic Absorbing Transition in Coevolution Dynamics. Phys. Rev. Lett. 2008, 100, 1–4. [Google Scholar] [CrossRef] [Green Version]
  59. Klimek, P.; Lambiotte, R.; Thurner, S. Opinion formation in laggard societies. EPL Europhys. Lett. 2008, 82, 1–5. [Google Scholar] [CrossRef] [Green Version]
  60. Biely, C.; Hanel, R.; Thurner, S. Socio-economical dynamics as a solvable spin system on co-evolving networks. Eur. Phys. J. B 2009, 67, 285–289. [Google Scholar] [CrossRef] [Green Version]
  61. Diakonova, M.; Eguíluz, V.M.; Miguel, M.S. Noise in coevolving networks. Phys. Rev. E 2015, 92, 1–15. [Google Scholar] [CrossRef] [Green Version]
  62. Klimek, P.; Diakonova, M.; Eguíluz, V.M.; Miguel, M.S.; Thurner, S. Dynamical origins of the community structure of an online multi-layer society. New J. Phys. 2016, 18, 1–10. [Google Scholar] [CrossRef] [Green Version]
  63. Min, B.; Miguel, M.S. Fragmentation transitions in a coevolving nonlinear voter model. Sci. Rep. 2017, 12864, 1–9. [Google Scholar] [CrossRef] [Green Version]
  64. Raducha, T.; Min, B.; Miguel, M.S. Coevolving nonlinear voter model with triadic closure. EPL Europhys. Lett. 2018, 124, 1–6. [Google Scholar] [CrossRef] [Green Version]
  65. Carro, A.; Toral, R.; Miguel, M.S. Coupled dynamics of node and link states in complex networks: A model for language competition. New J. Phys. 2016, 18, 113056. [Google Scholar] [CrossRef] [Green Version]
  66. Saeedian, M.; Miguel, M.S.; Toral, R. Absorbing phase transition in the coupled dynamics of node and link states in random networks. Sci. Rep. 2019, 9726, 9. [Google Scholar] [CrossRef]
  67. Machiavelli, N. The Prince; Antonio Blado: Rome, Italic, 1532. [Google Scholar]
  68. Vogel, T.; Wanke, M. Attitudes and Attitude Change, 2nd ed.; Psychology Press: London, UK, 2016. [Google Scholar]
  69. Jung, C. Collected Works of C.G. Jung, Volume 6: Psychological Types; Princeton University Press: Princeton, NJ, USA, 1971. [Google Scholar]
  70. Golbeck, J.; Hansen, D. A method for computing political preference among Twitter followers. Soc. Netw. 2014, 36, 177–184, Special Issue on Political Networks. [Google Scholar] [CrossRef]
  71. Gladstones, W.; Regan, M.; Lee, R. Division of Attention: The single-channel hypothesis revisited. Q. J. Exp. Psychol. Sect. A Hum. Exp. Psychol. 1989, 41, 1–17. [Google Scholar] [CrossRef]
  72. Pashler, H. Dual-Task Interference in Simple Tasks: Data and Theory. Psychol. Bull. 1994, 116, 220–244. [Google Scholar] [CrossRef]
  73. Indermühle, R.; Troche, S.; Rammsayer, T. Personality and the Psychological Refractory period: No Evidence for an Extraversion- or Intelligence-related effect. Can. J. Behav. Sci. Rev. Can. Des. Sci. Comport. 2011, 43, 214–221. [Google Scholar] [CrossRef]
  74. Hendrickx, J. Order preservation in a generalized version of Krause’s opinion dynamics model. Phys. A Stat. Mech. Its Appl. 2008, 387, 5255–5262. [Google Scholar] [CrossRef] [Green Version]
  75. Liang, H.; Yang, Y.; Wang, X. Opinion dynamics in networks with heterogeneous confidence and influence. Phys. A Stat. Mech. Its Appl. 2013, 392, 2248–2256. [Google Scholar] [CrossRef]
  76. Knuth, D. Two Notes on Notation. Am. Math. Mon. 1992, 99, 403–422. [Google Scholar] [CrossRef]
  77. McPherson, M.; Smith-Lovin, L.; Cook, J.M. Birds of a Feather: Homophily in Social Networks. Annu. Rev. Sociol. 2001, 27, 415–444. [Google Scholar] [CrossRef] [Green Version]
  78. Centola, D.; González-Avella, J.C.; Eguíluz, V.M.; Miguel, M.S. Homophily, Cultural Drift, and the Co-Evolution of Cultural Groups. J. Confl. Resolut. 2007, 51, 905–929. [Google Scholar] [CrossRef] [Green Version]
  79. Centola, D. The Social Origins of Networks and Diffusion. Am. J. Sociol. 2015, 120, 1295–1338. [Google Scholar] [CrossRef] [Green Version]
  80. Yap, J.; Harrigan, N. Why does everybody hate me? Balance, status, and homophily: The triumvirate of signed tie formation. Soc. Netw. 2015, 40, 103–122. [Google Scholar] [CrossRef]
  81. Walter, F.; Battiston, S.; Schweitzer, F. A Model of a Trust-based Recommendation System on a Social Network. Auton. Agents Multi-Agent Syst. 2008, 16, 57–74. [Google Scholar] [CrossRef] [Green Version]
  82. Labianca, G. Negative Ties in Organizational Networks. In Contemporary Perspectives on Organizational Social Networks (Research in the Sociology of Organizations, Volume 40); Emerald Group Publishing Limited: Bentley, UK, 2014; pp. 239–259. [Google Scholar] [CrossRef]
  83. Esmailian, P.; Abtahi, S.E.; Jalili, M. Mesoscopic analysis of online social networks: The role of negative ties. Phys. Rev. E 2014, 90, 042817-1–042817-11. [Google Scholar] [CrossRef] [Green Version]
  84. Ioannidis, E.; Varsakelis, N.; Antoniou, I. False Beliefs in Unreliable Knowledge Networks. Phys. A Stat. Mech. Its Appl. 2017, 470, 275–295. [Google Scholar] [CrossRef]
  85. Ioannidis, E.; Varsakelis, N.; Antoniou, I. Communication Policies in Knowledge Networks. Phys. A Stat. Mech. Its Appl. 2018, 492, 360–374. [Google Scholar] [CrossRef]
  86. Ioannidis, E.; Varsakelis, N.; Antoniou, I. Experts in Knowledge Networks: Central Positioning and Intelligent Selections. Phys. A Stat. Mech. Its Appl. 2018, 509, 890–905. [Google Scholar] [CrossRef]
  87. Luo, S.; Du, Y.; Liu, P.; Xuan, Z.; Wang, Y. A study on coevolutionary dynamics of knowledge diffusion and social network structure. Expert Syst. Appl. 2015, 42, 3619–3633. [Google Scholar] [CrossRef]
  88. Liu, J.-G.; Zhou, Q.; Guo, Q.; Yang, Z.-H.; Xie, F.; Han, J.-T. Knowledge diffusion of dynamical network in terms of interaction frequency. Sci. Rep. 2017, 7, 1–7. [Google Scholar] [CrossRef] [Green Version]
  89. Graupe, D. Principles of Artificial Neural Networks, 3rd ed.; World Scientific: Singapore, 2013. [Google Scholar]
  90. Hebb, D. The Organization of Behavior: A Neuropsychological Theory; John Wiley & Sons: Hoboken, NJ, USA, 1949. [Google Scholar]
  91. Szell, M.; Lambiotte, R.; Thurner, S. Multirelational organization of large-scale social networks in an online world. Proc. Natl. Acad. Sci. USA 2010, 107, 13636–13641. [Google Scholar] [CrossRef] [Green Version]
  92. Szell, M.; Thurner, S. Measuring social dynamics in a massive multiplayer online game. Soc. Netw. 2010, 32, 313–329. [Google Scholar] [CrossRef] [Green Version]
  93. Szell, M.; Thurner, S. Social dynamics in a large-scale online game. Adv. Complex Syst. 2012, 15, 1–18. [Google Scholar] [CrossRef] [Green Version]
  94. Sadilek, M.; Klimek, P.; Thurner, S. Asocial balance—How your friends determine your enemies: Understanding the co-evolution of friendship and enmity interactions in a virtual world. J. Comput. Soc. Sci. 2018, 1, 227–239. [Google Scholar] [CrossRef] [Green Version]
  95. Heider, F. Attitudes and Cognitive Organization. J. Psychol. 1946, 21, 107–112. [Google Scholar] [CrossRef]
  96. Heider, F. The Psychology of Interpersonal Relations; Lawrence Erlbaum Associates: Mahwah, NJ, USA, 1958. [Google Scholar]
  97. Harary, F. On the notion of balance of a signed graph. Mich. Math. J. 1953, 2, 143–146. [Google Scholar] [CrossRef]
  98. Cartwright, D.; Harary, F. Structural balance: A generalization of Heider’s theory. Psychol. Rev. 1956, 63, 277–293. [Google Scholar] [CrossRef] [Green Version]
  99. Rapoport, A. Mathematical Models of Social Interaction. In Handbook of Mathematical Psychology; John Wiley & Sons: Oxford, UK, 1963; pp. 493–580. Available online: https://archive.org/details/handbookofmathem017893mbp/page/n551 (accessed on 20 November 2020).
  100. Cross, R.; Parker, A. The Hidden Power of Social Networks: Understanding How Work Really Gets Done in Organizations; Harvard Business Press: Boston, MA, USA, 2004. [Google Scholar]
  101. Lazega, E. The Collegial Phenomenon: The Social Mechanisms of Cooperation Among Peers in a Corporate Law Partnership; Oxford University Press: Oxford, UK, 2001. [Google Scholar]
  102. L. C. Freeman Datasets-IT Department. 2020. Available online: http://moreno.ss.uci.edu/data.html#krebs (accessed on 20 November 2020).
  103. T. Opsahl Datasets. 2020. Available online: http://toreopsahl.com/datasets/#Cross_Parker (accessed on 20 November 2020).
  104. L. C. Freeman Datasets-Law Firm. 2020. Available online: http://moreno.ss.uci.edu/data.html#lazega (accessed on 20 November 2020).
  105. Liu, Y.-Y.; Slotine, J.-J.; Barabási, A.-L. Controllability of complex networks. Nature 2011, 473, 167–173. [Google Scholar] [CrossRef]
  106. Jalili, M.; Perc, M. Information cascades in complex networks. J. Complex Netw. 2017, 5, 665–693. [Google Scholar] [CrossRef]
  107. Thurner, S.; Hanel, R.; Klimek, P. Introduction to the Theory of Complex Systems; Oxford University Press: Oxford, UK, 2018. [Google Scholar]
  108. Labianca, G.; Brass, D.; Gray, B. Social Networks and Perceptions of Intergroup Conflict: The Role of Negative Relationships and Third Parties. Acad. Manag. J. 1998, 41, 55–67. [Google Scholar] [CrossRef]
  109. Joshi, A.; Labianca, G.; Caligiuri, P. Getting along long distance: Understanding conflict in a multinational team through network analysis. J. World Bus. 2002, 37, 277–284. [Google Scholar] [CrossRef]
  110. Labianca, G.; Brass, D. Exploring the Social Ledger: Negative Relationships and Negative Asymmetry in Social Networks in Organizations. Acad. Manag. Rev. 2006, 31, 596–614. [Google Scholar] [CrossRef] [Green Version]
  111. Marineau, J.; Labianca, G.; Kane, G. Direct and indirect negative ties and individual performance. Soc. Netw. 2016, 44, 238–252. [Google Scholar] [CrossRef] [Green Version]
  112. Marineau, J.; Hood, A.; Labianca, G. Multiplex Conflict: Examining the Effects of Overlapping Task and Relationship Conflict on Advice Seeking in Organizations. J. Bus. Psychol. 2018, 33, 595–610. [Google Scholar] [CrossRef]
Figure 1. Local mechanism for interdependent co-evolution of weights and attitudes for each agent κ , κ = 1 , 2 , , Ν , at each time t = 0 , 1 , 2 , Co-evolution is interdependent because at each step, the change of attitudes depends on the value of the attitudes and the value of the weights, as well as the change of the weights depends on the value of the attitudes and the value of the weights. Both changes are simultaneous.
Mathematics 08 02235 g001
Figure 2. (a) Attitude diagrams for the 4 real organizational networks. Both promoters and adversaries have high centrality and the learning rate is 40% (Table 3). The Supporters, Neutrals, and Opponents are represented in the upper, middle and lower lanes, defined by the accepted deviation δ = 0.5 which is indicated by the two blue horizontal lines. The number of promoters versus adversaries is 10% versus 10%. Polarization emerges for 10% versus 10% or higher 15% versus 15% (see Supplementary Material SM II). (b) Attitude Diagrams for the 4 real organizational networks. Both promoters and adversaries have high centrality and the learning rate is 40% (Table 3). The Supporters, Neutrals, and Opponents are represented in the upper, middle and lower lanes, defined by the accepted deviation δ = 0.5 which is indicated by the two blue horizontal lines. The number of promoters versus adversaries is 5% versus 5%. In all cases one of the two groups dominates. Promoters dominate completely for the CC and the MC networks and partially for the IT network. Adversaries dominate the LF network. The dominant group appears to emerge randomly.
Mathematics 08 02235 g002
Figure 3. (a) Change adoption diagrams for the 4 real organizational networks, corresponding to Figure 2a. (b) Change adoption diagrams for the 4 real organizational networks, corresponding to Figure 2b.
Mathematics 08 02235 g003
Figure 4. Signed Links Diagrams for the 4 real organizational networks. Both promoters and adversaries have high centrality and the learning rate is 40% (Table 3). The number of promoters versus adversaries is 10% versus 10%. The blue horizontal line indicates the percentage of Final Positive Links (FPL) . The red horizontal line indicates the percentage of Final Negative Links (FNL).
Mathematics 08 02235 g004
Figure 5. Balance Diagrams for the 4 real organizational networks, corresponding to Figure 4. The blue line indicates the minimal value of the Degree of Balance (Definition 9). This minimal value is called Minimal Balance (MB) . The green line indicates the time required for balance to take this minimal value. This time is called Minimal Balance Time (MBT) . The red line indicates the time required for the re-establishment of balance. This time is called Balance Time (BT).
Mathematics 08 02235 g005
Figure 6. Relative Increase (%) of Final Negative Links (blue horizontal lines in Figure 4) for the selected values of centrality and learning rate (Table 3). The increase of Final Negative Links when promoters and adversaries increase from 5% to 10% is indicated in the left column. The right column (darker) shows the increase when promoters and adversaries increase from 5% to 15%.
Mathematics 08 02235 g006
Figure 7. Relative Increase (%) of Final Negative Links (blue horizontal lines in Figure 4) for the selected values of learning rate and number of promoters and adversaries (Table 3). The increase of Final Negative Links when the position of promoters and adversaries changes from low centrality to medium centrality is indicated in the left triad of columns. The right triad of columns show the increase when the position of promoters and adversaries changes from low centrality to high centrality.
Mathematics 08 02235 g007
Figure 8. Relative Decrease (%) of Minimal Balance (blue lines in Figure 5) for the selected values of centrality and learning rate (Table 3). The decrease of Minimal Balance when promoters and adversaries increase from 5% to 10% is indicated in the left column. The right column (darker) shows the decrease when promoters and adversaries increase from 5% to 15%.
Mathematics 08 02235 g008
Figure 9. Relative Decrease (%) of Minimal Balance Time (green line in Figure 5) for the selected values of centrality and learning rate (Table 3). The decrease of Minimal Balance Time when promoters and adversaries increase from 5% to 10% is indicated in the left column. The right column (darker) shows the decrease when promoters and adversaries increase from 5% to 15%.
Mathematics 08 02235 g009
Figure 10. Relative Decrease (%) of Balance Time (red line in Figure 5) for the selected values of centrality and number of promoters and adversaries (Table 3). The decrease of Balance Time when learning rate increases from 10% to 20% is indicated in the left triad of columns. The right triad of columns shows the decrease when learning rate increases from 10% to 40%.
Mathematics 08 02235 g010
Table 1. Weight values and attitude change.
w λ κ ( t ) = 1 Perfect Attraction: Agent κ adopts fully the attitude of agent λ , as a result of positive influence by agent λ , through the communication channel λ κ , at time t .
0 < w λ κ ( t ) < 1 Attraction: Agent κ adopts partially the attitude of agent λ , as a result of positive influence by agent λ , through the communication channel λ κ , at time t .
w λ κ ( t ) = 0 No Influence: There is no (direct) influence from agent λ to agent κ , through a communication channel λ κ , at time t .
1 < w λ κ ( t ) < 0 Repulsion: Agent κ moves away from the attitude of agent λ , as a result of negative influence by agent λ , through the communication channel λ κ , at time t .
w λ κ ( t ) = 1 Perfect Repulsion: Agent κ moves totally away from the attitude of agent λ , as a result of negative influence by agent λ , through the communication channel λ κ , at time t .
Table 2. Balanced Directed Triangles, with respect to agent κ (two incoming links to agent κ), (a) having agent λ as “middle agent”. (b) having agent μ as “middle agent”.
(a)
Mathematics 08 02235 i001Directed Link
λ κ
Directed Link
μ λ
Directed Link
μ κ
Triangle Category
Mathematics 08 02235 i002 w λ κ ( t ) > 0 w μ λ ( t ) > 0 w μ κ ( t ) > 0 I
agent κ
perceives agent λ
as “friend”
agent λ
perceives agent μ
as “friend”
agent κ
perceives agent μ
as “friend”
my friend’s friend is my friend
Mathematics 08 02235 i003 w λ κ ( t ) > 0 w μ λ ( t ) < 0 w μ κ ( t ) < 0 II
agent κ
perceives agent λ
as “friend”
agent λ
perceives agent μ
as “enemy”
agent κ
perceives agent μ
as “enemy”
my friend’s enemy is my enemy
Mathematics 08 02235 i004 w λ κ ( t ) < 0 w μ λ ( t ) > 0 w μ κ ( t ) < 0 III
agent κ
perceives agent λ
as “enemy”
agent λ
perceives agent μ
as “friend”
agent κ
perceives agent μ
as “enemy”
my enemy’s friend is my enemy
Mathematics 08 02235 i005 w λ κ ( t ) < 0 w μ λ ( t ) < 0 w μ κ ( t ) > 0 IV
agent κ
perceives agent λ
as “enemy”
agent λ
perceives agent μ
as “enemy”
agent κ
perceives agent μ
as “friend”
my enemy’s enemy is my friend
(b)
Mathematics 08 02235 i006Directed Link
λ κ
Directed Link
λ μ
Directed Link
μ κ
Triangle Category
Mathematics 08 02235 i007 w λ κ ( t ) > 0 w λ μ ( t ) > 0 w μ κ ( t ) > 0 I
agent κ
perceives agent λ
as “friend”
agent μ
perceives agent λ
as “friend”
agent κ
perceives agent μ
as “friend”
my friend’s friend is my friend
Mathematics 08 02235 i008 w λ κ ( t ) > 0 w λ μ ( t ) < 0 w μ κ ( t ) < 0 II
agent κ
perceives agent λ
as “friend”
agent μ
perceives agent λ
as “enemy”
agent κ
perceives agent μ
as “enemy”
my friend’s enemy is my enemy
Mathematics 08 02235 i009 w λ κ ( t ) < 0 w λ μ ( t ) > 0 w μ κ ( t ) < 0 III
agent κ
perceives agent λ
as “enemy”
agent μ
perceives agent λ
as “friend”
agent κ
perceives agent μ
as “enemy”
my enemy’s friend is my enemy
Mathematics 08 02235 i010 w λ κ ( t ) < 0 w λ μ ( t ) < 0 w μ κ ( t ) > 0 IV
agent κ
perceives agent λ
as “enemy”
agent μ
perceives agent λ
as “enemy”
agent κ
perceives agent μ
as “friend”
my enemy’s enemy is my friend
Table 3. Simulations.
Real Organizational NetworkConsulting Company (CC)
Research Team of a Manufacturing Company (MC)
Partnership network of a Corporate Law Firm (LF)
IT Department of a Fortune 500 Company (IT)
Conditioning FactorPosition of Influential Agents
(Promoters and Adversaries)
Low Centrality
Medium Centrality
High Centrality
Number of Influential Agents
(Promoters versus Adversaries)
5% versus 5%
10% versus 10%
15% versus 15%
“Learning” Rate 10%
20%
40%
Table 4. Estimations for the Dynamics of Signed Links and Structural Balance.
Conditioning Factor
(Table 3)
Number of Promoters and Adversaries
(Q3)
Increase from 5% to 15%
Position of Promoters and Adversaries
(Q4)
Increase from Low to High centrality
Learning Rate
(Q5)
Increase from 10 % to 40 %
Final Positive Links
(Red lines in Figure 4)
Decrease
Supplementary Material
(SM IV, FPL Figure SM IV.1)
Decrease
Supplementary Material
(SM IV, FPL Figure SM IV.2)
Negligible Impact
Supplementary Material
(SM IV, FPL Figure SM IV.3)
Final Negative Links
(Blue lines in Figure 4)
Increase
(Figure 6)
and Supplementary Material
(SM IV, FNL Figure SM IV.4)
Increase
(Figure 7)
and Supplementary Material
(SM IV, FNL Figure SM IV.5)
Negligible Impact
Supplementary Material
(SM IV, FNL Figure SM IV.6)
Minimal Balance
(Blue line in Figure 5)
Decrease
(Figure 8)
and Supplementary Material
(SM IV, MB Figure SM IV.7)
Decrease
Supplementary Material
(SM IV, MB Figure SM IV.8)
Increase
Supplementary Material
(SM IV, MB Figure SM IV.9)
Minimal Balance Time
(Green line in Figure 5)
Decrease
(Figure 9)
and Supplementary Material
(SM IV, MBT Figure SM IV.10)
No Pattern of Change
Supplementary Material
(SM IV, MBT Figure SM IV.11)
No Pattern of Change
Supplementary Material
(SM IV, MBT Figure SM IV.12)
Balance Time
(Red line in Figure 5)
Increase
for MC, LF networks
Supplementary Material
(SM IV, BT Figure SM IV.13)
No Pattern of Change
Supplementary Material
(SM IV, BT Figure SM IV.14)
Decrease
(Figure 10)
and Supplementary Material
(SM IV, BT Figure SM IV.15)
No Pattern of Change
for CC, IT networks
Supplementary Material
(SM IV, BT Figure SM IV.13)
Publisher’s Note: MDPI stays neutral with regard to jurisdictional claims in published maps and institutional affiliations.

