1. Introduction
In 2017, with the aim of enhancing national competitive capacity and quality of life, driving the economic growth and supporting national sovereignty, Russia commenced the digital economy of the Russian Federation Program [
1], in 2018 reformatted as the Digital Economy of the Russian Federation National Program, which includes six federal projects: Regulation of the Digital Environment, Information Infrastructure, Human Resources for the Digital Economy, Information Security, Digital Technology and Digital Governance [
2]. The program offers a detailed roadmap with activities until the year 2024, which are designed to ensure Russia’s technology breakthrough and leadership among the world’s leading powers.
The end of 2019 and the beginning of 2020 were marked by the rapid aggravation of the COVID-19 pandemic caused by the spread of SARS-CoV-2. As a result, transformation of the existing system of economic relations has emerged as a particularly clear issue of the time. The online economy (in the Business to Consumer (B2C) sector) has shown rapid growth, which was possible only because it had a pre-existing foundation created by a framework of cross-cutting digital technology. At the same time, not all territories were equally prepared for this switch to the new format. Thus, both national priorities and the global agenda work to bring to the foreground the problem of identifying best local economy and technology practices in digitalization, which cannot be achieved without considering the indexes that describe the sector that is being analyzed. At the same time, there is a robust discussion regarding global players whose digitalization is measured by separate composite indices (ICT Development Index, IDI [
3]; Networked Readiness Index, NRI [
4]; E-Government Development Index, EGDI [
5]; Digital Economy and Society Index, DESI [
6]; International Digital Economy and Society Index, IDESI [
7]). V. G. Khalin and G. V. Chernova [
8] offer a rather detailed analysis of the approaches represented by the above indices. Yu. E. Khokhlov et al. expand this list by including alternative methodological approaches [
9], such as those used in the Digital Evolution Index, Global Cybersecurity Index and Global Connectivity Index.
The IDI is published annually by the International Telecommunication Union, a specialized United Nations agency. It consists of 11 statistical indicators grouped into three subindices (ICT access subindex; ICT use subindex; ICT skills subindex) that reflect accessibility, use of and skills in information and communications technology. Some of the key advantages of this composite index are its minimalism and the transparency of its methodology which does not rely on expert opinions and subjective assessments as its empirical basis. At the same time, some of its source data are only remotely relevant for the ICT development of territories; the first of all the elements used in the ICT skills subindex are: adult literacy rate, secondary gross enrolment ratio and tertiary gross enrolment ratio. Furthermore, the ICT access and use subindices make use of source data that are currently not directly connected to this concept—e.g., the number of telephone subscriptions. It should be noted that the IDI is a quite frequent reference used in international research practice [
10,
11,
12,
13,
14].
The NRI is published annually by the World Economic Forum in collaboration with European Institute of Business Administration (INSEAD). It reflects the readiness of individual countries to the widespread use of ICT for social and economic development and is based on 54 indicators that are grouped into 10 pillars, which are in turn grouped into four subindices. Its methodological flaws include the rather subjective method of nondimensionalization of its source data, meaning a lack of transparency in the score assignment mechanism and a significant number of individual indicators that are only indirectly relevant to the matters of ICT, as well as indicators used to calculate the pillars’ political and regulatory environment and business and innovation environment. Some of the indicators of the pillars directly focused on ICT (e.g., indicators that, similarly to those used in the IDI, reflect skills of the population and describe its general literacy, as opposed to ICT literacy: quality of educational system, secondary education gross enrollment rate, adult literacy rate, (%), etc.).
The EGDI is published by the United Nations Department of Economic and Social Affairs (UN DESA). It includes three subindices based on 13 indicators that characterize the status of the ICT infrastructure (Telecommunication Infrastructure Index—TII), human capital (Human Capital Index—HCI) and online public services (Online Service Index—OSI). At the same time, similar to the above indicators that are designed to evaluate knowledge and skills, the HCI fails to take into account the unique aspects of ICT skills and relies on indicators that describe education as a whole: adult literacy, gross enrolment ratio, expected years of schooling and mean years of schooling.
The DESI is a composite index that aggregates indicators reflecting the effectiveness of digital technology in Europe. It is used to track the evolution of digital competitiveness of the EU member states. The index is compiled to reflect the following fundamental directions: connectivity—broadband market developments in the EU; human capital—digital inclusion and skills; use of internet services; integration of digital technology; digital public services. In terms of its structure, the DESI is not a generalized measurement. It constantly transforms by incorporating new indicators. This indicates both the development of this assessment tool and the existence of a certain problem in achieving comparable values over time. Members of the scientific community have published their attempts to use the DESI to study the impact of ICT on economic development [
15], including on sustainable social development [
16].
The IDESI is designed to allow comparison of European countries with non-EU countries across the same indicators as those used in the DESI. The IDESI is calculated using the methodological basis of the DESI with some alterations due to the differences in source data collection for individual indicators. The IDESI and the DESI are not directly comparable. The IDESI scores and ratings of EU countries for individual indicators, subindices and generalized measures can be drastically different from the DESI scores and ratings, which is explained by a different calculation basis, among other factors.
Very few research works focus on identifying national or regional territorial disparities [
17,
18,
19,
20,
21,
22].
Thus, in [
17], a variant of calculating regional availability of the telecommunication infrastructure index in the territorial entities in Mexico is presented. The authors propose the calculation of the integral indicator based on 11 particular criteria. It should be noted that this list seems insufficient in terms of assessing the level of the digital economy development, although it touches upon important aspects of its infrastructural development. In addition, the only argument that determines the choice of those is the mention of them in the works of other researchers, which seem to be quite subjective.
Other works deal with the development of telecommunications infrastructure as an important prerequisite for the development of the digital economy at a meaningful level. So, in [
18], the key problems of the continuous development of the telecommunications ecosystem are disclosed with a forecast of the impact of certain technologies on regional development. It discusses infrastructure deployment, changing needs and uses of telecommunications systems and future technologies and examines the implications for regional research and policy on digitalization. At the same time, the proposed assessments are carried out at a qualitative level without the involvement of mathematical apparatus, which indicates the possible subjectivity of the result.
In [
19], the authors investigate the impact of telecommunications infrastructure on economic growth in Turkey. Telecommunications infrastructure as a parameter is added as an input to the production function. The results show that telecommunications infrastructure has a positive and significant impact on Turkey’s GDP. At the same time, the applicability of the proposed model for identifying intranational differentiations is not obvious. In addition, a complex concept such as “telecommunications infrastructure” is formalized through a single indicator—“provision of fixed and mobile communications per 100 people”, which does not take into account the multifaceted nature of the considered evaluation category.
Reference [
20] examines the contribution of digitalization to economic growth in sub-Saharan Africa (SSA) compared to the economies of Organisation for Economic Co-operation and Development (OECD) countries and analyzes the positive and negative consequences of digitalization in developing countries using a panel dataset for 74 countries and generalized linear methods of moments (GMM) estimates. It has been established that digitalization makes a positive contribution to economic growth in both groups of countries.
Part of the research on issues related to the development of the digital economy is based on the development of an econometric mathematical apparatus, characterized by an exclusive focus on specific datasets. Reference [
21] analyzes the impact of broadband on regional productivity in Brazil. The results show that the performance impact of broadband is positive, albeit uneven across regions. Faster download speeds and accounting for the critical mass of network externals increase the economic impact of broadband. Higher productivity gains were found in less developed regions. The research seems to be quite interesting, but localized in terms of the obtained values of the assessment parameters.
In [
22], it is concluded that the digital development of households and individuals in European regions is based on broadband Internet access. In this context, the level of digital development and the digital divide in European regions is based on the daily use of e-commerce, e-banking and e-government by households and individuals. However, the use of social media in broadband households shows a smaller digital divide in Europe. The values obtained from the Household and Individual Digital Development Index for each European region show that the maximum digital gap between them is 37%, and the analysis of spatial autocorrelation determines the NorthWest-SouthEast (NW-SE) model in Europe. Thus, the level of digital development of a region directly depends on the level of its neighbors, and geographic proximity/proximity is an element to consider when analyzing differences in the digital divide.
In Russia, the Moscow School of Management SKOLKOVO has developed a methodology for calculation of the Digital Russia Index for the federal entities of Russia [
23]. The methodology formalizes and provides justification for seven subindices (regulation and administrative indices of digitalization; specialized human resources and training programs; availability and development of research competencies and technology groundwork, including the level of research and development; information infrastructure; information security; economic indices of digitalization; social effect of digitalization) along with their weights, which, with the help of an additive model, produce the digitalization index value for each individual region. An undoubted advantage of the methodology is the rich and diverse content of the composite measure: its authors aimed to take into account a rather wide range of information that serves to describe regional digitalization processes in one way or another. Despite its overall transparency, this approach does have a number of weak points. Among them is the excessive reliance on expert judgements that reduce the overall objectification of data, and lack of adaptability that makes it impossible to use the methodology for other kinds of assessments. It should also be noted that the methodology often makes use of the methods of multidimensional statistical analysis to justify the links between specific indices and determine their weighting coefficients, but does not describe the procedures that would allow one to reproduce the results. In addition, it should be noted that the methodology is based on the qualimetric assessment of digitalization levels in the Russian economy that was proposed by A. V. Tebekin and is designed, as discussed in [
24], to provide assessment of the efficiency of the digital economy of the Russian Federation Program, and not of digitalization at large.
This paper proposes an approach that focuses on both objectification of assessment results, and on minimization of resources engaged in the procedure.
The authors’ logic proceeds from the following concept: description of the methodological approach underlying the assessment → formation of a specific model based on the described methodology → empirical part → discussion of the results and description of research development directions.
2. Methodology for Composite Assessment of Digitalization Levels
Most models that are used today to provide description and assessment of various life spheres are based on their graphic representation. The observed diversity of such spheres and the tools used to analyze them (e.g., neural network-based operational forest fire forecasting [
25], sustainability assessment of the economic development of individual federal districts using the methods of system dynamics and agent-based models [
26], semantic network-assisted content design for communication messages [
27], cognitive approach-based simulation of social and economic development of a region [
28], Petri net-based development of monitoring systems [
29], etc.) suggest the efficiency of associated research. Based on the above, the authors propose that the approach discussed in [
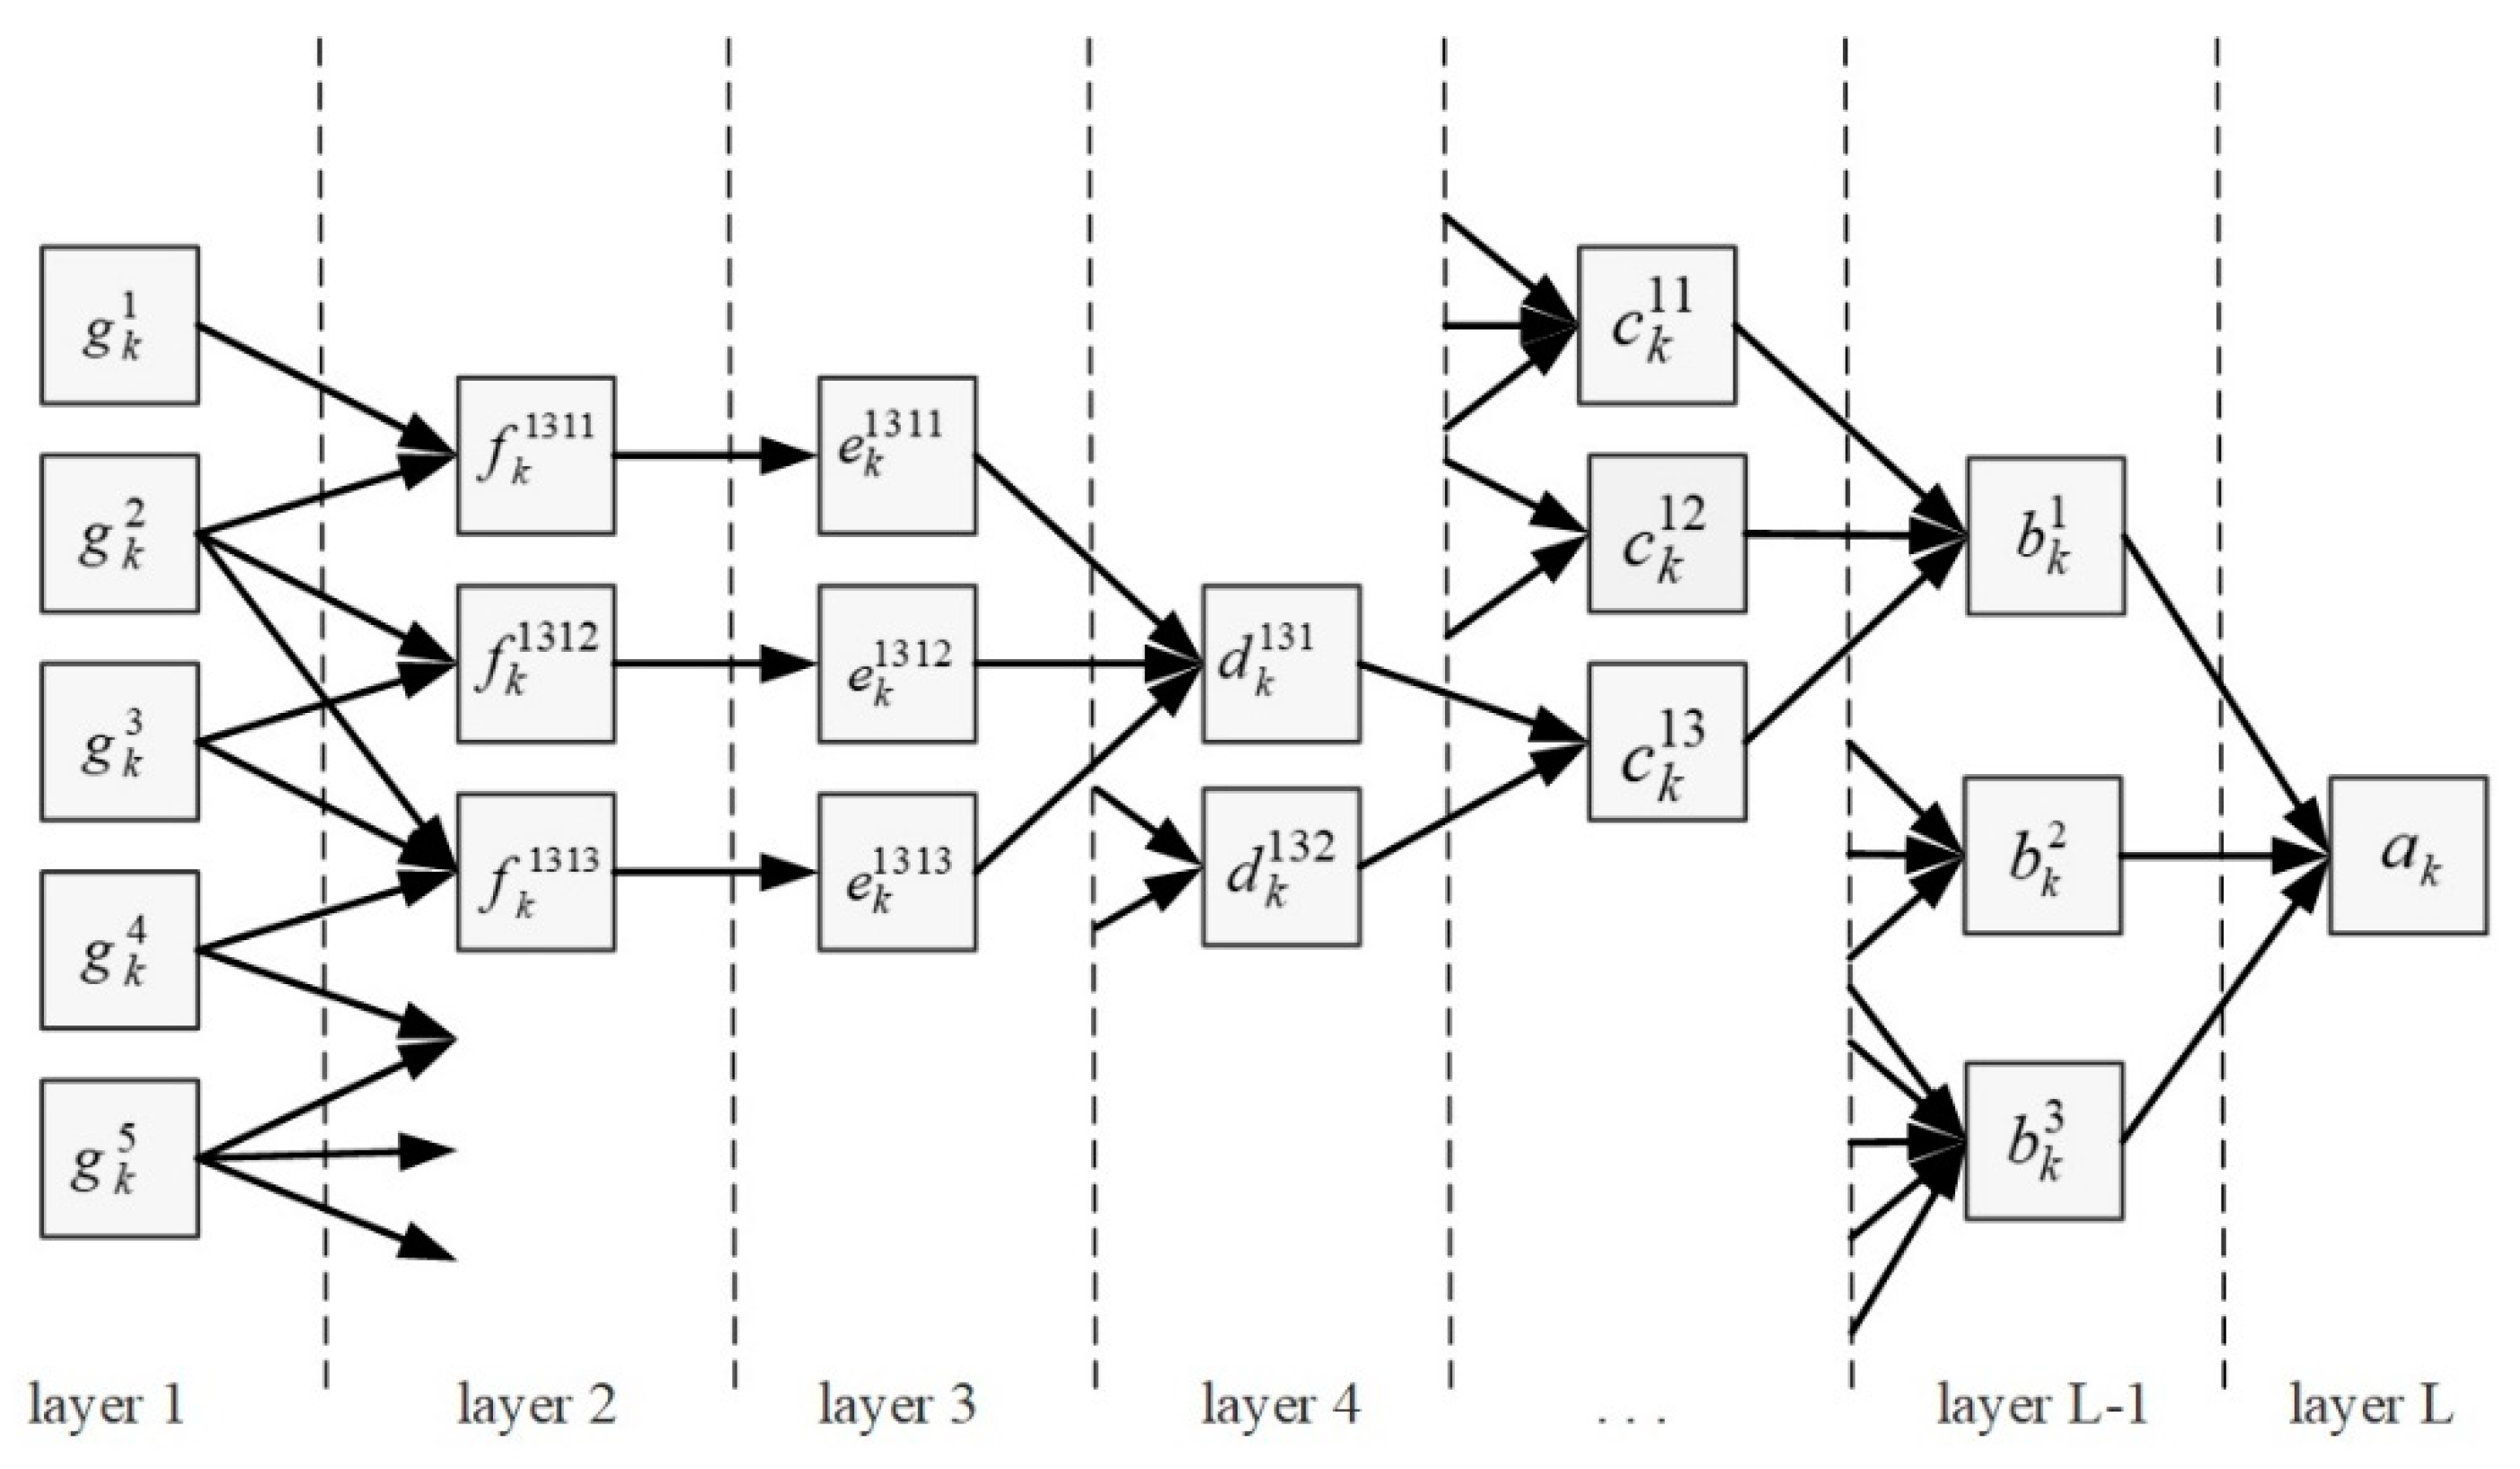
30] be used as the methodological framework for calculation of the generalized measure of regional digitalization. In order to calculate the composite assessment, a functional network is created with
layers/levels (
Figure 1): basic indices (layer 1); relative indices (layer 2); normalized indices (layer 3); composite subindices with various degrees of aggregation (based on components, subdirections, directions, etc.; layer 4—
); composite index (layer
).
Basic indices represented by absolute values that describe the various aspects of digitalization (layer 1) serve as the basis for composite assessment. They provide little insight through comparison, because they depend of a variety of characteristics that determine the scale of the objects being compared. In particular, one cannot make conclusions about Internet usage for access to state and municipal services based on the number of people using such services without checking it against the total population of a given territory; an accurate comparison of availability of ICT professionals for assessment of labor market balance can only be made through its correlation with the associated demand, etc. Therefore, it becomes necessary to rely on relative indices (layer 2). There is no single formula that is conventionally used to convert absolute values into relative values. In each case, it is necessary to factor in the nature of the index. In general terms, there are several approaches: to calculate ratios (percentages), determine availability, including availability per capita, calculate return per ruble invested, etc. It should be noted that quite often the source data underlying the composite assessment are represented by relative values, which to a certain extent simplifies both model-building and computations.
Since composite values are developed based on indices that are measured in different units and within different boundaries, it is necessary to apply normalization that would bring them to a common measurement scale. One of the most common methods used in practice is linear scaling. In this case, the simplest way to represent it is through conversion into numerical estimates in the range [; ]. As a rule, in practical research, the extent from 0 to 1 is considered.
If the higher value of the index corresponds to a higher level, i.e., the properties of a monotonically increasing function are manifested, the assessment is calculated with the following formula:
where
is a normalized value of the j-th index for the i-th object;
is the actual value of the j-th index for the i-th object;
n is the number of objects;
is the lower boundary of the normalization interval;
is the upper boundary of the normalization interval.
If the processes are interpreted using a monotonically decreasing function, conversion into a common scale is achieved with a different dependence:
The values of and
and are selected out of the existing or potential set of objects that are being assessed.
The normalized values of relative values are used to calculate composite subindices of various degrees of aggregation (layers 4 through
in
Figure 1). Without doubt, once made comparable, the source indices can be directly included in the generalized measure. At the same time, where there are many of such indices, it becomes increasingly difficult to prioritize them through comparison or ranking due to the limitations of human capabilities. As a response to this postulate, the functional network structure includes intermediate layers that additionally make it possible to increase the semantic load of individual elements of the aggregated index that can have independent values. Another argument in favor of this solution can be that any composite index characterizes any given object not as a mechanical summation of its attributes, but as a system that, in its turn, can consist of subsystems, each correlating with a specific composite subindex. Accordingly, development of the composite index structure must be preceded by a model of the object that is being assessed.
Aggregate estimates are calculated based on the additive convolution formula:
where
is the aggregated index;
is the weighting coefficient of the normalized value of either the source index or the composite subindex ();
is the value of the index from a lower hierarchical layer of the functional network.
In terms of their meaning, the values of weighting coefficients can be viewed as representing the weight of specific indices or composite subelements in the structure of the generalized measure. At the same time, we must agree with [
31], which states that the scope of this concept is not yet established in relation to calculation of the composite assessment value. For the purposes of this paper, the weighting coefficient will be used to reflect the priority of any specific element relative to the goals of the assessment.
In [
32], a detailed overview of methods used to calculate weighting coefficients in the convolution formula is presented:
- (1)
methods based on pairwise comparison (classical pairwise comparison method; fixed-preference pairwise comparison method; floating-preference pairwise comparison method that underlies the hierarchy analysis method, etc.);
- (2)
methods that use analytical dependencies between weight indices (arithmetic progression method; geometric progression method);
- (3)
formal methods (sequential comparison method (Churchman–Ackoff method); basic index method).
At the same time, it was proved and conclusions were drawn: the use of pairwise comparison methods or methods that are based on the analytical relationship of weight coefficients (with strict ranking) leads to the fact that the weight coefficients (the most important and least important indicators) differ from each other. Coefficients vary in a strictly fixed number of times. This does not take into account the essence of the evaluated category and depends only on the computational procedure and the number of criteria considered. Formal methods are also not free from drawbacks—they provide the numerical value of the superiority coefficient for the input, which is also a subjective value. In practice, this can lead to “intentional” distortions of the generalized measure, which can be caused by various conjunctural factors.
Furthermore, in cases where weighting coefficients are determined by experts, each such expert will have their own interpretation of the concept, with results in replacement of rigorous justification with “reasonable arguments”. The disadvantages of this approach are also evident: excessive subjectivity, complexity of the expert survey, difficulty in selecting appropriately qualified experts, investment of a large volumes of resources (time, finance, etc.), etc.
In this context, the approach proposed in [
33] appears to be the most appropriate method of determining the values of weighting coefficients. In order to determine the desired value, we must first calculate the standard deviation estimate for each normalized partial criterion:
where
is the standard deviation estimate for the j-th index;
is a normalized value of the j-th index for the i-th object;
is the average value of the j-th index for the aggregate of all i-th objects;
n is the number of objects.
The standard deviation essentially provides an estimate of the data scatter relative to the average value. Since the values of initial indices are normalized, the value of will be within the range (where = A0 = 0; A1 = 1). In order to explain the meaning of the resulting values, let us consider the boundary values. The value means that all values of the j-th index are equal to one another. This means that if the value of any specific index is the same for all objects, it can be ignored for the purposes of comparison. The value means that the data scatter for the j-th index is the greatest. Therefore, it should receive special attention for the purposes of comparison of same-type objects, which is explained by the following: it is necessary to ensure that the “worst” objects have the same level of this index as the “best” ones, and, accordingly, their weight in calculation of the composite index should be the greatest. It means that the greater the value of is, the greater is the value of . In order to satisfy the condition , scaling must be performed: where is the number of j-th source indices or composite subindices in composite subindices of a higher hierarchical level or the composite index of the functional network.
3. Model for Composite Assessment of Digitalization Levels
It should be acknowledged that none of the existing methods for assessment of digitalization levels of subnational entities is universally applicable, due to a range of circumstances. Among them is the low level of adaptation of specific approaches to the existing system for information support of the procedure that is being analyzed, which manifests in incomplete data on all objects under assessment, assessment criteria that are reviewed from time to time, absence of reliable source information, etc. These limitations have a serious impact on the quality of the model that is supposed to be used as the basis for calculation of the composite index. Based on the above, the authors propose, for the purposes of making it comparable to the European experience, to base assessment of digitalization levels of the federal subjects of Russia on an overlapping set of source indices collected by Rosstat [
34] and Eurostat [
35] (
Table 1).
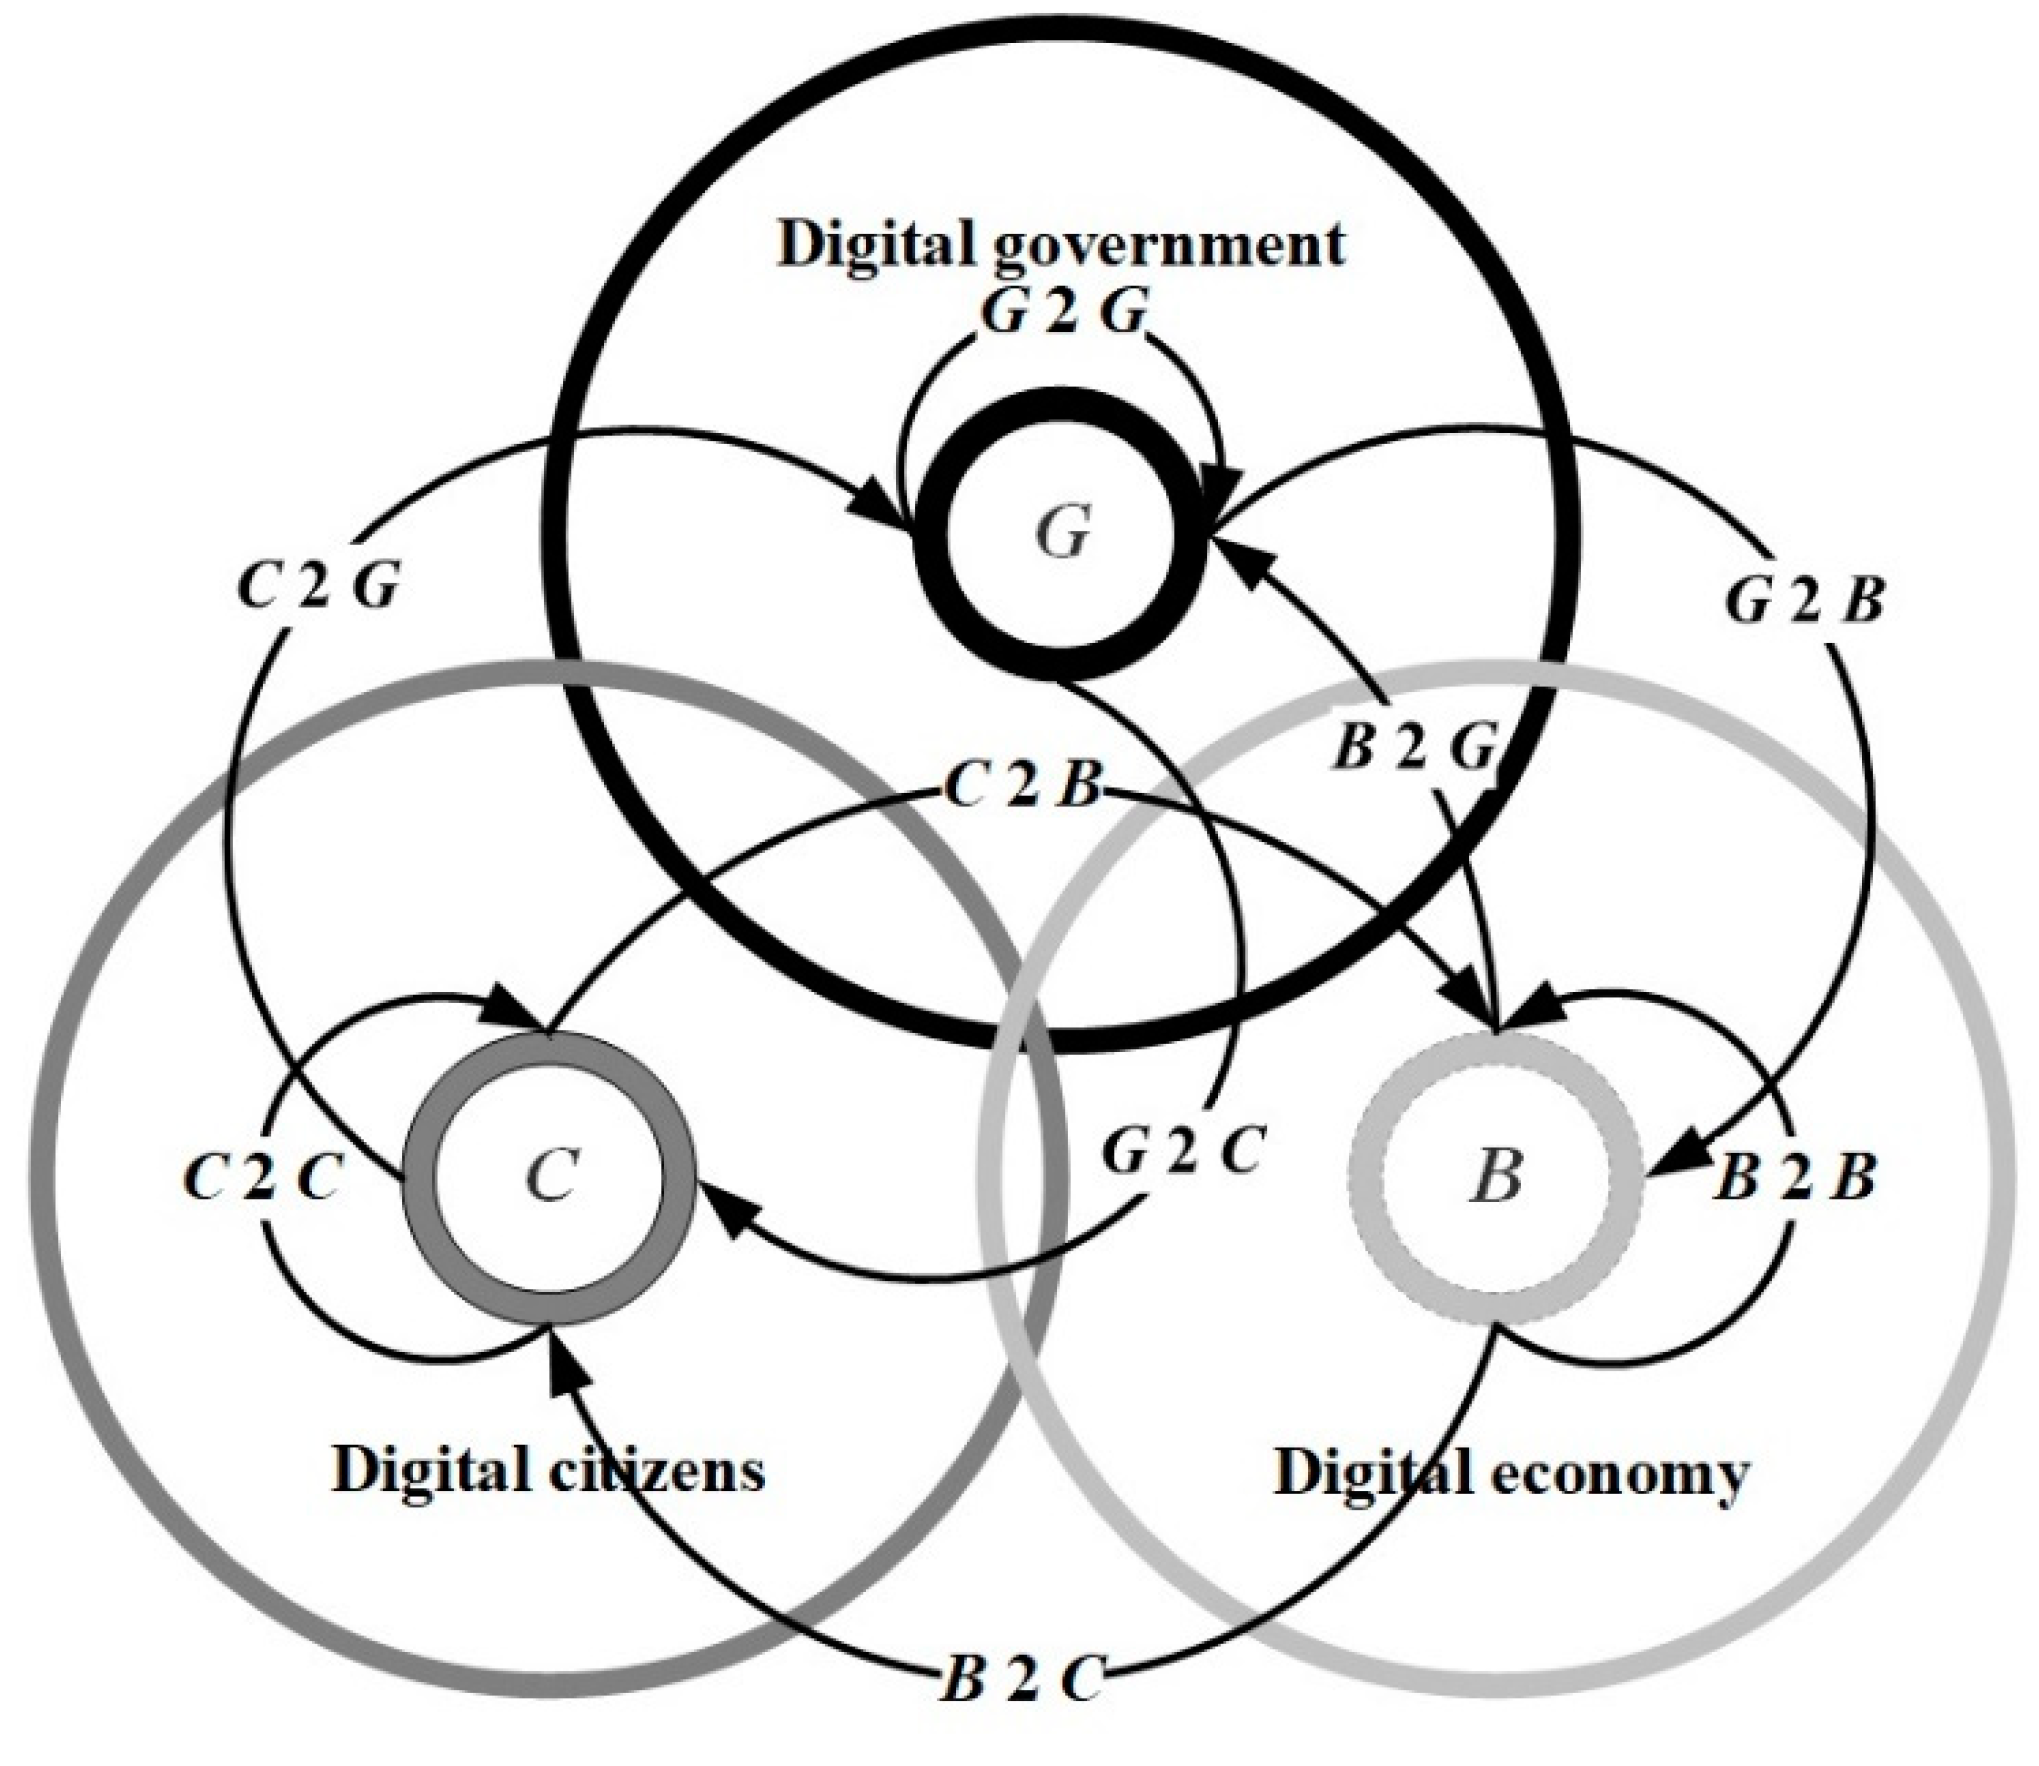
One of the best known models of the information society that is inextricably tied with the processes of digitalization is it being represented as a set of subsystems that at the macro level can be designated as “government” (G), “business” (B) and population or “citizens” (C) (
Figure 2) [
36].
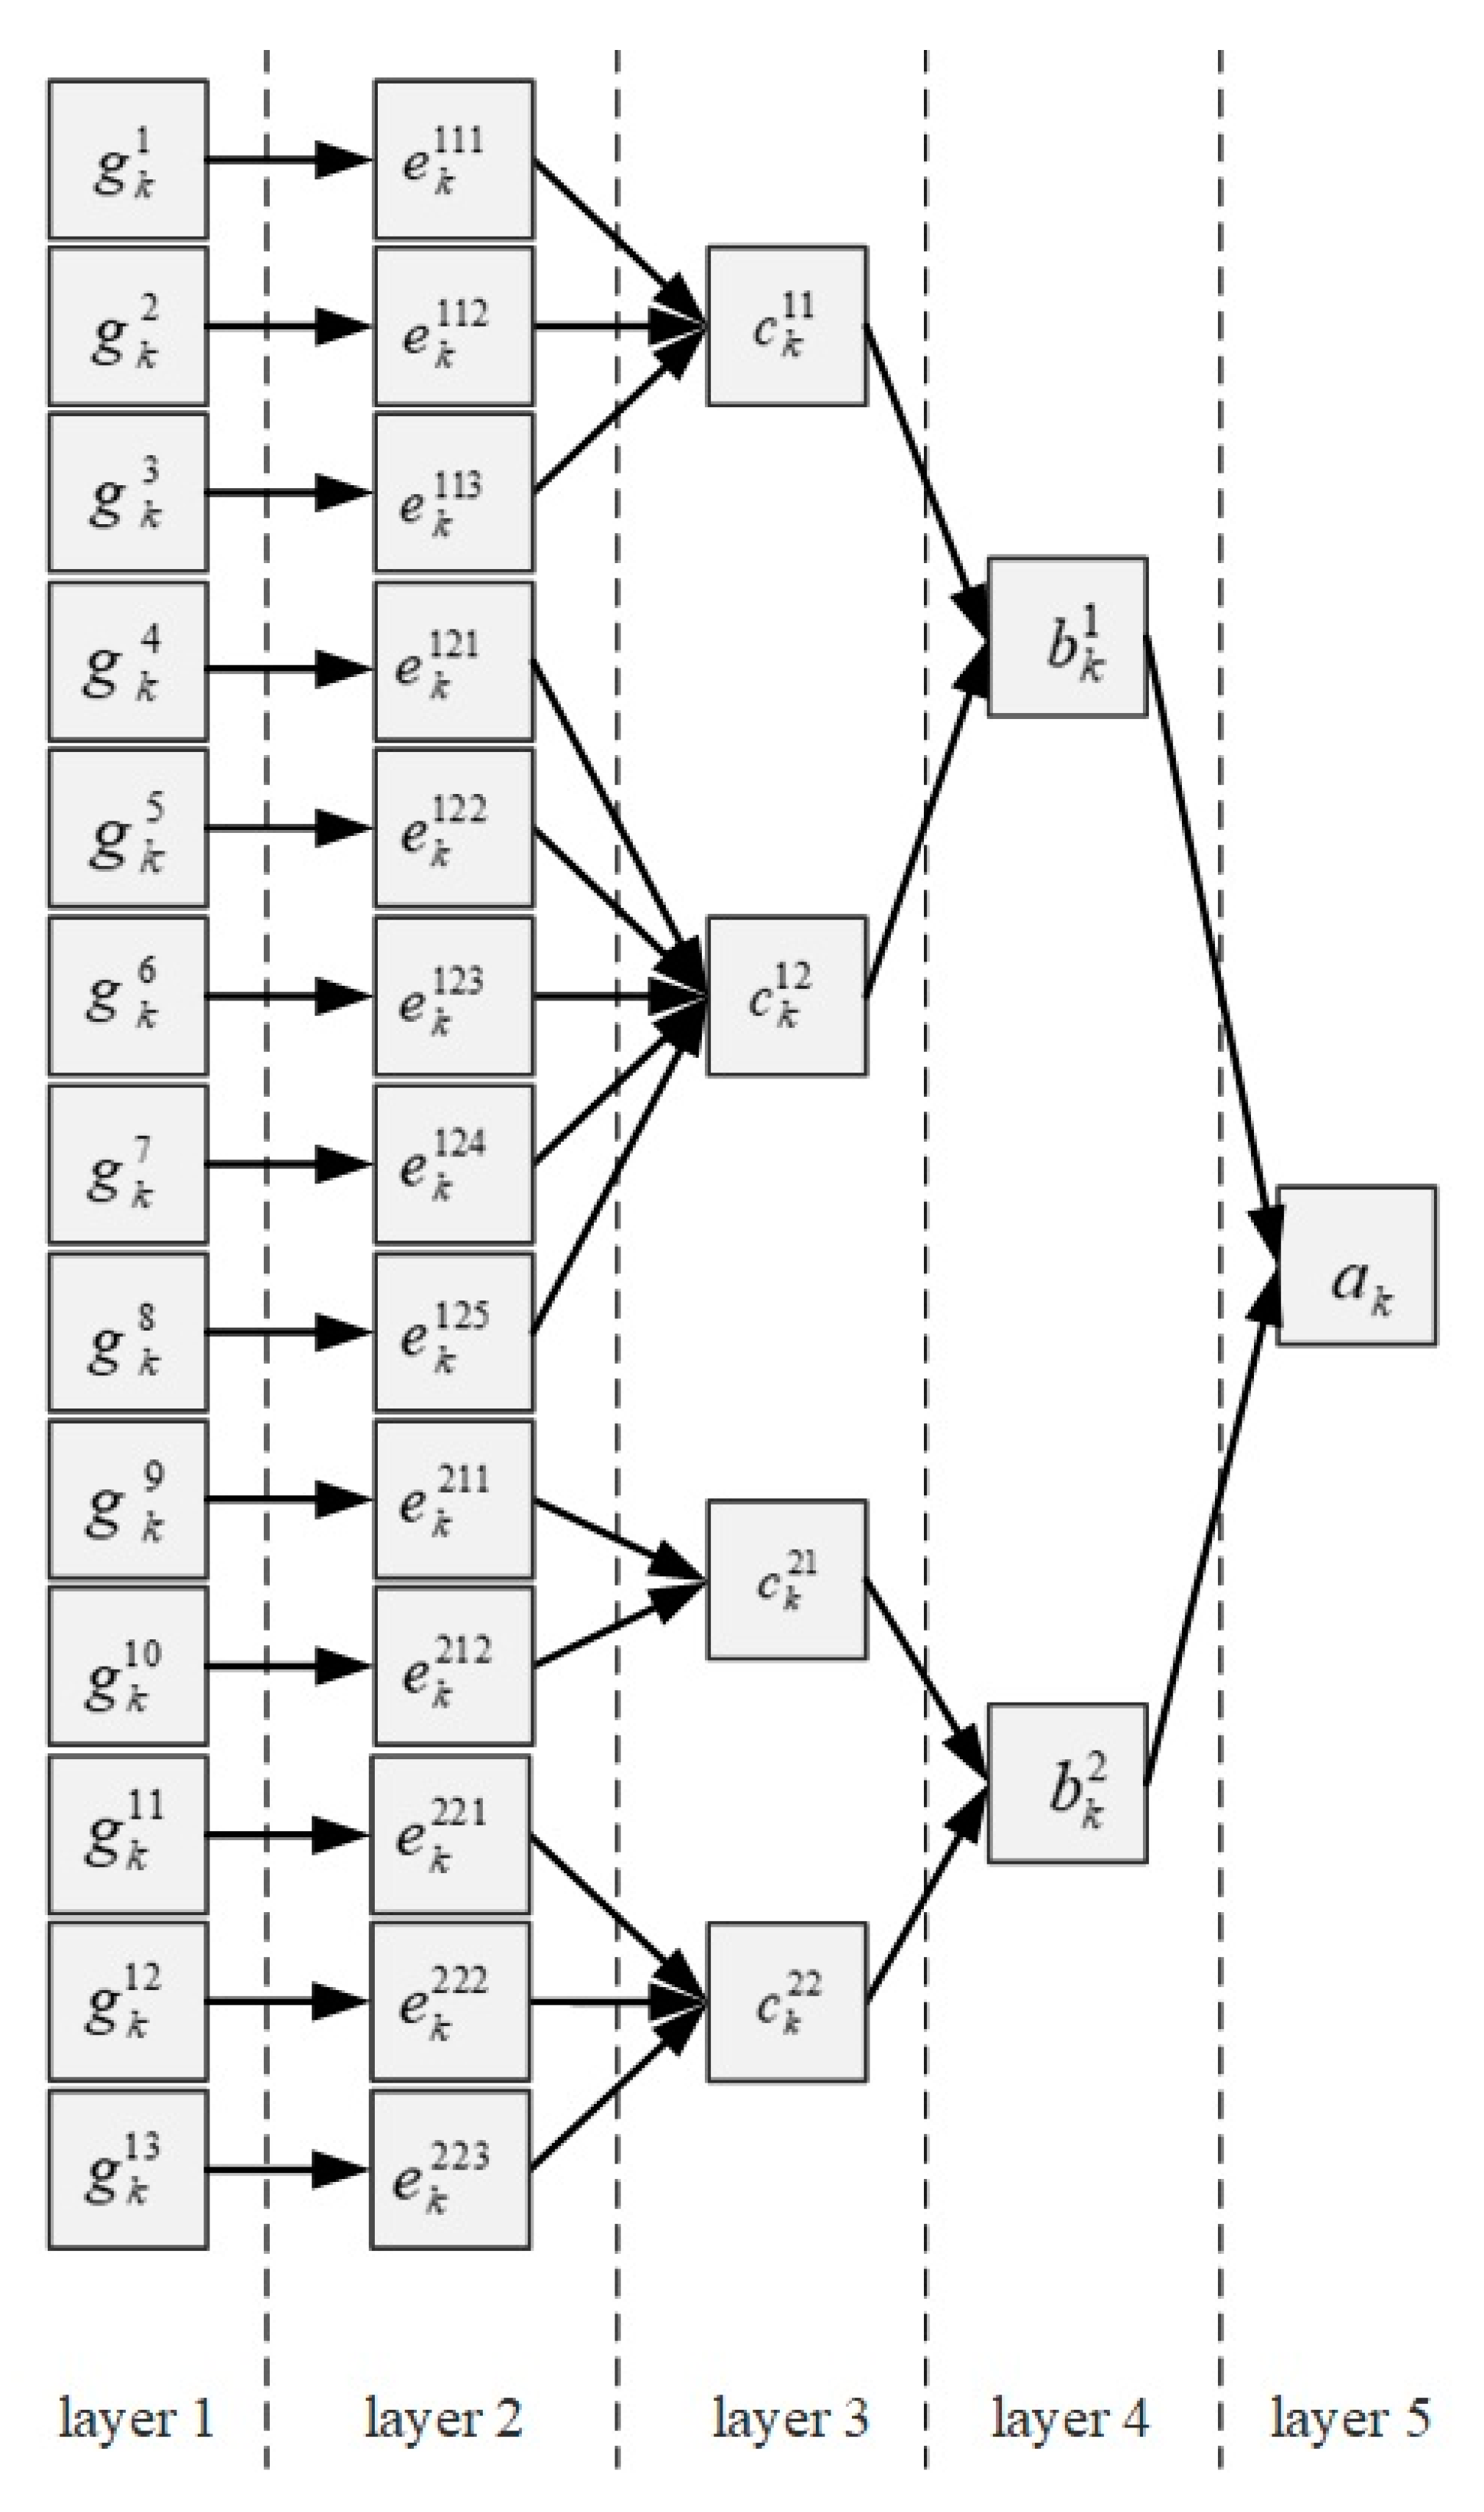
In the structure of the information society, the “government” is responsible for integrating collective interests and creating usually common favorable conditions for “business” and “citizens”. Its activities aimed at improving its own efficiency, including in its relations with the other two elements of the model, are ultimately reflected in the functioning and development of the society, on the one hand, and the real economy on the other. This thesis makes it possible to exclude government from direct consideration in the model for composite assessment of digitalization levels in subnational entities, transforming its role into that of shaping the development potential both for citizens and business, usually by creating (supporting, facilitating) the required infrastructure. Thus, two dimensions can be identified within the structure of the composite index (
Figure 3): levels of digitalization reflecting the associated processes among the population and/or households (
) and business/economic entities (
). Each of them, in its turn, is usually made up of the infrastructure potential (
for the population,
for business) and the current, at the time of the assessment, level of engagement in interactions and transformations that are typical of the information society (
for the population,
for business). Each element of the model represented at level 4 of the network (
Figure 3), which is composed of normalized values of source indices as shown in
Table 1 (
is based on
,
and
;
on
,
,
,
and
;
on
and
;
on
,
and
).
The proposed model takes into account the availability of data on digitalization processes, and factors in the following crucial principles:
- (1)
systematic approach to assessment that considers digitalization based on a comprehensive understanding of the given category, achieved through one-by-one analysis of its constituent elements in the context indicated earlier (
Table 2);
- (2)
integrated approach to assessment that must take into account the multiaspect (multidimensional) nature of digitalization and make it possible to simultaneously measure its various manifestations;
- (3)
hierarchical nature of assessment, which means a certain structure and subordination of indices, which range from basic to composite ones;
- (4)
modular approach to assessment that provides such aggregation of basic indices that allows individual components obtained at any specific hierarchy level to have independent values, thus increasing interpretability of assessment;
- (5)
balance of assessment that must take into account various components of the category when developing the composite index.
As a result, the proposed model will make it possible to deliver a comprehensive assessment of digitalization levels in the country as a whole, and in its constituent entities (subnational units). By comparing calculation results it becomes possible to identify the strengths and weaknesses in development of the information society and propose practical recommendations for priority measures to reduce digital inequality based on the best practices of leaders in digital transformation.
4. Assessment of the Digitalization Levels of Russian Regions
Based on the data discussed in [
34] and already represented by relative values, and on the proposed structure for composite assessment of digitalization levels (
Figure 3), the authors calculated normalized values of source indices for the 85 federal subjects of Russia as of 2017. Normalization used the range of 0 to 1. The results thus obtained were used to calculate weighting coefficients for the values of layer 4 composite subindices on the model shown in
Figure 3 (
Table 3).
The weighting coefficients for layer 5 composite subindices (
Table 4) and the composite index (
Table 5) are determined in the same manner.
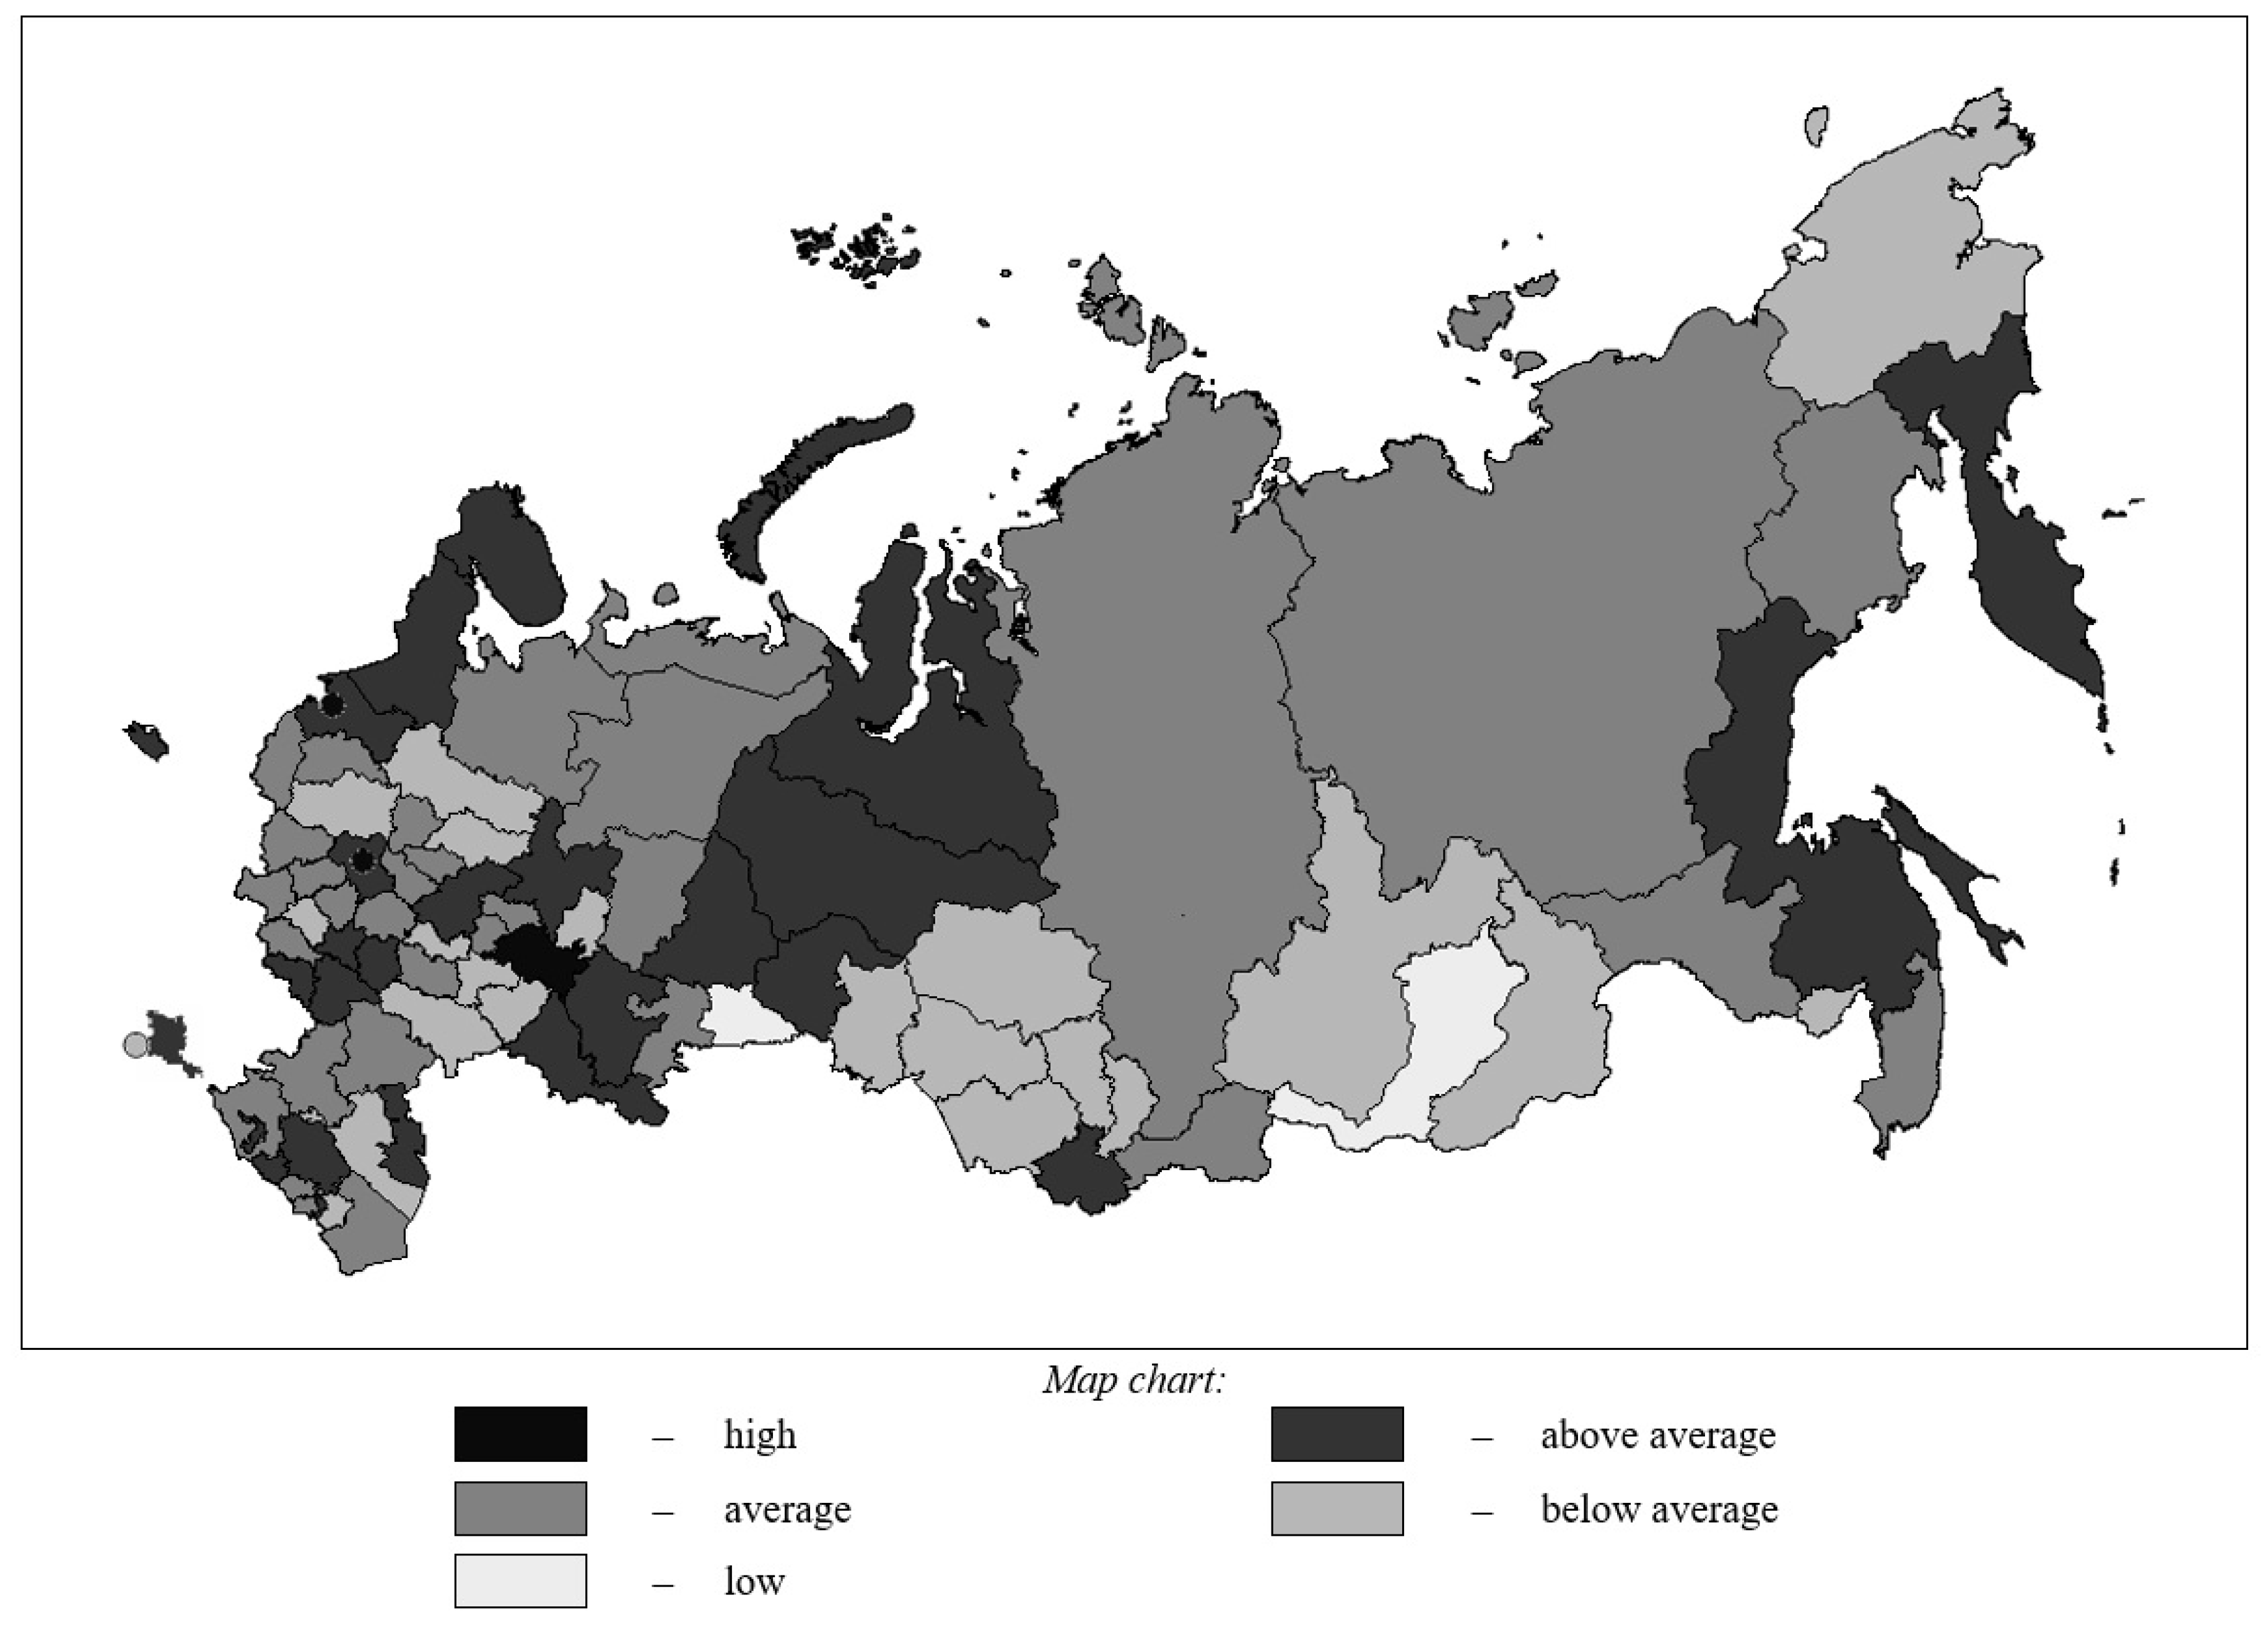
Figure 4 and
Table 6 shows results of calculation of the composite index of digitalization levels. In addition to the composite assessment score proper, the
Table 6 also presents a ranking of regions and their grouping (based on uniform breakdown of the composite score range: less than 0.34—low level; 0.35–0.48—below average level; 0.49–0.60—average level; 0.61–0.73—above average level; greater than 0.74—high level).
As one can see, the smallest groups are at the extremes of the range—there are only three regions categorized as leaders or as outsiders. Moscow and Saint Petersburg both being in the vanguard of the most digitalized territories is no surprise and is explained by their central economic and political role in Russia, and by purely physical and geographic factors (compact territories with high population density that do not require a physically extensive infrastructure). Attention should be paid, including for the purposes of analysis of best practices, to the managerial and technological practices of the Republic of Tatarstan, which is also among the leaders. An assumption could be made that natural factors (area, climate zone, etc.) have a significant impact on “digital success”, but we can see that the group of regions that are closest to leaders includes Yamalo-Nenets Autonomous Okrug and Khanty-Mansi Autonomous Okrug (ranked 5–6 and 7, respectively). It is quite impossible to describe these regions as having a smaller size or a favorable climate. Therefore, it is likely that any region’s ranking is explained by its policies for Information Technology (IT) development within its borders.
It is obvious that the Russian Federation cannot be considered outside of the context of global processes and trends in digitalization. For this purpose, the composite assessment score was calculated for several countries of Europe (
Table 7,
Figure 5). The weighting coefficients in the convolution formulas used for these calculations were taken from the same model that was used for territorial differentiation of federal subjects of Russia (
Table 3,
Table 4 and
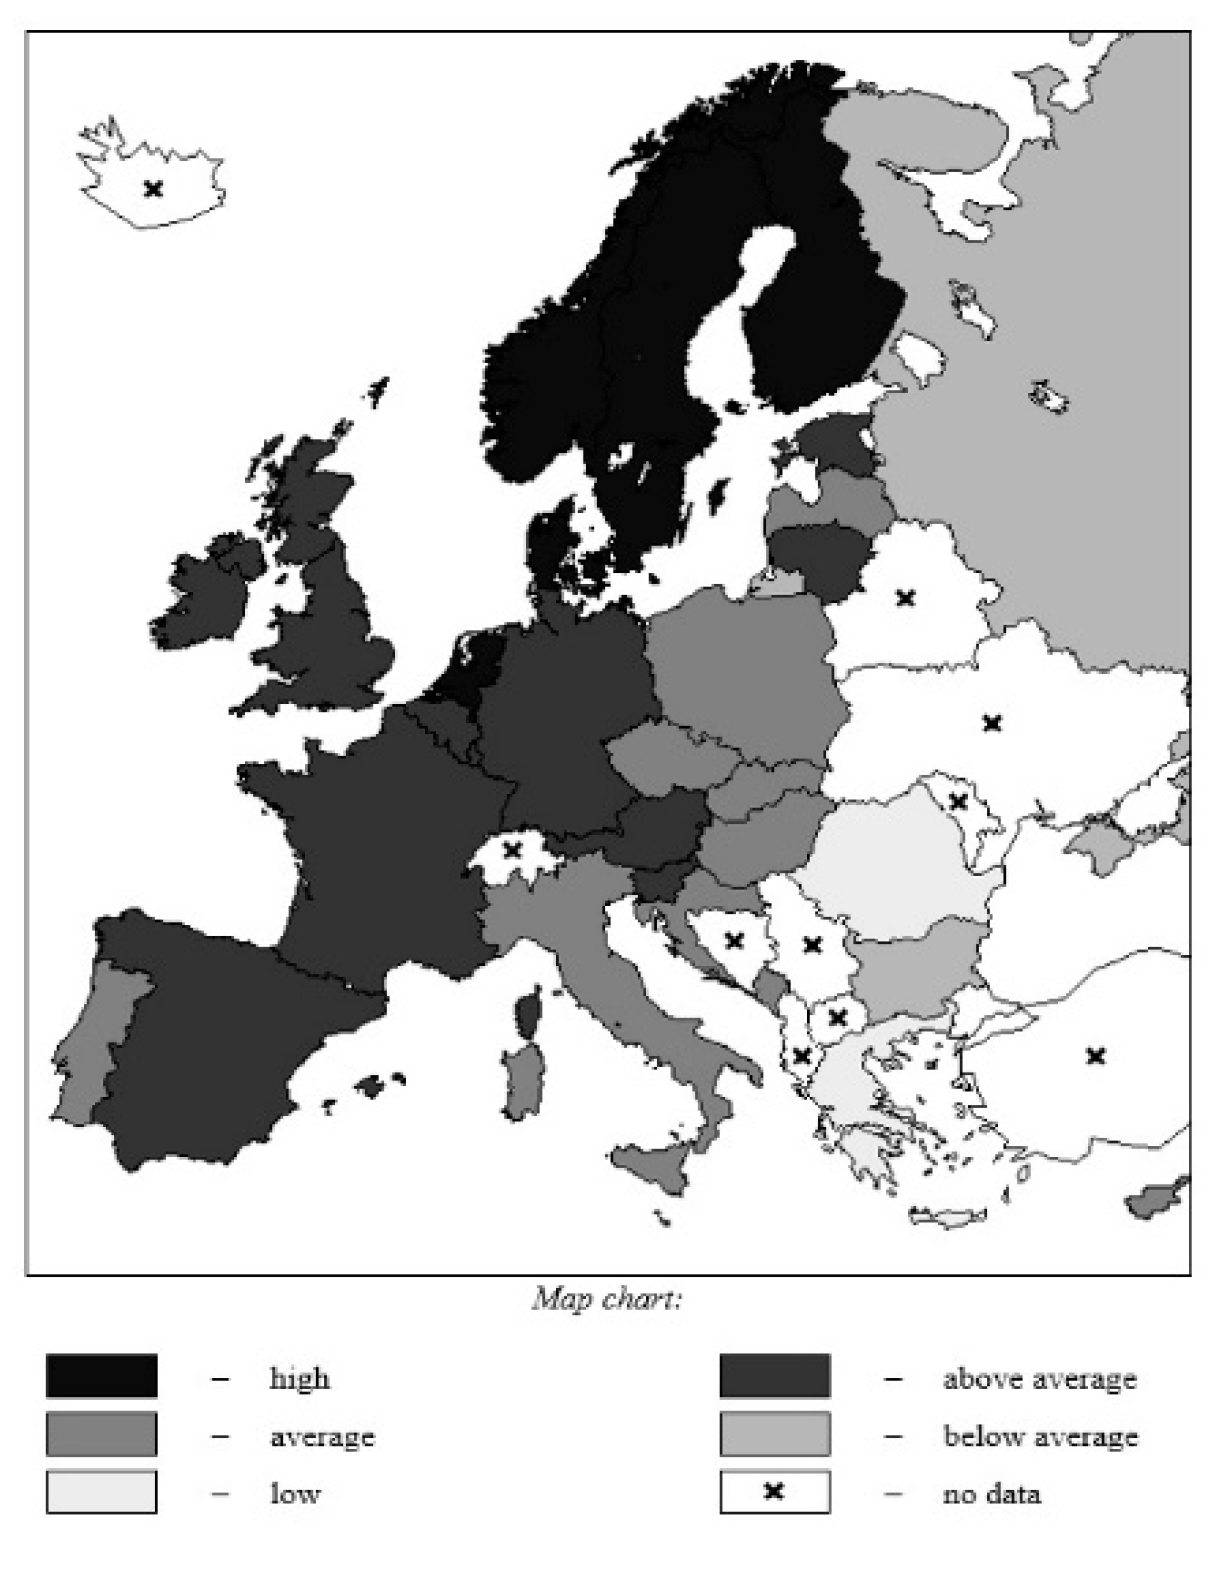
Table 5), as opposed to being specifically calculated for the set of objects thus compared. This assumption is made based on the goal of the assessment: to identify Russia’s place in global processes from the perspective of internal territorial differentiation (national priority). As one can see, European countries show an even wider range of digitalization levels than Russian regions (composite index interval boundaries for European countries are [0.12; 0.96]; while for Russian regions they are [0.22; 0.86]). In view of this, the boundaries of the qualitative assessment groupings were adjusted (less than 0.29—low level; 0.30–0.46—below average level; 0.47–0.62—average level; 0.63–0.79—above average level; greater than 0.80—high level).
According to the data shown in
Table 7, Finland, Denmark, the Netherlands, Sweden and Norway top the European rankings. Russia, along with Bulgaria, is placed in the group with a below average development level, falling significantly behind the average performers in the ranking, while far outperforming the outsiders—the low development group (Greece and Romania). At the same time, nearly all Russian regions are comparable in size to individual European states, and in some cases are significantly larger than them. This thesis gives us grounds to consider federal subjects of Russia as quasi-states in the context of the European ranking. Given that Russia as a whole is at the bottom of the European ranking of digitalization levels, for the purposes of such comparison, we shall only consider the leaders of the Russian ranking: Moscow, Saint Petersburg, Tatarstan (look at the
Table 6). The results of these calculations are shown in
Table 8.
The top Russian regions are ranked in the above average and average groups, in the top and middle parts of the table, accordingly. Saint Petersburg shows a better result than a number of European countries, such as France and the UK, and Moscow ranks even higher, outperforming Germany as well. Naturally, it is important to recognize the exceptional status of these two regions within the social and economic landscape of the Russian Federation, although t does not negate their achievements. The experience of Tatarstan—a more typical dispersed entity—is also noteworthy not only for the purposes of Russian domestic processes of digital transformation, but also for a number of European states that have ranked below it or at similar levels.
5. Development of Research
In addition to calculating the integral indicator of the current level of digitalization, within the framework of the analysis, an assessment of changes is also possible. This assessment allows us to make a conclusion about the trends inherent in the territories under consideration. In general, the functional network for determining the integral assessment characterizing the level of change, compared to the one considered earlier (
Figure 3), remains the same, with the only difference that now it is not the current level that is assessed, but the change in characteristics. The first layer is formed by the values of indicators in the current and base periods.
Estimates of increments are used as normalized indicators. If an increase in the initial indicator is considered a positive trend, then the calculation is made by the expression:
or
where
—the actual value of the «
j» indicator for the «
i» object in the current period (
t);
—the actual value of the «
j» indicator for the «
i» object in the base period (
b).
This approach makes it possible to assess the positive trends inherent in the object within the period under consideration (for example, an increase in the proportion of households with personal computers). Following from the presented formulas, within the framework of the standardization procedure, the impact of factors that could negatively affect the generalized indicator by leveling the “successes” of a particular territory with “failures” within the framework of the procedure for further adding up private estimates is actually excluded from the composite index. From a practical point of view, this principle is implemented through the assignment of a zero estimate to a normalized value when the values of relative indicators change in an undesirable direction.
In practice, a situation is often encountered when one or more objects from the considered aggregate almost does not show the initial indicators of development—i.e., positive movement. Accordingly, the integral assessment of the level of changes for him will be localized within the zero mark, which only indicates the absence of positive dynamics, but does not in any way characterize the level of “decline”. To characterize this side of the movement, it is advisable to modify the procedure for standardizing the initial indicators. So, in the framework of clarifying the level of negative dynamics for the dimensionlessization of the digital economy characteristics of territories, an increase in which is interpreted as a positive trend, expression (6) is used, otherwise expression (5) is used. From a meaningful (interpretive) point of view, it is only necessary to pay attention in this case to the fact that the closer to zero the normalized values are (and hereinafter also integral ones), within the framework of the used scale [0; 1], the less negative tendencies are expressed in the object under study. Integral estimates (of varying degrees of aggregation) of the level of changes in the dynamic model are found in the same way as in the static model using the additive convolution formulas.
The integral estimates obtained by various models can be represented and interpreted by positioning in the “current level—level of changes” coordinate system. The proposed tool allows one to visualize the relationship between the static and dynamic components of the level of digitalization, as well as form a comprehensive assessment. A comprehensive assessment can be obtained by positioning in space, which is formed by the Cartesian product of the sets of values of integral indicators. Such indicators were obtained based on the use of static and dynamic models: low; below the average; middle; above the average; high. An object belonging to a particular class can be determined by analyzing the table of possible states within the framework of obtaining a comprehensive assessment (
Table 9). Formally, when analyzing
Table 9, 25 types of territories can be distinguished. However, such a number of them is not quite convenient for consideration. In this regard, it is proposed to combine a number of neighboring positions into larger classes. Thus, we obtained eight basic positions that characterize one or another state of digitalization of the territory: A1—crisis; A2—pre-crisis; A3—tense; A4—balanced; A5—progressive; A6—stable; A7—developed; A8 is the leader.
The interpretation map allows you to determine the typical management tasks, due to the obtained values of the integral indicators. The A7 and A8 squares characterize the most advantageous positions. Objects that fall into these classes have good both static and dynamic evaluations at the same time. In general, the general direction for them should both maintain the current situation in terms of the formation and potential use and maintain the rate of growth in key areas of assessment. If the objects fall into the A5 and A6 squares, then within the framework of the control actions development, it is necessary to talk about corrective actions. In the first option, it is necessary to maintain the existing pace to improve the strategic position in the direction of increasing the current level, in the second—to mobilize the existing potential to increase the dynamic component. Position in the A4 quadrant indicates a fairly balanced state. Depending on how effectively and efficiently the activities aimed at transforming the synthetic category are implemented, it is possible to move the object to both the upper right and lower left corners of the map. The most difficult position in terms of systems are those objects that are positioned in the A1, A2 and A3 squares.
The practical implementation of the described direction of research development requires the formation of an additional dataset (accumulation of values for the existing set of indicators over a number of years).
6. Conclusions
- (1)
This paper proposes a methodological approach for a composite assessment of the digitalization levels of subnational entities that relies on expert opinions only at the stage of model development (structuring of the subject field) which underlies the generalized measure. The approach is noted for being relatively simple and transparent, which simplifies the processes of data collection and processing and reduces the possibility of results being manipulated. Despite a certain simplicity, the proposed method for assessing the level of digitalization makes it possible to obtain results that lend themselves to good interpretation by the decision makers. This circumstance is explained both by the methods of standardization used in the form of linear scaling and by the additive mechanism for forming the composite index. These two simple mathematical solutions make it possible to orient the proposed method towards a decision support tool. Undoubtedly, the proposed method, as well as many other approaches used to form aggregated estimates, is not free from drawbacks. In particular, it makes sense to consider valuation using nonlinear functions. At the same time, this question is a topic for a separate theoretical study. This work was aimed at the formation of a scientifically substantiated applied result aimed at obtaining specific values for the level of digitalization of individual territories. Scientific novelty also consists of a dataset that is different from other studies, justified from the point of view of a meaningful model of digitalization development processes, and not formed, as noted at the beginning of the article, mechanically or by referring to the subjective positions of some authors. The result is important, which lies in the possibility of autonomous results from use of the assessment carried out by subintegral indicators: the levels of digitalization, reflecting the processes in the population and/or households sector, on the one hand, and business/economic entities on the other. These results can be used as part of the formation of a differentiated system of support and incentives for various subjects of the digital economy from the state. It is also possible to use the constituent elements of the proposed integral indicator as parts in other summary indicators.
- (2)
The proposed approach was tested in order to compile a ranking of Russian regions by levels of digitalization, as well as to provide a comparison of the European and Russian practices. The results thus obtained make it possible to conclude that individual federal entities of Russia can serve as reference points for some European countries as territories with a superior level of IT infrastructure development. The best management practices determined from a formalized point of view by means of the proposed methodology (Moscow, St. Petersburg, the Republic of Tatarstan—in Russia; Finland, Denmark, the Netherlands, Sweden, Norway—in Europe) need additional qualitative research on the specific tools that contributed to the achievement of leading positions. In this regard, the presented practical result has two important management values. On the one hand, it acts as a benchmarking tool, on the other hand, it allows you to assess the effectiveness of the implemented measures on a regional and national scale.
- (3)
When expanding the data chronology, the methodology for assessment of the digitalization level in subnational entities can be expanded by including not only the current level of assessment, but also a composite measure that reflects changes—described in the concluding part of the work. In addition, in the directions of development of the proposed apparatus from a practical point of view, the following proposals can be indicated: accounting not only for statistical information characterizing digitalization processes, but also sociological data obtained through selective representative surveys of the population and representatives of the business community; introduction of fuzzy classification elements when forming the composition of groups, indicating particular digitalization level areas; accounting in the composition of the integral indicator for each territory digitalization characteristic, due to the a priori idea of their heterogeneity—for example, due to natural and climatic conditions, the scale of the territory, etc.


