1. Introduction
There is no denying that nutrition has become a core factor to today’s society, and an undeniable solution to the global health-crisis [
1,
2,
3,
4]. The path towards making the average human diet healthier and environmentally sustainable is a fundamental part of the solution for numerous challenges from ecological, environmental, societal and economic perspective, and the awareness for this has just started to grow and be fully appreciated.
We live in a time of a global epidemic of obesity, of diabetes, of inactivity, all connected to bad dietary habits. Many chronic diseases such as high blood pressure, cardiovascular disease, diabetes, some cancers [
5], and bone-health diseases are linked to, again – poor dietary habits [
6]. Dietary assessment is essential for patients suffering from many diseases (especially diet and nutrition related ones), it is also very much needed for professional athletes, and because of the accessibility of meal tracking mobile applications it is becoming part of everyday habits of a vast majority of individuals, for health, fitness, or weight loss/gain. Obesity is spiking each day in developed western countries and this contributes to raised public health concern about some subcategories of macronutrients, specifically about saturated fats, and added or free sugar. Nutritional epidemiologists are also raising concern about micronutrients like – sodium, whose intake should be monitored for individuals suffering from specific diseases like osteoporosis, stomach cancer, kidney disease, kidney; and fiber, whose intake is critical for patients suffering from irritable bowel syndrome (IBS).
Nutrient content from one food to another can vary a lot, even though they have roughly the same type of ingredients. This makes nutrient tracking and calculating very challenging, and predicting nutrient content very complicated. In this paper, we propose an approach, called P-NUT (Predicting NUTrient content from short text descriptions), for predicting macronutrient values of a food item considering learned vector representations of text describing the food item. Food items are generally unbalanced in terms of macronutrient content. When there is a broad variety of foods, they can go from one extreme to another for one macronutrient content, for example the content of fat can go from ‘fat free’ foods to ‘fat based’ foods (ex. different kinds of nut butters), which can be a good base for grouping foods. Therefore, a general model for prediction will not be efficient in macronutrient prediction. For this reason, we decided to apply unsupervised machine learning – clustering as a method to separate foods in order to obtain clusters (groups) of foods with similar characteristics. Subsequently, on these separate clusters we predict the macronutrients with applying supervised machine learning. Predicting macronutrients is not a task that has been approached in such a manner before, usually nutrient content of food is calculated or estimated from measurements and exact ingredients [
7,
8,
9]. These calculations are pretty demanding, the detailed procedure for calculation of the nutrient content of a multi-ingredient food has a few major steps: selection or development of an appropriate recipe, data collection for the nutrient content of the ingredients, correction of the ingredient nutrient levels for weight of edible portions, adjustment of the content of each ingredient for effects of preparation, summation of ingredient composition, final weight (or volume) adjustment, and determination of the yield and final volumes. This is when all the ingredients and measurements are available. When the data for the ingredients are not available, this procedure gets more complicated [
7,
8].
With using just, short text descriptions of the food products – either a simple food or complex recipe dish, the results from this study show that this way of combining representation learning with unsupervised and supervised machine learning provides results with accuracy as high as 80%, compared to the baseline (mean and median – calculated from the values of a certain macronutrient of all the food items in a given cluster) in some cases there are differences in accuracies of up to 50%.
The structure of the rest of the paper is the following: In
Section 2, we begin with the related work in
Section 2.1 where we present the published research need to understand P-NUT, then
Section 2.2 provides a structure and description of the data used in the experiments, and in
Section 2.3, we explain the methodology in detail. The experimental results and the methodology evaluation are presented in the
Section 3. In the
Section 4, we review the outcome of the methodology, the benefits of such approach, and its novelty. At, the end, in
Section 5, we summarize the importance of the methodology and give directions for future work.
2. Materials and Methods
To the best of our knowledge, predicting nutritional content of foods/recipes using only short text description has never been done before. There has been some work involving machine learning done in this direction, mainly involving image recognition: employing different deep learning models for accurate food identification and classification from food images [
10], dietary assessment through food image analysis [
11], calculating calorie intake from food images [
12,
13]. All this work in the direction of predicting total calories, strongly relies on textual data retrieved from the Web. There are numerous mobile and web applications, for tracking macronutrient intake [
14,
15]. Systems like these are used for achieving dietary goals, allergy management or simply, maintaining a healthy balanced diet. The biggest downside is the fact that they require manual imputation of details about the meal/food.
2.1. Related Work
In this subsection we present a review of the concepts relevant to P-NUT, the algorithms that were used, and recent work done in this area.
2.1.1. Representation Learning
Representation learning is learning representations of input data by transforming it or extracting features from it, which then makes it easier to perform a task like classification or prediction [
16]. There are two different categories of vector representations: non-distributed or sparse, which are much older and distributed or dense, which have been in use for the past few years. Our focus is on distributed vector representations.
Word Embeddings
Word representations were first introduced as an idea in 1986 [
17]. Since then, word representations have changes language modelling [
18]. Following up is work that includes applications to automatic speech recognition and machine translation [
19,
20], and a wide range of Natural Language Processing (NLP) tasks [
21,
22,
23,
24,
25,
26,
27]. Word embeddings have been used in combination with machine learning, improving results from biomedical named entity recognition [
28], capturing word analogies [
29], extracting latent knowledge from scientific literature and going towards a generalized approach to the process of mining scientific literature [
30], etc. We previously explored the idea of applying text-based representation methods in the food domain for the task of finding similar recipes based on cosine similarity between embedding vectors [
31]. Word embeddings are vector space models (VSM), that in a low-dimensional semantic space (much smaller than the vocabulary size) represent words in a form of real-valued vectors. Having distributed representations of words in vector space helps improve the performance of learning algorithms in for various NLP tasks.
Word2Vec was introduced as word embedding method by Mikolov et al. in 2013 at Google [
32], and it is a neural network based word embedding method. There are two different Word2Vec approaches, Continuous Bag of Words and Continuous Skip Gram [
33]:
- ○
Continuous Bag-of-Words Model (CBOW) – This architecture consists of a single hidden layer and an output layer. The algorithm tries to predict the center word based on the surrounding words – which are considered as the context of this word. The inputs of this model are the one–hot encoded context word vectors.
- ○
Skip-gram Model (SG) – In the SG architecture we have the center word and the algorithms tries to predict the words before and after it, which make up the context of the word. The output from the SG model are
number of
dimensional vectors, where
is the number of context words which we want the model to return and
is the vocabulary size. The SG model is trained to minimize the summed prediction error and gives better vectors with increments of
[
32,
33].
If compared, CBOW is a lot simpler and faster to train but SG performs better with rare words.
GloVe [
34] is another method for generating word embeddings. It is a global log-bilinear regression model for unsupervised learning of word representations, that has been shown to outperform other models on word analogy, word similarity, and named entity recognition tasks. It is based on co-occurrence statistics from a given corpus.
Paragraph Embeddings
In 2014 [
35] an unsupervised paragraph embedding method, called Doc2Vec, was proposed. Doc2Vec in contrast to Word2Vec generated vector representations of whole documents, regardless of their length. The paragraph vector and word vectors are concatenated in a sliding window and the next word is predicted; the training is done with a gradient decent algorithm. The Doc2Vec algorithm also takes into account the word order and context. The inspiration, of course, comes from the Word2Vec algorithm: the first part, called Distributed Memory version of Paragraph Vector (PV-DM), is an extension of the CBOW model with an additional vector (Paragraph ID) added, with the difference of including another feature vector, unique to the document, for the next word prediction. The word vectors represent the concept of a word, while the document vector represents the concept of a document.
The second algorithm, called Distributed Bag of Words version of Paragraph Vector (PV-DBOW), is similar to the Word2Vec SG model. In PV-DM the algorithm considers the concatenation of the paragraph vector with the word vectors for the prediction of the next word, whereas in the PV-DBOW the algorithm ignores the context words in the input, and the word are predicted by random sampling from the paragraph in the output.
The authors recommend using a combination of the two models, even though the PV-DM model performs better and usually will achieve state of the art results by itself.
Graph-Based Representation Learning
Besides word embeddings, there are methods that are used for embedding data represented as graphs, consequently named graph embedding. Usually, embedding methods learn vector embeddings represented in the Euclidean vector space, but as graphs are hierarchical structures, in 2017 the authors in [
36] introduced an approach for embedding hierarchical structures into hyperbolic space – Poincaré ball. Poincaré embeddings are vector representations of symbolic data, the semantic similarity between two concepts is the distance between them in the vector space, and their hierarchy is waved by the magnitudes of the vectors. Graph embeddings have improved performance over many of the existing models on tasks such as text classification, distantly supervised entity extraction, and entity classification [
37], they also have been used for unsupervised feature extraction from sequences of words [
38]. In [
39], the authors generate graph embeddings (Poincaré) for the FoodEx2 hierarchy [
40]. FoodEx2 version 2 is a standardized system for food classification and description developed by the European Food Safety Authority (EFSA), it has domain knowledge embedded in it and it contains descriptions of a vast set of individual food items combined in food groups and more broad food categories in a hierarchy that exibits parent-child relationship. The domain knowledge contained in the FoodEx2 hierarchy is transcended through the graph embeddings, which later the authors use in order to group the food items from the FoodEx2 system in clusters. The clustering is done using the Partition Around Medoids algorithm [
41], and the number of clusters is determined using the silhouette method [
42].
2.2. Data
In our experiments we used a dataset that contains nutritional information about food items recently collected as food consumption data in Slovenia with the collaboration of subject-matter experts for the aims of the EFSA EU Menu project [
43] – designed for more accurate exposure assessments and ultimately support of risk managers in their decision-making on food safety. The ultimate goal being – enabling quick assessment of exposure to chronic and acute substances possibly found in the food chain [
44]. In this dataset there are 3265 food items, some of which are simple food products and others are recipes with short descriptions, a few instances are presented in
Table 1 as an example.
From the dataset for each food item we have available: name in Slovene, name in English, FoodEx2 code, and nutrient values for: carbohydrates, fat, protein and water. We repeated our experiments for both English and Slovene names of the food products and the recipes.
2.3. Methodology
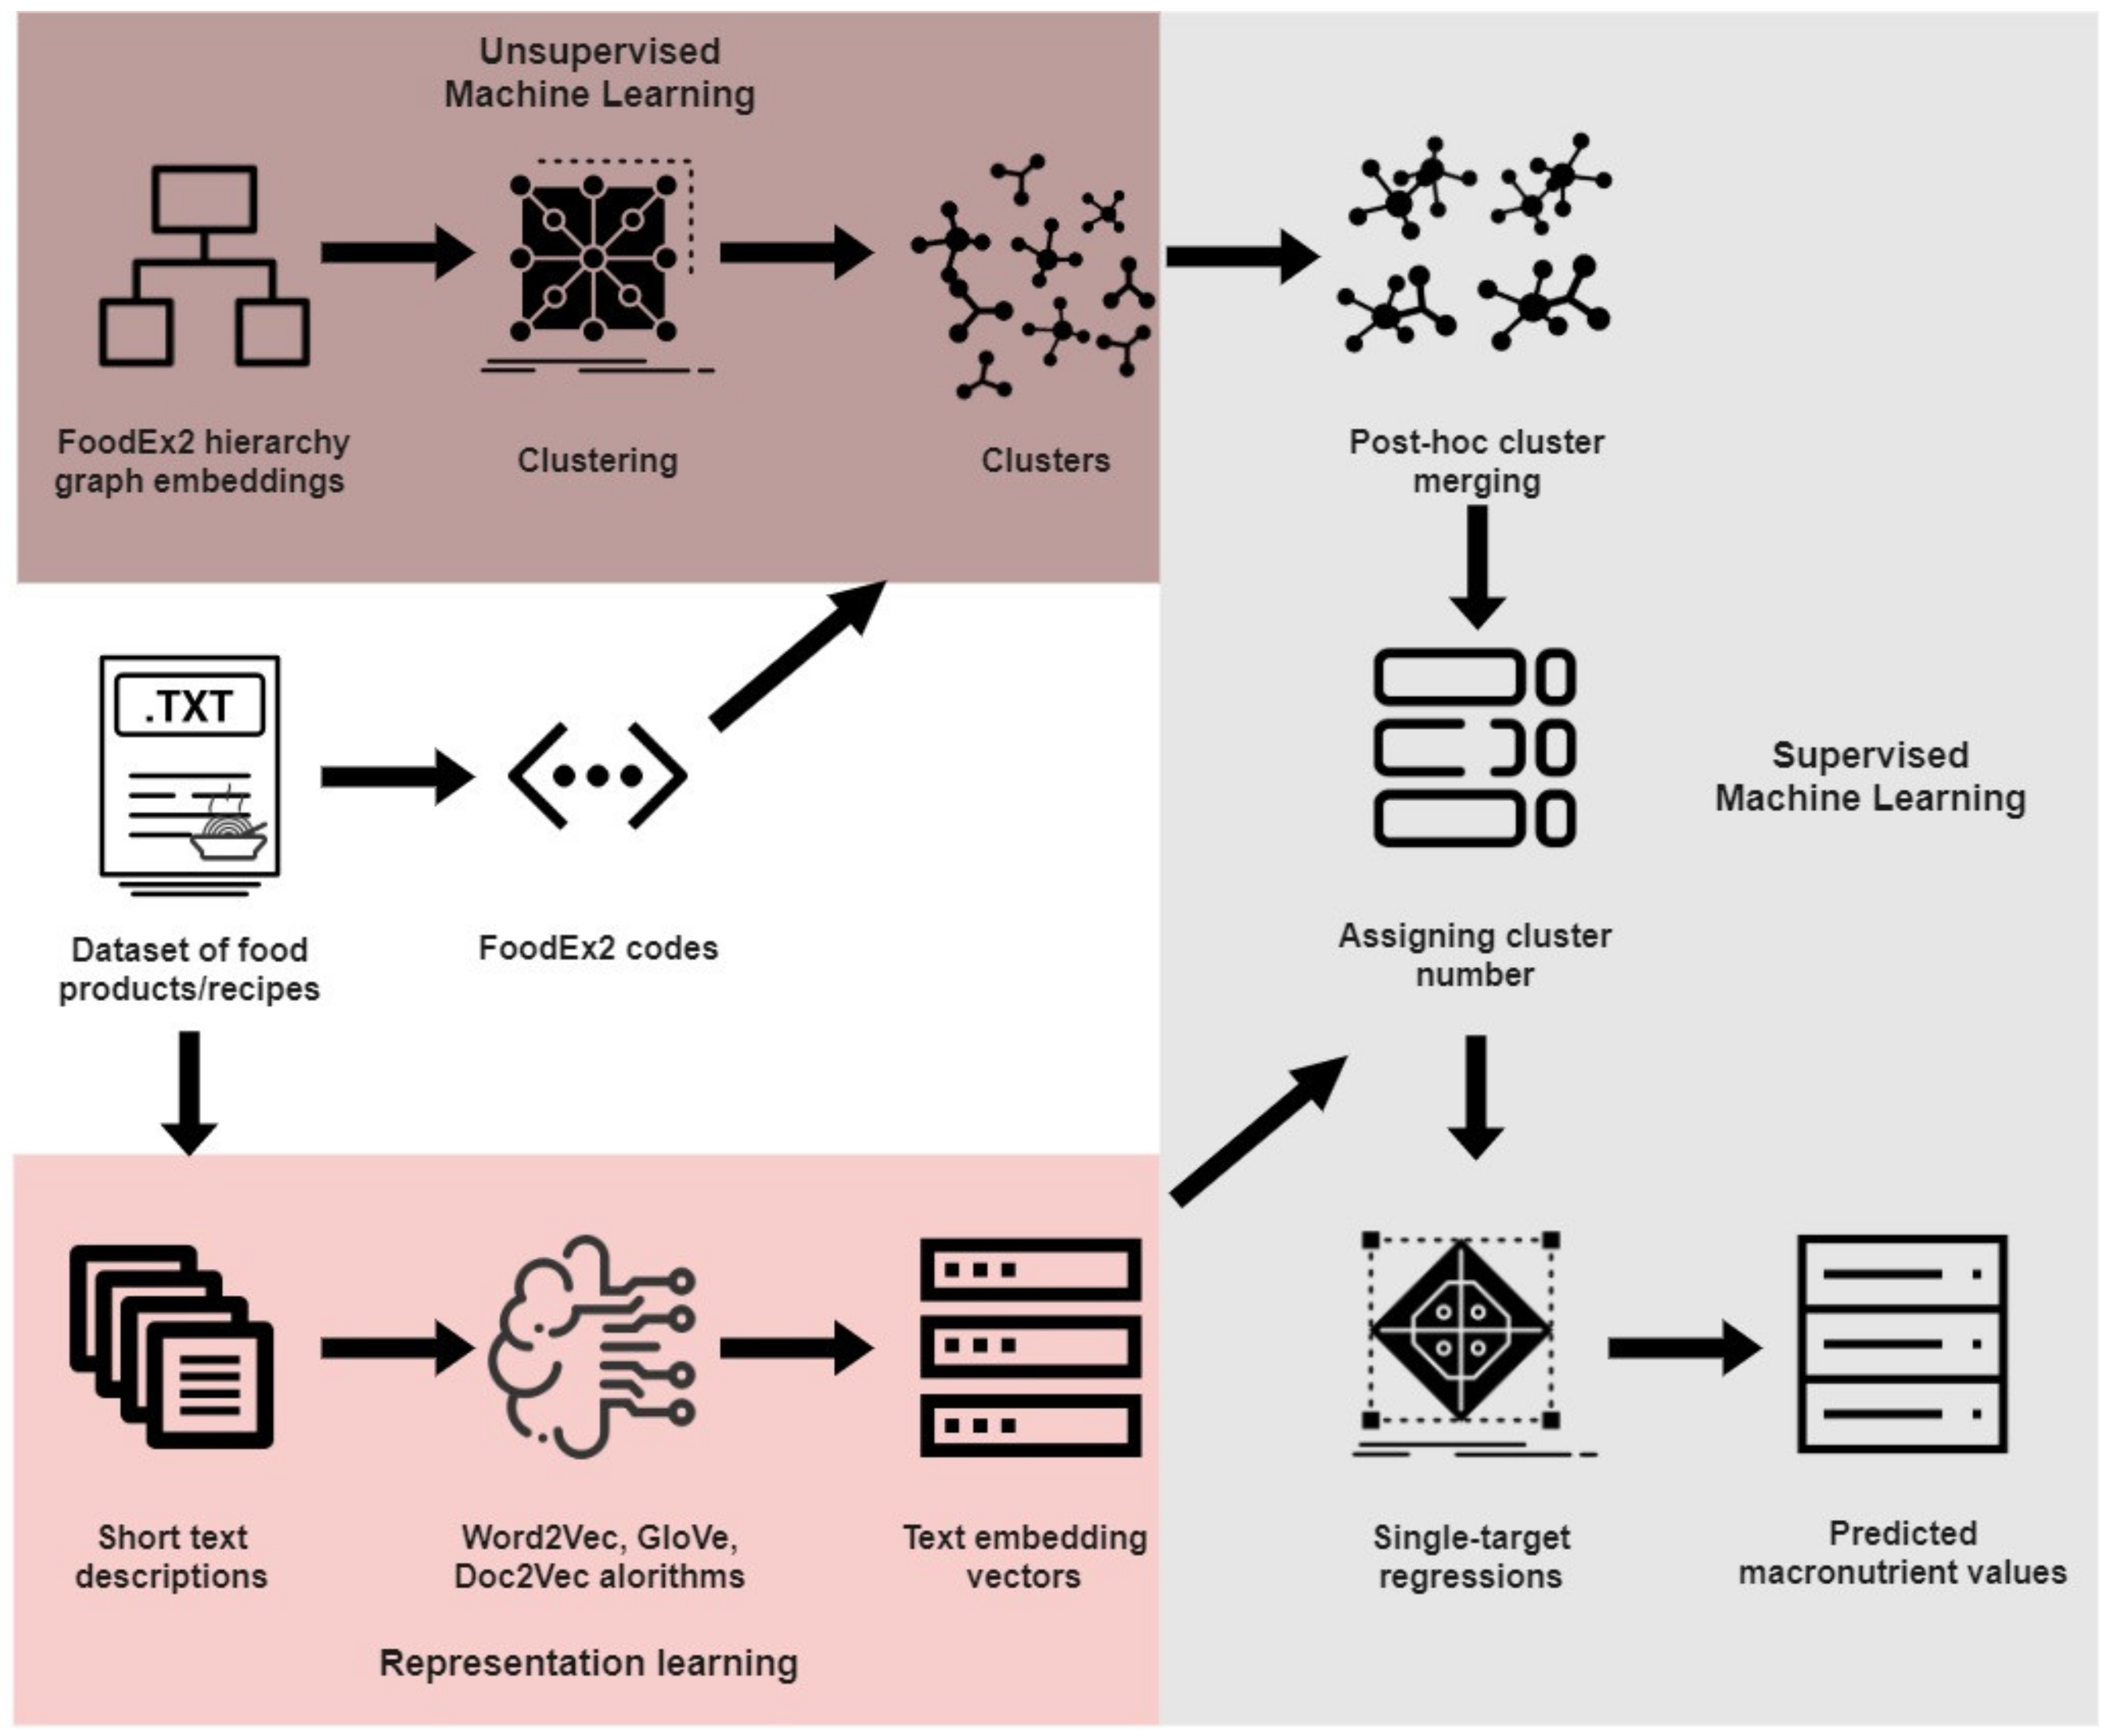
On
Figure 1 a flowchart of the methodology is presented. Our methodology is consisted of three separate parts: representation learning and unsupervised machine learning, conducted independently, and then combined in supervised machine learning.
The idea is: (i) represent text descriptions in vector space using embedding methods, i.e., semantic embeddings at sentence/paragraph level of short food descriptions, (ii) cluster the foods based on their FoodEx2 codes [
40] using graph embeddings [
39], (iii) perform post-hoc cluster merging in order to obtain more evenly distributed clusters on a higher level of the FoodEx2 hierarchy, (iv) apply different single-target regression algorithms on each cluster having the embedding vectors as features for predicting separate macronutrient values (carbohydrates, fat, protein and water), (v) evaluate the methodology by comparing the predicted with the actual values of the macronutrients.
2.3.1. Representation Learning
The starting point is the textual data, in our case the short text descriptions of the food products/recipes, alongside with their FoodEx2 codes and macronutrient values. For representing the textual data as vectors, the embeddings are generated for the whole food product name/description, using two different approaches:
1. Learning word vector representations (word embeddings) with the Word2Vec and GloVe methods – The vector representations of the whole description are obtained with merging separate word embeddings generated for each separate word in the sentence (food product name/description). If
as a food product description consisted of
words:
And
is the vector representation (embedding) of a separate word:
where
,
being the number of words in the description, and
is the dimension of the word vectors, which is defined manually for both Word2Vec and GloVe. These vectors are representations of words, to obtain the vector representations for the food product description we apply two different heuristics for merging the separate word vectors. Our two heuristics of choice are:
Average – The vector representation for the food product description is calculated as an average from the vectors of the words from which it consists of:
Sum – The vector representation for each food product/recipe description is calculated by summing the vector representations of the words it consists of:
where
and
are the merged embeddings, i.e., embeddings for the whole description. When generating the Word2Vec and GloVe embeddings, we considered different values for the dimension size and sliding window size. The dimension sizes of choice are [50,100,200], also for the Word2Vec embeddings we considered the two types of feature extraction available: CBOW and SG. For these dimensions we assign different values to the parameter called ’sliding’ window. This parameter indicates the distance within a sentence between the current word and the word being predicted. The values of chose are [2,3,5,10] because our food product descriptions are not very long – the average number of words in a food product description in the dataset is 11, while the maximum number of words is 30). By combining these parameter values, 24 Word2Vec models were trained, plus considering the heuristics for combining, a total of 48 models, while with GloVe a total of 24 models were trained.
2. Learning paragraph vector representations with Doc2Vec algorithm – The Doc2Vec algorithm is used to generate vector representations for each description (sentence). If
is the description of the food product/description, then
is the sentence vector representation generated with Doc2Vec is as follows:
where
is the predefined dimension of the vectors. Same as the two chosen word embedding methods, we considered different dimension sizes and sliding window sizes, specifically [2,3,5,10] for the sliding window and [50,100,200] for the dimension size. We also considered the two types architectures in the Doc2Vec model - PV-DM and PV-DBOW, and we used the non-concatenative mode (separate models for the sum option, and separate for the average option) because if we used the concatenation of context vectors rather than sum/average the result would be a much-larger model. Taking into account all these parameters there are 48 Doc2Vec models trained in total.
2.3.2. Unsupervised Machine Learning
Foods exhibit large variations in the nutrient content, therefore have very unbalanced macronutrient content. The dataset in our experiments includes a broad variety of foods, which implies that the content of a macronutrient can go from one extreme to another. Therefore, it goes without saying that in order to have better predictions for the content of macronutrients, food items should be grouped by some similarity. Here, the FoodEx2 codes that are available come into use, since they already contain domain knowledge, and based on them food items are grouped in food groups and broader food categories in the FoodEx2 hierarchy [
40].
Independently of the representation learning process, we used the method presented in [
39], where the FoodEx2 hierarchy is presented as Poincaré graph embeddings and then the FoodEx2 codes based on these embeddings are clustered into 230 clusters. This clustering process is performed on the bottom end of the hierarchy, i.e., on the leaves of the graph. Given that our dataset is rather small compared to the total number of FoodEx2 codes in the hierarchy, and the fact that when assigned a cluster number some of the clusters in our dataset will contain very few or no elements at all, we decided to do a post-hoc cluster merging. The post-hoc cluster merging is performed following a bottom up approach, the clusters are merged based on their top-level parents, going level deeper until we have as evenly distributed clusters as possible.
2.3.3. Supervised Machine Learning
The last part of the methodology is the supervised machine learning part, which on input receives the outputs from the representation learning part and the unsupervised machine learning part. This part consists of applying single-target regression algorithms in order to predict the separate macronutrient values.
Separate prediction models are trained for each macronutrient, because from the conducted correlation test (Pearson’s correlation coefficient) we concluded that there is no correlation between the target variables. In a real-time scenario, it is somewhat hard to select the right machine learning algorithm for the purpose. The overall most accepted approach is to select few algorithms, select ranges for the hyper-parameters for each algorithm, perform hyper-parameter tuning, and evaluate the estimators’ performances with cross-validation by the same data in each iteration, benchmark the algorithms and select the best one(s). When working with regression algorithms, the most common baseline is using mean or median (central tendency measures) of the train part of the dataset for all the predictions.
2.3.4. Tolerance for Nutrient Values
The main goal is obtaining macronutrient values which are expressed in grams, and by international legalizations and regulations can have defined tolerances. The European Commission Health and Consumers Directorate General in 2012 published [
45], with the aim to provide advised recommendations for calculation of the acceptable differences between quantities of nutrients on the label declarations of food products and the ones established in Regulation EU 1169/2011 [
46]. These tolerances for the food product labels are important as it is impossible for foods to contain the exact levels of nutrients that are presented on the labels, as a consequence of the natural variations of foods, as well as the variations occurring during production and the storage process. However, the nutrient content of foods should not deviate substantially from labelled values to the extent that such deviations could lead to consumers being misled. From the tolerance levels stated in [
45], for our particular case we used the tolerance levels for the nutrition declaration of foods that do not include food supplements, out of which we used the needed information presented in
Table 2 – where the allowed deviations are presented for each of the four macronutrients, depending on their quantity in 100 grams of the food in matter. These tolerance levels are included at the very final step in our methodology in the determination on how accurate the predicted macronutrient values are.
3. Results
The first step towards the evaluation is pre-processing of the data. Our dataset for evaluation is a subset from the original dataset, obtained by extracting the English food product descriptions, alongside the columns with the macronutrient values (carbohydrates, fat, protein and water). The text descriptions are tokenized. The punctuation signs and numbers that represent quantities are removed, whereas the percentage values (of fat, of sugar, of cocoa…) which contain valuable information concerning the nutrient content, and stop words which add meaning to the description, are kept. The next step is word lemmatization [
47], separate lemmatizers are used for the English names and the Slovene names. In
Table 3 a few examples of the pre-processed data for the English names are presented.
After obtaining the data in the desired format, the next step is to apply the algorithms for generating embeddings. For this purpose we used the Gensim [
48] library in Python, and the corresponding packages for the Word2Vec and Doc2Vec algorithms. The embedding vectors represent our base for the next steps.
Independently of this process, the data is clustered, i.e., the instances are divided in clusters based on their FoodEx2 codes. In the beginning from the clustering in [
39] there are 230 clusters, when assigned a cluster number, the instances in our dataset are clustered. From this initial clustering we can note that not all clusters have elements in them, and some of them have very few elements. Therefore, the post-hoc cluster merging is performed, where we merge the clusters following a bottom up approach. For our dataset we went for the parents on the third level in the FoodEx2 hierarchy and we obtained 9 clusters. In
Table 4 a few examples from each cluster are given (the English names are given for convenience purposes).
The next step in our methodology is the machine learning part – applying single-target regressions according to the following setup:
Select regression algorithms – Linear regression, Ridge regression, Lasso regression, and ElasticNet regression (using the Scikit-learn library in Python [
49]).
Select parameter ranges for each algorithm and perform hyper-parameter tuning – Ranges and values are a priori given for all the parameters for all the regression algorithms. From all the combinations the best parameters for the model training are then selected with GridSearchCV (using the Scikit-learn library in Python [
49]). This is done for each cluster separately.
Apply k-fold cross-validation to estimate the prediction error – We train models for each cluster using each of the selected regression algorithms. The models are trained with the previously selected best parameters for each cluster and then evaluated with cross-validation. We chose the matched sample approach for comparison of the regressors, i.e., using the same data in each iteration.
Apply tolerance levels and calculate accuracy – The accuracy is calculated according to the tolerance levels in
Table 2. If
is the actual value of the
instance from the test set on a certain iteration of the k-fold cross-validation, and
is the predicted values of the same,
, instance of the test set, then:
is the absolute difference between the two set values. We define a binary variable that is assigned a positive value if the predicted value is in the tolerance level.
At the end we calculate the accuracy as the ratio of predicted values that were in the ‘allowed’ range, i.e., tolerance level:
where
is the number of instances in the test set. The accuracy percentage is calculated for the baseline mean and baseline median as well – the percentage of baseline values (means and medians from each cluster) that falls in the tolerance level range, calculated according to Equations (6)–(8), where
is the actual value of the
instance from the test set on a certain iteration of the k-fold cross-validation, and instead of
we have:
where
is the number of instances in the train set, and
is the train set sorted in ascending order.
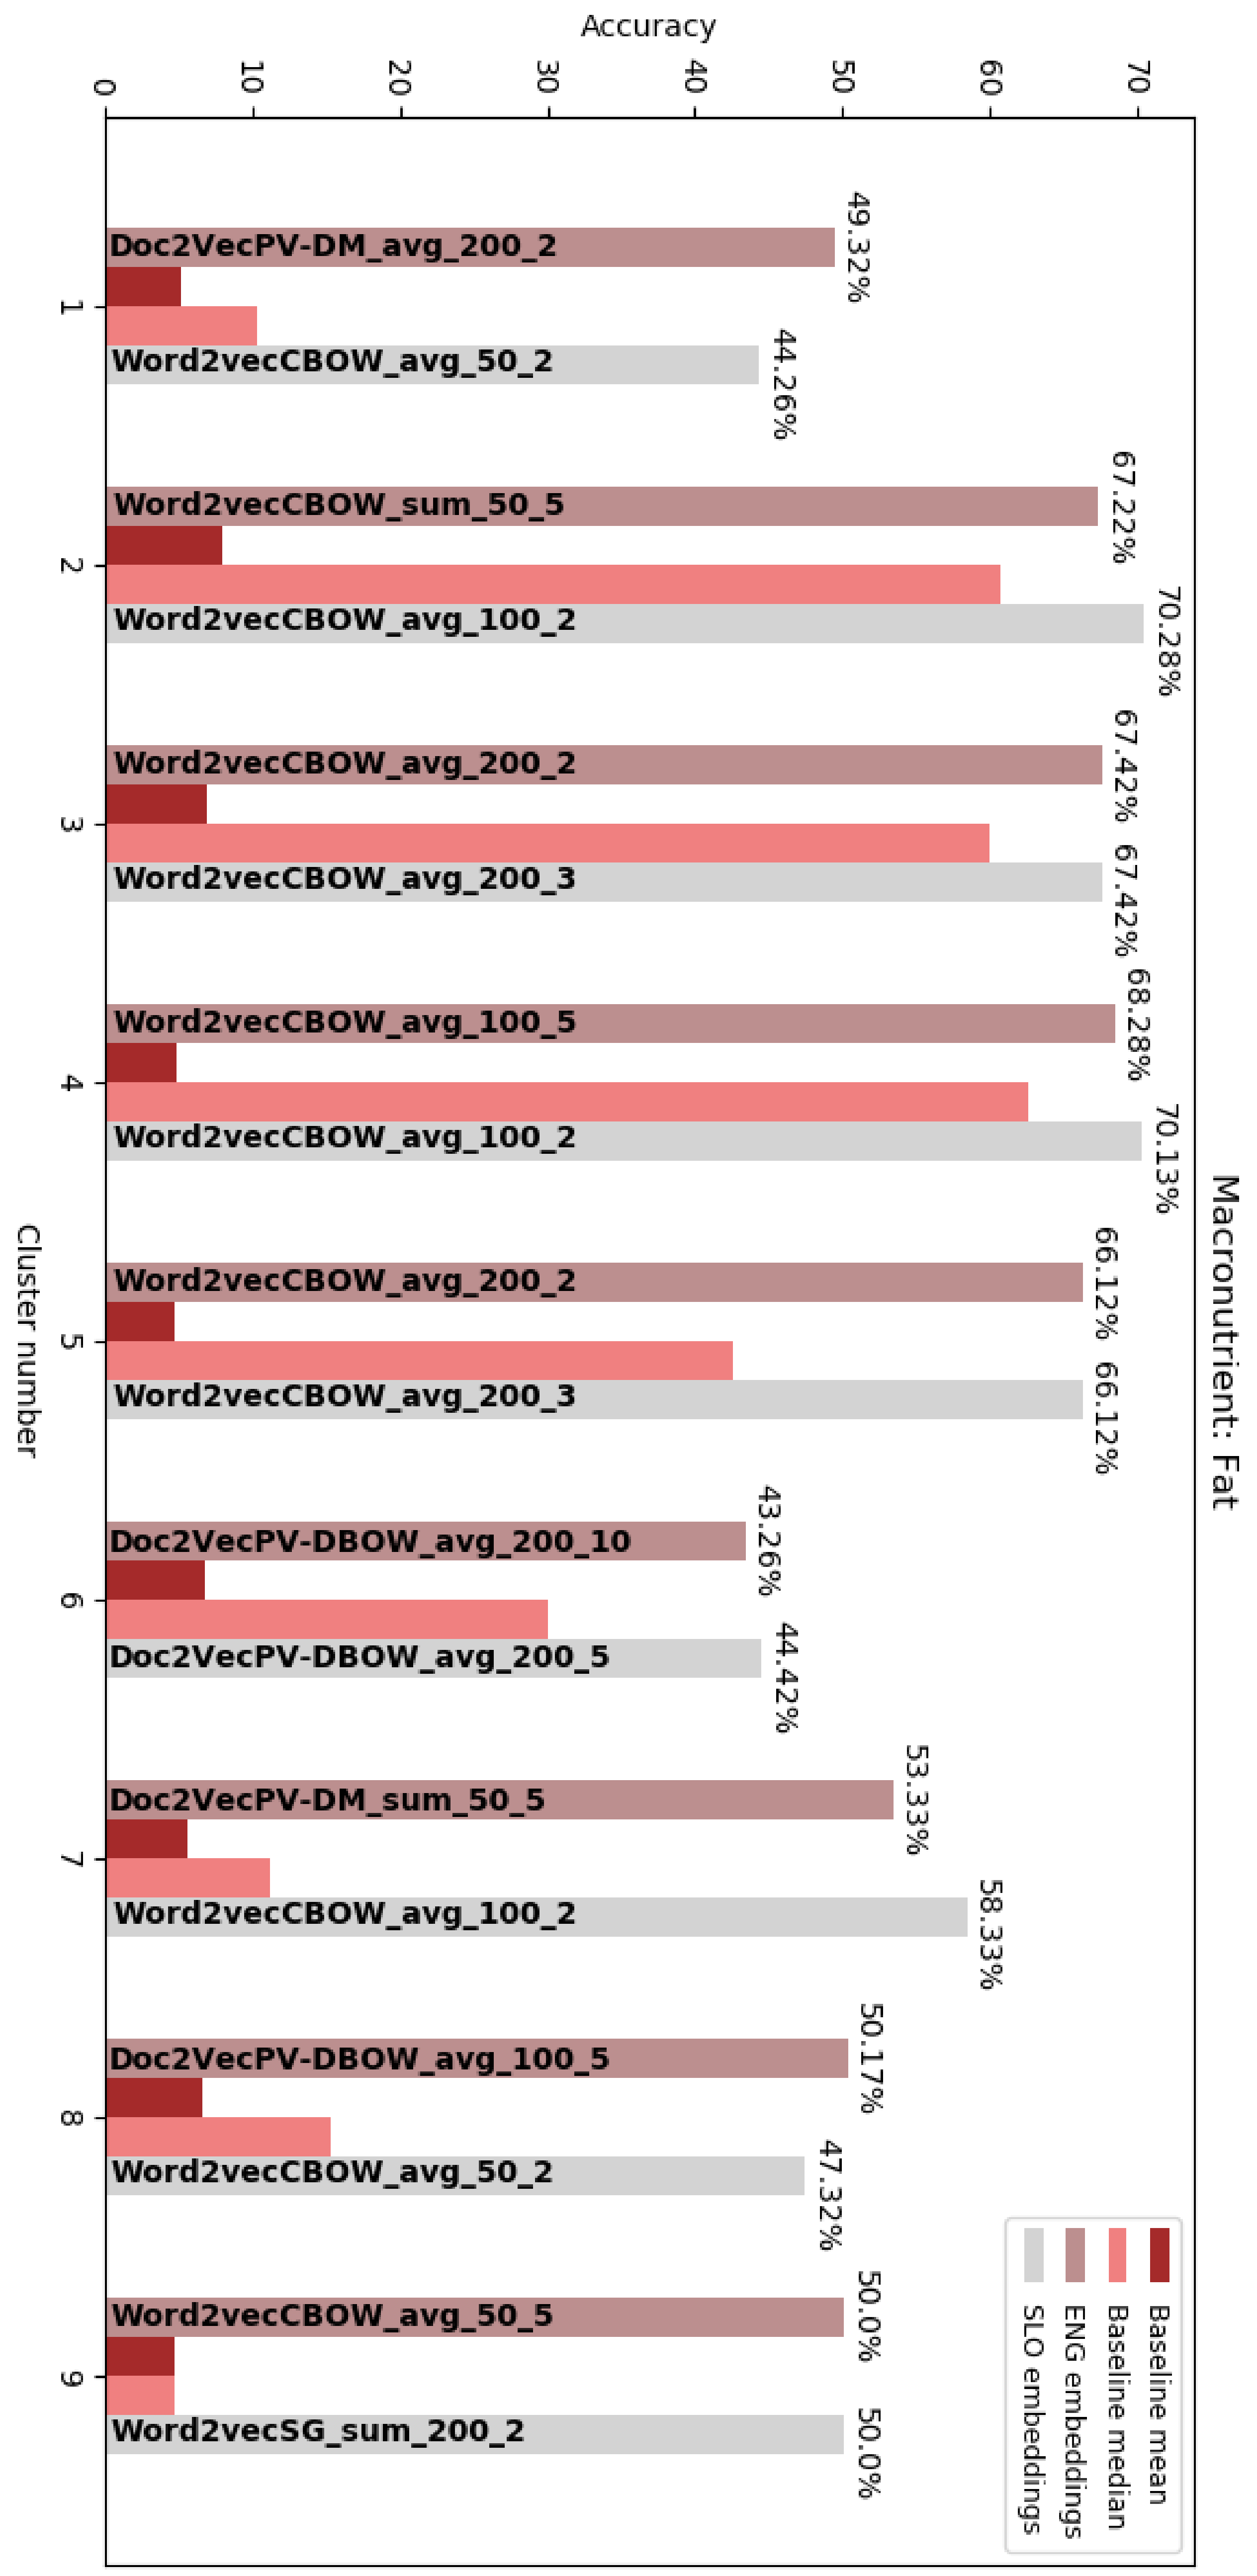
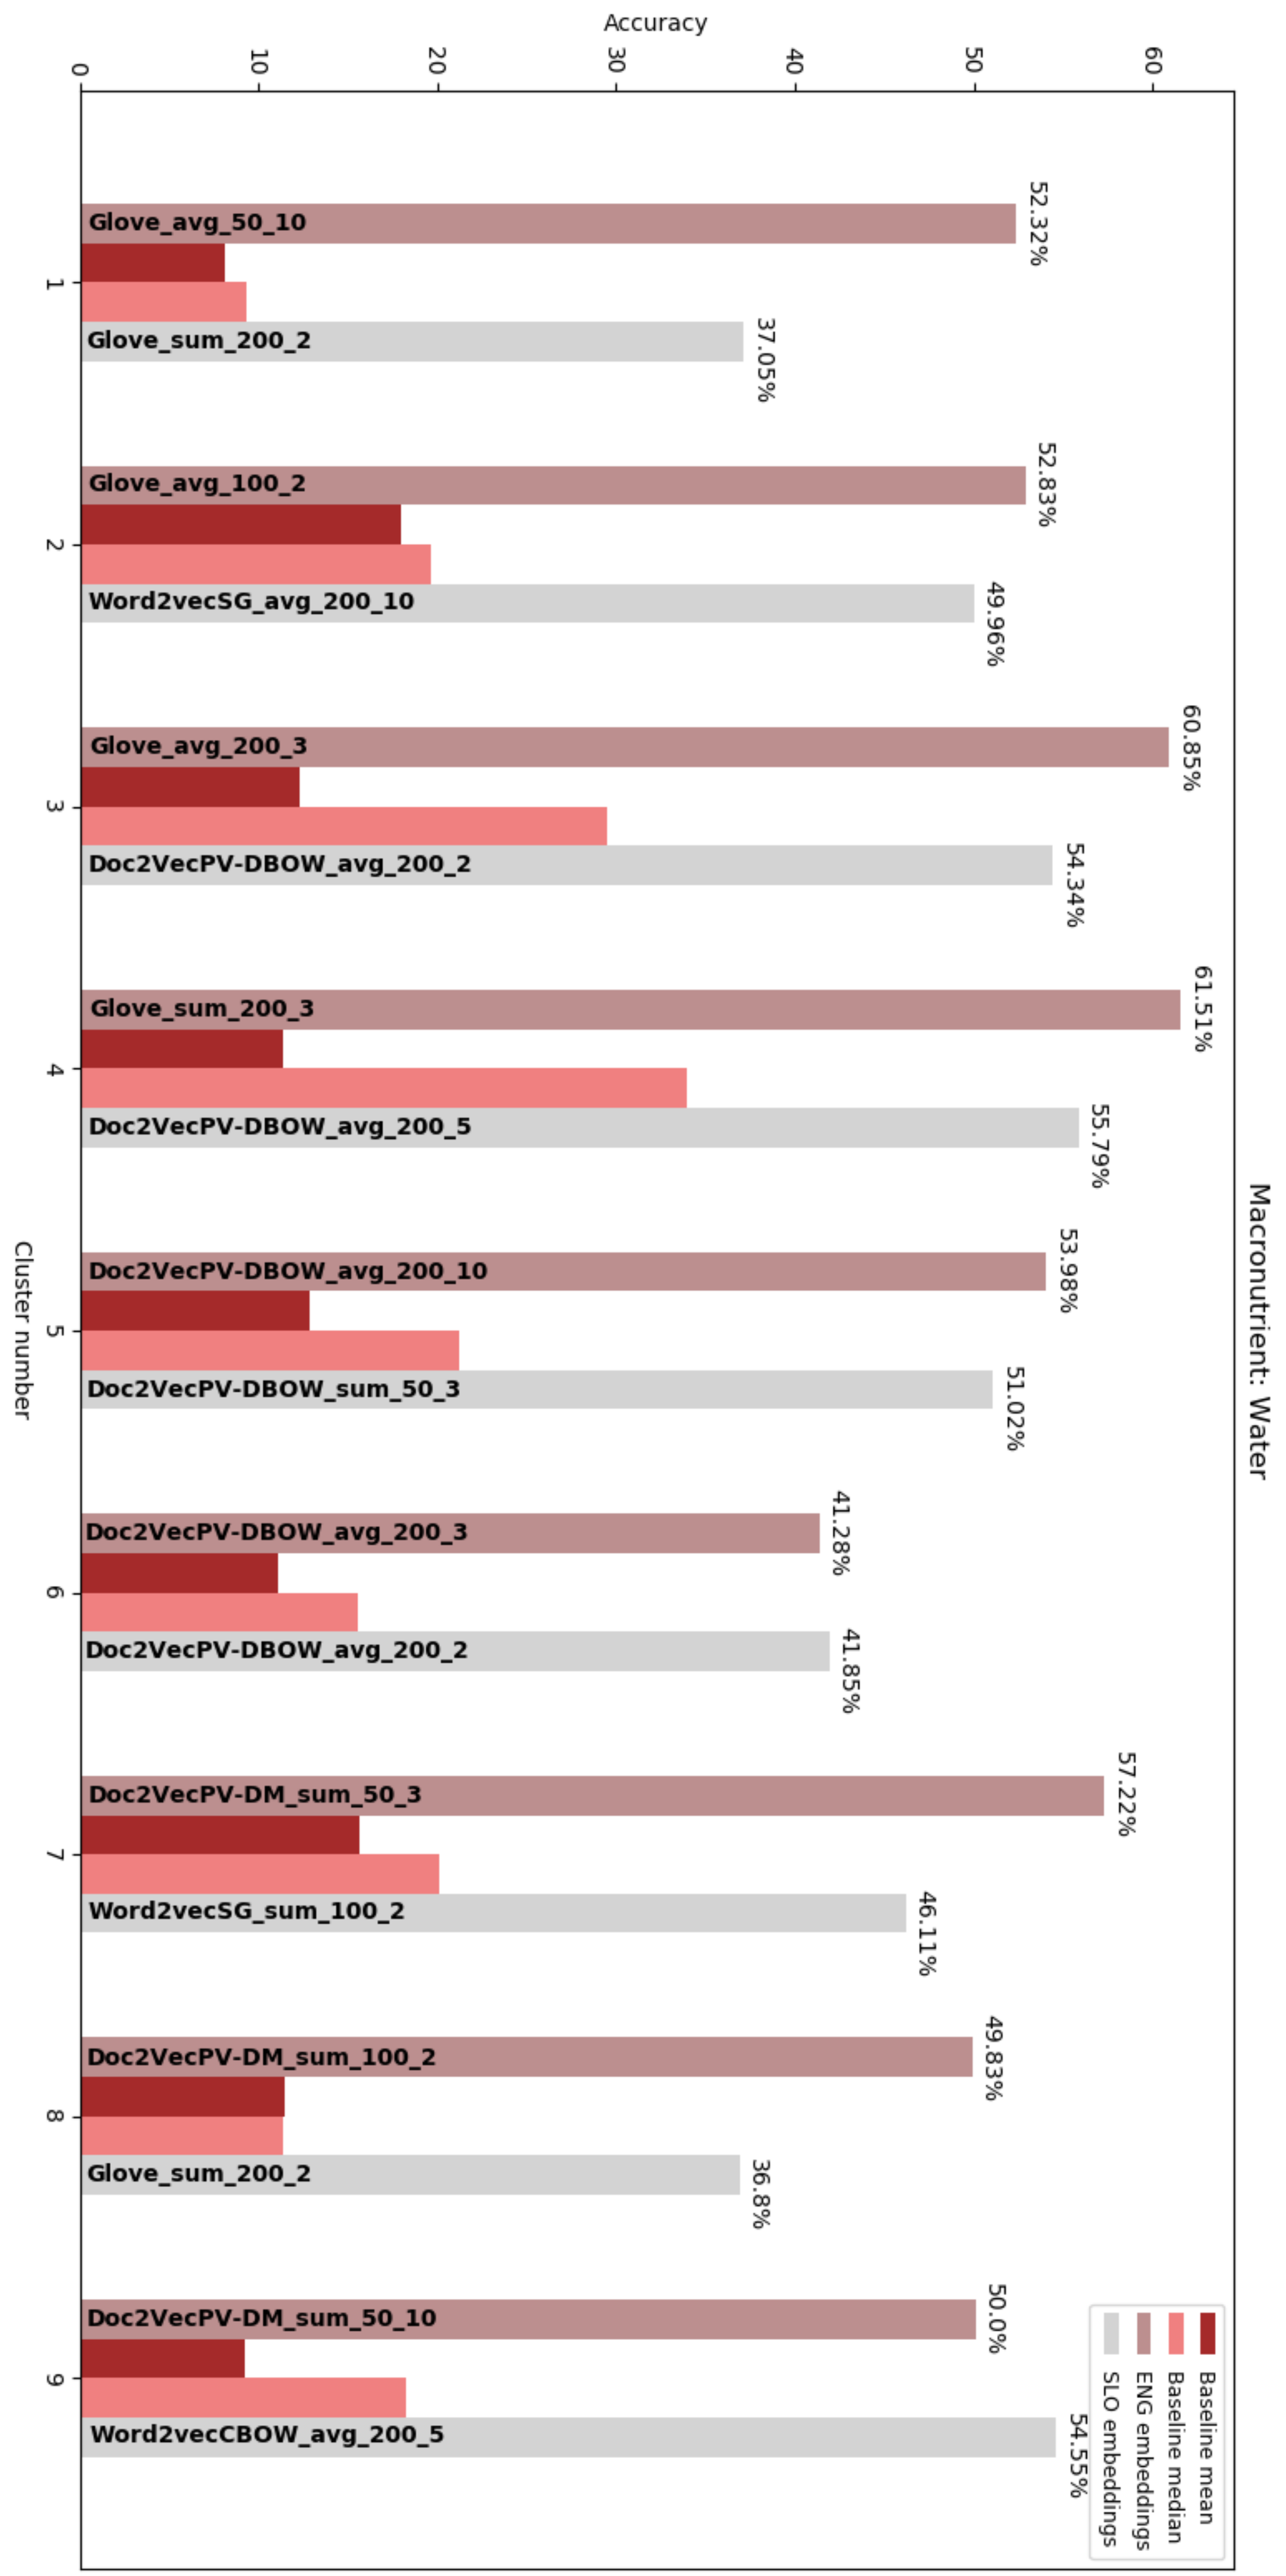
The accuracy percentages are calculated for each fold in each cluster, and at the end for each cluster we calculate an average of the percentages from each fold. In
Table 5 the results obtained from the experiments with the embeddings generated from the English names are presented, and in
Table 6 with the embeddings generated from the Slovene names.
In these tables we give the accuracy percentages from the predictions for each target macronutrient in each cluster. From these tables we can see that having the Word2Vec and Doc2Vec embeddings as features for the regressions yielded better results in more cases than having the GloVe embedding vectors as inputs to the regressions, but this difference is not big enough to say that these two embedding algorithms outperformed GloVe. In
Figure 2,
Figure 3,
Figure 4 and
Figure 5 the results for each target macronutrient are presented graphically.
In the graphs, for each target macronutrient, for each cluster, we give the best result obtained with the embedding vectors from the English and Slovene names and compare them with the baseline mean and median for the particular cluster. In the graphs the embedding algorithm that yields the best results alongside with the parameters and heuristic is given as:
where,
is the embedding algorithm (Word2Vec, GloVe or Doc2Vec). We can see that the embedding algorithm that yields the best results changes, but the in all cases the embedding algorithm gives better results than the baseline methods. In
Table 7, we present the embedding algorithms (with all the parameter used) that gave the best results for each target macronutrient in each cluster, alongside with the regression algorithm used for making the predictions.
4. Discussion
From the obtained results we can observe that the highest percentage of correctly predicted macronutrient values is obtained in cluster 9, for the prediction of carbohydrates: 86,36%, 81,82% and 72,73% for the English names and 86,36%, 72,73% and 86,36% for the Slovene names, and for the Word2Vec, GloVe and Doc2Vec algorithms appropriately, whereas the baseline (both mean and median) is more than half less. Following these results are the predictions for protein quantity in the same cluster, and then the predictions for protein and carbohydrates in cluster 7. When inspecting these two clusters, we concluded that these were the only two clusters that were not merged with other ones, therefore, the FoodEx2 hierarchy is on a deeper level, and the foods inside these clusters are more similar to each other compared to food in other clusters. Cluster 9 consists of types of egg products, and simple egg dishes – each of these foods have almost identical macronutrients because they only contain one ingredient – eggs. Cluster 7, on the other hand contains fish products, either frozen or canned. If we do not consider the results from these two clusters, then the best results are obtained for protein predictions in cluster 4 (70%–72%) and fat predictions (66%–68%), but compared to the baseline median of that cluster, they are not much better, but if we look at the results from the protein predictions in cluster 8 (60%–67%) we can see that the obtained accuracies are much higher than the baseline mean and median for this cluster. Cluster 8 mainly contains types of processed meats, which can vary notably in fat content, but have similarities in the range of protein content.
For comparison reasons, we also ran the single-target regressions without clustering the dataset. The results are presented in
Figure 6.
From this graph we can conclude the same – the embedding algorithms give better results than the baseline mean and median (in this case of the whole dataset), for each target macronutrient. The best results, again, are obtained for the prediction of protein content (62%–64%).
In
Table 8, we give the parameters for the embedding algorithms and the regressors with which the best results were obtained without clustering the data.
From these results, it is worth arguing that modeling machine learning techniques on food data previously clustered based on FoodEx2 codes would yield better results than predicting on the whole dataset. If we compare the performances of the three embedding algorithms, it is hard to argue if one outperformed the others, or if one underperformed compared to the other two. This outcome is due to the fact that we are dealing with fairly short textual descriptions.
Given the fact that the results with the clustering are better than the results without, and we rely so strongly on having the FoodEx2 codes in order to cluster the foods, the availability of the FoodEx2 codes is of big importance and therefore a limitation of the methodology. For this purpose, we can rely on a method such as StandFood [
50], which is a natural language processing methodology developed for classifying and describing foods according to FoodEx2. When this limitation is surpassed, the application of our method can be fully automated.
From a theoretical viewpoint this methodology considers the benefits of using representation learning as the base of a predictive study, and proves that dense real-valued vectors can capture enough semantics even from a short text description (without including the needed details for the task in question – in our case, measurements or exact ingredients) in order to be considered in a predictive study for complicated and value-sensitive task such as predicting macronutrient content. This study offers a fertile ground for further exploration of representation learning and considering more complex embedding algorithms – using transformers [
51,
52] and fine tuning them for this task.
From a managerial viewpoint the application of this methodology opens up many possibilities for facilitating and easing the process of calculating macronutrient content, which is crucial for dietary assessment, dietary recommendations, dietary guidelines, macronutrient tracking, and other such tasks which are key tools for doctors, health professionals, dieticians, nutritional experts, policy makers, professional sport coaches, athletes, fitness professionals, etc.


