Abstract
The carrying capacity of the environment for a population is one of the key concepts in ecology and it is incorporated in the growth term of reaction-diffusion equations describing populations in space. Analysis of reaction-diffusion models of populations in heterogeneous space have shown that, when the maximum growth rate and carrying capacity in a logistic growth function vary in space, conditions exist for which the total population size at equilibrium (i) exceeds the total population that which would occur in the absence of diffusion and (ii) exceeds that which would occur if the system were homogeneous and the total carrying capacity, computed as the integral over the local carrying capacities, was the same in the heterogeneous and homogeneous cases. We review here work over the past few years that has explained these apparently counter-intuitive results in terms of the way input of energy or another limiting resource (e.g., a nutrient) varies across the system. We report on both mathematical analysis and laboratory experiments confirming that total population size in a heterogeneous system with diffusion can exceed that in the system without diffusion. We further report, however, that when the resource of the population in question is explicitly modeled as a coupled variable, as in a reaction-diffusion chemostat model rather than a model with logistic growth, the total population in the heterogeneous system with diffusion cannot exceed the total population size in the corresponding homogeneous system in which the total carrying capacities are the same.
1. Introduction
Partial differential equations have long been used in spatial ecology, usually in the form of reaction-diffusion equations, to describe such phenomena as spatial pattern formation (e.g., references [1,2,3]), the spread of populations in space (e.g., references [4,5]), and the effects of spatial heterogeneity on populations (e.g., reference [6]).
The last of these mentioned, the effects of spatial heterogeneity on populations, has relevance to the general question of what population size can be supported on a landscape or region that is heterogeneous in habitat quality for various species; i.e., resource availability. The question arises in relation to a population that is being exploited for economic needs or that is an object of conservation. The term ‘carrying capacity’ is usually used to mean the maximum population size that could be sustained in a given habitat (e.g., references [7,8]) The term was originally used in livestock management to describe the number of domestic animals that can be sustained in a given managed area, but was extended by ecologists in the 1930s to describe the number of wild animals that could be sustained in a natural area [9], such as predators in a nature reserve [10]. Further, carrying capacity is used to describe the sustained ecological services that can be provided for human and ecological populations by terrestrial or aquatic ecosystems [11,12,13,14]. Therefore, carrying capacity now covers a range of uses. Because of its importance, the effects of various factors, such as climate change [15], environmental stressors [16], and human impact [17] on carrying capacity in various contexts have been studied.
Carrying capacity has usually been assumed to reflect the amount of resources available to the population. With this interpretation, carrying capacity can be formulated in a mathematical way, by equating carrying capacity with the constant K in the Pearl-Verhulst version of the logistic equation [18]:
where u is population size or abundance, r is the maximum grow rate of the population, and t is time. This formulation focuses the problem on measuring K. However, such measurement is often not easy when dealing with populations in the wild, which are affected by many environmental factors, not just resources, and are observed to fluctuate strongly through time. Therefore, ways to include time dependence have been developed in various directions [19,20].
Despite some vagueness in their meaning and measurement, both the Pearl-Verhulst logistic equation and carrying capacity have remained major features in population ecology textbooks and theoretical models. Studying equations such as (1), even in the absence of precise data, can give insights into ecological questions, such as how the population size might respond when subject to perturbations. The need to extend the logistic population model to space and to include capacity for organism movement was realized [21,22]. To extend this model to populations over a spatial area such as a landscape or region partial differential equations are useful tools. If the spatial movement of the population can be approximated as diffusion, then the logistic equation may look like:
where is the Laplacian and D is the diffusion coefficient, where now u is a function of both time and space, x, defined on region . If the environmental conditions of the landscape or region of interest are homogeneous, then the parameters r and K will be constants. If, however, that is not true, then r(x) and K(x), can be defined as the local growth rates and carrying capacities at locations x.
Although carrying capacity has largely been used with the assumption of a relatively uniform or homogeneous environment, it might at first seem that the extension of carrying capacity to the whole spatial region would be a fairly straightforward adding up of the local carrying capacities, through integrating K(x) over region ; i.e., . However, extending the logistic equation to space leads to results that show that such an extension is not a simple matter. Using a simplified form of Equation (2), in which maximum growth rate and carrying capacity are combined into one spatially varying parameter, g(x), Lou [23] (see also references [24,25]) solved for the total population size of a population diffusing in a heterogeneous spatial region described by the equation:
where g(x) varies with the spatial distance x but is constant temporally. The population diffuses at a constant rate D, with Neumann (no-flux) boundary conditions on u. Lou (2006) [23] showed, dividing the terms of the right-hand side by u and integrating over space Ω, that the following equation holds at equilibrium:
Because the first term is necessarily positive; i.e.,
it implies that
The total population size can be defined as . We will follow reference [26] to use the term ‘total realized asymptotic population abundance’ . (TRAPA). It is clear from (6) that:
that is, it is greater than the integral over all local values of the carrying capacity, g(x).
The results of reference [23] are for a special case of the logistic equation in which one spatially varying parameter, g(x), replaces both r(x) and K(x) of the Pearl-Verhulst growth function. To examine the separate effects of growth and carrying capacity, DeAngelis, et al. [27] extended the analysis to Equation (2). The equation:
is difficult to analyze for all values of diffusion, but can be evaluated in the limits D → 0 and D When the diffusion rate is small, it was established in [27,28] that it is possible for although this becomes an equality in the limit as D→ 0. For the case D approaches infinity (i.e., diffusion rate becomes much larger than growth rate), the authors show that can hold, if there is a positive correlation between K(x) and r(x). Specifically, they show that for , u approaches the asymptotic value ud, where:
From (9) it can be shown that, in the case that r(x)/K(x) is strictly decreasing with x:
In the case that r(x)/K(x) is strictly increasing with x:
Therefore, the situation in which TRAPA exceeds the spatial integral over K(x) is only a special case of a positive correlation of r(x) and K(x), and the reverse is also possible. The result of reference [23] in Equation (3) is due to the fact that g(x) is both the maximum growth rate and carrying capacity, which results in these being positively correlated.
The question can be asked: What is the reason for the puzzling result that TRAPA can exceed the integral of K(x) over space? A qualitative interpretation of both inequalities (7) and (11) is that diffusion of individuals away from areas of locally high growth rate, r(x), and high local carrying capacity, K(x), keeps the population levels in those areas below K(x), so that new production exceeds losses at steady state in those areas. At the same time, diffusion from these areas of higher production to areas of lower r(x) and K(x) allows population levels in those low production areas to exceed the local K(x) in those areas. Sometimes it causes the total population over all space to exceed that which would occur in a homogeneous space with the same total carrying capacity. But this situation is limited to positive correlation between r(x) and K(x). In reality, the parameters r(x) and K(x) may not necessarily be positively correlated, so the increase in TRAPA with diffusion in heterogeneous space is not a general phenomenon, although we will see later that a positive correlation is likely.
2. Analogy and Insight from Spatially Discretized Model
The puzzling effects shown by the reaction-diffusion equation for population growth and diffusion in heterogeneous space can perhaps be better understood by referring to historically earlier analysis of a simplified system of a population diffusing between two different discrete patches with different values of r and K. As above, assume that growth is described by the Pearl-Verhulst logistic equation, and that symmetric transfer rates, D, thus random or diffusive movement, are assumed to exist between the patches. The equations for the two patches then have the form:
where ri is the maximum growth rate and Ki is henceforth defined as the local carrying capacity on patch i. It can be shown that for D → ∞; that is, when the movement rates between the compartments are large compared to population growth rates, so that perfect mixing of the population between the patches occurs, the following expression for population size holds at equilibrium:
This expression was found by reference [29], and corrected for typos by reference [30] and reference [26]. From Equation (13) it follows that, if K1 > K2 and r1/K1 > r2/K2, the total realized asymptotic population abundance at equilibrium (TRAPA) exceeds the sum of the local carrying capacities of the two patches; that is,. These conditions on the values of ri and Ki are the discrete space version of the positive correlation between r(x) and K(x). This result was extended to n patches by Zhang et al. [31], where it was shown that this inequality applied for all D > 0. In addition, in reference [31], experimental manipulations simulating diffusion of a floating aquatic plant, duckweed, among patches lent support to the theoretical results.
Equation (13) also implies that in the heterogeneous case, i.e., , the total equilibrium population size with diffusion, , for K1 > K2 and r1/K1 > r2/K2, with D → ∞, exceeds the total populations on patches for the case in which the carrying capacities are homogeneous, which occurs where . This result also applies to other forms of the logistic equation beyond the Pearl-Verhulst form. When the growth terms are replaced by the original Verhulst form:
a variation on (13):
can be derived, where again the sum of the equilibrium populations,, can exceed the sum of the individual carrying capacities, [28].
The result that TRAPA for a landscape in which the total carrying capacity is heterogeneous (local carrying capacities K1 plus K2 in a two-patch system) is greater than that of the homogeneous landscape (½ (K1 + K2) in each patch) when K1 > K2 and r1/K1 > r2/K2, has a simple explanation. Consider the two-patch system. The total input of energy or limiting resources in the heterogeneous case is r1K1 + r2K2, while the the equivalent in the homogeneous case is [r1(K1 + K2)/2 + r2(K1 + K2)/2]. These are not the same, so the total population sizes supported should also not be the same. It is the input of limiting energy (or other limiting resource) that is fundamental in nature. Carrying capacity is simply a resultant quantity. Therefore, there is a hidden assumption, when one is simply varying the local carrying capacities, of changing the total energy (or other limiting resource) input. These considerations apply not only to the two-patch system, but to all spatial systems with a potentially heterogeneous growth rate and carrying capacity.
To see this, consider the Pearl-Verhulst equation:
where Ui is in terms of energy or, alternatively, a limiting resource such as a nutrient. At steady state equilibrium, , there is an influx of energy into the population, , producing births and growth of individuals per unit time, and a loss flux of energy , due to metabolic maintenance and mortality resulting from interference with other members of the population [20,32]. Thus, energy through-flow maintains the population. Therefore, when comparing systems with different values of ri and Ki in the patch system, or r(x) and K(x) in the continuous system, it is also necessary to consider if the total energy (or other limiting resource) input is the same in the two systems being compared.
It can be shown that the apparent paradox of greater TRAPA for cases of a heterogeneous region, with or without diffusion, versus TRAPA in the homogeneous case with the same summed local carrying capacities, arises in cases in which greater energy influx has implicitly been assumed for the heterogeneous case. This can be examined mathematically. To show that is the case, we follow reference [33] to consider the Pearl-Verhulst equations with the energy input requirement for the population implemented. Energetic (or other limiting resource) requirements on the population growth will be shown to explain the paradoxical behavior for D → ∞.
For the Pearl-Verhulst model for the two-patch system, we have:
This implies that, for K1 > K2 and r1/K1 > r2/K2, the relationships
hold, where K1 + K2 has the same value for each of these three cases and the values of r1 and r2 are also the same in all cases. The values of all of the TRAPAs are shown as functions of r1 in Figure 1 for comparison. We can also calculate the influx of energy (or other limiting resource) that is needed by each of the TRAPAs above to be maintained at those levels. We call these ‘ENERGY TRAPAs’:
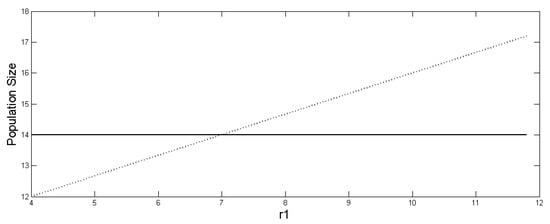
Figure 1.
Size of (dotted) and and , (solid, overlapping) as function of r1. The ratio r1/K1 > r2/K2 holds after r1 > 7. The other parameter values are r2 = 3.5, K1 = 14, and K2 = 7.
Authors [33] demonstrate that, for the following set of inequalities, K1 > K2 and r1/K1 > r2/K2:
These inequalities imply first, that for r1 > 7 in Figure 2, a greater influx of energy (or other limiting resource) is required to support the heterogeneous system without diffusion (20) than to support the homogeneous system, even though they have the same total population (18). The values of each of the ENERGY TRAPAs as a function of r1 are shown in Figure 2 for comparison. The extra energy input of the heterogeneous system is can be considered to be wasted through greater density-dependent mortality and respiration of the term. Second, when diffusion is allowed in the heterogeneous case, less energy is needed to support the heterogeneous system with diffusion than the heterogeneous system without diffusion, although the population increases when diffusion occurs. Therefore, it is true that , even though . This implies that the heterogeneous system with diffusion is more efficient than the heterogeneous system without diffusion in that it requires less maintenance energy for a higher population. But if only a limited amount of energy (or other limiting resource) is available, then to achieve the largest population, it is not possible to do better than to spread it homogeneously between the patches. Reference [33] further shows that when the energy constraints are applied to limit the way ri and Ki can be assigned among the patches, such that the same amount of energy is input in both the homogeneous and heterogeneous systems, then it is impossible for > .
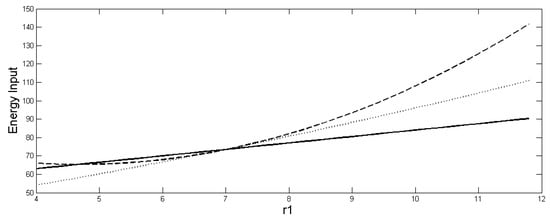
Figure 2.
Size of (dotted) and (dashed) and , (solid) as function of r1. r1/K1 > r2/K2 holds after r1 > 7. The parameter values are the same as in Figure 1.
The results presented in this section are for either two-or multi-patch, systems that are spatially discrete. Extensions to partial differential equations should be straightforward, although we do not know of such analysis for the above results of reference [33].
3. Analysis and Experiment: Consumer-Resource Chemostat Model
With the above constraints on energy, the reaction-diffusion models with logistic growth can be used to compare effects of different parameterizations of the model on population dynamics. However, the use of such logistic equation models for patches connected by diffusion has been criticized in that they are limited to the assumption of fixed resource levels [26,31]. Resources such as energy and nutrients are exploitable and behave as variables. This includes study of microbial populations in laboratory settings, which can be used for testing theory. Therefore, population growth is best modeled using a mechanistic, bottom-up approach with a population of consumers utilizing variable resources [34,35]. This approach is suitable for describing a population in space. It will be shown there that this approach has the advantage of avoiding some of the counter-intuitive results mentioned above for spatial models involving the logistic model to describe growth [36,37].
A general pair of equations for the consumer-resource system is:
where u(x,t) is the consumer population abundance and n(x,t) is the nutrient concentration. Only the consumer is assumed to be diffusing. As before, D is the diffusion rate, while rmax is the asymptotic growth rate under infinite resources. Now k is the half-saturation coefficient, m(x) is the density-independent mortality rate, g(x) is the density-dependent loss rate, Ninput(x) is the nutrient input, η is the loss rate of nutrient from the system, and γ is the yield, representing consumer individuals per unit nutrient.
The consumer-resource chemostat model has the advantage that input of the limiting resource, nutrient in (21b), is explicitly denoted by a single driving function, Ninput(x). Therefore, it can be specified across a spatial region with no ambiguity in what the total energy input is at steady state (or any time); . This differs from the spatial logistic model studied earlier, in which the energy input at steady state is the product r(x)K(x), where r(x) and K(x) are separate variables. The model (21a,b), discretized as 12 patches in a one-dimensional row to facilitate analysis, was used by reference [36] in parallel with an experimental setup on yeast in which a growing yeast population could be manipulated to disperse. The purpose of the model and experiment was to examine the relationship between the size of a population and diffusing in a discretized version of this consumer-resource model with n patches in a one-dimensional line. All patches, except for no-flux conditions for the two end patches, were connected only to their two neighbors. The analysis was designed to evaluate two results that have come out of earlier analyses of the reaction-diffusion model with logistic growth. Zhang et al. [36] did the analysis for two versions of (21a,b); Model 1 with η = 0 and mi = 0, and Model 2 with gi = 0. Two important results came out of the analysis of the consumer-resource model compared with the logistic model and were supported by the experiment.
The first result of the logistic reaction-diffusion model is that if a consumer population exists in an environment in which an exploited renewable resource input is heterogeneously distributed, and there is a positive relationship between growth rate and carrying capacity, then the total steady state of a diffusing population (TRAPA) can attain a greater abundance than the non-diffusing population. It was proven in both Models 1 and 2 of the consumer-resource model over a range of parameter values relevant to the experiment, that:
for the consumer-resource model [36]. Thus, the logistic reaction-diffusion and consumer-resource models are in agreement.
TRAPAheterogeneous,diffusion > TRAPAheterogeneous,no diffusion
The second result of the logistic reaction-diffusion is that a population, TRAPAheterogeneous,diffusion, that is diffusing in an environmental space in which there is a heterogeneously distributed input of exploited limiting resource, can reach a greater steady state abundance (TRAPA) than a population either diffusing (TRAPAhomogeneous,diffusion) or not diffusing (TRAPAhomogeneous,no diffusion) in an environmental space in which the same total input of resources are spread homogeneously in the space. It was shown in reference [36] that the result of the consumer-resource model disagrees with that result, meaning it is shown that:
TRAPAhomogeneous,diffusion or not ≥ TRAPAheterogeneous,diffusion ≥ TRAPAheterogeneous,no diffusion
These inequalities are shown in Figure 3 over a range of values of glow nutrient, which is the density-dependent mortality rate, g, in odd-numbered patches in the 12-patch model (which receive low nutrient input), and where ghigh nutrient is the density-dependent mortality rate in the even-numbered patches (with high nutrient input).
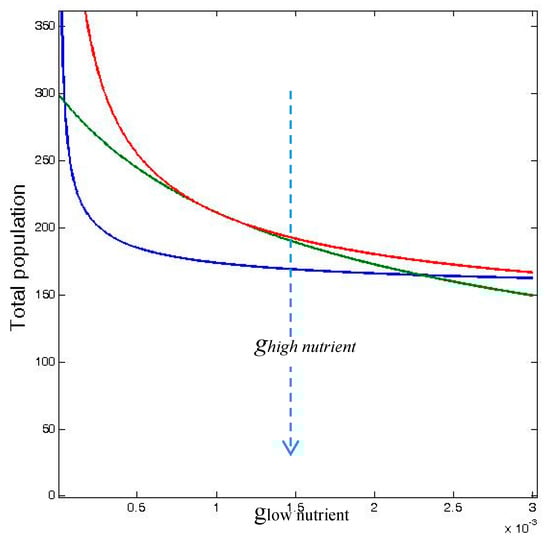
Figure 3.
Total carrying capacity TRAPAhetero,no diffusion (blue curve), total population abundance TRAPAhetero,diffusion (green curve), and total population for homogeneously distributed inputs (red curve), TRAPAhomogeneous,no diffusion, as functions of the gi value for the low nutrient input wells, glow nutrient, (odd patches) for fixed value of the gi = 0.001 for the high nutrient input wells, ghigh nutrient (even patches). TRAPAhomogeneous,diffusion coincides with TRAPAheterogeneous,diffusiion for D → ∞. The other parameters have been set to rmax = 0.1, k = 0.1, and γ = 1.0. TRAPAhomogeneous,diffusion and TRAPAhomogeneous,no diffusion coincide.
The details of the mathematical analysis and the confirmation by experiments on yeast are given in reference [36] and will not be detailed here, except to say that the experiments used patches, so the discretized version of equations (21a,b) was appropriate for describing those experiments. Separate experiments showed that conditions riKi > rj/Kj held for Ki > Kj, which agrees with the general relationships between r and K in microbial populations found by reference [38].
The Model 1 for the continuous PDE version was studied by reference [39], with equivalent results.
4. Discussion
We reviewed two important and related results that have been proved for the reaction-diffusion equation of a population of the type (3) or (8) in a spatially heterogeneous environment when the growth rate, r(x) and carrying capacity K(x) are positively related (which is automatically true for (3)). The first result is that if the population diffuses in space, the TRAPA can be greater than if it does not. The second result is that when the total carrying capacity is spread heterogeneously across space and the population diffuses, the TRAPA can be greater than if the same total carrying capacity were spread homogeneously. It was also shown that the same results hold for the analogous system of two discrete patches differing in growth rate and carrying capacity initially studied by references [27,29] showed that models for discrete n-patch systems and other growth functions than the Pearl-Verhulst equation produced similar results. So it appears to be a general property of models based on the general type of model represented by Equation (8) or its discretized variant (12a,b). These results would seem to imply that carrying capacities can be manipulated by creating heterogeneity in a landscape to support higher populations when population movements occur through diffusion.
The analysis of models of the type of Equations (8) and (12a,b), however, leaves out consideration that an energy or other limiting resource flux is necessary to sustain a population, and that the local energy or limiting resource flux is r(x)K(x) in the continuous case and riKi in the discrete patch case. Not taking this into account can lead to an inadvertent changing in the amount of energy (or limiting resource) input to the system when the local carrying capacities are changed, even when total carrying capacity, , remains the same. Reference [33] showed that when these energetic constraints are taken into account, the second counter-intuitive result disappears and a homogeneous distribution of energy (or other limiting resource) input becomes most efficient for supporting a population. It was also shown by reference [36] that when a resource is explicitly modeled, as in consumer-resource chemostat models, so that the energy input at each spatial point is clearly expressed in the equations, then some earlier results are better understood. In particular, the counter-intuitive result from logistic reaction-diffusion models that heterogeneously distributed input of exploited renewable limiting resource can reach a greater steady state abundance (TRAPA) than a population either diffusing or not diffusing in an environmental space with the same total input of resources spread homogeneously is now shown to be an artifact of the logistic population equation, which does not model the population’s resources as a variable. However, the consumer-resource model is consistent with the logistic population model in showing that a population diffusing in a heterogeneous environment can reach greater abundance at equilibrium than the population in the same heterogeneous environment that is not diffusing.
The results shown here for both the logistic model and the consumer-resource model apply to situations in which the population is assumed supported by an influx of energy or other resource (e.g., nutrient) that are limited, such that carrying capacity and per capita growth rate are positively related. The do not apply in cases in which growth rates have no correlation with carrying capacity. For example, when local carrying capacities are determined in terms of such things as number of nesting sites, refuges, or similar types of factors, rather than an exploitable resource, per capita growth rate is independent of carrying capacity. In that case, there are no paradoxical results from the the logistic equation, and it may be a good description of the population. The modeling by partial differential equations has great importance in understanding ecological populations dispersing in heterogeneous space [40]. For example reference [41], used a reaction-advection diffusion model to study the dispersal of fish moving into newly flooded areas in search for food. Like that model, many other models of population include advection in addition to diffusion, because organisms may have directional movement in many cases. However, reaction diffusion models without any directional movement are also common in ecology, as diffusion is a good approximation of movement in many cases [42].
Reaction-diffusion models of the type studied here play a role in conservation ecology, as populations exist on landscape that are heterogeneous in resources. Some areas may be rich enough in landscapes for a population to grow rapidly, while others may only have sufficient resources for the population to barely survive. Still other areas may be ‘sinks’ in which a population would decrease in size through time. The dynamics of a population is complicated by movement in the landscape, approximated as diffusion in reaction-diffusion models. It is possible for individuals to be attracted to sink areas, where they die or fail to reproduce, threatening the whole population with extinction [43]. Numerous papers have expanded on the effects of landscape heterogeneity on populations [44,45,46]. The experiments and model suggest that different rates of dispersal among sources and pseudo-sinks in nature can affect regional population size and certain rates of diffusion could maximize the size of the total population in a heterogeneous region. For example, in an experiment described by references [45,47,48], densities of seeds of the plant Cakile edentula were manipulated along a gradient through sand dunes. In this case the seaward or beach end of the gradient was a source of seeds, while the middle and landward sites were net sinks in which mortality was higher than reproduction. A model by reference [49] showed that the plants were most abundant in the sink sites because of the high seed migration from the source. This could be an example of a case where diffusion in a heterogeneous environment results in total population size greater than the total of individual sites along the gradient in the absence of diffusion, although this is difficult to prove. In any case, conservation ecologists must take into account possible effects of this sort on animal and plant populations when designing nature reserves.
5. Conclusions
The reaction-diffusion equation with a logistic growth term is a fundamental equation describing an ecological population. A counterintuitive result of such a system is that the total realized asymptotic population achieved in a heterogeneous system is not the same as the sum of local carrying capacities of homogeneous subareas. This sometimes may lead to misleading results if it is not kept in mind that it is the input of energy or a limiting resource that maintains a population. The carrying capacity is simply a consequence of the spatially varying energy or resource inputs and may not add in a linear way. The use of consumer-resource models is often a better way to relate the input of energy or limiting nutrients to the total size of a population in space.
Author Contributions
D.L.D. and B.Z. designed the research and wrote the first draft. W.-M.N. and Y.W. contributed to the theory. All authors contributed to revisions of the manuscript. All authors have read and agreed to the published version of the manuscript.
Funding
This research was funded by U.S. Geological Survey’s Greater Everglades Priority Ecosystem Science Grant GEPES ATLSS T5.17, Project Title KA30CTF.
Acknowledgments
D.L.D. and B.Z. were supported by the USGS Greater Everglades Priority Ecosystems Science. B.Z. was also supported by the UC Davis Chancellor’s postdoc fellowship. The research of W.-M.N. and Y.W. were partially supported by NSF and Chinese NSF. We appreciate comments of Adrian Lam and Donald Schoolmaster on an earlier version of this manuscript.
Conflicts of Interest
The authors declare no conflict of interest.
References
- Holmes, E.E.; Lewis, M.A.; Banks, J.E.; Veit, R.R. Partial-differential dquations in dcology—Spatial interactions and population-dynamics. Ecology 1994, 75, 17–29. [Google Scholar] [CrossRef]
- Levin, S.A.; Segel, L.A. Hypothesis for origin of planktonic patchiness. Nature 1976, 259, 659. [Google Scholar] [CrossRef]
- Okubo, A. Diffusion and Ecological Problems: Mathematical Models; Springer: Berlin, Germany, 1980. [Google Scholar]
- Cantrell, R.S.; Cosner, C.; Lou, Y. Evolution of dispersal in heterogeneous landscapes. In Spatial Ecology; CRC Press: Boca Raton, FL, USA, 2009; pp. 213–229. [Google Scholar] [CrossRef]
- Shigesada, N.; Kawasaki, K. Biological Invasions: Theory and Practice; Oxford University Press: Oxford, UK, 1997. [Google Scholar]
- Cantrell, R.S.; Cosner, C. The effects of spatial heterogeneity in population-dynamics. J. Math. Biol. 1991, 29, 315–338. [Google Scholar] [CrossRef]
- Errington, P.L. Vulnerability of Bob-White populations to predation. Ecology 1934, 15, 110–127. [Google Scholar] [CrossRef]
- Leopold, A. The conservation ethic. J. For. 1933, 31, 634–643. [Google Scholar]
- Dhondt, A.A. Carrying-capacity—A confusing concept. Acta Oecol.-Oecol. Gener. 1988, 9, 337–346. [Google Scholar]
- Hayward, M.W.; O’Brien, J.; Kerley, G.I.H. Carrying capacity of large African predators: Predictions and tests. Biol. Conserv. 2007, 139, 219–229. [Google Scholar] [CrossRef]
- Qin, G.H.; Li, H.X.; Wang, X.; Ding, J. Research on water resources design carrying capacity. Water Res. 2016, 8, 157. [Google Scholar] [CrossRef]
- Wang, H.; Zhou, Y.Y.; Tang, Y.; Wu, M.A.; Deng, Y.Q. Fluctuation of the water environmental carrying capacity in a huge river-connected lake. Int. J. Environ. Res. Public Health 2015, 12, 3564–3578. [Google Scholar] [CrossRef]
- Zeng, C.; Liu, Y.L.; Liu, Y.F.; Hu, J.M.; Bai, X.G.; Yang, X.Y. An integrated approach for assessing aquatic ecological carrying capacity: A case study of Wujin District in the Tai Lake Basin, China. Int. J. Environ. Res. Public Health 2011, 8, 264–280. [Google Scholar] [CrossRef]
- Zhou, R.X.; Pan, Z.W.; Jin, J.L.; Li, C.H.; Ning, S.W. Forewarning model of regional water resources carrying capacity based on combination weights and entropy Principles. Entropy 2017, 19, 574. [Google Scholar] [CrossRef]
- Schell, D.M. Declining carrying capacity in the Bering Sea: Isotopic evidence from whale baleen. Limnol. Oceanogr. 2000, 45, 459–462. [Google Scholar] [CrossRef]
- Sibly, R.M.; Williams, T.D.; Jones, M.B. How environmental stress affects density dependence and carrying capacity in a marine copepod. J. Appl. Ecol. 2000, 37, 388–397. [Google Scholar] [CrossRef]
- Vasconcellos, M.; Gasalla, M.A. Fisheries catches and the carrying capacity of marine ecosystems in southern Brazil. Fish Res. 2001, 50, 279–295. [Google Scholar] [CrossRef]
- Tuckwell, H. A study of some diffusion models of population growth. Theor. Popul. Biol. 1974, 5, 345–357. [Google Scholar] [CrossRef]
- Ang, T.K.; Safuan, H.M. Harvesting in a toxicated intraguild predator-prey fishery model with variable carrying capacity. Chaos Solitons Fractals 2019, 126, 158–168. [Google Scholar] [CrossRef]
- Rapport, D.J.; Turner, J.E. Feeding rates and population-growth. Ecology 1975, 56, 942–949. [Google Scholar] [CrossRef]
- Goss-Custard, J.D.; Stillman, R.A.; Caldow, R.W.G.; West, A.D.; Guillemain, M. Carrying capacity in overwintering birds: When are spatial models needed? J. Appl. Ecol. 2003, 40, 176–187. [Google Scholar] [CrossRef]
- Van Gils, J.A.; Edelaar, P.; Escudero, G.; Piersma, T. Carrying capacity models should not use fixed prey density thresholds: A plea for using more tools of behavioural ecology. Oikos 2004, 104, 197–204. [Google Scholar] [CrossRef]
- Lou, Y. On the effects of migration and spatial heterogeneity on single and multiple species. J Differ. Equ. 2006, 223, 400–426. [Google Scholar] [CrossRef]
- He, X.Q.; Ni, W.M. The effects of diffusion and spatial variation in Lotka-Volterra competition-diffusion system I: Heterogeneity vs. homogeneity. J. Differ. Equ. 2013, 254, 528–546. [Google Scholar] [CrossRef]
- He, X.Q.; Ni, W.M. The effects of diffusion and spatial variation in Lotka-Volterra competition-diffusion system II: The general case. J. Differ. Equ. 2013, 254, 4088–4108. [Google Scholar] [CrossRef]
- Arditi, R.; Lobry, C.; Sari, T. Is dispersal always beneficial to carrying capacity? New insights from the multi-patch logistic equation. Theor. Popul. Biol. 2015, 106, 45–59. [Google Scholar] [CrossRef] [PubMed]
- DeAngelis, D.L.; Ni, W.M.; Zhang, B. Dispersal and spatial heterogeneity: Single species. J. Math. Biol. 2016, 72, 239–254. [Google Scholar] [CrossRef]
- DeAngelis, D.L.; Ni, W.M.; Zhang, B. Effects of diffusion on total biomass in heterogeneous continuous and discrete-patch systems. Theor. Ecol. 2016, 9, 443–453. [Google Scholar] [CrossRef]
- Freedman, H.I.; So, J.W.H.; Waltman, P. Predator influence on the growth of a population with three Genotypes. III. Persistence and Extinction. J. Math. Anal. Appl. 1987, 128, 287–304. [Google Scholar] [CrossRef]
- Holt, R.D.; Gomulkiewicz, R.; Barfield, M. The phenomenology of niche evolution via quantitative traits in a ‘black-hole’ sink. Proc. R. Soc. Lond. Ser. B Biol. Sci. 2003, 270, 215–224. [Google Scholar] [CrossRef]
- Zhang, B.; Liu, X.; DeAngelis, D.L.; Ni, W.M.; Wang, G.G. Effects of dispersal on total biomass in a patchy, heterogeneous system: Analysis and experiment. Math. Biosci. 2015, 264, 54–62. [Google Scholar] [CrossRef]
- Jensen, A.L. Comparison of Logistic Equations for Population-Growth. Biometrics 1975, 31, 853–862. [Google Scholar] [CrossRef]
- Wang, Y.S.; DeAngelis, D.L. Energetic constraints and the paradox of a diffusing population in a heterogeneous environment. Theor. Popul. Biol. 2019, 125, 30–37. [Google Scholar] [CrossRef]
- MacArthur, R.H. Geographical Ecology; Harper & Row: New York, NY, USA, 1972. [Google Scholar]
- Tilman, D. Resource Competition and Community Structure; Princeton University Press: Princeton, NJ, USA, 1982. [Google Scholar]
- Zhang, B.; Kula, A.; Mack, K.M.L.; Zhai, L.; Ryce, A.L.; Ni, W.M.; DeAngelis, D.L.; Van Dyken, J.D. Carrying capacity in a heterogeneous environment with habitat connectivity. Ecol. Lett. 2017, 20, 1118–1128. [Google Scholar] [CrossRef] [PubMed]
- Van Dyken, J.D.; Zhang, B. Carrying capacity of a spatially-structured population: Disentangling the effects of dispersal, growth parameters, habitat heterogeneity and habitat clustering. J. Theor. Biol. 2018. [Google Scholar] [CrossRef] [PubMed]
- Hendriks, A.J.; Maas-Diepeveen, J.L.M.; Heugens, E.H.W.; Van Straalen, N.M. Meta-analysis of intrinsic rates of increase and carrying capacity of populations affected by toxic and other stressors. Environ. Toxicol. Chem. 2005, 24, 2267–2277. [Google Scholar] [CrossRef] [PubMed]
- He, X.Q.; Lam, K.Y.; Lou, Y.; Ni, W.M. Dynamics of a consumer-resource reaction-diffusion model: Homogeneous versus heterogeneous environments. J. Math. Biol. 2019, 78, 1605–1636. [Google Scholar] [CrossRef] [PubMed]
- Cantrell, R.S.; Cosner, C.; Lou, Y. Advection-mediated coexistence of competing species. Proc. R. Soc. Edinb. Sect. A 2007, 137, 497–518. [Google Scholar] [CrossRef]
- DeAngelis, D.L.; Trexler, J.C.; Cosner, C.; Obaza, A.; Jopp, F. Fish population dynamics in a seasonally varying wetland. Ecol. Model. 2010, 221, 1131–1137. [Google Scholar] [CrossRef]
- Levin, S.A.; Pacala, S.W.; Tilman, D. Theories of simplification and scaling of spatially distributed processes. In Ecology: Achievement and Challenge; Princeton University Press: Princeton, NJ, USA, 1997; pp. 271–296. [Google Scholar]
- Pulliam, H.R. Sources, sinks, and population regulation. Am. Nat. 1988, 132, 652–661. [Google Scholar] [CrossRef]
- Amarasekare, P.; Hoopes, M.F.; Mouquet, N.; Holyoak, M. Mechanisms of coexistence in competitive metacommunities. Am. Nat. 2004, 164, 310–326. [Google Scholar] [CrossRef]
- Watkinson, A.R.; Sutherland, W.J. Sources, sinks and pseudo-sinks. J. Anim. Ecol. 1995, 64, 126–130. [Google Scholar] [CrossRef]
- Wilson, D.S. Complex interactions in metacommunities, with implications for biodiversity and higher levels of selection. Ecology 1992, 73, 1984–2000. [Google Scholar] [CrossRef]
- Keddy, P.A. Experimental demography of the sand-dune annual, Cakile-Edentula, growing along an environmental gradient in Nova-Scotia. J. Ecol. 1981, 69, 615–630. [Google Scholar] [CrossRef]
- Keddy, P.A. Population ecology on an environmental gradient—Cakile-Edentula on a sand dune. Oecologia 1982, 52, 348–355. [Google Scholar] [CrossRef] [PubMed]
- Watkinson, A.R. On the abundance of plants along an environmental gradient. J. Ecol. 1985, 73, 569–578. [Google Scholar] [CrossRef]


© 2020 by the authors. Licensee MDPI, Basel, Switzerland. This article is an open access article distributed under the terms and conditions of the Creative Commons Attribution (CC BY) license (http://creativecommons.org/licenses/by/4.0/).