Article

The Performance Quantitative Model Based on the Specification and Relation of the Component

1
School of Computer Science and Technology, Huaibei Normal University, Huaibei 235000, China
2
Guizhou Academy of Sciences, Guiyang 55001, China
*
Author to whom correspondence should be addressed.
Mathematics 2019, 7(8), 730; https://doi.org/10.3390/math7080730
Submission received: 5 June 2019 / Revised: 6 August 2019 / Accepted: 7 August 2019 / Published: 10 August 2019
(This article belongs to the Section Mathematics and Computer Science)

Abstract

:
The trustworthiness of software is crucial to some safety critical areas. Performance is an important attribute of software trustworthiness. Software component technology is the mainstream technology of software development. How to achieve the performance of component systems efficiently and accurately is a challenging issue for component-based software development. In this paper, the performance quantification method of the component is proposed. First, performance specification is formally defined. Second, a refinement relation is introduced and the performance quantification method of the component system is presented. Finally, a case study is given to illustrate the effectiveness of the method.

1. Introduction

The trustworthiness of software is a hot topic of research. Software performance is one of the attributes that affect software trustworthiness. With the expansion of software scale and the increase in software complexity, many software products encounter performance problems. Undoubtedly, many of these problems lead to lower software trustworthiness. In recent years, accidents caused by software performance problems have had a significant impact on our society. The third largest mobile phone company of Japan, Softbank, planned to attract users by reducing mobile fees. However, the computer system became paralyzed, and Softbank lost more than 100 million yen, as a result of the influx of a large number of users in a short time. Software in some safety-critical areas, such as aerospace control, finance, transportation and communication, need to achieve higher trustworthy degree [1,2].
Performance measurement is often a challenging task [3,4,5,6]. Automated assistance for software performance improvement has been described before based on measurements, performance models or both. To analyze measurements, the Paradyn tools [5] have extensive facilities for automated instrumentation and bottleneck searches for parallel applications, enhanced in [4] with historical data. IT flexibility has been posited as being a critical enabler in attaining competitive performance gains [7]. Other tools for the causal analysis of measurements include Poirot [8] and those in [9,10].
Performance is a crucial attribute of software systems [11]. When performance is measured early in the development process, the aim is to derive the appropriate architectural decisions that improve the performance of the system. Performance models are used to describe how system operations use resources and how resource contention affects operations [12]. Performance estimation at early stages of software development is difficult, as there are many aspects that may be unknown or uncertain, such as the design decisions, code, and execution environment. In many application domains, such as heterogeneous distributed systems, enterprise applications, and cloud computing, performance evaluation is also affected by external factors, such as increasingly fluctuating workloads and changing scenarios [13]. Wang and Casale used Bayesian inference and Gibbs sampling to model service demand from queue length data [14].
Software component technology is the mainstream technology of software development. How to obtain the performance of component systems efficiently and accurately is a challenging issue. This paper puts forward a performance quantification method of a component system. Component-Based Software Development (CBSD) has been an important area of research for almost three decades [15,16]. CBSD avoids duplication of effort, reduces the development cost and improves productivity [17,18]. Reusing the software component can reduce time and cost [19]. By reusing software components, CBSD avoids the repeated emergence of errors and improves the trustworthiness of software [20]. The software component has several definitions. A component is an opaque implementation of functionality, subject to third-party composition, and conformation with a component model (CMU/SEI definition) [21]. Szyperski’s definition is that the software component is a unit of composition with contractually specified interfaces and explicit context dependencies [22]. The authors of [23,24,25] adopted Szyperski’s definition. This paper also adopts Szyperski’s definition.
One of the most critical processes in CBSD is the selection of a set of software components [26,27]. How to obtain the performance of component systems efficiently and accurately is a challenging issue for component system development. In this paper, the performance quantification method of the component is proposed. First, performance specification is formally defined. Second, a refinement relation is introduced, and the performance quantification method of the component system is presented. Finally, a case study is given to illustrate the effectiveness of the method.
The remainder of this paper is organized as follows. In Section 2, we introduce the performance and its metric elements. Section 3 proposes the refinement relationship. Section 4 presents the quantification method of the metric element and the computation model of performance. In Section 5, the performance computing method of the component system is presented. Section 6 gives a case study. Section 7 is the conclusion section.

2. Performance and Metric Elements

Performance is a non-functional feature of software [20]. It focuses on the timeliness displayed when it completes the function. The software system provides proper performance relative to the number of resources used under specified conditions. The object of performance measurement is called the metric element.The metric elements of the performance include the CPU utilization ratio, memory utilization ratio, disk I/O, number of concurrent users, throughput and average response time.
The CPU utilization ratio refers to the percentage of CPU time consumed by the user process and the system process. In a longer period of use, there is generally an acceptable upper limit, and many systems set the CPU utilization ratio to 85%.
The calculation of the memory utilization ratio is: (1− free memory/total memory size) × 100%. The system requires at least a certain amount of free memory, which has an acceptable upper limit. Disk I/O is mainly used to measure the reading and writing ratio of the disk. It is measured by the percentage of unit time for reading and writing operations.
The maximum number of users is the number of users who simultaneously submit requests to the system at the same time.
Throughput is the number of unit time required of the system to complete users’ transactions. It reflects the system’s processing capabilities.
The average response time is the average time of transaction processing. The response time of the transaction is the time from submitting the request to completing it.
Component specification is a window for the component to transmit information [28]. Component specification not only provides an abstract definition of the internal structure of the component but also provides all the information needed for the component user to understand and use the component. Performance includes some metric elements. The trustworthiness of performance is directly calculated by metric elements.

3. The Refinement Relationship Based on the Specification

The performance is composed of metric elements. The trustworthiness of performance is calculated directly by metric elements. The specification of the performance’s metric element consists of four parts: name, checkpoint, flag and value.
Definition 1.
(The specification of the metric element) A metric element consists of four parts: the name of the metric element, the checkpoint of the metric element, the flag of the metric element and the value of the metric element. It is denoted as a quadruple element: = ( n a m e , c h e c k p o i n t , f l a g , v a l u e ) .
The flag of a metric element takes the values 1 and −1. The flag of a metric element represents the relation between the metric element and its value. When flag = 1, the larger the value of a metric element is, the better this metric element is. However, when flag = −1, the smaller the value of the metric element is, the better this metric element is. The flags of the metric elements are shown in Table 1.
Definition 2.
(The specification of the Performance) A performance specification is a set consisting of n metric elements. It is denoted as a set: p e r = { e l e m e n t 1 , , e l e m e n t i , , e l e m e n t n } ,where p e r is the performance specification and e l e m e n t i is the specification of the metric element.
For example, a performance p e r 1 represents the throughput and the response time. Its description is that the throughput of the payment function is no less than 200 users per second when 100 users use the payment function, and the response time of the payment function is no more than 5 s when 200 users use the payment function. We use e l e m e n t 1 = (“To”, “100 users”, 1, 20) to represent the throughput and e l e m e n t 2 = (“Rt”, “200 users”, −1, 5) to represent the response time. Then, the specification of the performance is: p e r 1 = e l e m e n t 1 , e l e m e n t 2 ={(“To”, “100 users”, 1, 20),(“Rt”, “200 users”, −1, 5)}.
After completing the specification of the metric element and performance, a refinement relation-based specification is introduced below.
Definition 3.
(Refinement relation) For two given metric elements e l e m e n t 1 and e l e m e n t 2 , we call e l e m e n t 1 the refinement of e l e m e n t 2 , expressed as e l e m e n t 1 e l e m e n t 2 , if ( e l e m e n t 1 . n a m e = e l e m e n t 2 . n a m e ) ( e l e m e n t 1 . c h e c k p o i n t = e l e m e n t 2 . c h e c k p o i n t ) ( e l e m e n t 1 . f l a g = e l e m e n t 2 . f l a g ) ( ( ( e l e m e n t 1 . f l a g = 1 ) ( e l e m e n t 1 . v a l u e e l e m e n t 2 . v a l u e ) ) ( ( e l e m e n t 1 . f l a g = 1 ) ( e l e m e n t 1 . v a l u e e l e m e n t 2 . v a l u e ) ) ) .
For example, if a metric element e l e m e n t 1 is (“To”, “100 users”, 1, 20) and a metric element e l e m e n t 2 is (“To”, “100 users”, 1, 18), then e l e m e n t 1 e l e m e n t 2 . If a metric element e l e m e n t 3 is (“Rt”, “200 users”, −1, 3) and a metric element e l e m e n t 4 is ("Rt”, "200 users”, −1, 5), then e l e m e n t 3 e l e m e n t 4 . The refinement relationship has the following propositions:
Proposition 1.
(Reflexivity) The refinement relation of the metric element satisfies the reflexivity, e l e m e n t i e l e m e n t i .
A metric element is satisfied with itself.
Proposition 2.
(Antisymmetry) If e l e m e n t i e l e m e n t j and e l e m e n t j e l e m e n t i , then e l e m e n t i = e l e m e n t j .
Proof. 
Because two cases of flag are discussed:
Case 1: When ( e l e m e n t i . f l a g = 1 ) .
e l e m e n t i e l e m e n t j ( e l e m e n t i . n a m e = e l e m e n t j . n a m e ) ( e l e m e n t i . c h e c k p o i n t = e l e m e n t j . c h e c k p o i n t ) ( e l e m e n t i . f l a g = e l e m e n t j . f l a g ) .
Because e l e m e n t i e l e m e n t j e l e m e n t i . v a l u e e l e m e n t j . v a l u e and e l e m e n t j e l e m e n t i e l e m e n t j . v a l u e e l e m e n t i . v a l u e .
As a result, e l e m e n t i . v a l u e = e l e m e n t j . v a l u e .
Case 2: ( e l e m e n t i . f l a g = 1 )
With the same proof of Case 1, e l e m e n t i . v a l u e = e l e m e n t j . v a l u e .
Therefore, ( e l e m e n t i . n a m e = e l e m e n t j . n a m e ) ( e l e m e n t i . c h e c k p o i n t = e l e m e n t j . c h e c k p o i n t ) ( e l e m e n t i . f l a g = e l e m e n t j . f l a g ) ( e l e m e n t j . v a l u e = e l e m e n t i . v a l u e ) ( e l e m e n t i = e l e m e n t j ) .
As a result, e l e m e n t i = e l e m e n t j .
 □
Proposition 3.
(Transitivity) If e l e m e n t i e l e m e n t j and e l e m e n t j e l e m e n t k , then e l e m e n t i e l e m e n t k .
Proof. 
Because two cases of flag are discussed:
Case 1: When ( e l e m e n t i . f l a g = 1 ) .
e l e m e n t i e l e m e n t j ( e l e m e n t i . n a m e = e l e m e n t j . n a m e ) ( e l e m e n t i . c h e c k p o i n t = e l e m e n t j . c h e c k p o i n t ) ( e l e m e n t i . f l a g = e l e m e n t j . f l a g ) .
Because e l e m e n t j e l e m e n t k ( e l e m e n t j . n a m e = e l e m e n t k . n a m e ) ( e l e m e n t j . c h e c k p o i n t = e l e m e n t k . c h e c k p o i n t ) ( e l e m e n t j . f l a g = e l e m e n t k . f l a g ) .
Because ( e l e m e n t i . n a m e = e l e m e n t k . n a m e ) ( e l e m e n t i . c h e c k p o i n t = e l e m e n t k . c h e c k p o i n t ) ( e l e m e n t i . f l a g = e l e m e n t k . f l a g ) .
Two cases of flag are discussed:
Case 1: ( e l e m e n t i . f l a g = 1 )
e l e m e n t i e l e m e n t j ( e l e m e n t i . v a l u e e l e m e n t j . v a l u e ) .
e l e m e n t j e l e m e n t k ( e l e m e n t j . v a l u e e l e m e n t k . v a l u e ) .
Thus, ( e l e m e n t i . v a l u e e l e m e n t k . v a l u e ) .
Case 2: ( e l e m e n t i . f l a g = 1 )
This is similar to the proof of Case 1.
( e l e m e n t i . v a l u e e l e m e n t k . v a l u e ) .
Therefore, ( e l e m e n t i . n a m e = e l e m e n t k . n a m e ) ( e l e m e n t i . c h e c k p o i n t = e l e m e n t k . c h e c k p o i n t ) ( e l e m e n t i . f l a g = e l e m e n t k . f l a g ) ( ( ( e l e m e n t i . f l a g = 1 ) ( e l e m e n t i . v a l u e e l e m e n t k . v a l u e ) ) ( ( e l e m e n t i . f l a g = 1 ) ( e l e m e n t i . v a l u e e l e m e n t k . v a l u e ) ) ) .
Thus, e l e m e n t i e l e m e n t k .
 □
For given two performance specifications p e r 1 and p e r 2 , we call p e r 1 the refinement of p e r 2 , expressed as p e r 1 p e r 2 , if p e r 1 . e l e m e n t i p e r 2 . e l e m e n t i for every i.
From these propositions, the refinement relation is a partial order. The relation of performance specifications is introduced below.

4. Quantification of Performance and the Metric Elements

In the following, a quantitative measurement method can help us choose the optimized performance. After quantifying the performance’s metric elements, the quantitative measurement of performance is computed.
Definition 4.
(Quantitative measurement of the metric element) For the given specifications of two metric elements e l e m e n t 1 and e l e m e n t 2 , we say that e l e m e n t 2 is refined e l e m e n t 1 in a quantitative way, donated by e l e m e n t 1 δ e l e m e n t 2 , calculated as follows. When e l e m e n t 1 . f l a g = 1 , m ( e l e m e n t 1 , e l e m e n t 2 ) = ( e l e m e n t 1 . v a l u e e l e m e n t 2 . v a l u e ) 1 2 , e l e m e n t 1 . v a l u e < e l e m e n t 2 . v a l u e , 1 , e l e m e n t 1 . v a l u e e l e m e n t 2 . v a l u e .
When e l e m e n t 1 . f l a g = 1 , m ( e l e m e n t 1 , e l e m e n t 2 ) = 1 , e l e m e n t 1 . v a l u e e l e m e n t 2 . v a l u e , e ( e l e m e n t 1 . v a l u e e l e m e n t 2 . v a l u e ) e l e m e n t 2 . v a l u e , e l e m e n t 1 . v a l u e > e l e m e n t 2 . v a l u e .
The quantitative method has the following properties.
Proposition 4.
(Boundness) Boundness is used to describe that m ( e l e m e n t 1 , e l e m e n t 2 ) is in a certain range.
Proof. 
Since m ( e l e m e n t 1 , e l e m e n t 2 ) is different depending on the flag, different cases are discussed.
Case 1: ( e l e m e n t 1 . f l a g = 1 )
When e l e m e n t 1 . v a l u e < e l e m e n t 2 . v a l u e , it is obtained that 0 < ( e l e m e n t 1 . v a l u e e l e m e n t 2 . v a l u e ) 1 2 < 1 .
When e l e m e n t 1 . v a l u e e l e m e n t 2 . v a l u e , it is true that m ( e l e m e n t 1 , e l e m e n t 2 ) = 1 .
As a result, 0 < m ( e l e m e n t 1 , e l e m e n t 2 ) 1 .
Case 2: ( e l e m e n t 1 . f l a g = 1 )
When e l e m e n t 1 . v a l u e e l e m e n t 2 . v a l u e , m ( e l e m e n t 1 , e l e m e n t 2 ) = 1 .
When 2 × e l e m e n t 2 . v a l u e > e l e m e n t 1 . v a l u e > e l e m e n t 2 . v a l u e 0 < e ( e l e m e n t 1 . v a l u e e l e m e n t 2 . v a l u e ) e l e m e n t 1 . v a l u e 1 , it is true that 0 < e ( e l e m e n t 1 . v a l u e e l e m e n t 2 . v a l u e ) e l e m e n t 1 . v a l u e 1 .
When e l e m e n t 1 . v a l u e 2 × e l e m e n t 2 . v a l u e , m ( e l e m e n t 1 , e l e m e n t 2 ) = 0 .
As a result, 0 m ( e l e m e n t 1 , e l e m e n t 2 ) 1 .
In other words, m ( e l e m e n t 1 , e l e m e n t 2 ) is a bounded function.
This proposition shows that a component’s metric element has a certain range in satisfying the target metric element.
 □
Proposition 5.
(Keeping order) Keeping order means that e l e m e n t 1 e l e m e n t 2 m ( e l e m e n t 1 , e l e m e n t 3 ) m ( e l e m e n t 2 , e l e m e n t 3 ) .
Proof. 
Two cases of the flag are discussed.
Case 1: ( e l e m e n t 1 . f l a g = 1 )
Since ( m ( e l e m e n t 1 , e l e m e n t 3 ) ) ( e l e m e n t 1 . v a l u e ) = 1 2 × ( e l e m e n t 1 . v a l u e e l e m e n t 3 . v a l u e ) 1 2 0 , m ( e l e m e n t 1 e l e m e n t 3 ) is an increasing function for e l e m e n t 1 .
Because e l e m e n t 1 e l e m e n t 2 can imply e l e m e n t 1 . v a l u e e l e m e n t 2 . v a l u e , m ( e l e m e n t 1 , e l e m e n t 3 ) m ( e l e m e n t 2 , e l e m e n t 3 ) .
As a result, if e l e m e n t 1 e l e m e n t 2 , then m ( e l e m e n t 1 , e l e m e n t 3 ) m ( e l e m e n t 2 , e l e m e n t 3 ) .
Case 2: ( e l e m e n t 1 . f l a g = 1 )
Since ( m ( e l e m e n t 1 , e l e m e n t 3 ) ) ( e l e m e n t 1 . v a l u e ) 0 , m ( e l e m e n t 1 , e l e m e n t 3 ) is a decreasing function for e l e m e n t 1 .
Because e l e m e n t 1 e l e m e n t 2 implies e l e m e n t 1 . v a l u e e l e m e n t 2 . v a l u e , m ( e l e m e n t 1 , e l e m e n t 3 ) m ( e l e m e n t 2 , e l e m e n t 3 ) .
Then, e l e m e n t 1 e l e m e n t 2 implies m ( e l e m e n t 1 , e l e m e n t 3 ) > m ( e l e m e n t 2 , e l e m e n t 3 ) .
 □
Proposition 6.
(Approximation) Approximation means that, when e l e m e n t 1 is closing in a refinement way to e l e m e n t 2 , m ( e l e m e n t 1 , e l e m e n t 2 ) is increasing.
Proof. 
It is proved in the two cases of the flag of e l e m e n t 1 .
Case 1: ( e l e m e n t 1 . f l a g = 1 )
In this case, it is true that 0 e l e m e n t 1 . v a l u e e l e m e n t 2 . v a l u e .
Suppose x = e l e m e n t 2 . v a l u e e l e m e n t 1 . v a l u e , i.e., x denotes the distance from e l e m e n t 1 . v a l u e to e l e m e n t 2 . v a l u e , then
m ( e l e m e n t 1 , e l e m e n t 2 ) = ( e l e m e n t 2 . v a l u e x e l e m e n t 2 . v a l u e ) 1 2 .
0 e l e m e n t 1 . v a l u e e l e m e n t 2 . v a l u e , we have
( m ( e l e m e n t 1 , e l e m e n t 2 ) ) ( x ) = ( 1 2 × e l e m e n t 2 . v a l u e ) × ( e l e m e n t 2 . v a l u e x e l e m e n t 2 . v a l u e ) 1 2 0 .
Case 2: ( e l e m e n t 1 . f l a g = 1 )
This case implies that e l e m e n t 2 . v a l u e < e l e m e n t 1 . v a l u e . Suppose x = e l e m e n t 1 . v a l u e e l e m e n t 2 . v a l u e , i.e., x denotes the distance from e l e m e n t 2 . v a l u e to e l e m e n t 1 . v a l u e . Then, m ( e l e m e n t 1 , e l e m e n t 2 ) = e x e l e m e n t 2 . v a l u e .
Since e l e m e n t 2 . v a l u e < e l e m e n t 1 . v a l u e , ( m ( e l e m e n t 1 , e l e m e n t 2 ) ) ( x ) = ( 1 e l e m e n t 2 . v a l u e ) × e x e l e m e n t 2 . v a l u e 0 .
Both cases show that m ( e l e m e n t 1 , e l e m e n t 2 ) is a decreasing function over x. Therefore, when e l e m e n t 1 . v a l u e is closing to e l e m e n t 2 . v a l u e in a refinement way, the degree of the metric element increases.
 □
This proposition shows that the quantification is consistent with the refinement relation and that the quantitative model is order preserving.
Definition 5.
(Quantitative measurement of component performance) Assuming that the component’s performance specification p e r c and the target performance specification p e r r have the same metric elements, we say that the component’s performance specification p e r c satisfies the target performance specification p e r r in a quantitative way, and it is represented as p e r c δ p e r r , where δ = ( δ 1 × δ 2 × × δ n ) 1 n and δ i is the quantification of the ith metric element.
For example, there are the component’s performance specification p e r c and the target performance specification p e r r . The component’s performance specification p e r c is {(“Rt”, “300 users”, −1, 5)}, and the target performance specification p e r r is {(“Rt”, “300 users”, −1, 6)}. It can be obtained that p e r c δ p e r r and =1.
For another example, there are the component’s performance specification p e r c and the target performance specification p e r r . The component’s performance specification p e r c is {(“Rt”, “200 users”, −1, 5), (To, 300 users, 1, 15)}, and the target performance specification p e r r is {(“Rt”, “200 users”, −1, 6), (“To”, “300 users”, 1, 20)}. Through the calculation, we have p e r c δ p e r r and δ = ( δ 1 × δ 2 ) 1 2 = ( 1 × 15 20 ) 1 2 = 0.87 .
The two target performance specifications are {(“Rt”, “1000 users”, 1, 6)} and {(“Rt”, “1000 users”, 1, 6), (“To”, “1000 users”, 1, 20)}. For each target performance specification, the performance specifications of the components are given to quantify, and the quantification is shown in Table 2. The examples illustrate the validity of quantitative method.

5. Performance Computing of Component System

The graphical models are similar to Reliability Block Diagrams [29], but the computation models are different: the reliability of component system is calculated by series or parallel relation and the reliability of component; the performance of component system instead is calculated by the metric elements of component system, and the metric elements of component system are calculated by relation and the metric elements of component.

5.1. Series Relation

Definition 6.
(Series relation) The series relation means that the component is executed in sequence, one component is executed after another component, and the post condition of the former is the precondition of the latter component. The series relation of the component is represented by “→”.
Figure 1 depicts C 1 C 2 . The CPU usage rate, memory utilization ratio, disk I/O, maximum user number, throughput and average response time of component serial relation system are calculated as shown in Table 3.
C u i is the CPU utilization rate of the ith component. C u s is the CPU utilization rate of the component serial relation system. M u i is the memory utilization of the ith component and M u s is the memory utilization of the component serial relation system. I o i is the disk I/O of the ith component and I o s is the disk I/O of component serial relationship system. M n i is the largest user number of the ith component, and and M n s is the largest number of users in a component serial relationship system. T o i is the throughput of the ith component, and T o s is the throughput of the component serial relationship system. R t i is the average response time of the ith component, and R t s is the average response time of the component serial relation system. M a x ( M u 1 , M u 2 , . . . , M u n ) is a maximum function, and M n s = m i n ( M n 1 , M n 2 , . . . , M n n ) is a minimum function.

5.2. Parallel Relation

Definition 7.
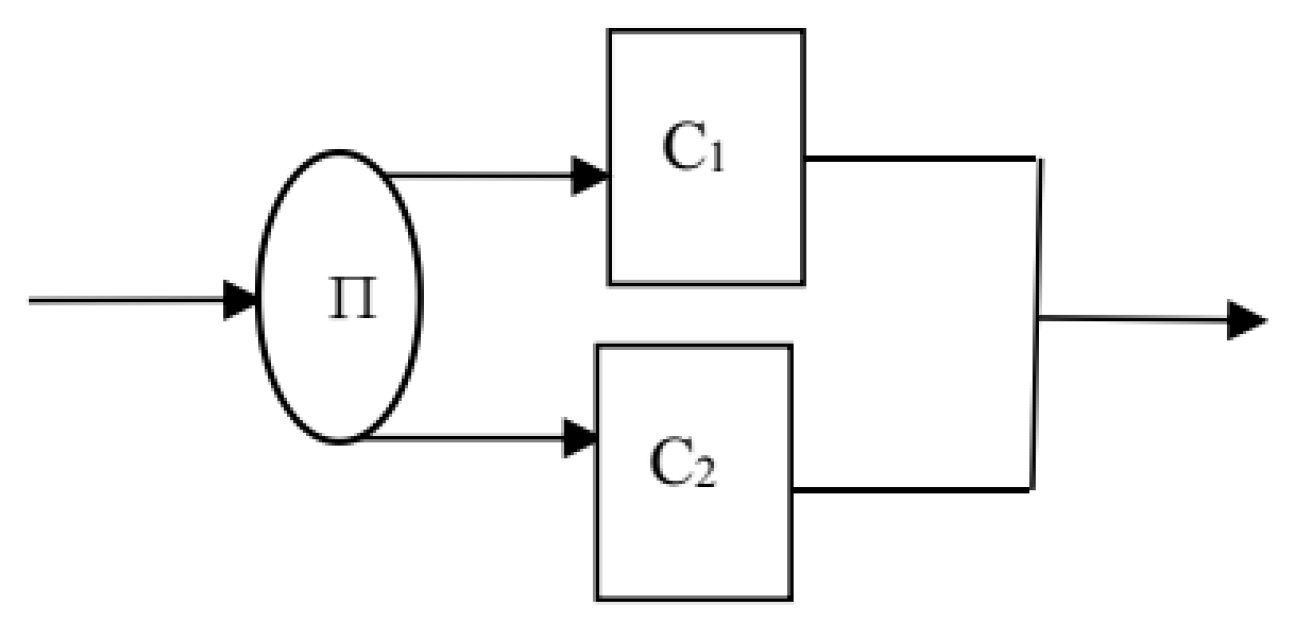
(Parallel relation) The parallel relation of the component refers to the simultaneous execution of the component and the equivalent of the component. The parallel relation structure can be supported by the successful execution of any of the components. The parallel relation is represented with ∏.
For example, C 1 and C 2 are software components with a parallel relationship, denoted by C 1 C 2 . The parallel relationship between C 1 and C 2 is shown in Figure 2. Metric elements of component parallel relation system are calculated as shown in Table 4.

5.3. Choice Relation

Definition 8.
(Choice relation) The choice relation means that one of the components is allowed to execute, but the only one component is allowed to perform at the same time. The preconditions of the components are the same in selection relationship. We use “+” to represent the choice relationship of the component.
For example, C 1 and C 2 are two components, and components C 1 and C 2 have a choice relationship. Figure 3 shows the choice relationship, which is shown as C 1 + C 2 . Metric elements of component choice relation system are calculated as shown in Table 5.

5.4. Concurrence Relation

Definition 9.
(Concurrence relation) The concurrence relationship requires all components to execute at the same time, and the preconditions of concurrence relationship are the same. The concurrence relationship is represented with “||”.
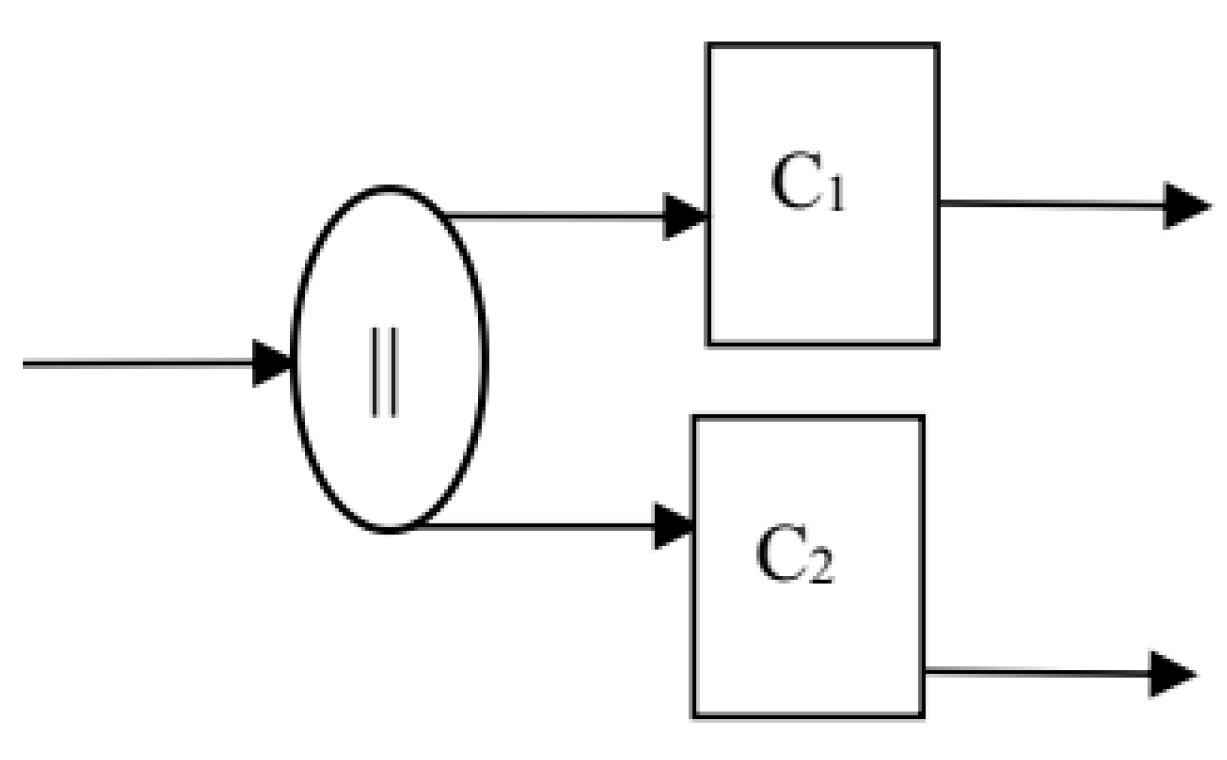
For example, C 1 and C 2 are two components, C 1 and C 2 have a concurrence relationship, and the two components should meet the same precondition C 1 .pre= C 2 .pre, and be remembered as C 1 C 2 . Figure 4 shows the concurrence relationship. Metric elements of component concurrence relation system are calculated as shown in Table 6.

5.5. Loop Relation

Definition 10.
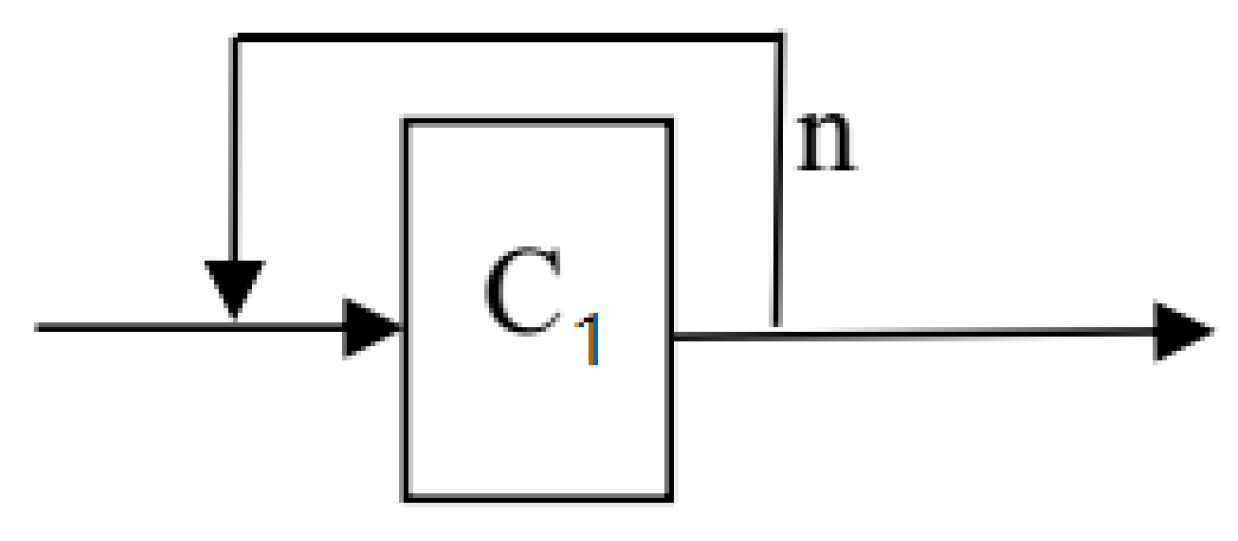
(Loop relation) The loop relation allows a component to execute n times repeatedly. It is represented with n .
For example, C 1 is a component that allows component C 1 to execute repeatedly n times, and the loop relation is shown in Figure 5. Then, the component C 1 performs n times loop as C 1 n . The CPU utilization ratio, memory utilization ratio, disk I/O, maximum user number, throughput and average response time of loop relational system are calculated as shown in Table 7.

6. An Illustrative Example

The following example shows the availability and effectiveness of the measurement model. Firstly, we give a logical structure of a component system, as shown in Figure 6.
The CPU utilization, memory utilization, disk I/O, maximum user number, throughput and average response time are shown in Table 8.
The calculation process is calculated according to the formula given above. The calculation of the metric element is shown as follows.
C u s = m a x ( C u 1 , m a x ( C u 2 , C u 3 ) , C u 4 , C u 5 , C u 6 ) = 0.4 , M u s = m a x ( M u 1 , m a x ( M u 2 , M u 3 ) , M u 4 , M u 5 , M u 6 ) = 0.5 , I o s = m a x ( I o 1 , m a x ( I o 2 , I o 3 ) , I o 4 , I o 5 , I o 6 ) = 0.4 , M u s = m i n ( M u 1 , m i n ( M u 2 , M u 3 ) , M u 4 , M u 5 , M u 6 ) = 400 , T o s = m i n ( I o 1 , m i n ( T o 2 , T o 3 ) , T o 4 , T o 5 , T o 6 ) = 300 , R t s = R t 1 + m a x ( R t 2 , R t 3 ) + R t 4 + R t 5 + R t 6 = 21 .
Table 9 is the computational results of performance metrics for component systems. Table 10 shows the target value of the metric element of the component system.
According to the computation, δ 1 , δ 2 , δ 3 , δ 4 , δ 5 , and δ 6 are 1, 1, 1, ( 400 500 ) 1 2 , 1, and 1, respectively. Calculating the trustworthiness of the component system’s performance, δ = ( δ 1 × δ 2 × × δ n ) 1 n = ( 1 × 1 × 1 × ( 400 500 ) 1 2 × 1 × 1 ) 1 6 = 0.9635 .
According to the computation, “maximum number of users” is the weak metric element of the component system. “Maximum number of users” of component C 6 is the minimum, thus component C 6 should be improved to obtain a better performance of the system.
The illustrative example is used to show the computational process of performance quantization. The weights of the metric elements are the same in the calculation; however, the weights could be different and determined according to the requirements of the component system.

7. Conclusions

Software component technology plays an important role in constructing software systems. The goal of this paper is to propose a quantification model of performance. The performance computing method of the component system is presented. Propositions for specification-based performance measurement are presented to illustrate the reasonableness of the method. An illustrative example is presented, showing that the proposed method is effective. Reliability is another key hot topic of the component system. Misra presents the methods to consider imperfect fault coverage and common-cause failures in the reliability analysis [30]. A computational model considering comprehensive reliability and performance is future work. The model will be extended to deal with reliability and security. We have the experience about the trustworthiness measurement of software in aerospace embedded software [1], and plan to evaluate the performance in a specific real case study about aerospace embedded software.

Author Contributions

B.W. gave the idea; B.W. and S.Z. did the experiments; D.L. interpreted the results; and B.W. wrote the paper.

Funding

This work was supported by the National Key R&D Program of China (Grant No.2017YFC1601800, Name: Research and Application Demonstration of Information Technology in Food Safety Society); the International Cooperation Project Guizhou Academy of Sciences (Grant No.(2019)01, Name: Security Assessment Model and Application Based on Food Safety Cloud Platform); the Natural Science Foundation of Anhui Province (Grant No.1708085MF159); and the Natural Science Project of Anhui Universities (Grant No. KJ2017A375).

Conflicts of Interest

The authors declare no conflict of interest.

References

  1. Wang, J.; Chen, Y.; Gu, B.; Guo, X.; Wang, B.; Jin, S.; Xu, J.; Zhang, J. An Approach to Measuring and Grading Software Trust for Spacecraft Software. Sci. Sin. Tech. 2015, 45, 221–228. [Google Scholar] [CrossRef]
  2. Liu, K.; Shan, Z.; Wang, J.; He, J.; Zhang, Z.; Qin, Y. Overview On Major Research Plan of Trustworthy Software. Sci. Sin. Tech. 2008, 22, 145–151. [Google Scholar] [CrossRef]
  3. Cortellessa, V.; Frittella, L. A Framework for Automated Generation of Architectural Feedback from Software Performance Analysis, Formal Methods and Stochastic Models for Performance Evaluation. In Proceedings of the Fourth European Performance Engineering Workshop, EPEW 2007, Berlin, Germany, 27–28 September 2007; Springer: Berlin, Germany, 2007. [Google Scholar] [CrossRef]
  4. Karavanic, K.L.; Miller, B.P. Improving Online Performance Diagnosis by the Use of Historical Performance Data, Acm/ieee Conference on Supercomputing. ACM 1999, 42. [Google Scholar] [CrossRef]
  5. Miller, B.P.; Callaghan, M.D.; Cargille, J.M.; Hollingsworth, J.K.; Irvin, R.B.; Karavanic, K.L.; Kunchithapadam, K.; Newhall, T. The Paradyn parallel performance measurement tool. Computer 1995, 28, 37–46. [Google Scholar] [CrossRef] [Green Version]
  6. Morajko, A.; Margalef, T.; Luque, E. Design and implementation of a dynamic tuning environment. J. Parallel Distrib. Comput. 2007, 67, 474–490. [Google Scholar] [CrossRef]
  7. Mikalef, P.; Pateli, A.; Wetering, R.V.D. IT flexibility and competitive performance: The mediating role of IT-enabled dynamic capabilities. In Proceedings of the European Conference on Information Systems, Istanbul, Turkey, 12–15 June 2016. [Google Scholar]
  8. Helm, B.R.; Malony, P.D.; Fickas, S.P. Capturing and automating performance diagnosis: The Poirot approach, International Parallel Processing Symposium. DBLP 1995, 606–613. [Google Scholar] [CrossRef]
  9. Espinosa, A.; Margalef, T.; Luque, E. Automatic performance evaluation of parallel programs. In Proceedings of the Sixth Euromicro Workshop on Parallel and Distributed Processing, Madrid, Spain, 23 January 1998. [Google Scholar] [CrossRef]
  10. Vetter, J. Performance analysis of distributed applications using automatic classification of communication inefficiencies. In Proceedings of the 14th International Conference of Supercomputing, Santa Fe, NM, USA, 8–11 May 2000; pp. 245–254. [Google Scholar] [CrossRef]
  11. Abaei, G.; Selamat, A.; Fujita, H. An empirical study based on semi-supervised hybrid self-organizing map for software fault prediction. Knowl. Based Syst. 2015, 74, 28–39. [Google Scholar] [CrossRef]
  12. Tregunno, P.; Xu, J.; Woodside, M.; Petriu, D.; Franks, G. Layered Bottlenecks and Their Mitigation. In Proceedings of the Third International Conference on the Quantitative Evaluation of Systems, Riverside, CA, USA, 11–14 September 2006. [Google Scholar] [CrossRef]
  13. Jamshidi, P.; Casale, G. An Uncertainty-Aware Approach to Optimal Configuration of Stream Processing Systems. In Proceedings of the 2016 IEEE 24th International Symposium on Modeling, Analysis and Simulation of Computer and Telecommunication Systems, London, UK, 19–21 September 2016. [Google Scholar] [CrossRef]
  14. Wang, W.; Casale, G. Bayesian Service Demand Estimation Using Gibbs Sampling. In Proceedings of the IEEE 21st International Symposium on Modelling, Analysis and Simulation of Computer and Telecommunication Systems, San Francisko, CA, USA, 14–16 August 2013. [Google Scholar] [CrossRef]
  15. Jha, P.C.; Bali, S.; Kumar, U.; Pham, H. Fuzzy optimization approach to component selection of fault-tolerant software system. Memet. Comput. 2014, 6, 49–59. [Google Scholar] [CrossRef]
  16. Jha, P.C.; Bali, V.; Narula, S.; Kalra, M. Optimal Component selection based on cohesion and coupling for component based software system under build-or-buy scheme. J. Comput. Sci. 2014, 5, 233–242. [Google Scholar] [CrossRef]
  17. Padhy, N.; Singh, R.P.; Satapathy, S.C. Software reusability metrics estimation: Algorithms, models and optimization techniques. Comput. Electr. Eng. 2017, 69, 1–16. [Google Scholar] [CrossRef]
  18. McIlroy, M.D. Mass-Produced Software Components. In Proceedings of the NATO Software Engineering Conference, Garmisch, Germany, 7–11 October 1968; pp. 88–98. [Google Scholar]
  19. Szyperski, C. Component Technology What, Where and How. In Proceedings of the International Conference on Software Engineering, Washington, DC, USA, 3–10 May 2003; pp. 684–693. [Google Scholar] [CrossRef]
  20. Sametinger, J. Software Engineering with Reusable Components; Springer: Berlin/Heidelberg, Germany, 1997; pp. 1–63. [Google Scholar] [CrossRef]
  21. Bachmann, F.; Bass, L.; Buhman, C.; Comella-Dorda, S.; Long, F.; Robert, J.; Seacord, R.; Wallnau, K. Volume ii: Technical concepts of component-based software engineering. Cmu Inter. Res. Dev. 2000, 13, 65–78. [Google Scholar] [CrossRef]
  22. Szyperski, C.; Gruntz, D.; Stephan, M. Component Software: Beyond Object-Oriented Programming; Addison-Wesley Publishing Co.: Boston, MA, USA, 2003; pp. 1–22. [Google Scholar] [CrossRef]
  23. Abdellatief, M.; Md Sultan, A. Component-based Software System Dependency Metrics based on Component Information Flow Measurements. In Proceedings of the Sixth International Conference on Software Engineering Advances, Barcelona, Spain, 23–29 October 2011; pp. 76–83. [Google Scholar] [CrossRef]
  24. Von Detten, M.; Platenius, M.C.; Becker, S. Reengineering Component-based Software Systems with Archimetrix. Softw. Syst. Model 2014, 13, 1239–1268. [Google Scholar] [CrossRef]
  25. Vale, T.; Crnkovic, I.; Almeida, E.S.; Neto, P.A.D.M.S.; Cavalcanti, Y.C.; de Lemos Meira, S.R. Twenty-eight Years of Component-based Software Engineering. J. Syst. Softw. 2016, 111, 128–148. [Google Scholar] [CrossRef]
  26. Tang, J.F.; Mu, L.F.; Kwong, C.K.; Luo, X.G. An optimization model for software component selection under multiple applications development. Eur. J. Oper. Res. 2011, 212, 301–311. [Google Scholar] [CrossRef]
  27. Jadhav, A.S.; Sonar, R.M. Framework for evaluation and selection of the software packages: A hybrid knowledge based system approach. J. Syst. Softw. 2011, 84, 1394–1407. [Google Scholar] [CrossRef]
  28. Baohua, W.; Yixiang, C. An Appreach of Matching for Software Components Based on Performance Specification. In Proceedings of the 4th International Conference on Quantitative Logic and Soft Computing (QLSC2016), Hangzhou, China, 14–17 October 2016. [Google Scholar] [CrossRef]
  29. Guo, H.; Yang, X. A simple reliability block diagram method for safety integrity verification. Reliab. Eng. Syst. Saf. 2007, 92, 1267–1273. [Google Scholar] [CrossRef]
  30. Misra, K.B. Handbook of Performability Engineering; Springer: London, UK, 2008; pp. 369–380. [Google Scholar] [CrossRef]
Figure 1. The series relation system.
Mathematics 07 00730 g001
Figure 2. The parallel relation system.
Mathematics 07 00730 g002
Figure 3. The choice relation system.
Mathematics 07 00730 g003
Figure 4. The Concurrence relation system.
Mathematics 07 00730 g004
Figure 5. The Loop relationship.
Mathematics 07 00730 g005
Figure 6. The logical structure of the component system.
Mathematics 07 00730 g006
Table 1. The flags of metric elements.
Metric Element Metric ElementAbbreviationFlag
CPU utilization ratioCu−1
Memory utilization ratioMu−1
Disk I/OIo−1
Maximum concurrent user numberMn1
ThroughputTo1
Average response timeRt−1
Table 2. The performance quantification of Components.
The Performance Specifications of Target ComponentsThe Performance Specifications of Candidate ComponentsQuantitative (Value)
{( “pay-response”,{(“pay-response”, “1000 users”, −1, 5)}1
1000 users”, -1, 6)}{(“pay-response”, “1000 users”, −1, 9)}0.71
{(“order-response”, “1000 users”, −1, 4)}0
{( “pay-response”,{(“pay-response”, “1000 users’, −1, 7)}0
“1000 users”,-1,6),{(“pay-response”, “1000 users”, −1, 6)}1
(“pay-throughput”,(“pay-throughput”, “1000 users”, 1, 30)}
“1000 users”,1,20)}{ (“pay-response”, “1000 users”, −1, 6)}0.87
{ (“pay-throughput”, “1000 users”, 1, 15)}
Table 3. The computation of the series relation system.
Metric ElementComputation
CPU utilization ratio C u s = m a x ( C u 1 , C u 2 , . . . , C u n )
Memory utilization ratio M u s = m a x ( M u 1 , M u 2 , . . . , M u n )
Disk I/O I o s = m a x ( I o 1 , I o 2 , . . . , I o n )
Maximum concurrent user number M n s = m i n ( M n 1 , M n 2 , . . . , M n n )
Throughput T o s = m i n ( T o 1 , T o 2 , . . . , T o n )
Average response time R t s = i = 1 n R t i
Table 4. The computation of the parallel relation system.
Metric ElementComputation
CPU utilization ratio C u s = m a x ( C u 1 , C u 2 , . . . , C u n )
Memory utilization ratio M u s = m a x ( M u 1 , M u 2 , . . . , M u n )
Disk I/O I o s = m a x ( I o 1 , I o 2 , . . . , I o n )
Maximum concurrent user number M n s = m i n ( M n 1 , M n 2 , . . . , M n n )
Throughput T o s = m i n ( T o 1 , T o 2 , . . . , T o n )
Average response time R t s = m a x ( R t 1 , R t 2 , . . . , R t n )
Table 5. The computation of the choice relation system.
Metric ElementComputation
CPU utilization ratio C u s = i = 1 n C u i × P i
Memory utilization ratio M u s = i = 1 n M u i × P i
Disk I/O I o s i = 1 n I o i × P i
Maximum concurrent user number M n s = i = 1 n M n i × P i
Throughput T o s = i = 1 n T o i × P i
Average response time R t s = i = 1 n R t i × P i
Table 6. The computation of the concurrence relationship system.
Metric ElementComputation
CPU utilization ratio C u s = m i n ( i = 1 n C u i , 1 )
Memory utilization ratio M u s = m i n ( i = 1 n M u i , 1 )
Disk I/O I o s = m i n ( i = 1 n I o i , 1 )
Maximum concurrent user number M n s = m i n ( M n 1 , M n 2 , . . . , M n n )
Throughput T o s = m i n ( T o 1 , T o 2 , . . . , T o n )
Average response time R t s = m a x ( R t 1 , R t 2 , . . . , R t n )
Table 7. The computation of the loop relationship system.
Metric ElementComputation
CPU utilization ratio C u s = C u 1
Memory utilization ratio M u s = M u 1
Disk I/O I o s = I o 1
Maximum concurrent user number M n s = M n 1
Throughput T o s = T o 1
Average response time R t s = n × R t 1
Table 8. The values of the metric elements of the component.
ComponentCPU Usage RateMemory Usage RateDisk I/O Usage RateMaximum Number of UsersThroughputAverage Response Time
C 1 0.40.50.45003003
C 2 0.20.30.16003504
C 3 0.20.20.34502005
C 4 0.250.250.255504503
C 5 0.30.30.34503504
C 6 0.350.350.354003006
Table 9. The computational results of performance metrics for component system.
Component SystemCPU Usage RateMemory Usage RateDisk I/O Usage RateMaximum Number of UsersThroughputAverage Response Time
s0.40.50.440030021
Table 10. The target value of the metric elements.
Component SystemCPU Usage RateMemory Usage RateDisk I/O Usage RateMaximum Number of UsersThroughputAverage Response Time
s0.60.70.550030025