Article

Evaluation of the Impact of Strategic Offers on the Financial and Strategic Health of the Company—A Soft System Dynamics Approach

Department of Operations Research, Faculty of Informatics and Communication, University of Economics in Katowice, ul. 1 Maja 50, 40-287 Katowice, Poland
*
Author to whom correspondence should be addressed.
Mathematics 2019, 7(2), 208; https://doi.org/10.3390/math7020208
Submission received: 29 December 2018 / Revised: 14 February 2019 / Accepted: 19 February 2019 / Published: 24 February 2019
(This article belongs to the Special Issue Advanced Methods in Mathematical Finance)

Abstract

:
When analyzing the possibility of supporting the decision-making process, one should take into account the essential properties of economic entities (the system and its objects). As a result, the development of an effective business model ought to be based on rationality and the characteristics of the system being modeled. Such an approach implies the use of an appropriate analysis and modeling method. Since the majority of relationships in the model are described using the experts’ tacit knowledge, methods known as “soft” are more suitable than “hard” in those situations. Fuzzy cognitive mappings (FCM) are therefore commonly used as a technique for participatory modeling of the system, where stakeholders can convey their knowledge to the model of the system in question. In this study, we introduce a novel approach: the extended weighted influence nonlinear gauge system (WINGS), which may equally well be applied to the decision problems of this type. Appraisal of high-value and long-term offers in the sector of the telecommunication supplier industry serves as a real-world case study for testing the new method. A comparison with FCM provides a deeper understanding of the similarities and differences of the two approaches.

1. Introduction

In this paper, we introduce an extended version of the Weighted Influence Non-linear Gauge System (WINGS) method [1] and apply it to a real-world case study. In this extended form, WINGS includes both positive and negative influences which substantially reinforce its analytical ability. To make a comparison and get deeper insights into the process and its results, we apply selected variants of fuzzy cognitive mappings (FCM) [2]—a method widely applied to many decision problems of different kinds (see e.g., References [3,4,5]).
Support of strategic decision making in the enterprise and its environment should be characterized by the use of real-captured observations from the enterprise’s ecosystem, determination of their dependencies, as well as models describing their significance, which, according to the company’s current practices, focus on the basic taxonomy of analytics services and data management architecture for business operations that translate mainly into quantitative methods and computational requirements [6]. The latter ones, together with the use of data (BigData) [7], collected mainly in business support systems (BSS) (“A business support system (BSS) is a group of business elements used in networking to help service providers gain customer insight, compile real-time subscriptions, and introduce new revenue generating services. A BSS is critical because it helps service providers support and extend operations to enhance business services. Business support systems are used by all service providers, including mobile, fixed and cable networks.” https://www.techopedia.com/definition/26873/business-support-system) omit the stage of analysis and modeling of (significant) expert knowledge (SmallData) (lack of proper information or treatment of information (as assessed by the management) as seemingly irrelevant or insignificant. These seemingly irrelevant behavioral observations contain very specific features that form the environment of the decisions, and must be included to avoid uncertainty in decisions) in the process of supporting decisions. This expert knowledge cannot be captured by “hard” quantitative models (System Dynamics), i.e., the framework of J. Forrester’s System Dynamics [8]). The use of expert knowledge in the process of supporting strategic decisions in the enterprise is complementary to quantitative models, forming the modeling that reflects the surrounding reality.
The assessment of the impact of strategic offers on a company’s ecosystem belongs therefore to the class of issues whose precise quantitative models may be not realizable, hence the proper and useful applicability of models and methods (where the emphasis is put more on the quality) remains susceptible to the method itself. It is also important to verify the usefulness of qualitative models in relation to the object studied and the managerial problem being solved.
The case study example of evaluation of strategic offers leading to the submission of an offer to client in the telecommunication industry has been taken as a baseline for analysis. Given that dependence on quality of decisions leads to submission of a chosen offer to the client, it may directly contribute to financial and strategic health of the company, which is actually the case, although sensible quantifications could only be based on a comparative approach of potential gains and losses, if a process of strategic offers selection is not applied (or its quality is in doubt). More practical benchmarks (although brought as indirect implications) relate to price realization, among other things, where in general the industry benchmark states an improvement of 4–6%, thanks to assisted decisions (source: Bain, Gartner (https://www.bain.com/consulting-services/advanced-analytics/; https://www.gartner.com/home (in reference to internal consulting - detailed results are confidential))). Therefore, we consider the quality of decisions no less important than the offers themselves. Different procedures of assessment may lead to different results (which may further turn into very important financial and strategic implications—billions of Euros in international corporation operations).
So far, the term soft system dynamics (SSD) has not obtained a precise scope or high popularity. It was introduced by Mendoza and Prabhu [9], who included in SSD the following approaches: cognitive map and its variants (e.g., bayesian causal map), influence diagrams (containing causal loops), and FCM (the competitive approach that can aspire to the same name is a synthesis of system dynamics (SD) and soft system methodology (SSM), called by the authors Holon Dynamics [10]). In view of similarities in the background, formalism, and objectives of FCM, the WINGS method, in its extended form, can also be considered an SSD approach.
The remaining part of the paper is organized as follows. The next Section 2 is a brief presentation of selected variants of FCM. Section 3 introduces the extended version of WINGS. In Section 4, we describe a real-world case study and its background. The results of FCM and WINGS and their comparison are the subject of Section 5. A deeper discussion of the problem and its solutions on a wider background is contained in Section 6. Conclusions (Section 7) close the main part of the paper. The mathematical correctness of the new approach is proven in Appendix A. The operation of the extended WINGS procedure and the interpretation of its results is illustrated in Appendix B.

2. Fuzzy Cognitive Map

The concept of the fuzzy cognitive map (FCM) was introduced by Kosko in 1986, as a universal tool for dynamic systems modeling [2]. It uses a simple representation of knowledge in the form of graphs of concepts and causal relationships between them (positive/negative dependencies, feedback loops, weights, initial/final state, etc.). As regards practical comprehension and good practice in setting up FCM models, it is important to represent only causality, with the notion that: “... Causal maps encode dynamic behavior (“something happens because and after something else has happened”), but the dynamic properties of the mapped system cannot be easily inferred ...” [3]. Furthermore, as the concepts (labelled 1, ..., 7 in Figure 1) and relationships can be different and subjective, it may be problematic to assign values to them or to form a quantitative model based on the qualitative view of the system. In general, by using positive and negative values of concepts and relationships bounded in the interval [ 1 ; 1], a Fuzzy Cognitive Map is an approach in which concepts and relationships between them are defined in specific ways in a given mental map that is used to calculate the strength of the impact of these elements.

The FCM Procedure

As FCM has been known for many years and has been the subject of many publications, we limit ourselves to a brief presentation of the related procedure. An interested reader can find suitable information about FCM in References [3,9,11,12].
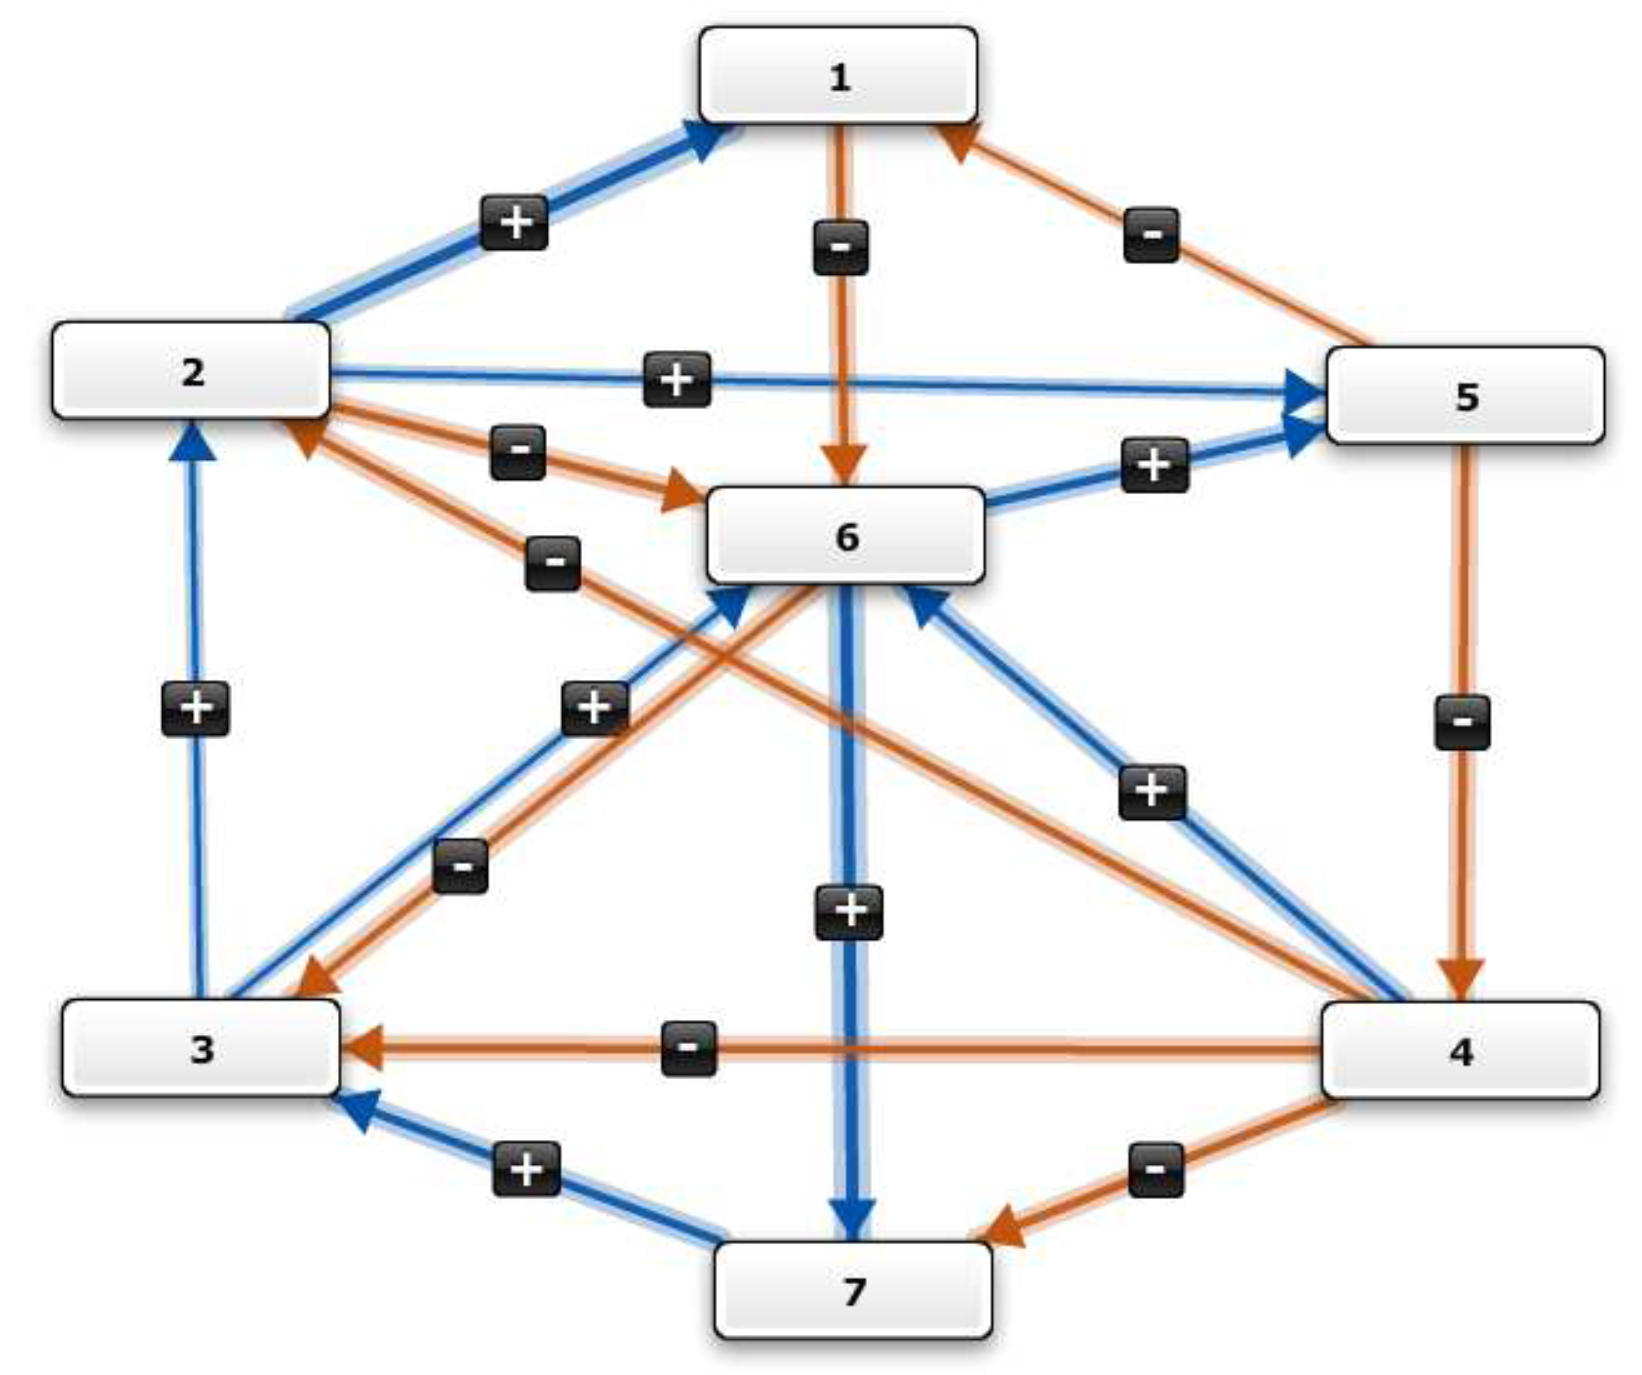
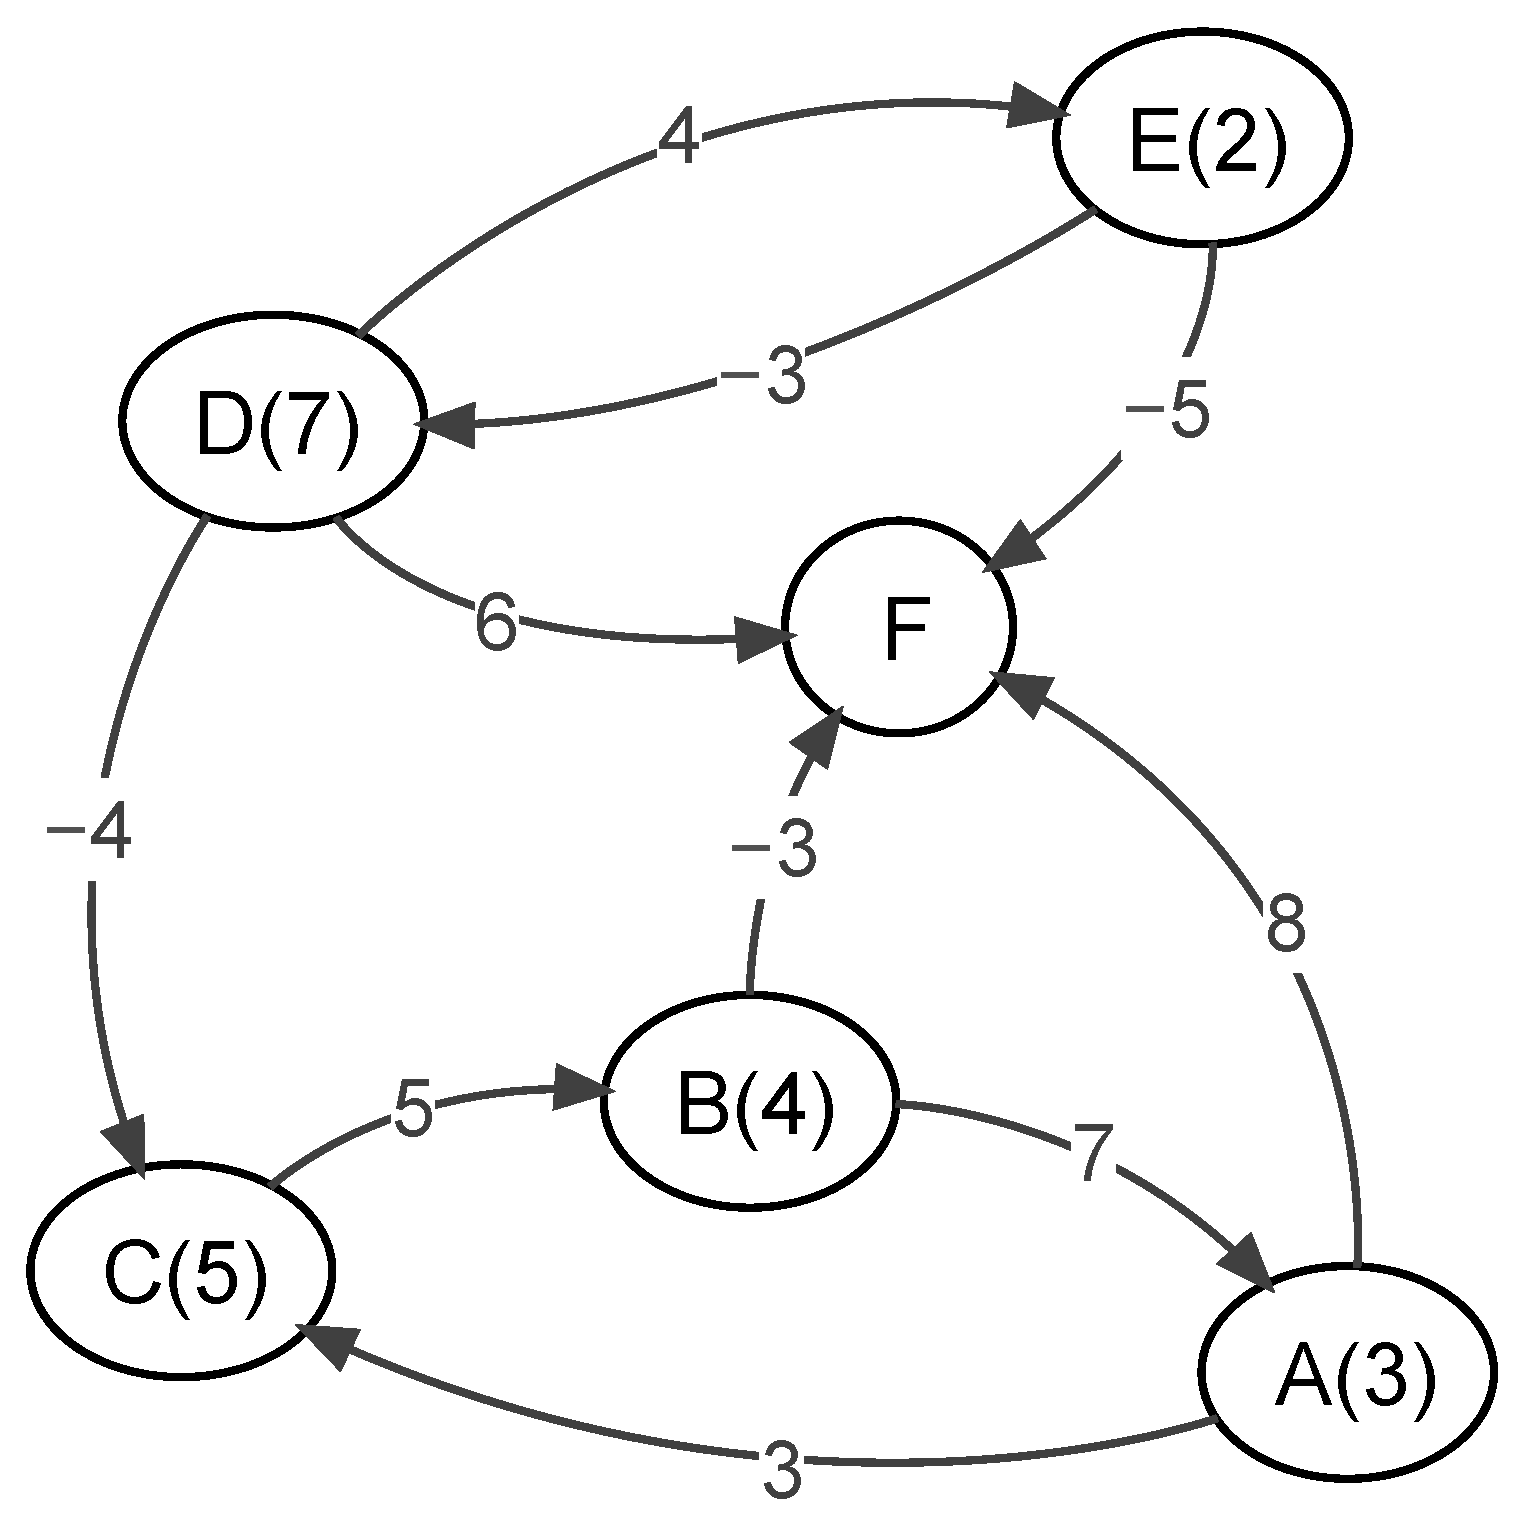
  • FCM is a cognitive description of a system that represents the model in the form of a weighted directed graph;
  • Concepts (nodes) are the important system components; their values are given by vector x = [ x 1 , x n ] , where n is the number of components in the system;
  • A = [ a i j ] is a transition matrix, describing the relations between the components;
  • The change of the system in consecutive iterations is given by the formula:
    x ( k + 1 ) = f [ x ( k ) A ] ,
    where x ( u ) is the system state vector at the iteration u, A is the transition matrix, f is threshold function, k is the iteration number, and x ( 0 ) is the vector of the initial state of the system;
  • Among many threshold functions used in (1), the following two are commonly used in modeling social systems [13]:
    linear:
    f ( x ) = a x + b .
    sigmoidal:
    f ( x ; z , h ) = 1 1 + e z ( x h ) ,
    where z is the slope, and h is the offset;
  • Depending on the slope and offset values, the output function may return distorted or even unstable results [13], for example, if z 0 is small enough, then there is a unique value f ( x ) ; if z 0 is large enough, there can be multiple (distinct) values;
  • Special attention should be paid to the mathematical aspects of FCMs when they are used by novice practitioners, because the choice of the initial conditions (linear case) or parameters (sigmoidal case) has a serious impact on the final output [13,14].

3. WINGS

A dynamic variant of WINGS, or the weighted influence nonlinear gauge system [1], introduced in this paper, and in parallel in Reference [15], can be considered as a new member of the soft system dynamics family for analyzing systems [9]. It uses a simple representation of knowledge in the form of a digraph consisting of concepts and causal relationships between them (similarly to FCM), but is based on different assumptions reflecting the internal dynamics of the tested object. It uses an analogy to physical behavior and does not need any threshold function, being free of additional parameters.

3.1. Assumptions of the WINGS Method

WINGS has been derived from interpretive structural modeling (ISM) and decision making trial and evaluation laboratory (DEMATEL) [16,17]. The important concept, which is not present in DEMATEL and has been introduced in WINGS, is internal strength. This seemingly insignificant change considerably enhances the modeling power and applicability of the WINGS method. Without the internal strength concept, DEMATEL cannot be used as a comprehensive approach and is usually hybridized with other methods, e.g., analytical hierarchy process (AHP).
Although WINGS is a relatively new method, it has been applied to a number of practical cases [18,19,20,21,22,23,24]. Notwithstanding, it is still in the early stages of development and needs time to mature. This means that its assumptions may still be neither fully nor clearly expressed (which is typical for many new ideas). In this situation, a repetition and extension of the WINGS foundations is advisable.
The following list comprises the assumptions of the generic WINGS method [1] (items 1–3 and 6) and two new items that come from the development and extension of WINGS in the following years (items 4 and 5).
  • Two basic features of the system components are responsible for the interrelations: internal strength and influence;
  • The objective mechanism of interactions should include direct and also all possible indirect relations between components which are a result of the transitivity of interactions;
  • The more complex interactions, involving more than two components, can be characterized with enough approximation by two-component interactions;
  • The strength of indirect interaction between two components decreases with the length of the path between the components (the length of the path is measured by the number of intermediate components on the path, or equivalently, by the number of path segments);
  • Time in which a model reaches its stable final state is short enough to allow a reasonable inference about the final state of a real-world system;
  • Although an objective measurement is not possible, the experienced specialist can make rational assessments (also expressed in numbers) of the strength (importance) of the components and influences between them.

3.2. WINGS Procedure—Dynamic Variant

The WINGS method consists of three main stages: (1) qualitative analysis, (2) quantitative evaluation, and (3) calculations (technical stage).

3.2.1. Qualitative Analysis

We begin with the structuring of our problem. The systemic approach consists in creating a list of relevant factors and determining the most important interdependencies among them. An essential part of WINGS is the construction of a digraph whose nodes represent system components (concepts) and arrows represent their mutual influences. An arrow going from an influencing node to an influenced node indicates a non-zero influence (here the dynamic variant differs from generic WINGS that has only positive influences). Each arrow is labeled with a plus or a minus indicating the type of influence: a plus if the influencing component enhances (strengthens) the influenced one, or a minus if the influencing component diminishes (weakens) the influenced one.
The WINGS digraph is similar to the cognitive (or causal) map [25], often used in applications of problem structuring methods [26]. It may thus be helpful to use procedures worked out within those approaches, such as strategic options development analysis (SODA) [25,27] or soft systems methodology (SSM) [28,29], especially when working with a group of stakeholders. The six-steps procedure developed for FCM by Jetter [3] may also be applied to the WINGS modeling process.
In the next step, the user is asked to provide a linguistic scale for the evaluation of influences in the system. The number of points on the scale depends on the given problem and on the preferences of the user. The scale can contain only three points, e.g., low, medium, high. If the user feels that more points are needed to characterize the relations among the components, the scale can be expanded by adding, e.g., “very low” and “very high” or more verbal descriptions [20]. Both positive and negative interrelations are allowed, which significantly increases the utility of WINGS.
The ultimate role of a system component does not depend only on the intensity of its influence on other components. A fundamental attribute of a component is its inherent property that takes part in its relations with other components [1]. In WINGS it is called internal strength. Depending on the type of the system, relations, and the component itself, internal strength serves as a qualitative assessment of physical size, cardinality, political power, importance, or any other relevant qualitative characteristics. In decision making, some components are interpreted as intermediate or ultimate consequences; they function as sub-criteria or criteria and their internal strengths are related to weights, that is, measures of criteria importance. When the dynamic behavior of a system is considered, internal strength becomes a measure of the initial state of a concept.
It should be noted that from a formal point of view, internal strength represents the influence of the node on itself—it is a self-loop. This is a direct consequence of the matrix algebra applied to evaluate the WINGS output (Section 3.2.2).

3.2.2. Quantitative Evaluation

The main objective of this stage is to assign numerical values to verbal evaluations set up in the previous stage. Quantitative evaluations reinforce the discriminating power of the method and allow it to calculate influence along paths of any length. As mentioned in the Introduction, we assume that the user is able to assess the relative power of interrelations and concepts and to map them onto a numerical scale. It is not difficult to realize that the ratio scale is the only choice when the final measure for a system component is the product of constituent measures. In other words, the results are invariant only under a positive homothetic transformation (see e.g., Reference [30], Chapter 3).
These values and their relationships are selected by the user, but for simplicity and to preserve a balance between strength and influence, it is recommended to use integer values and the same mapping for both measures. The lowest non-zero level (e.g., low or very low) represents a standard unit on the scale; other numbers are assigned to higher scale points by comparison with this unit level. As the ratio scale is assumed, the comparison means that we assess the ratio of higher-level points from the verbal scale to the first (unit) level. It is presumed that a knowledgeable user is able to adequately express the relations between system components. The mapping can be linear, e.g., ‘medium’ is twice as high as ‘low’, ‘high’ is three times as high as ‘low’, and ‘very high’ is four times as high as ‘low’. Alternatively, it can represent some degree of non-linearity, e.g.,: ‘medium’ = 2, ‘high’ = 3, ‘very high’ = 6 (which means that the user set: ‘medium’ = 2 × ‘low’, ‘high’ = 3 × ‘low’, ‘very high’ = 2 × ‘high’ = 6 × ‘low’) [20]. For the internal strength, only positive values are possible. As influence can be positive or negative, its scale consists of pairs ± 1 , ± 2 , …and zero as the neutral point (no influence and no arrow in the digraph).

3.2.3. Technical Stage—Calculation of Output

The technical stage (calculations) consists of the following steps:
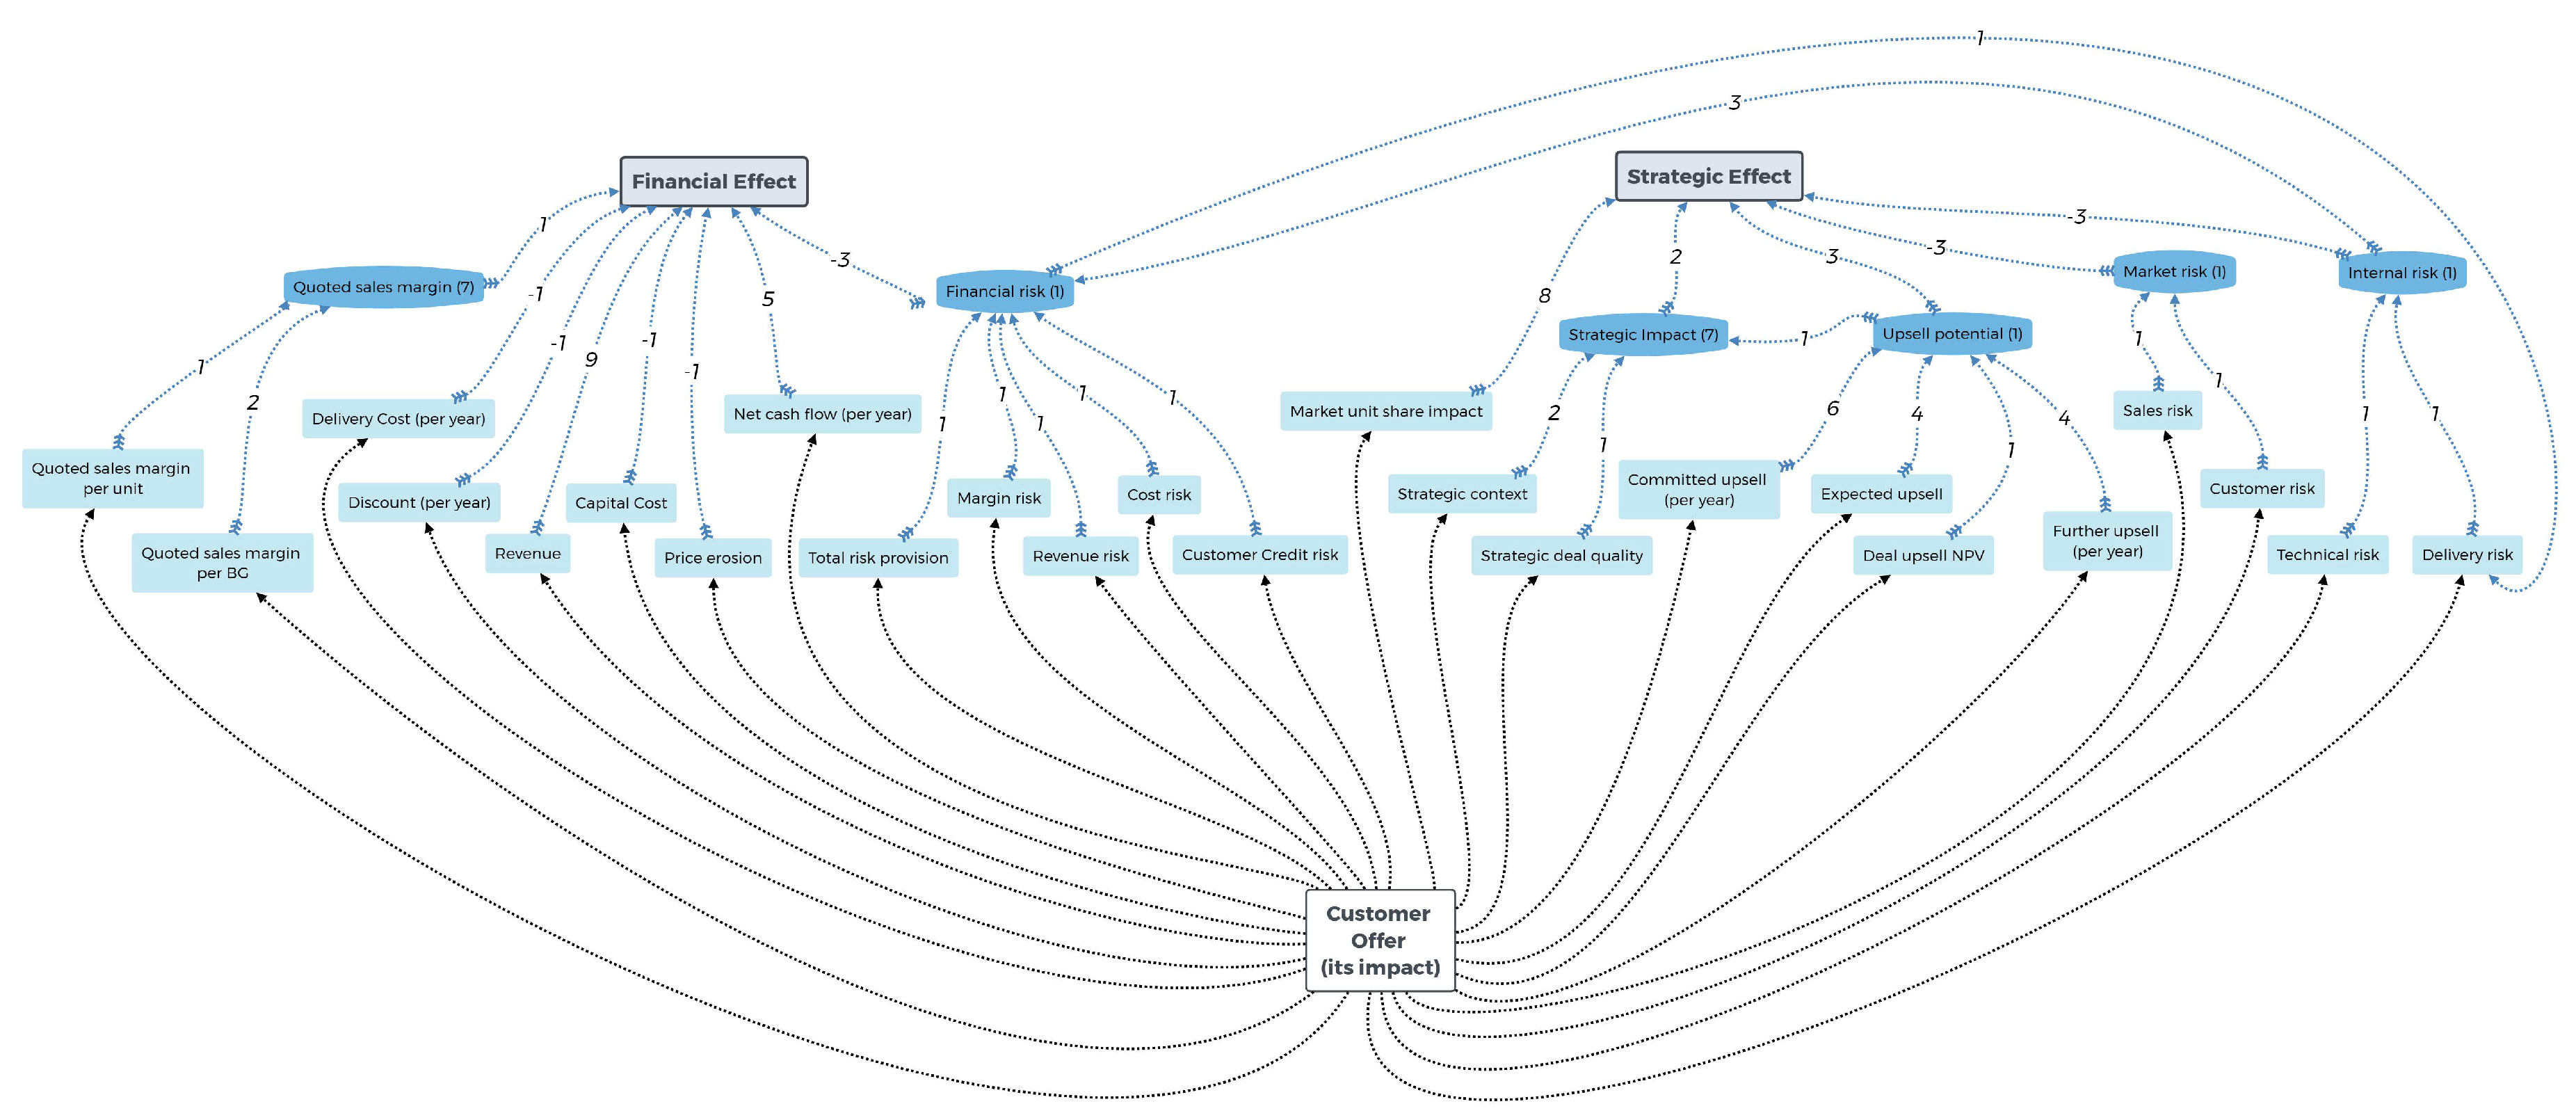
  • All numbers are inserted into the direct strength-influence matrix D , which is an n × n matrix with elements d i j (n is the number of components in the system).
    • Values representing strengths of components are inserted into the main diagonal, i.e., d i i = strength of component i;
    • Values representing influences are inserted so that for i j , d i j = influence of component i on component j.
  • The matrix D is scaled according to the following formula:
    S = 1 s D ,
    where S is the scaled strength-influence matrix and the scaling factor is defined as the sum of absolute values of all elements of D , i.e.,
    s = i = 1 n j = 1 n | d i j | .
  • The total strength-influence matrix T is calculated from the following formula (with the scaling defined in Equation (4), the series below converges, and thus T is well-defined; the proof is given in Appendix A).
    T = S + S 2 + S 3 + = S ( I S ) 1 .
    Matrix T represents the sum of influences along all possible paths in the WINGS digraph. If strength has non-zero values, self-loops of arbitrary length occur in the digraph, even if it does not contain loops. However, it should be noted that as a result of scaling, the contribution becomes lower with the path length.
  • For each element in the system, the row sum I i r and the column sum R j r of T are calculated:
    I i r = j = 1 n t i j , R j r = i = 1 n t i j .
  • For each element in the system, the row sum I i a and the column sum R j a of | T | are calculated:
    I i a = j = 1 n | t i j | , R j a = i = 1 n | t i j | ,
where t i j are the elements of T .
The core WINGS output for each component i consists of two groups of numerical indicators. The first group comprises the relative (net) impact, receptivity, involvement, and role:
  • I i r relative total impact represents the net (algebraic sum of positive and negative items) influence of component i on all other components in the system,
  • R i r relative total receptivity represents the net influence of all other components in the system on component i,
  • | I i r | + | R i r | relative total involvement represents the sum of all net influences exerted on and received by component i,
  • | I i r | | R i r | indicates the net role (position) of component i in the system; if it is positive, component i belongs to the net influencing (cause) group; if it is negative, component i belongs to the net influenced (result) group.
The addends in Equation (7) can be positive or negative, hence their algebraic sum reflects the relative levels of total impact and receptivity. As a result, both relative total impact and receptivity can be positive or negative. We define the relative total involvement and role as the sum and difference of absolute values, because the compensation between I i r and R i r would distort the meaning of involvement and role.
The second group comprises absolute impact, receptivity, involvement, and role:
  • I i a absolute total impact represents the absolute influence of component i on all other components in the system,
  • R i a absolute total receptivity represents the absolute influence of all other components in the system on component i,
  • I i a + R i a absolute total involvement represents the sum of all absolute influences exerted on and received by component i,
  • I i a R i a absolute role (position); if it is positive, component i belongs to the absolute influencing (cause) group; if it is negative, component i belongs to the absolute influenced (result) group.
According to Equation (8), the absolute total impact and receptivity are defined by the sum of the absolute values of the elements of T . There is no compensation in this sum, hence they represent the absolute power of exerted and received influences. The combination of relative and absolute measures provides a comprehensive evaluation of the system components.

4. Case Study

The firm in question is an international corporation dealing with telecommunications network infrastructure and advanced industry technologies. It has regional and local offices operating throughout the world. It invests in technologies of the future (e.g., 5G, IoT), providing broadband and fixed-network infrastructure and operator services. The company’s business is linked organizationally and cross-functionally with business groups, business lines (business lines are part of a business group), etc., each with its own profit and loss responsibility, which is conducive to efforts to satisfy the corporate targets in a responsible manner.
For the case study model, we consider a business line that accommodates strategic business, thus deals with strategic offers and contracts won previously (strategic and other offers that should always be evaluated before submitting/concluding a contract (contracts won are delivered in the form of telecommunication products and services to the clients. Typically a single strategic offer is a project (contract) that can be worth hundreds of millions and takes a few years to complete). In such a strategic business, some boundary conditions, showing the health of the customer offer, are compulsory. The impact of the evaluation of the strategic offers on financial and strategic domains contributes therefore to the health of the company/business line (one should also take into account the limited technical and labour resources available). The case study model ought to simulate the impact of an offer on the current financial and strategic health of a business line, which should indicate the strategic offer best suited to the strategy of the firm/business line. As regards the internal dynamics of the model, the formal delays, which appear as an effect of sequence of concepts, do not disturb the results, because they represent causal relationships occurring in a negligible time in relation to the tested state of effects in the company.
For the quantitative assessment (prior to the quantitative assessment, the qualitative analysis was performed as experts’ input. To turn it into a quantitative form, experts were asked to assign scores from the range [ 9 ; 9 ] for WINGS. To restrict the values to the interval [ 1 , 1 ] , which is needed in FCM, all input values were divided by 9), the verbal appraisals were translated into numbers as follows: very weak = 1, weak = 3, medium = 5, strong = 7, very strong = 9. The even numbers 2, 4, 6, 8 can be used for intermediate evaluations. As a result, the initial state can have an integer value: 1 , 2 , , 9 , and influence: ± 1 , ± 2 , , ± 9 . The overall model (Figure 2) also outlines expert knowledge about engaged firm’s/business line personnel in assessment of influences of the key aspects (considered as criteria) in the process of strategic customer offer evaluation—these are the numeric values labelling the arrows. Additionally, the experts defined “Quoted sales margin” and “Strategic impact” (with the weight of importance equal to “7” for each), as well as “Financial risk”, “Upsell potential”, “Market risk”, and “Internal risk” (with the weight of importance equal to “1”) for “Financial" and “Strategic” effects. Needless to say, some criteria influence each other, i.e., “Upsell potential” influences “Strategic impact” in “Strategic effect”; there are also interactions between “Strategic effect” and “Financial effect” (i.e., “Internal risk” on “Financial risk” and “Financial risk” on “Delivery risk”, which creates the soft effect of a feedback loop).
Finally, the Strategic and Financial domains are also characterized by various predefined key performance indicators (KPIs) among Strategic and Financial, each tracked by the company’s business support systems (alternatively, also with the use of synthetic data [31]). These KPIs are listed in Table 1 (numeric values are derived from actual parameters mapped on the scale used (i.e., “Net cash flow (per year)”, “Revenue”)) for the:
  • Current status of the firm/business line (these values are given in parentheses);
  • Offers A, B, C—these columns contain impacts of the offers on the current status of the firm.

5. Results

5.1. Results of the FCM Procedure

The initial state vector consists of the values of the“Current status of the firm” (Table 1). For FCM, all input values were divided by 9 to keep them in the interval [ 0 , 1 ] . For both FCM variants (linear and sigmoid threshold functions), to evaluate the offers, we used the values of stable final states of concepts Financial Effect and Strategic Effect.
Our experiments with the linear function show that all the concept values tend to zero very fast (after eight iterations all the values are usually less than 10 5 ), which confirms the previous observations [13] for the case of a concept with no input. In this situation, its value will immediately reach “zero” and remain at that value in the next computational steps. To avoid this, such a concept (in our case: Offers A, B, C) is made a driver in the model with a self-reinforcing loop [5] of weight 1 [13] (another way of keeping the causal concept (here, an offer) permanently active is to use clamping [3]). After a few iterations (about eight), the values of the concepts become stable (reach an equilibrium) and give the results presented in Figure 3.
The results of the calculations with the sigmoid threshold function, as defined in Equation (3), depend on slope z. In relation to Reference [13] for our network of 33 concepts, the upper bound for a unique fixed point is about z = 0.1 . For that value, the differences in Financial and Strategic Effects for the offers considered are practically indistinguishable. The differences increase with the increase of the slope, so for further calculations we chose z = 1 . The results place the offers on the plane of Financial Effects–Strategic Effects in the same way as the linear function (Figure 4). According to both FCM variants, Offer C dominates both Offer A and Offer B. Offer B is better then Offer A in Financial Effect, while in Strategic effect the relation is reverse.

5.2. Results of the WINGS Procedure

As stated in Section 3, the WINGS method, similar to FCM, uses a simple representation of knowledge in the form of a digraph with concepts and causal relationships between them, based on different assumptions reflecting the internal dynamics of the tested object (analogously to the physical interactions of objects). The key difference is that WINGS does not use any threshold function, having neither susceptibility for calibration nor receptivity of outcomes of stability depending on any native parameters of the threshold function (linear or sigmoid), which is a prerequisite of FCM.
In order to evaluate the impact of the offers on the Financial Effect and the Strategic Effect, we used their relative total involvements (Figure 5). The relative total involvement of a concept in WINGS is an equivalent of a final state in FCM. The position of the offers on the plane was exactly the same as for both FCM variants.

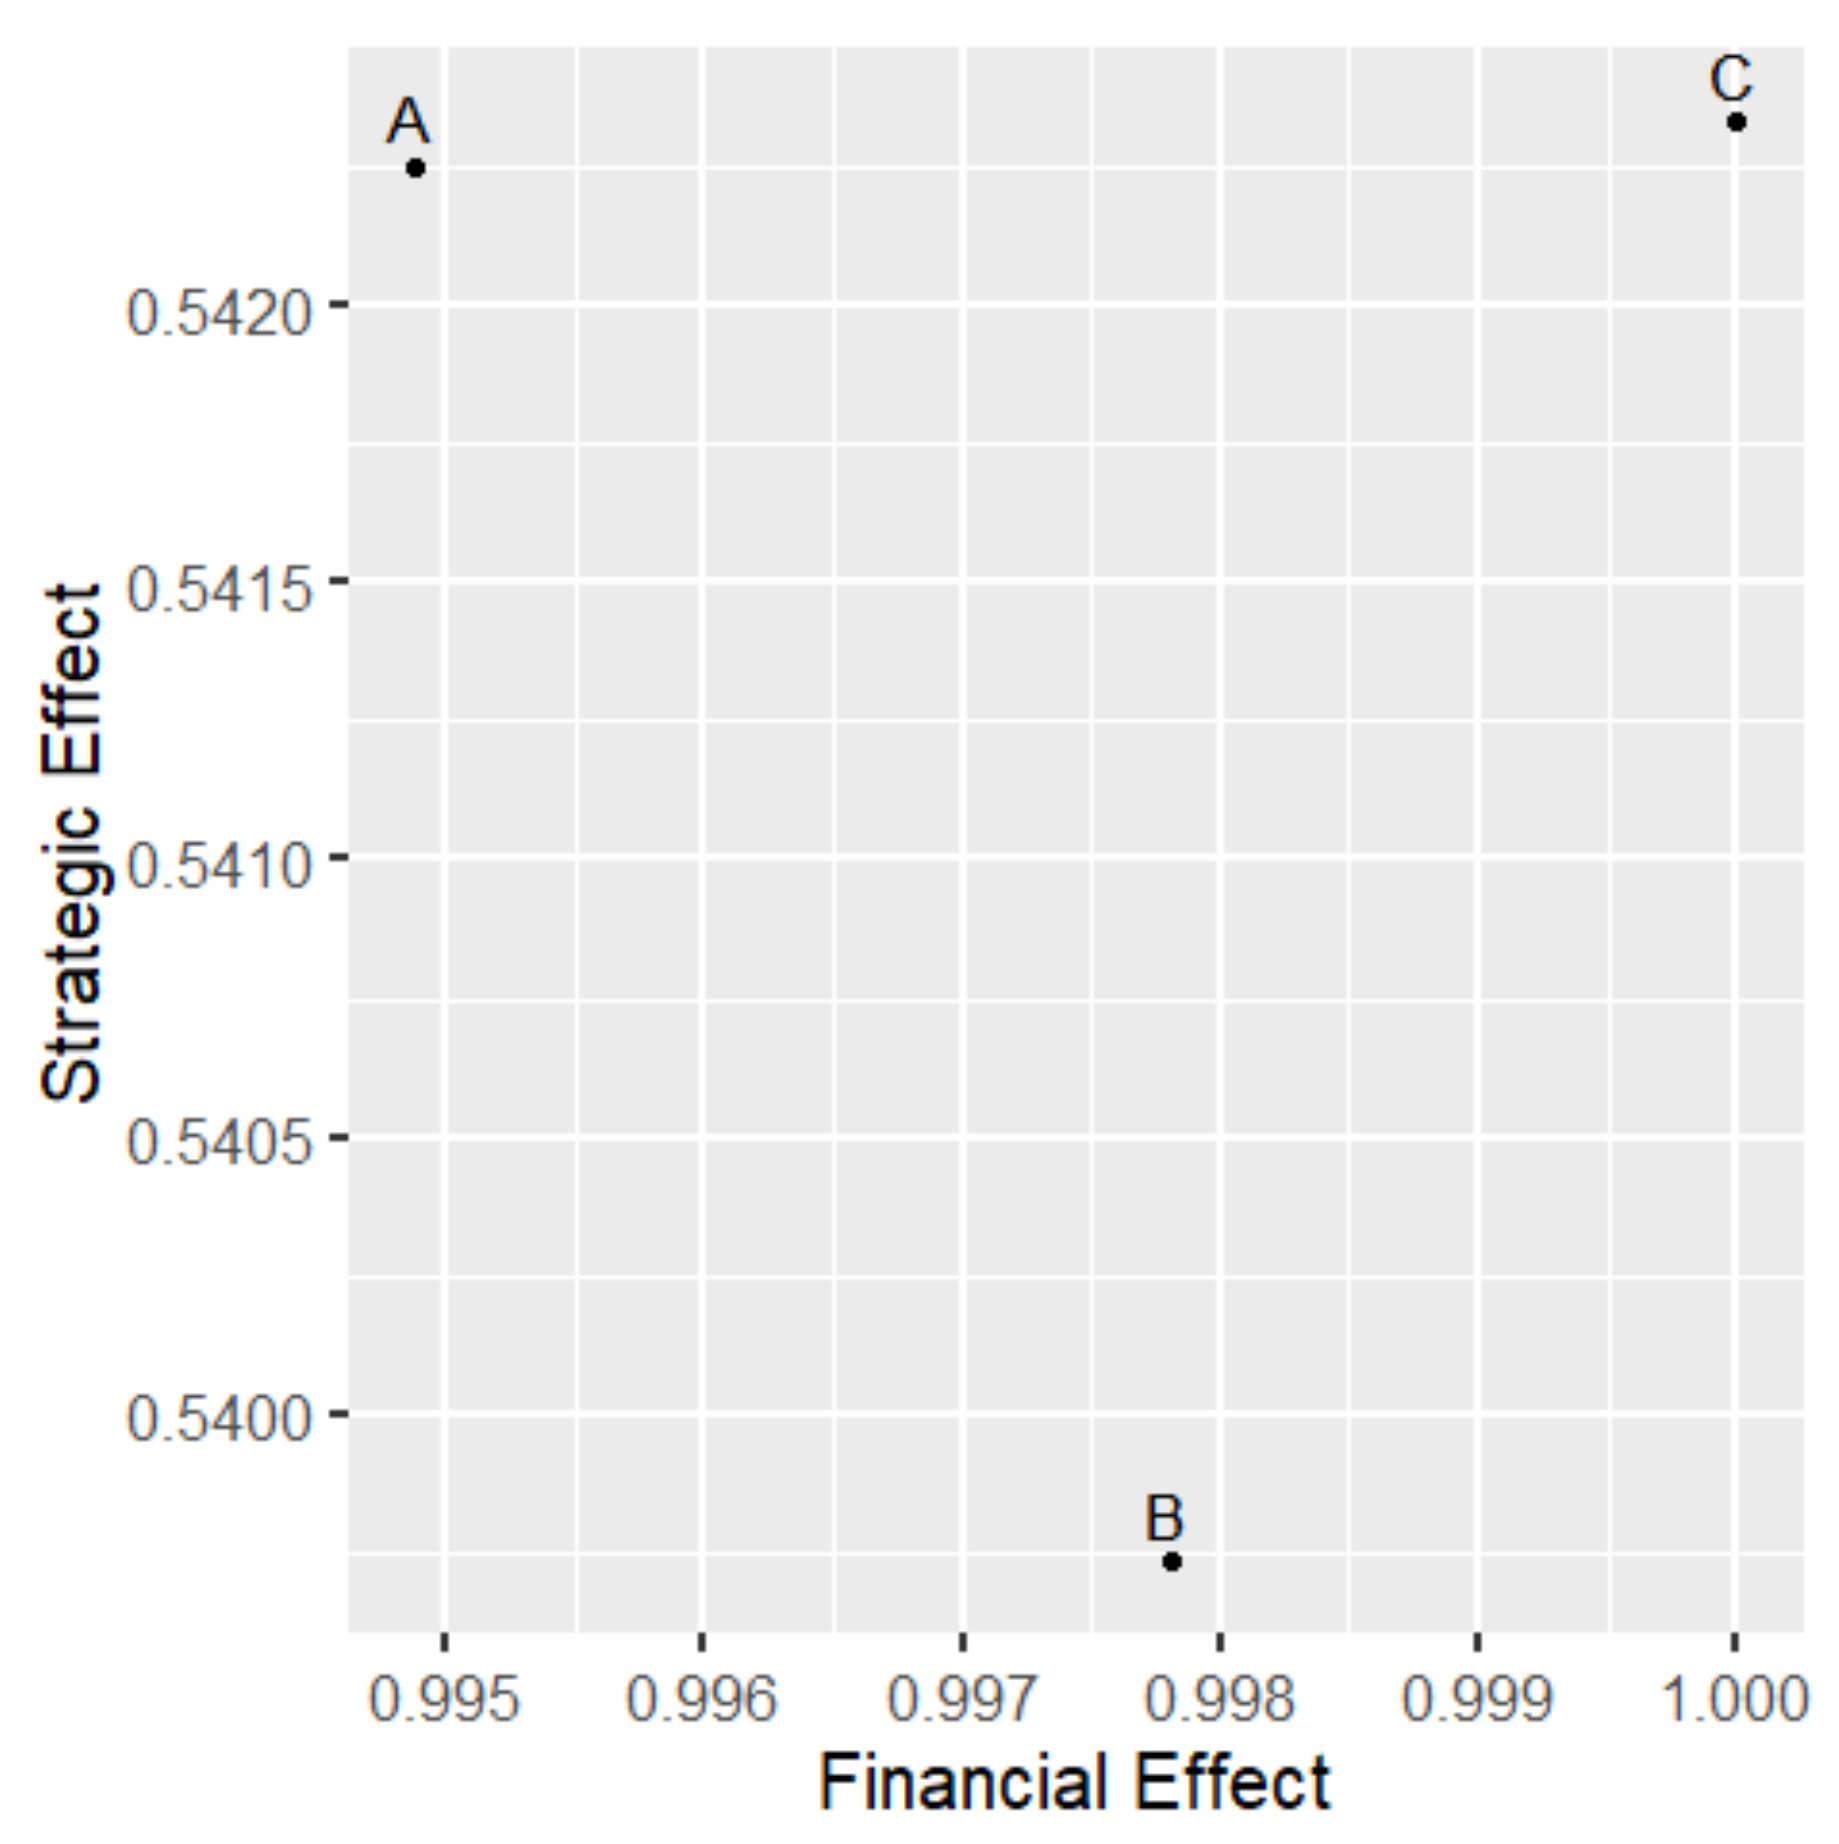
5.3. Comparison of the FCM and WINGS Results

Figure 3, Figure 4 and Figure 5 clearly show that both FCM variants and WINGS lead to the same rankings of offers. The following rankings have been obtained (Table 2 and Table 3):
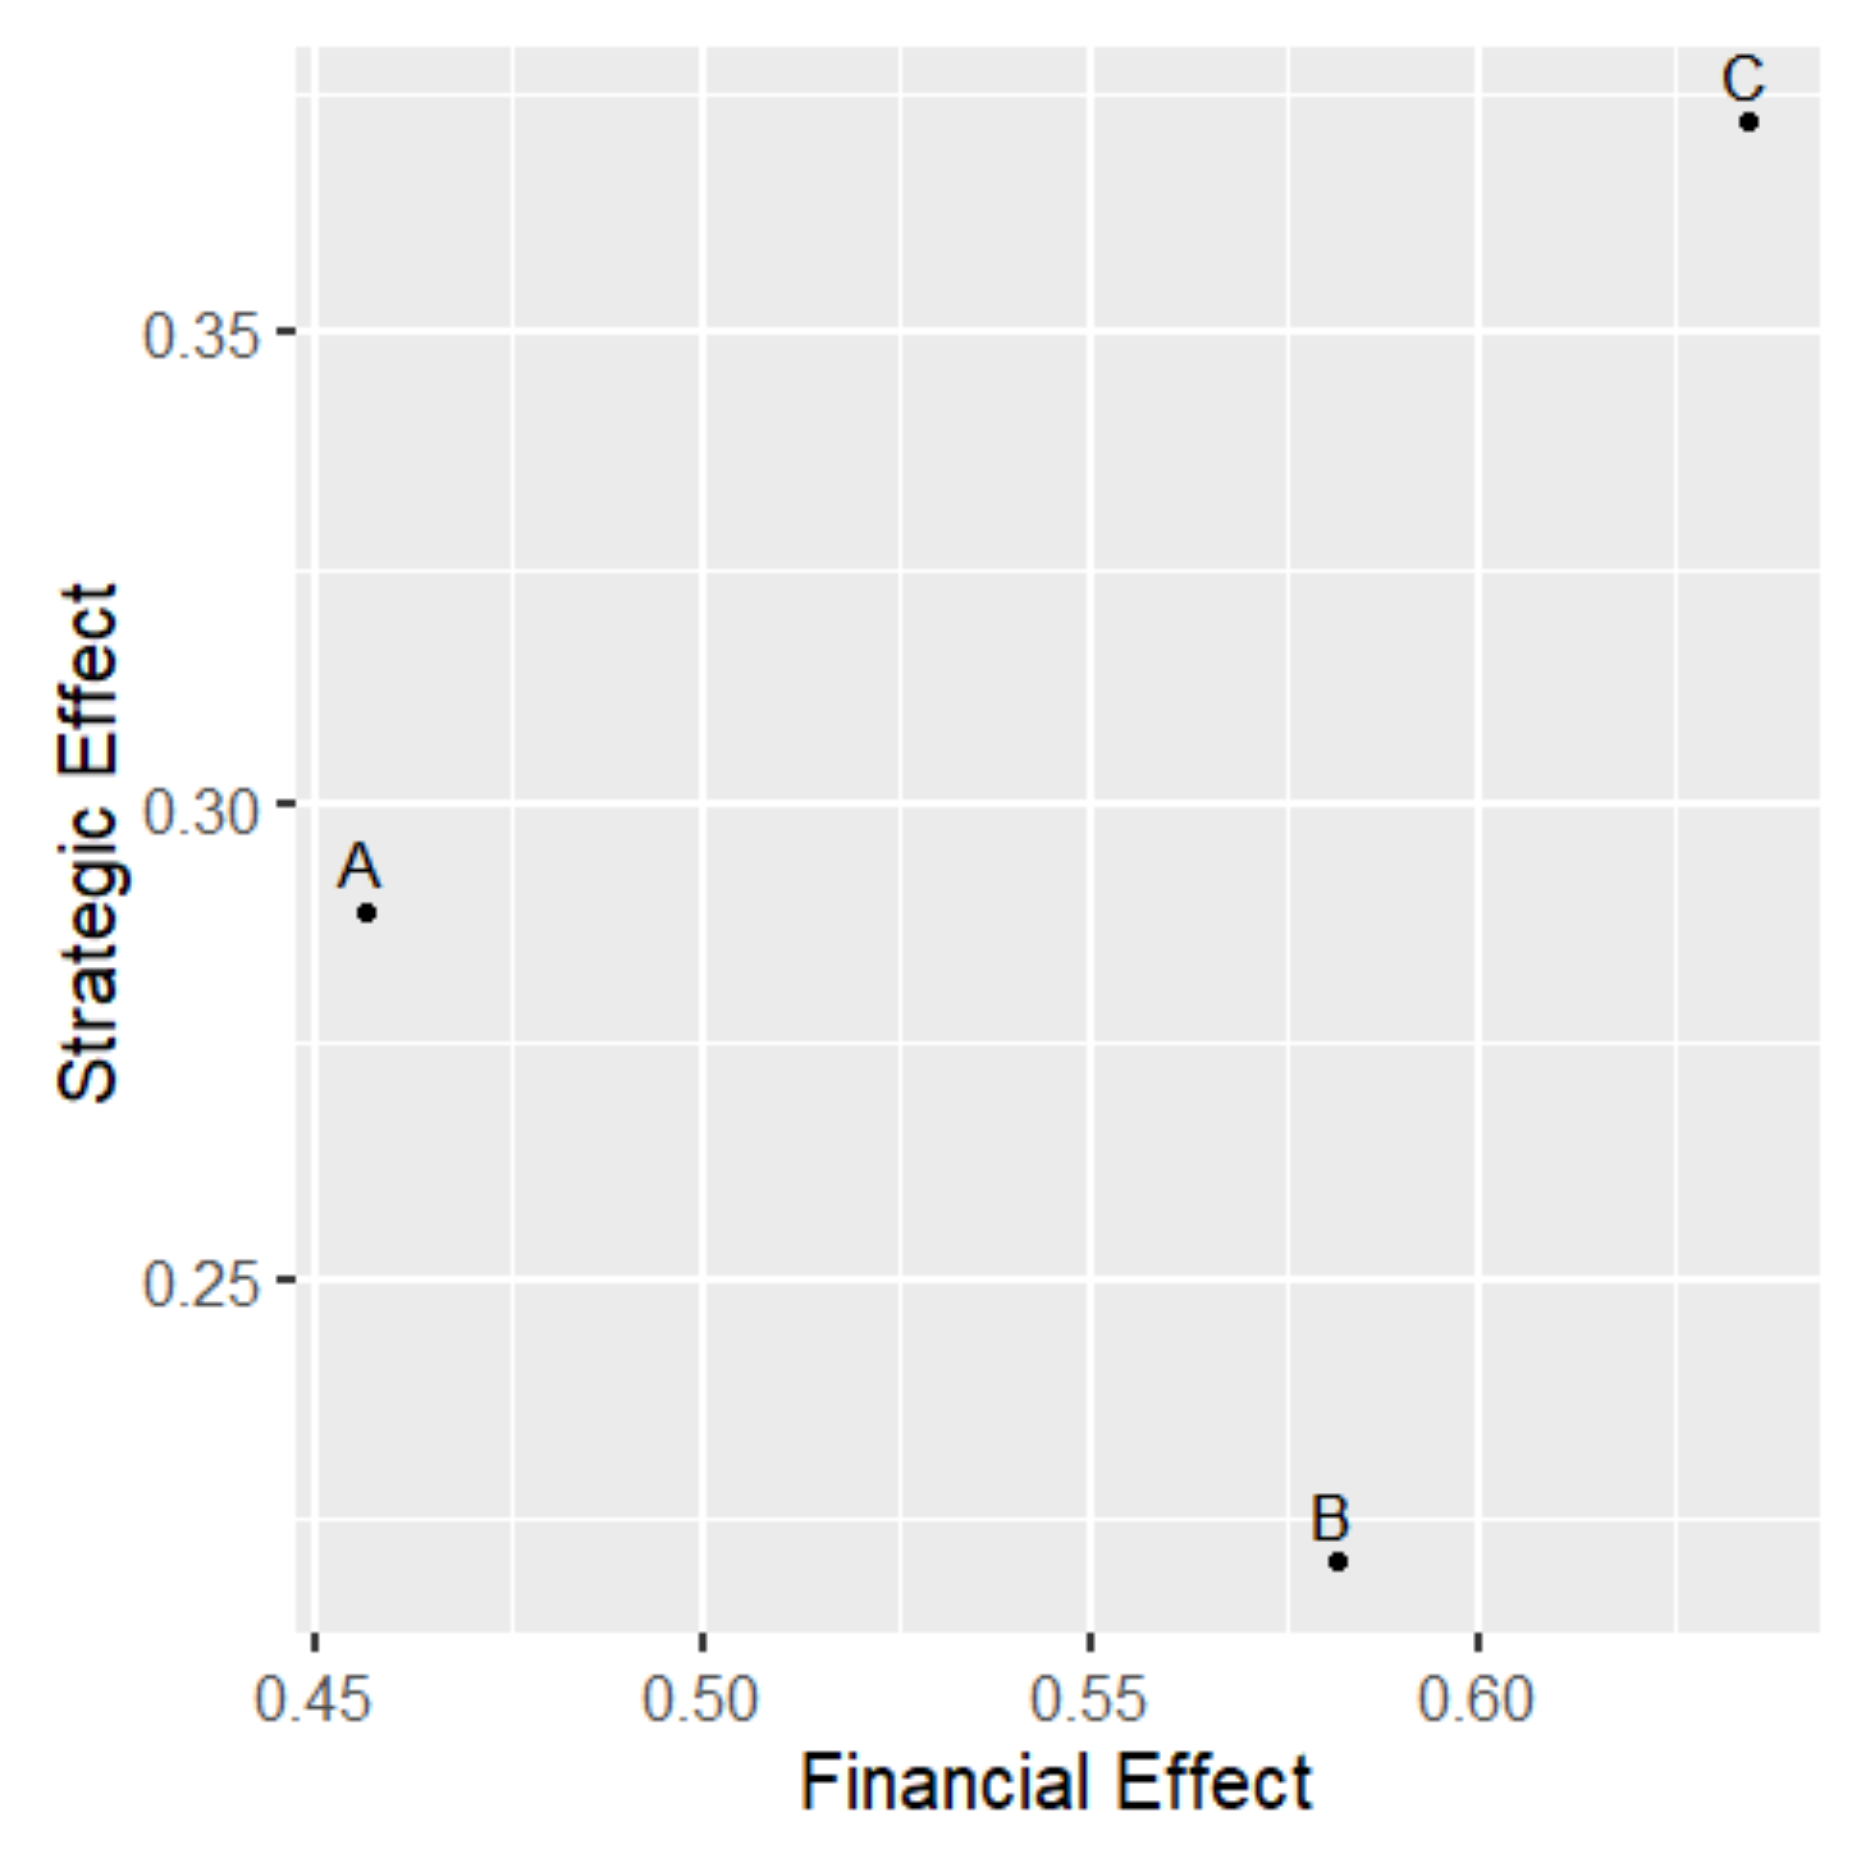
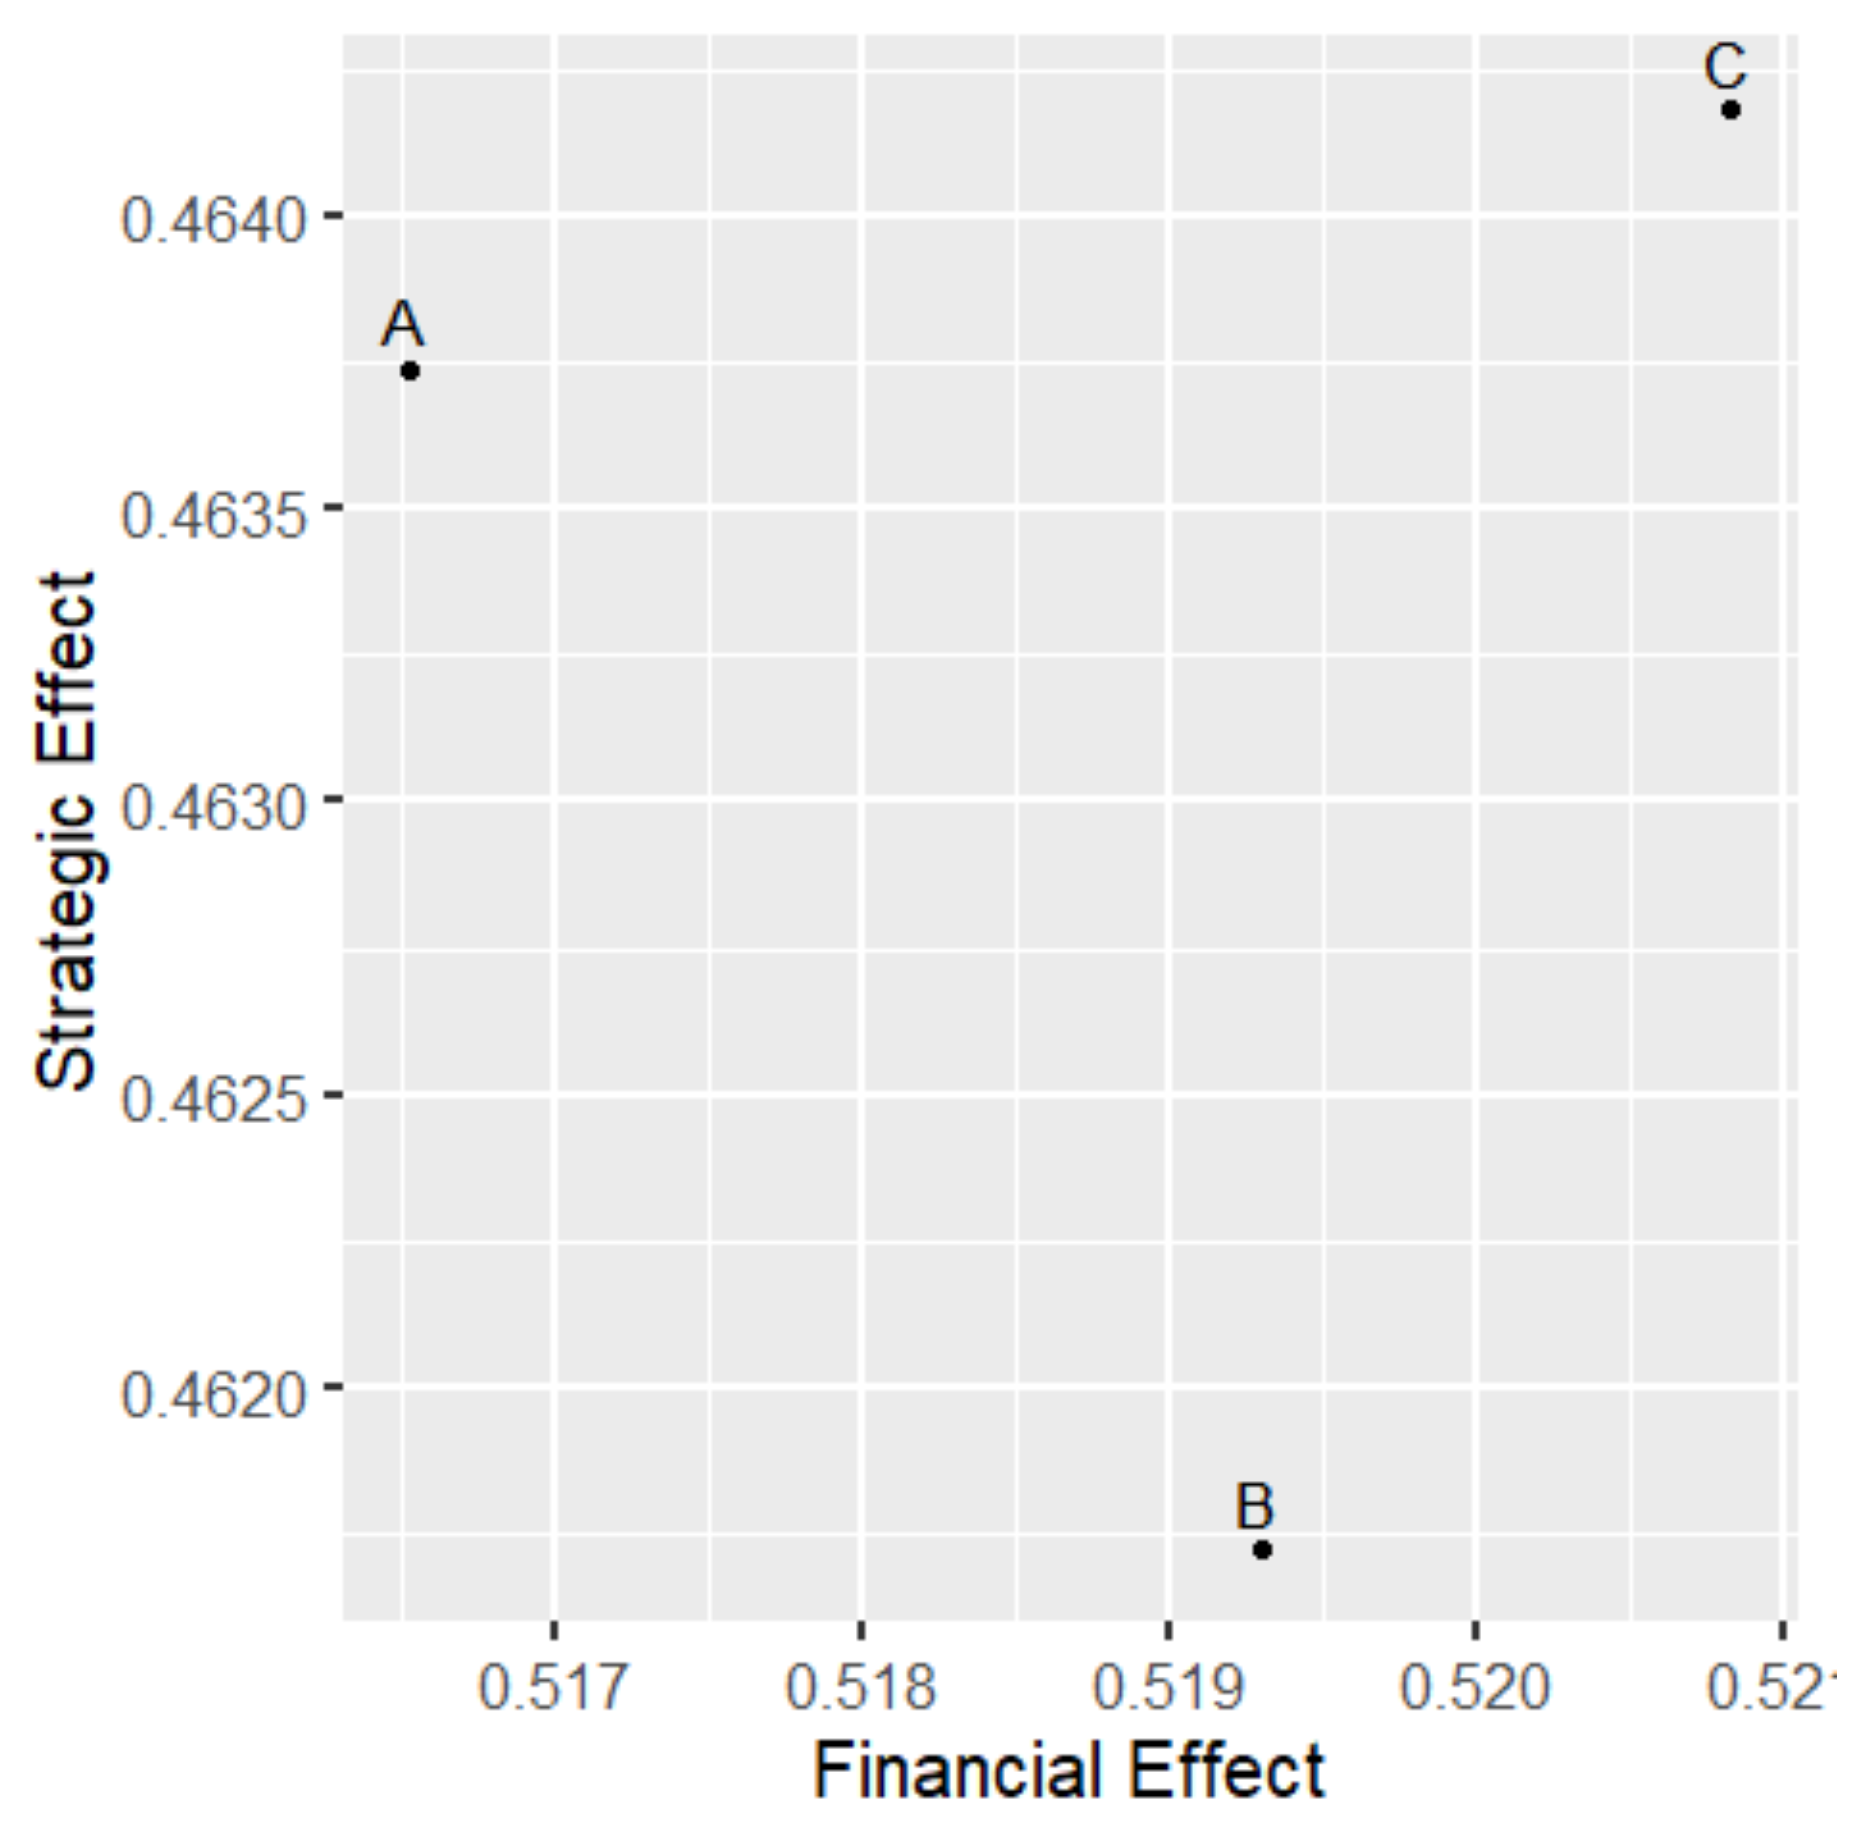
  • Financial Effect: WINGS and both FCM rankings are the same: Offer C—rank 1, Offer B—rank 2, Offer A—rank 3;
  • Strategic Effect: WINGS and both FCM rankings are the same: Offer C—rank 1, Offer A—rank 2, Offer B—rank 3.
WINGS and FCM differ significantly in the calculation mechanism. The threshold functions—linear and sigmoid—are also different enough to affect the final results. Therefore, the same rankings in Financial and Strategic Effects obtained in FCM-linear, FCM-sigmoid, and WINGS methods can only be a coincidence. In addition, for WINGS and FCM-sigmoid, the values of Strategic Effect caused by Offers A and C are very close, which can result in sensitivity of ranking.
In order to examine what can happen if some values in the model are changed, we performed a series of simulations. An increase in the impact of ‘Net cash flow’ on Financial Effect from 5 to 9, which favors Offer A over B, did not change anything. When we added another change i.e., an increase in ‘Quoted sales margin per BG’ from 2 to 6, which favors Offer A over B and C, Offer A moved to the second position in the WINGS financial ranking. In both FCM variants, the rankings did not change (Table 4).
Similarly, an increase of a single value only of the impact of ‘Expected upsell’ on ‘Upsell Potential’ from 4 to 8, which favors B over A and A over C, resulted in the FCM-linear advanced Offer B moving up to the second position in strategic ranking. When we added another change i.e., an increase of the impact of ‘Upsell potential’ on Strategic Effect from 3 to 6, Offer B moved up to the first position, but Offer C preserved its dominance over Offer A. WINGS and FCM-sigmoid did not change (Table 5).
Such simulations are commonly used to examine the sensitivity of the solution to uncertain input data. They also serve for tuning the model in a validation stage. As there is no objective, absolute measure that can help in choosing the best method and the best model, this is always a challenge. The participation of domain experts supports the high quality of the modeling process. Whenever possible, the output of the model should be compared with the behavior of a real-world system.

6. Discussion

On the basis of a long experience of one of the authors (D.B.) in the telecommunications industry, we look at the problem of evaluation of strategic offers, and in general, at decision making through the aspects of practicalities in terms of method, managerial approach, and consequences. In the Introduction section, the topics of BigData, SmallData, and the current practices associated with them have been already mentioned. They translate into disjoint approaches to the analysis and modeling of Big and Small data. It may also happen, in an unfavorable course of events, that the modeling is burdened by no or insufficient knowledge on the part of the managerial staff about the methods and their nuances to analyze the complexity of the problems they face in their company’s operations. This together with the simultaneous use of supporting tools [32] offered by various providers (methodologically rooted in Operations Research, such as MCDA, AHP, etc., or in "Analytics", such as Monte Carlo, or even in FCM [33]) to model the process and enhance the quality of various business decisions, can confuse the staff as regards such issues like the choice of appropriate methods, their applicability to their specific problems, the quality of the output and its trustworthiness, their manageability, operability, etc. Therefore, the assessment of the impact of strategic offers on the company ecosystem, aware and useful applicability of supporting tools in practice (with underlying models and methods) remain sensitive points, susceptible to the method and approach (whenever feasible to implement) with simultaneous verification of its usefulness to the studied object/managerial problem to be solved.
In practice, this can literally be a “mission in vain”, due to the complexity of human, technical and organizational dependencies (especially for large organizations). That is why companies tend to use consulting firms (which usually represents the main trend of the current methodological approach, of the type of “one size fits all”) or else they sometimes try to be more innovative and to develop a specific Data Product (https://towardsdatascience.com/designing-data-products-b6b93edf3d23) on their own.
As regards the above, and reflecting the nature of the problem studied, two methods have been chosen: FCM and WINGS. As a result of the so-called “weak” interactions occurring in these models as in the concrete example analyzed in Section 4, as well as the application of an arbitrary threshold function selected for FCM—which may distort the results [13]—it becomes intrinsically important to verify the quality of soft system dynamics models in order to choose an adequate calculation method for the managerial problems being solved. The roots of this comparison of models come from its dynamical eigenvalue, but the methods of choice and results obtained should be interpreted with some caution, since FCM and WINGS were applied for a specific case study (a specific problem within the telecommunication industry). Hence, further research is needed to make more universal conclusions (see Section 5, Section 6 and Section 7).
When using FCM and WINGS, we noticed pitfalls into which a novice or even an intermediate-level user and adopter of this method can fall. The model building step and the determination of dependencies and their quantification are a general weakness of such methods, since the quantification of the dependencies is based on subjective evaluation by the staff, especially if no participatory modeling is applied. As opposed to WINGS, FCM may require calibrations to stabilize the state vector, both for the values of the relationships (the influences) and the sensitiveness to changes in self-reinforcing relationships (this holds for most Fuzzy Cognitive Maps) [4].
Another issue requiring attention is the use of the threshold function (preferably monotonic and differentiable), in our case a linear or a sigmoid function. The choice of a function type and its parameters may produce different outcomes (see e.g., Reference [14]), which can be challenging for a novice-to-moderately experienced user.

7. Conclusions and Directions of Future Studies

  • Both methods appear theoretically applicable to study the impact of strategic decisions on the financial and strategic aspects of the company;
  • FCM has proven its practical applicability in a very large number of cases, especially in participatory modeling. Some technical problems arise from the need to implement an auxiliary threshold function. Not only is it chosen arbitrarily, but it is also difficult to understand and interpret by practitioners;
  • The main drawback of FCM comes from the fact that the threshold function has a strong influence on the results, but it has no direct interpretation in the system modeled;
  • WINGS uses simple matrix algebra and does not need any additional functions or parameters for calculations;
  • An important novelty of WINGS comes from its unique mechanism used for calculating influences between system concepts. The final impact on the concept is an effect of the combined action of two measures: the internal strength and the influence.
This paper presents the first comparisons of application of WINGS and FCM to a very specific case study based on practical experience and real-world managerial problems. The network is almost purely hierarchical with a small number of cross relations; it also has only one causal loop. Future research should focus on the applications of both WINGS and FCM to a wider spectrum of decision problems. This can shed light on the similarities and differences of both methods and maybe draw borders between fields of applications on which one of the methods will prove to be more useful. In the case of WINGS, there is a need for more research on collaboration with experts and practitioners and to answer such questions as: Do they find the basic concepts introduced by the method understandable? Does the process of building the model is clear enough? Are the results of the model reliable and satisfactory?

Author Contributions

Conceptualization: D.B. and J.M.; methodology: D.B and J.M.; software, J.M.; validation, D.B., and J.M.; formal analysis, D.B. and J.M.; investigation, D.B. and J.M.; resources, D.B. and J.M.; data curation, D.B. and J.M.; writing—original draft preparation: D.B. and J.M.; writing—review and editing, D.B. and J.M.; visualization, D.B. and J.M.; supervision, J.M.; project administration, J.M.

Funding

This research received no external funding.

Acknowledgments

The authors would like to express their gratitude to the two anonymous reviewers for their very insightful and valuable comments that significantly helped to improve this manuscript.

Conflicts of Interest

The authors declare no conflict of interest.

Appendix A. Proof of the Convergence of Matrix S

Let | S | be the matrix of absolute values, i.e., [ | S | ] i j = | [ S ] i j | = | s i j | , where S is defined by Equation (4). Thanks to the definition of scaling factor s in Equation (5), at least one row sum of elements of | S | is less than 1. Consequently, | S | has the same properties as the sub-matrix of transient states of the matrix representing absorbing Markov chains ([34], Chapter 11). The power S p of this matrix converges to 0 when p . If we allow also negative elements in matrix D , the general form of an element of S p has the form
[ S p ] i j = q 1 = 1 n q 2 = 1 n q p 1 = 1 n q p = 1 n s i , q 1 s q 1 , q 2 s q p 1 , q p s q p , j
As this multiple sum contains both positive and negative terms, it is obvious that
[ S p ] i j [ | S | p ] i j ,
and we can conclude that the series p = 1 S p of the matrix that contains both positive and negative elements converges absolutely (see e.g., [35], Chapter 4).

Appendix B. Illustrative Example of the Extended WINGS Procedure

In this appendix we placed an illustrative example to present step-by-step the extended WINGS procedure. It also explains how the WINGS output can be interpreted and how it can be useful in problem analysis and decision making.
A subject of the example is a small abstract system which contains only six concepts. There are some positive and negative causal relations among concepts. The WINGS network (digraph) of the system is presented in Figure A1. From the first view it is clear that node F plays central role in the system. It is an ultimate effect, as it does not influence any other node.
Figure A1. WINGS network for the illustrative example.
Mathematics 07 00208 g0a1
As we consider here an abstract case, we skip the beginning stage of the procedure–qualitative analysis—which is described in Section 3.2.1 and proceed directly to quantitative evaluation (Section 3.2.2). For both internal strength and influence we use the same nine point scale of integers 1–9. Node D is the strongest component of the system, while component E—the weakest. Though node F is not attributed with any internal strength. Putting its strength formally equal to zero does not distort the results of the WINGS procedure because node F does not influence any other node. In other words, the internal strength of F is irrelevant to the results of calculations.
Node D has the highest number (3) of direct impacts on other nodes, but one of them is negative. Node A exerts strongly on node F (value 8). Node E plays clearly negative role in the system. It has a direct negative impact on F, but also through paths of greater length (E-D-F with one negative segment, E-D-C-B-F with three negative segments). There is a single path (E-D-C-B-A-F with two negative segments) which represents positive influence of E on F. A few loops exist in a network, e.g., the Nodes A, B and C form a positive (reinforcing) loop, while D and E-a negative (balancing) one.
The next stage of the WINGS method (calculation of output described in Section 3.2.2) begins with construction of direct strength-influence matrix D . The internal strength of each node is inserted on main diagonal of matrix D . The values of impacts are placed outside of main diagonal according to nodes indices. Then matrix D is scaled (see Equations (4) and (5)). Thanks to the relation between digraphs and matrix algebra the p power of the matrix D contains the values of indirect impact of one node onto another calculated as the multiplication of impacts along the path of length p. If the path of length p does not exist, the corresponding element of D p is equal zero.
Scaling used in the WINGS method causes that the values of impact decreases with the path length and ensures that the sum of all powers of matrix D converges (see Appendix A). On the other hand, scaling leads also to small values in matrix T . (For the square matrix of size 33 × 33 representing the case study in this paper the order of the largest values is 10 3 . For this illustrative example it is 10 1 .) As the WINGS is based on ratio scale, to facilitate comparison of the results we can rescale the output measures. A convenient way is to rescale all values of Impact and Receptivity in relation to the largest of them, as we do it throughout this paper.
In Table A1 the relative values of Impact, Receptivity, Involvement and Role are presented. Thanks to a limited number of nodes and uncomplicated structure of the system we can use visual examination of the network and intuition to verify the WINGS output. Node A has the strongest relative total impact followed by node D and C. Node B has relative total impact close to zero while node E—definitely negative. These results are in agreement with the intuitive view of the network. The high value of the total relative receptivity of node B may be justified by comparatively strong impact (5) from strong node C (5) which is a part of the reinforcing loop. Similarly, the second position of node E can be an effect of impact by the strong node D(7). A mix of the positive and negative impacts on node F leads to its average value of total relative receptivity.
Table A1. The WINGS output for illustrative example—relative values.
ImpactReceptivityInvolvementRole
A1.00000.20651.20650.7935
B0.07000.65390.7239 0.5839
C0.71850.27670.99520.4418
D0.87470.27221.14690.6026
E 0.4498 0.42420.87390.0256
F0.00000.38010.3801 0.3801
When we consider absolute total impact (Table A2), we see that nodes A and D reversed their positions in comparison to relative ranking. If we look at the network it becomes completely understandable. Node D has higher internal strength than node A and its direct impacts are 6, 4 and 4 (absolute values), while node A has only two direct impacts with absolute values 8 and 3. Node C keeps its third position. Node E is classified higher than node B because now the negative signs of its two direct impacts are neglected. Similar effects can be observed in total absolute receptivity. Node F is the ‘strongest receiver’ with four incoming direct impacts. Node C, having two incoming direct impacts, takes the second position.
Table A2. The WINGS output for illustrative example—absolute values.
ImpactReceptivityInvolvementRole
A0.63690.13150.76840.5054
B0.31210.45160.7638 0.1395
C0.48110.58391.0650 0.1028
D1.00000.46381.46380.5362
E0.46170.27020.73180.1915
F0.00000.99080.9908 0.9908
In WINGS involvement and role are the most important measures in analysis of the system behaviour. A map showing locations of all system components on the plane with involvement and role as Cartesian co-ordinates is a convenient tool for such an analysis. In Figure A2 we see a map of relative measures. Nodes A and D have the highest relative involvement among the system components. It means that they positively influence the system more than other components. Together with nodes C and E they form the influencing (cause) group (positive role). However, the role of node E is close to zero. The other nodes (B, and F) form the influenced (effect) group (negative role). Depending on the specific features of the studied system the values and relative locations of system components on the involvement-role plane help decision maker to evaluate the potential actions and choose the best one. Recognition of the roles in the system is a good example of value added by WINGS. Even for such simple example, as the one studied here, it would be difficult to recognise the roles of system components only by pure intuition.
Figure A2. Relative Role vs. Relative Involvement of concepts in illustrative example.
Mathematics 07 00208 g0a2
Absolute involvement and absolute role bring an additional information that can be useful in system analysis (see Figure A3). The absolute involvement of node D is stronger than that of node A. It means that negative part of node D impact is important in the system and node D deserves deeper analysis. For example questions of the kind: “Is it possible to weaken its negative influence and how to do it?” can be raised. The absolute receptivity of node C is higher than relative (opposite signs of influence from nodes A and D cause compensation) and, as a result, node C joins the influenced group in absolute measures.
Figure A3. Absolute Role vs. Absolute Involvement of concepts in illustrative example.
Mathematics 07 00208 g0a3

References

  1. Michnik, J. Weighted Influence Non-linear Gauge System (WINGS)–An analysis method for the systems of interrelated components. Eur. J. Oper. Res. 2013, 228, 536–544. [Google Scholar] [CrossRef]
  2. Kosko, B. Fuzzy cognitive maps. Int. J. Man-Mach. Stud. 1986, 24, 65–75. [Google Scholar] [CrossRef]
  3. Jetter, A. Fuzzy Cognitive Maps for Engineering and Technology Management: What Works in Practice? In Proceedings of the 2006 Technology Management for the Global Future-PICMET 2006 Conferen, Istanbul, Turkey, 8–13 July 2006; pp. 498–512. [Google Scholar] [CrossRef]
  4. Kok, K. The potential of Fuzzy Cognitive Maps for semi-quantitative scenario development, with an example from Brazil. Glob. Environ. Chang. 2009, 19, 122–133. [Google Scholar] [CrossRef]
  5. Soler, L.S.; Kok, K.; Camara, G.; Veldkamp, A. Using fuzzy cognitive maps to describe current system dynamics and develop land cover scenarios: A case study in the Brazilian Amazon. J. Land Use Sci. 2012, 7, 149–175. [Google Scholar] [CrossRef]
  6. Sapp, C. Solution Path for Implementing a Comprehensive Architecture for Data and Analytics Strategies, Gartner 2018, ID G00351281. Available online: https://www.gartner.com/document/3880568 (accessed on 22 February 2019).
  7. Buytendijk, F.; Laney, D. Information 2020: Beyond Big Data, Gartner 2017 (refreshed), ID G00261907. Available online: https://www.gartner.com/document/2681316 (accessed on 22 February 2019).
  8. Forrester, J.W. Industrial Dynamics; Martino Fine Books: Eastford, CT, USA, 2013. [Google Scholar]
  9. Mendoza, G.A.; Prabhu, R. Participatory modeling and analysis for sustainable forest management: Overview of soft system dynamics models and applications. For. Policy Econ. 2006, 9, 179–196. [Google Scholar] [CrossRef]
  10. Lane, D.C.; Oliva, R. The greater whole: Towards a synthesis of system dynamics and soft systems methodology. Eur. J. Oper. Res. 1998, 107, 214–235. [Google Scholar] [CrossRef]
  11. Felix, G.; Nápoles, G.; Falcon, R.; Froelich, W.; Vanhoof, K.; Bello, R. A review on methods and software for fuzzy cognitive maps. Artif. Intell. Rev. 2017. [Google Scholar] [CrossRef]
  12. Papageorgiou, E.I. Review study on fuzzy cognitive maps and their applications during the last decade. In Proceedings of the 2011 IEEE International Conference on Fuzzy Systems (FUZZ-IEEE 2011), Taipei, Taiwan, 27–30 June 2011; pp. 828–835. [Google Scholar] [CrossRef]
  13. Knight, C.J.K.; Lloyd, D.J.B.; Penn, A.S. Linear and sigmoidal fuzzy cognitive maps: An analysis of fixed points. Appl. Soft Comput. 2014, 15, 193–202. [Google Scholar] [CrossRef]
  14. Penn, A.S.; Knight, C.J.K.; Lloyd, D.J.B.; Avitabile, D.; Kok, K.; Schiller, F.; Woodward, A.; Druckman, A.; Basson, L. Participatory Development and Analysis of a Fuzzy Cognitive Map of the Establishment of a Bio-Based Economy in the Humber Region. PLoS ONE 2013, 8, e78319. [Google Scholar] [CrossRef] [PubMed] [Green Version]
  15. Adamus-Matuszyńska, A.; Michnik, J.; Polok, G. City Image Building—Soft System Dynamics Approach. 2019; submission. [Google Scholar]
  16. Gabus, A.; Fontela, E. Perceptions of the World Problematic: Communication Procedure, Communicating with Those Bearing Collective Responsibility; DEMATEL 1; Battelle Geneva Research Centre: Geneva, Switzerland, 1973. [Google Scholar]
  17. Fontela, E.; Gabus, A. The DEMATEL Observer; DEMATEL 1976; Battelle Geneva Research Centre: Geneva, Switzerland, 1976. [Google Scholar]
  18. Kashi, K.; Franek, J. Application of Multiple Attribute Decision Making Methods in Human Resources. In Proceedings of the 7th International Scientific Conference Managing and Modeling of Financial Risks, Ostrava, Czech Republic, 8–9 September 2014. [Google Scholar]
  19. Michnik, J.; Adamus-Matuszyńska, A. Structural analysis of problems in public relations. Mult. Criteria Decis. Mak. 2015, 10, 105–123. [Google Scholar]
  20. Michnik, J. The WINGS method with multiple networks and its application to innovation projects selection. Int. J. Appl. Manag. Sci. 2018, 10, 105–126. [Google Scholar] [CrossRef]
  21. Pechová, H.; Staňková, Š. Application of WINGS method in CRM performance measurement. In Proceedings of the IDIMT 2015: Information Technology and Society-Interaction and Interdependence-23rd Interdisciplinary Information Management Talks, Poděbrady, Czech Republic, 9–11 September 2015; pp. 391–398. [Google Scholar]
  22. Radziszewska-Zielina, E.; Śladowski, G. Assessment of the Conditions that Determine the Reclaiming of Stone Materials and their Use in the Revalorisation of Historical Buildings. In Proceedings of the Assessment of the Conditions that Determine the Reclaiming of Stone Materials and their Use in the Revalorisation of Historical Buildings, Warsaw, Poland, 21–25 August 2017. [Google Scholar]
  23. Radziszewska-Zielina, E.; Śladowski, G. Supporting the selection of a variant of the adaptation of a historical building with the use of fuzzy modeling and structural analysis. J. Cult. Herit. 2017, 26, 53–63. [Google Scholar] [CrossRef]
  24. Rego Mello, B.B. Industry Risk Assessment in Brazil Based on Weighted Influence Non-Linear Gauge System and Analytic Hierarchy Process Methods. In Proceedings of the Industry Risk Assessment in Brazil Based on Weighted Influence Non-Linear Gauge System and Analytic Hierarchy Process Methods, Hamburg, Germany, 2–7 August 2015. [Google Scholar]
  25. Eden, C. Analyzing cognitive maps to help structure issues or problems. Eur. J. Oper. Res. 2004, 159, 673–686. [Google Scholar] [CrossRef]
  26. Mingers, J.; Rosenhead, J. Problem structuring methods in action. Eur. J. Oper. Res. 2004, 152, 530–554. [Google Scholar] [CrossRef]
  27. Eden, C.; Ackermann, F. Knowledge Based Management Support Systems; Halsted Press: New York, NY, USA, 1989; pp. 198–207. [Google Scholar]
  28. Checkland, P. Systems Thinking, Systems Practice; J. Wiley: Chichester, UK, 1981. [Google Scholar]
  29. Checkland, P. Soft systems methodology: A thirty year retrospective. Syst. Res. Behav. Sci. 2000, 17, S11–S58. [Google Scholar] [CrossRef]
  30. Bouyssou, D.; Marchant, T.; Pirlot, M.; Tsoukias, A.; Vincke, P. Evaluation and Decision Models with Multiple Criteria: Stepping Stones for the Analyst; International Series in Operations Research & Management Science; Springer: New York, NY, USA, 2006. [Google Scholar]
  31. Marr, B. Does Synthetic Data Hold The Secret To Artificial Intelligence? Available online: https://www.forbes.com/sites/bernardmarr/2018/11/05/does-synthetic-data-hold-the-secret-to-artificial-intelligence/40d0ca5f42f8 (accessed on 22 February 2019).
  32. Miley, W. Project Portfolio Management Software Tools. Available online: https://www.prioritysystem.com/tools.htmltools (accessed on 22 February 2019).
  33. Gray, S. Mental Modeler-Fuzzy Logic Cognitive Mapping. Available online: http://www.mentalmodeler.org/ (accessed on 22 February 2019).
  34. Grinstead, C.; Snell, L. Introduction to Probability; American Mathematical Society: Providence, RI, USA, 2006. [Google Scholar]
  35. Trench, W. Introduction to Real Analysis. Faculty Authored Books. Book 7. 2013. Available online: http://digitalcommons.trinity.edu/mono/7 (accessed on 22 February 2019).
Figure 1. A general example of a system model (blue arrows labelled with ( + ) sign represent positive influence, red arrows labelled with ( ) sign represent negative influence).
Mathematics 07 00208 g001
Figure 2. Case-study model: In the context of FCM and WINGS.
Mathematics 07 00208 g002
Figure 3. Fuzzy cognitive mappings (FCM) (linear threshold function): final states of Financial and Strategic Effects caused by Offers A, B, and C.
Mathematics 07 00208 g003
Figure 4. FCM (sigmoid threshold function): final states of Financial and Strategic Effects caused by Offers A, B, and C.
Mathematics 07 00208 g004
Figure 5. Weighted influence nonlinear gauge system (WINGS): total relative involvement of Financial and Strategic Effects caused by Offers A, B, and C.
Mathematics 07 00208 g005
Table 1. Model input data: status of the firm and impact of the offer.
Current Status in the Firm (Values in Parenthesis)Offer AOffer BOffer C
Net cash flow (per year) (4)213
Revenue (6)354
Quoted sales margin per BG (business group) (2)100
Quoted sales margin per unit (4)222
Capital Cost (1)000
Delivery costs (per year) (9)255
Further upsell (per year) (9)624
Expected upsell (9)482
Deal upsell NPV (Net Present Value) (7)123
Strategic deal quality (6)414
Strategic context (3)101
Committed upsell (per year) (9)126
Market unit share impact (1)101
Price erosion (0)000
Revenue risk (2)102
Sales risk (2)110
Discount (per year) (2)110
Cost risk (1)022
Technical risk (3)201
Customer Credit risk (1)001
Margin risk (2)101
Customer risk (1)121
Delivery risk (3)312
Total risk provision (4)323
Table 2. Comparison of FCM and WINGS—financial impact rank.
Financial ImpactOffer AOffer BOffer C
Net cash flow (per year) (5)213
Revenue354
Quoted sales margin per BG (2)100
Quoted sales margin per unit (1)222
Capital Cost000
Delivery costs (per year)255
Price erosion (1)000
Revenue risk102
Discount (per year)110
Cost risk022
Customer Credit risk001
Margin risk101
Total risk provision323
WINGS rank321
FCM (linear) rank321
FCM (sigmoid) rank321
Table 3. Comparison of FCM and WINGS—strategic impact rank.
Strategic ImpactOffer AOffer BOffer C
Further upsell (per year) (4)624
Expected upsell (4)482
Deal upsell NPV123
Strategic deal quality (1)414
Strategic context101
Committed upsell (per year) (6)126
Market unit share impact101
Sales risk110
Technical risk201
Customer risk121
Delivery risk312
WINGS rank231
FCM (linear) rank231
FCM (sigmoid) rank231
Table 4. FCM and WINGS Financial Effect—results of sensitivity analysis.
Basic Data
FCM-linearFCM-sigmoidWINGS
ValueRankValueRankValueRank
Offer A0.4560630.5165230.994883
Offer B0.5816020.5193020.997812
Offer C0.6347110.5208211.000001
Net Cash Flow Impact: 5 → 9; Quoted Sales Margin per BG: 2 → 6
FCM-linearFCM-sigmoidWINGS
ValueRankValueRankValueRank
Offer A0.6262030.6222530.997442
Offer B0.6300020.6223120.997283
Offer C0.7799110.6258011.000001
Table 5. FCM and WINGS Strategic Effect—results of sensitivity analysis.
Basic Data
FCM-linearFCM-sigmoidWINGS
ValueRankValueRankValueRank
Offer A0.2889820.4637420.542252
Offer B0.2202530.4617230.539733
Offer C0.3721310.4641810.542331
Expected Upsell: 4 → 8; Upsell Potential: 3 → 6
FCM-linearFCM-sigmoidWINGS
ValueRankValueRankValueRank
Offer A0.6187520.5172220.787632
Offer B0.7184630.5161230.785283
Offer C0.7014810.5176710.787711

