Hybrid Moth-Flame Optimization Algorithm and Incremental Conductance for Tracking Maximum Power of Solar PV/Thermoelectric System under Different Conditions

 ,
,  ,
, 
 ,
,  and
and
Abstract
1. Introduction
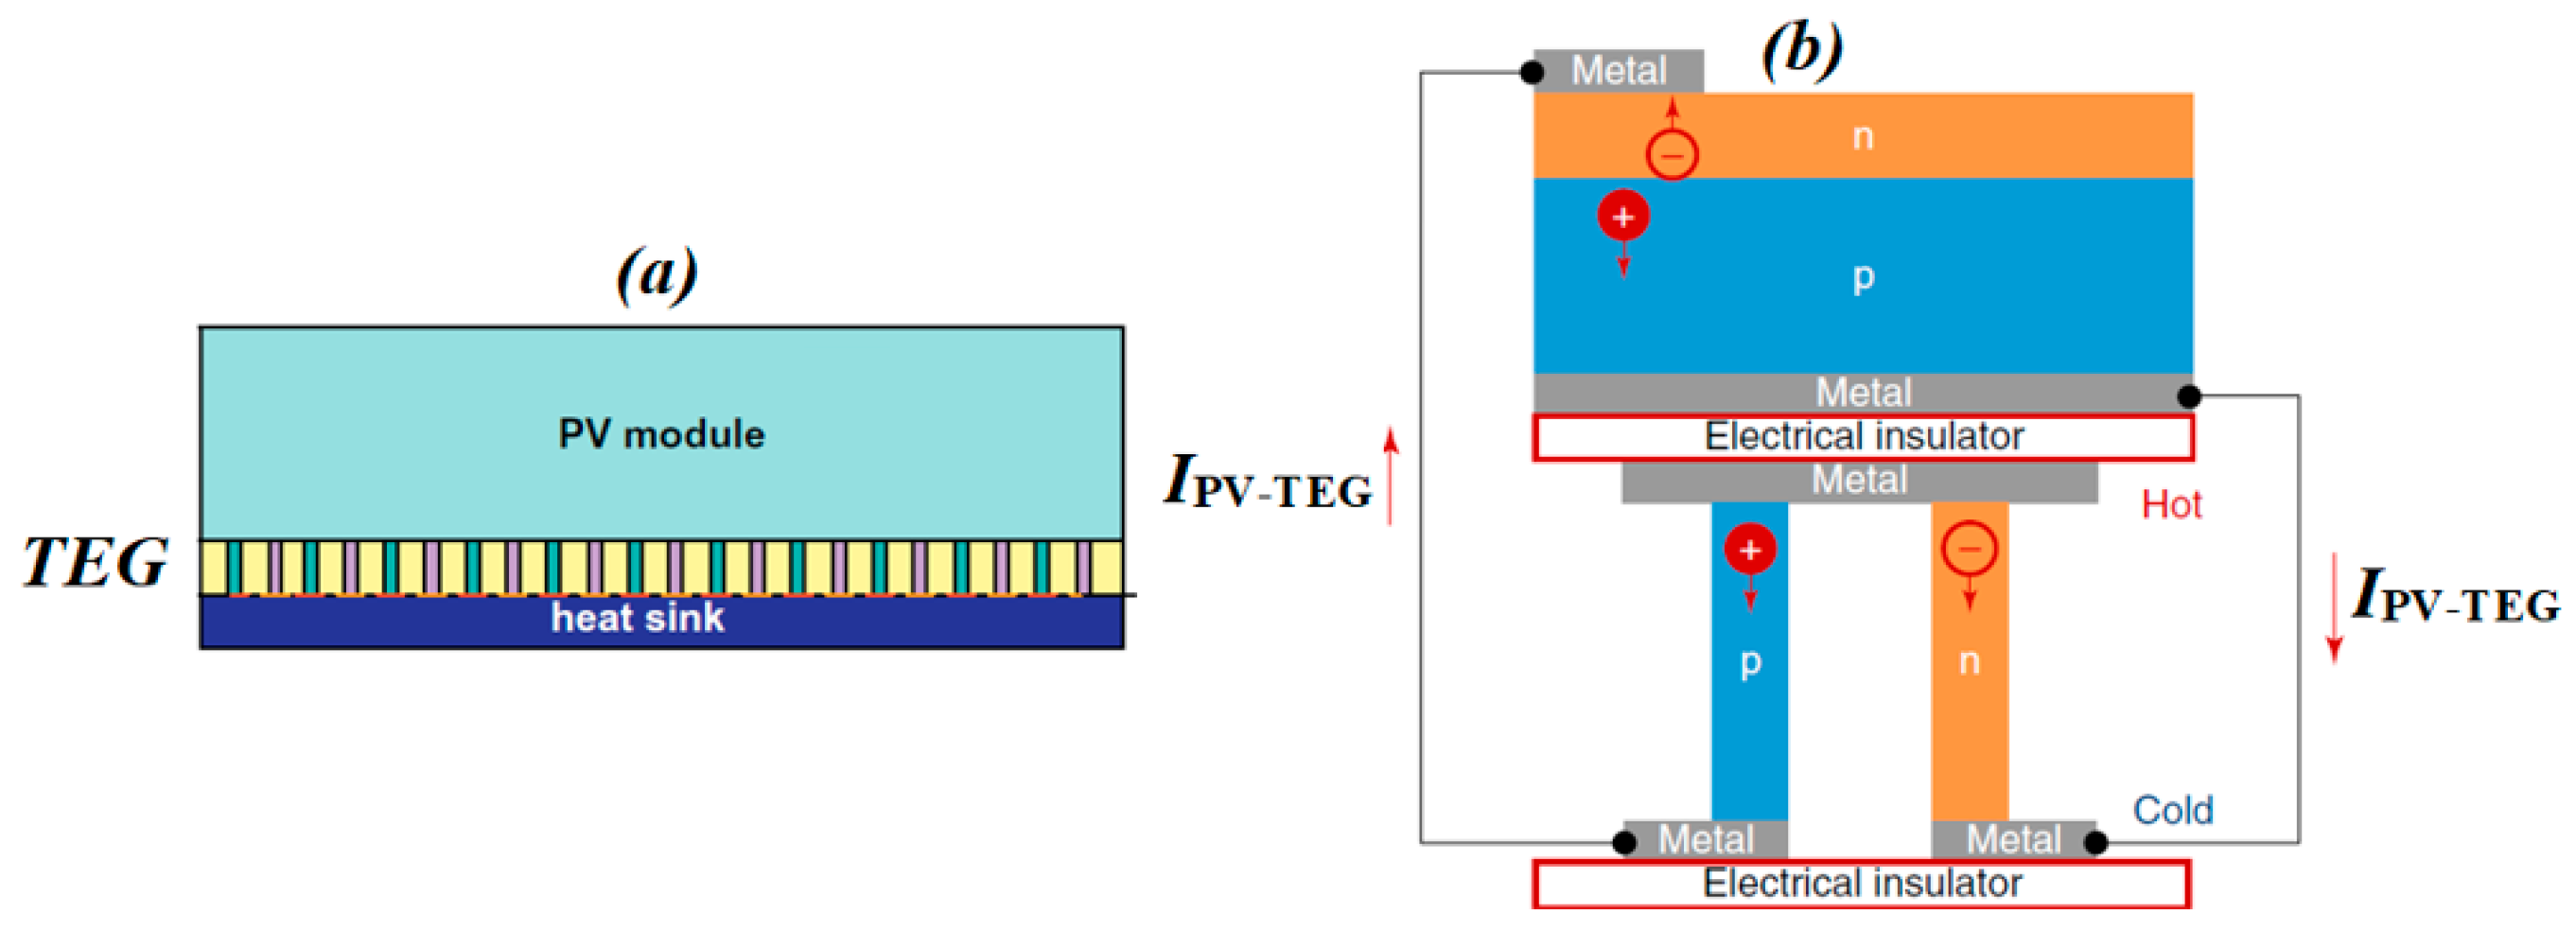
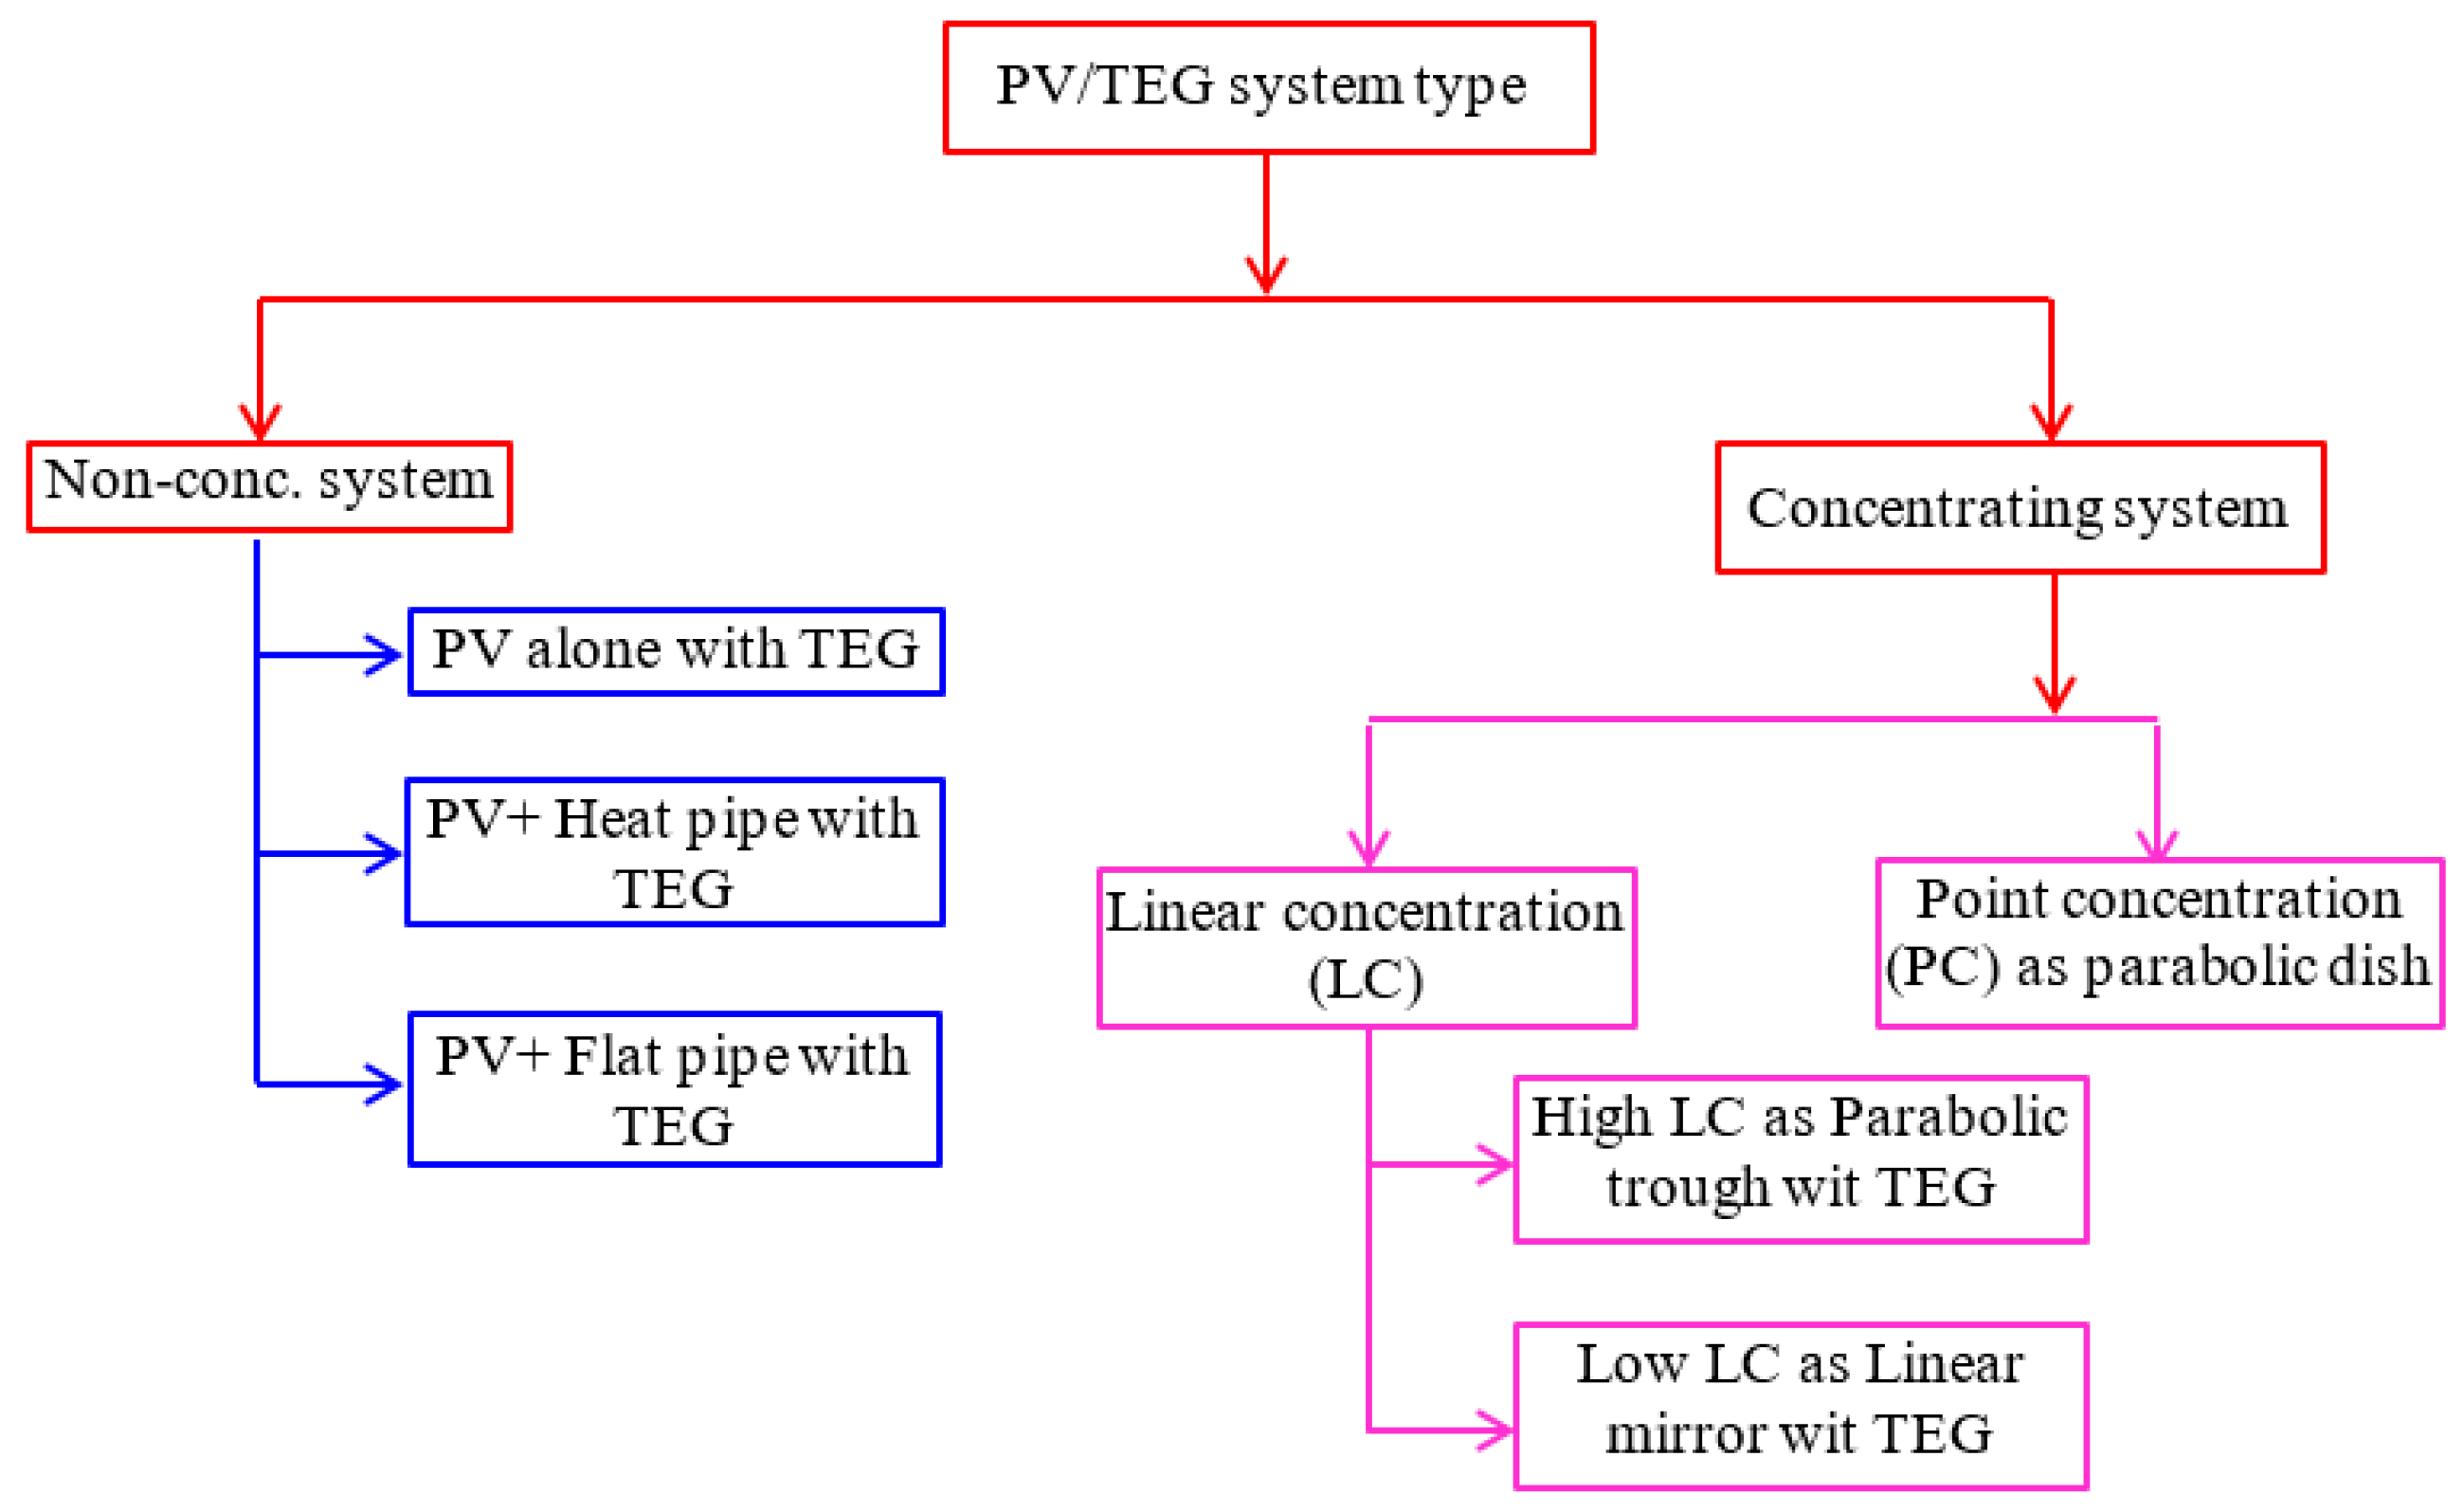
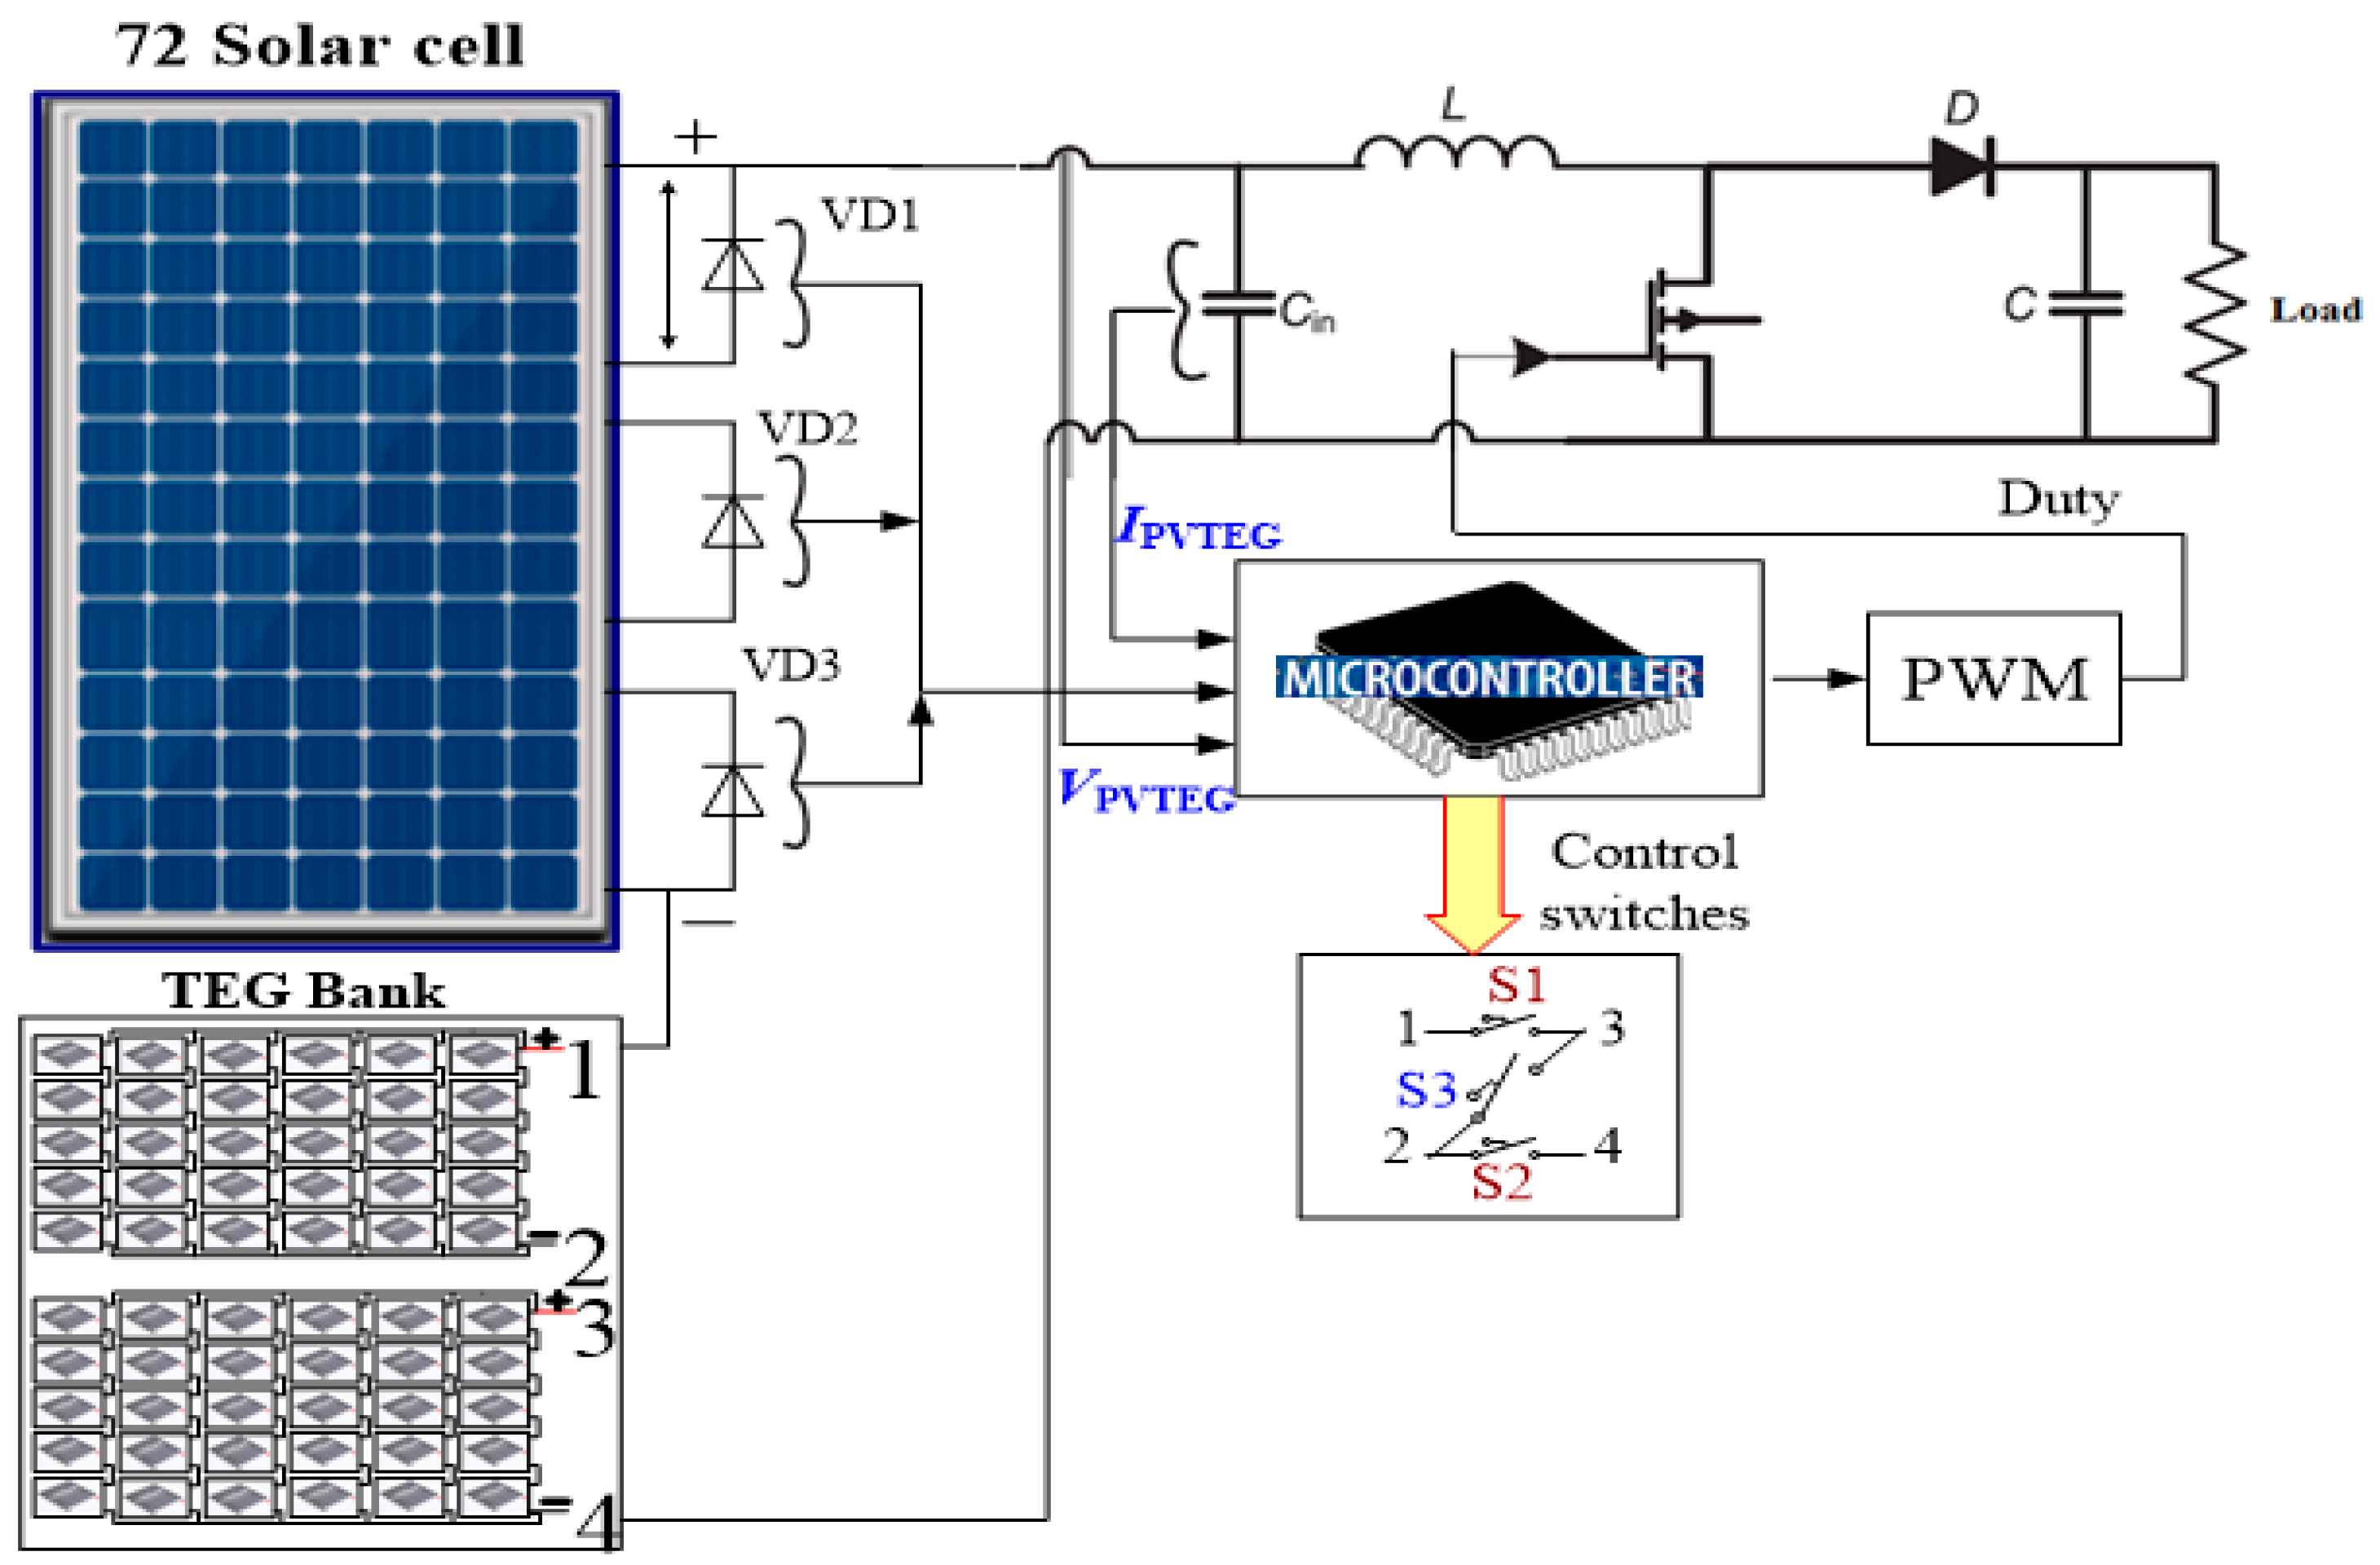
2. HPVTEG System Components
2.1. Solar Panel
2.2. Thermoelectric Generator Modeling
- Th and Tc—the hot and cold side temperatures.
- ΔT—the junction temperature difference.
- α—Seebeck coefficient.
- PP denotes heat-transfer rate;
- denotes DC current flowing in the TEG.
- τ denotes Thomson coefficient.
- ktc is the thermal conductivity.
- Rint and Iteg—the TEG electrical resistance and current respectively.
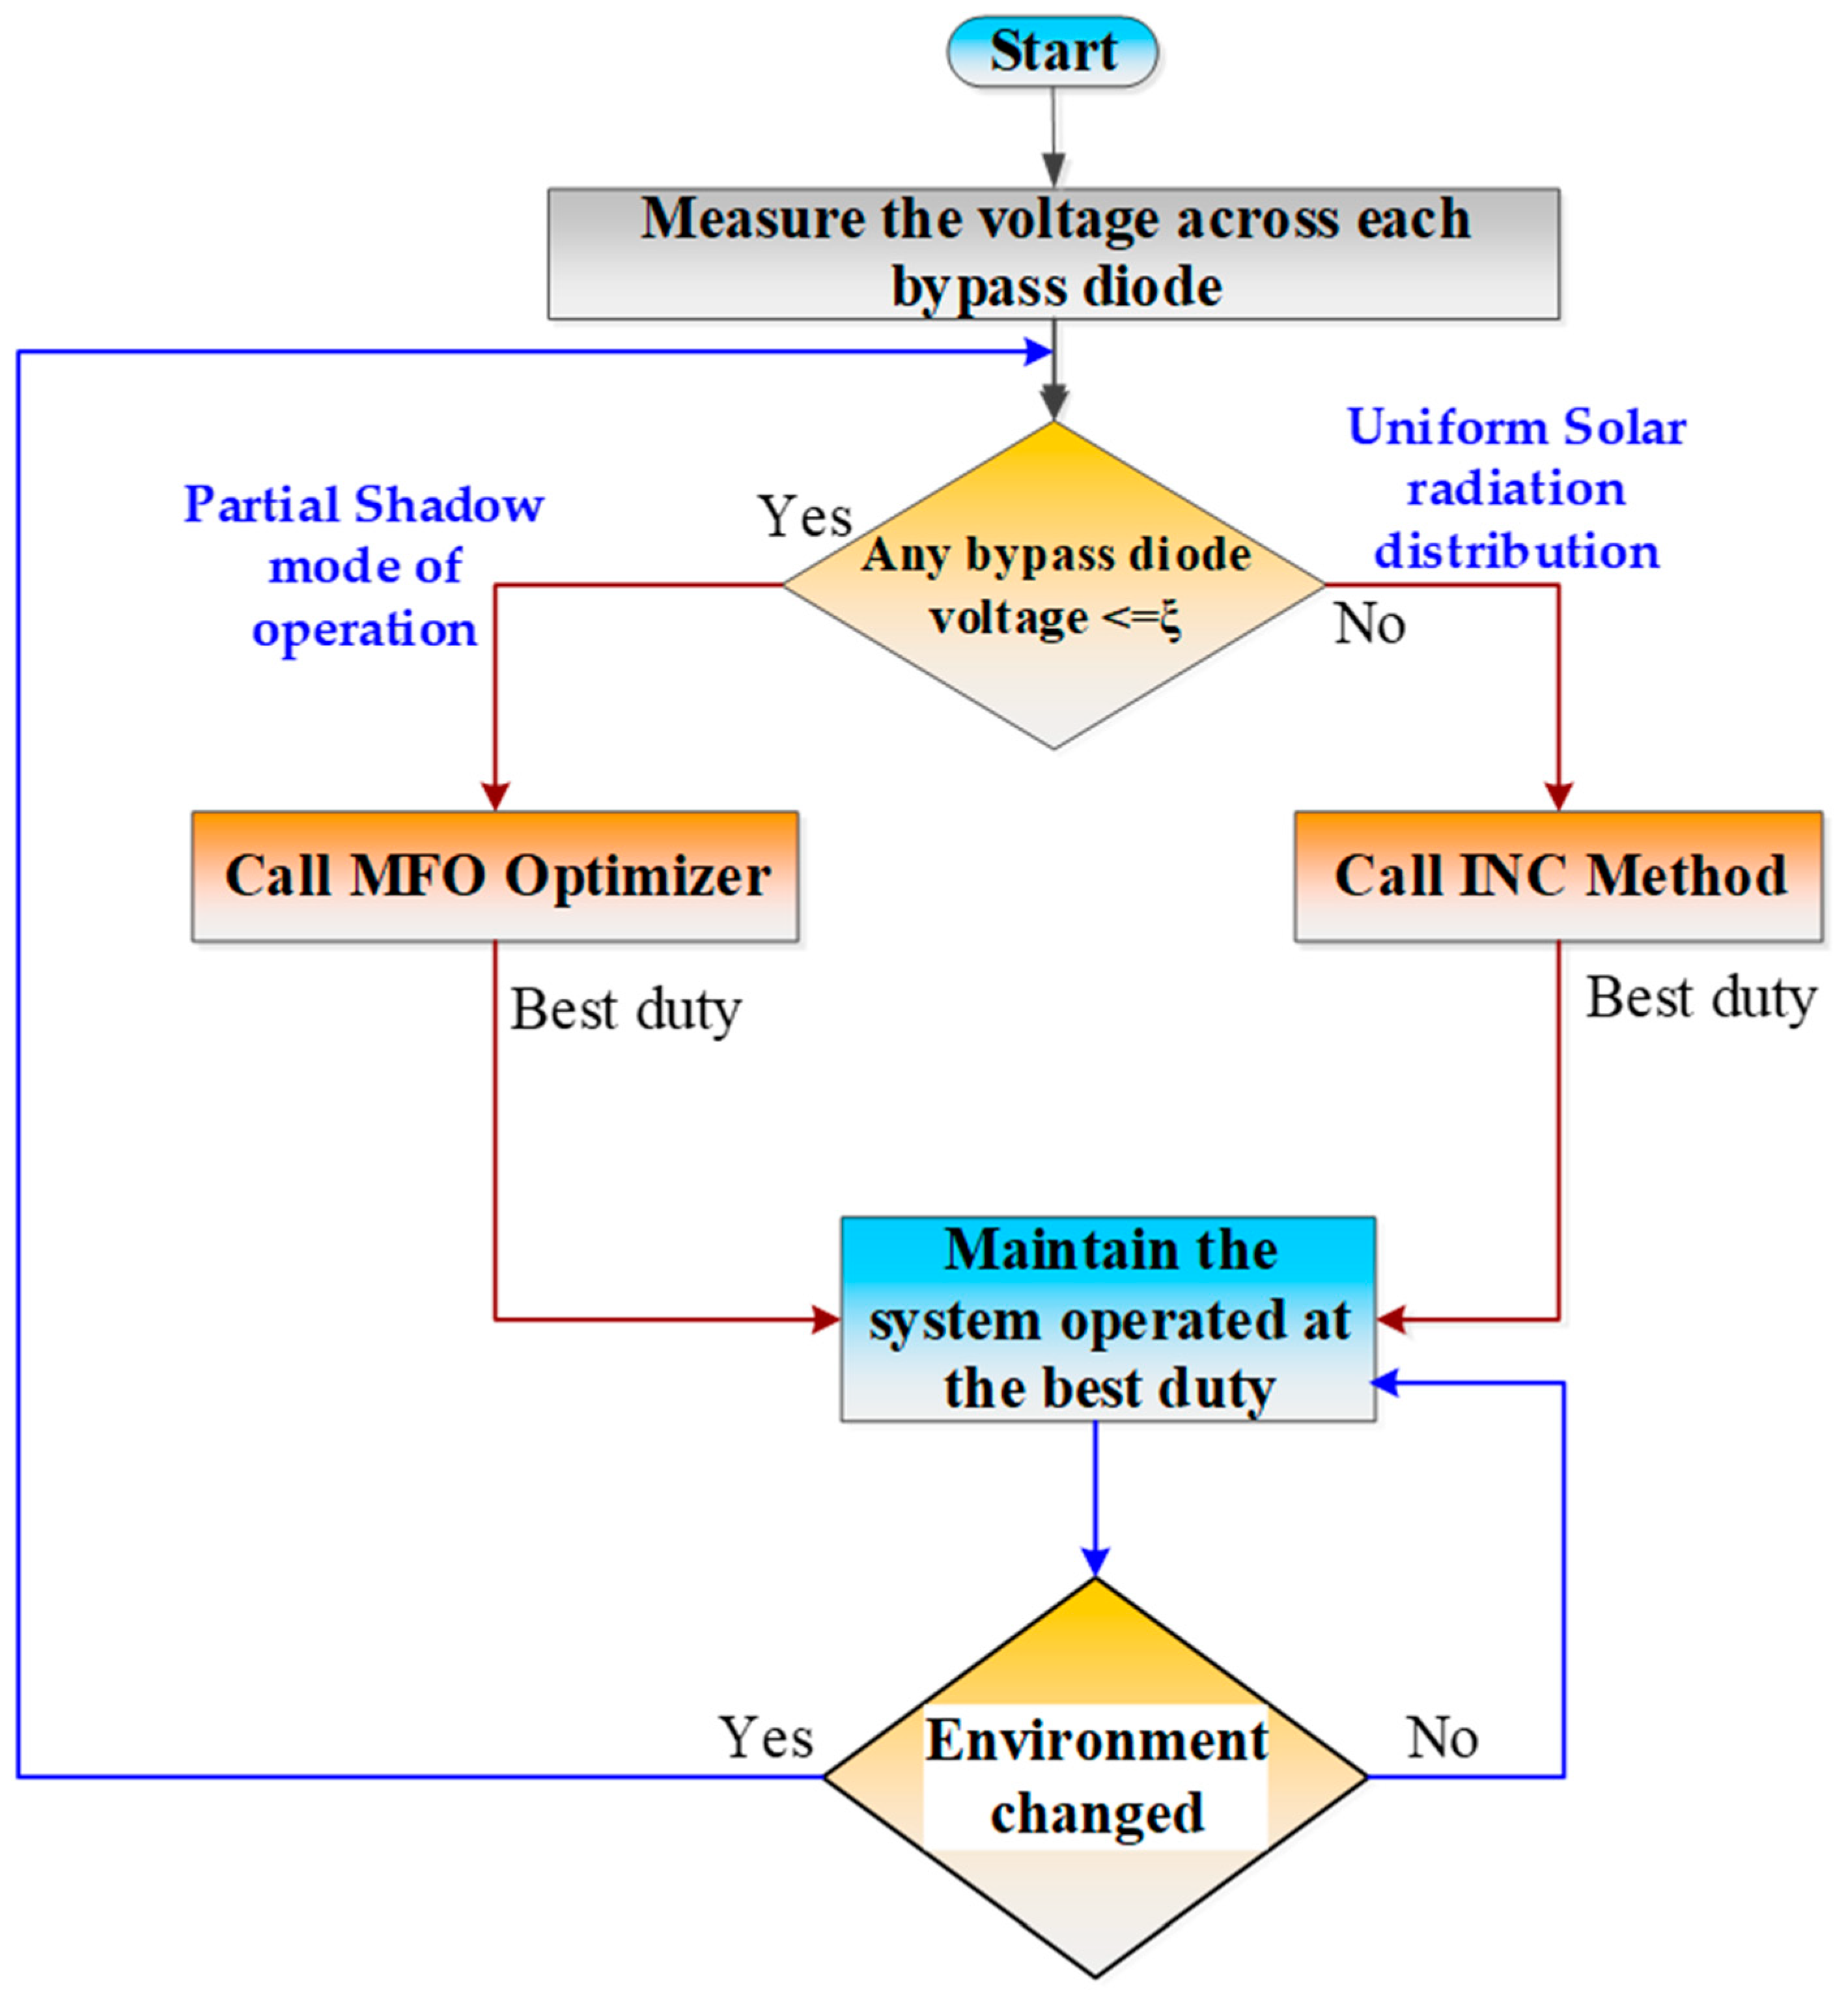
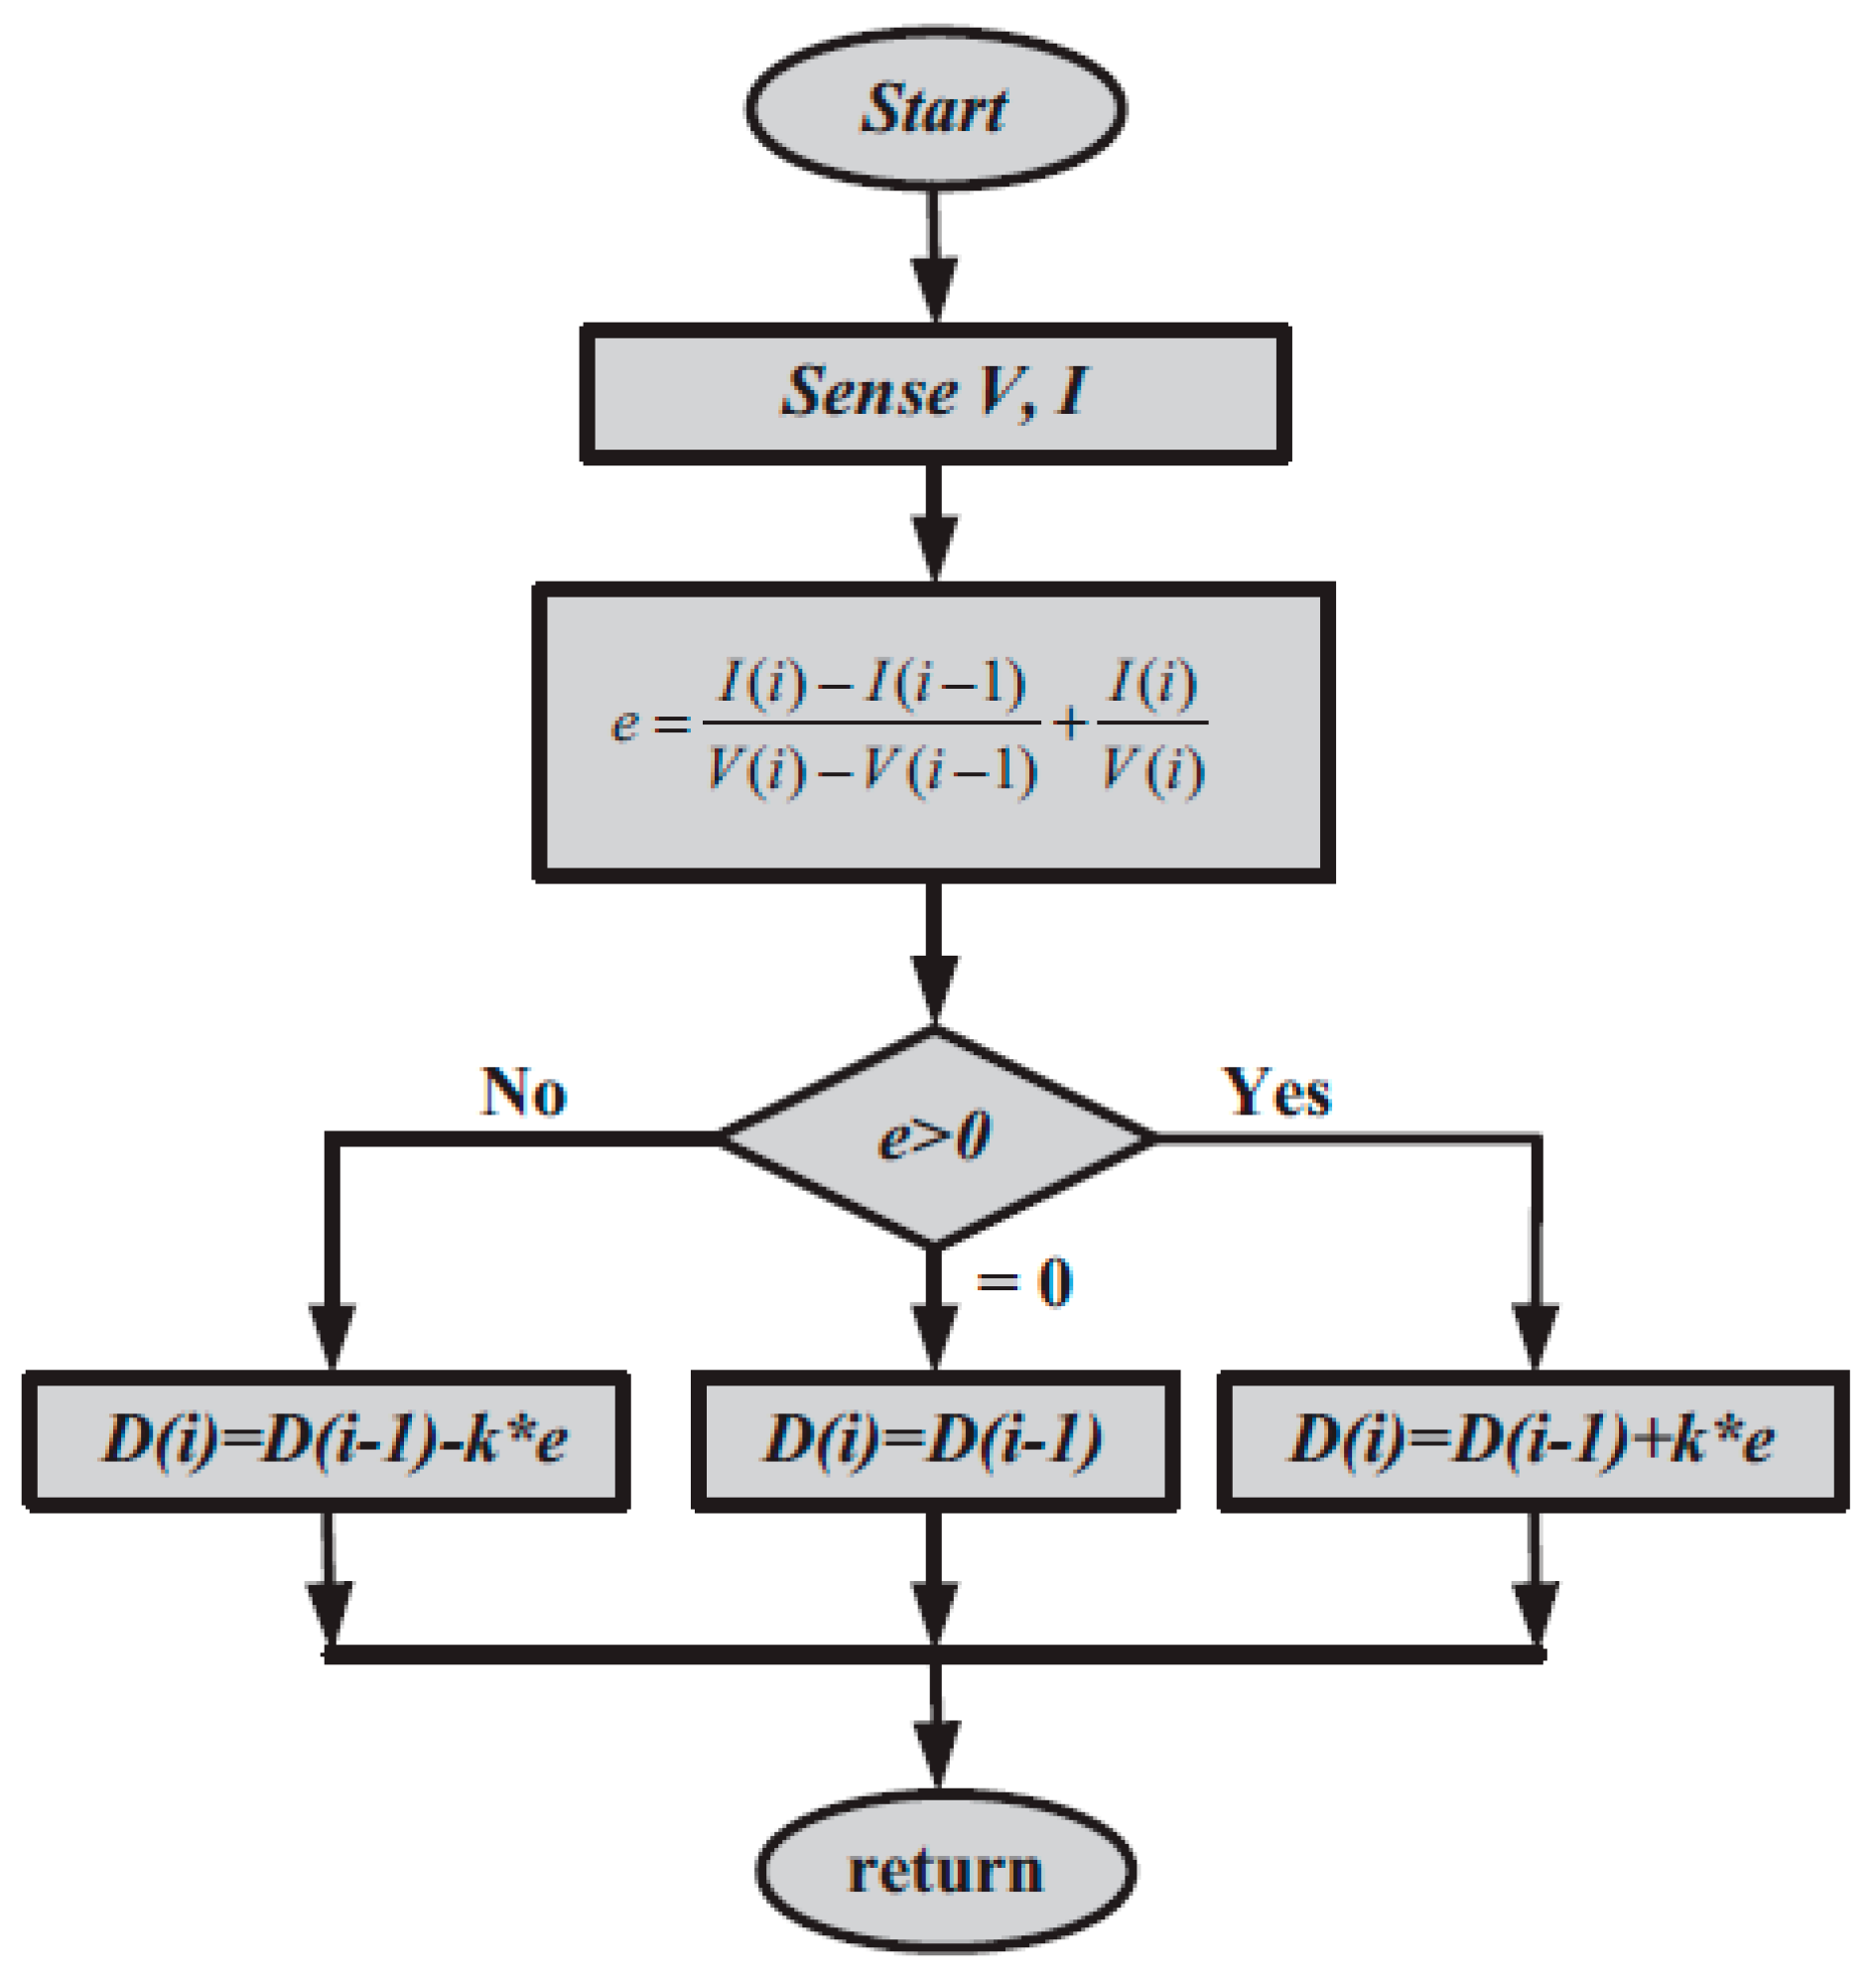
3. Conventional MPPT based on Incremental Conductance
4. Moth-Flame Optimizer
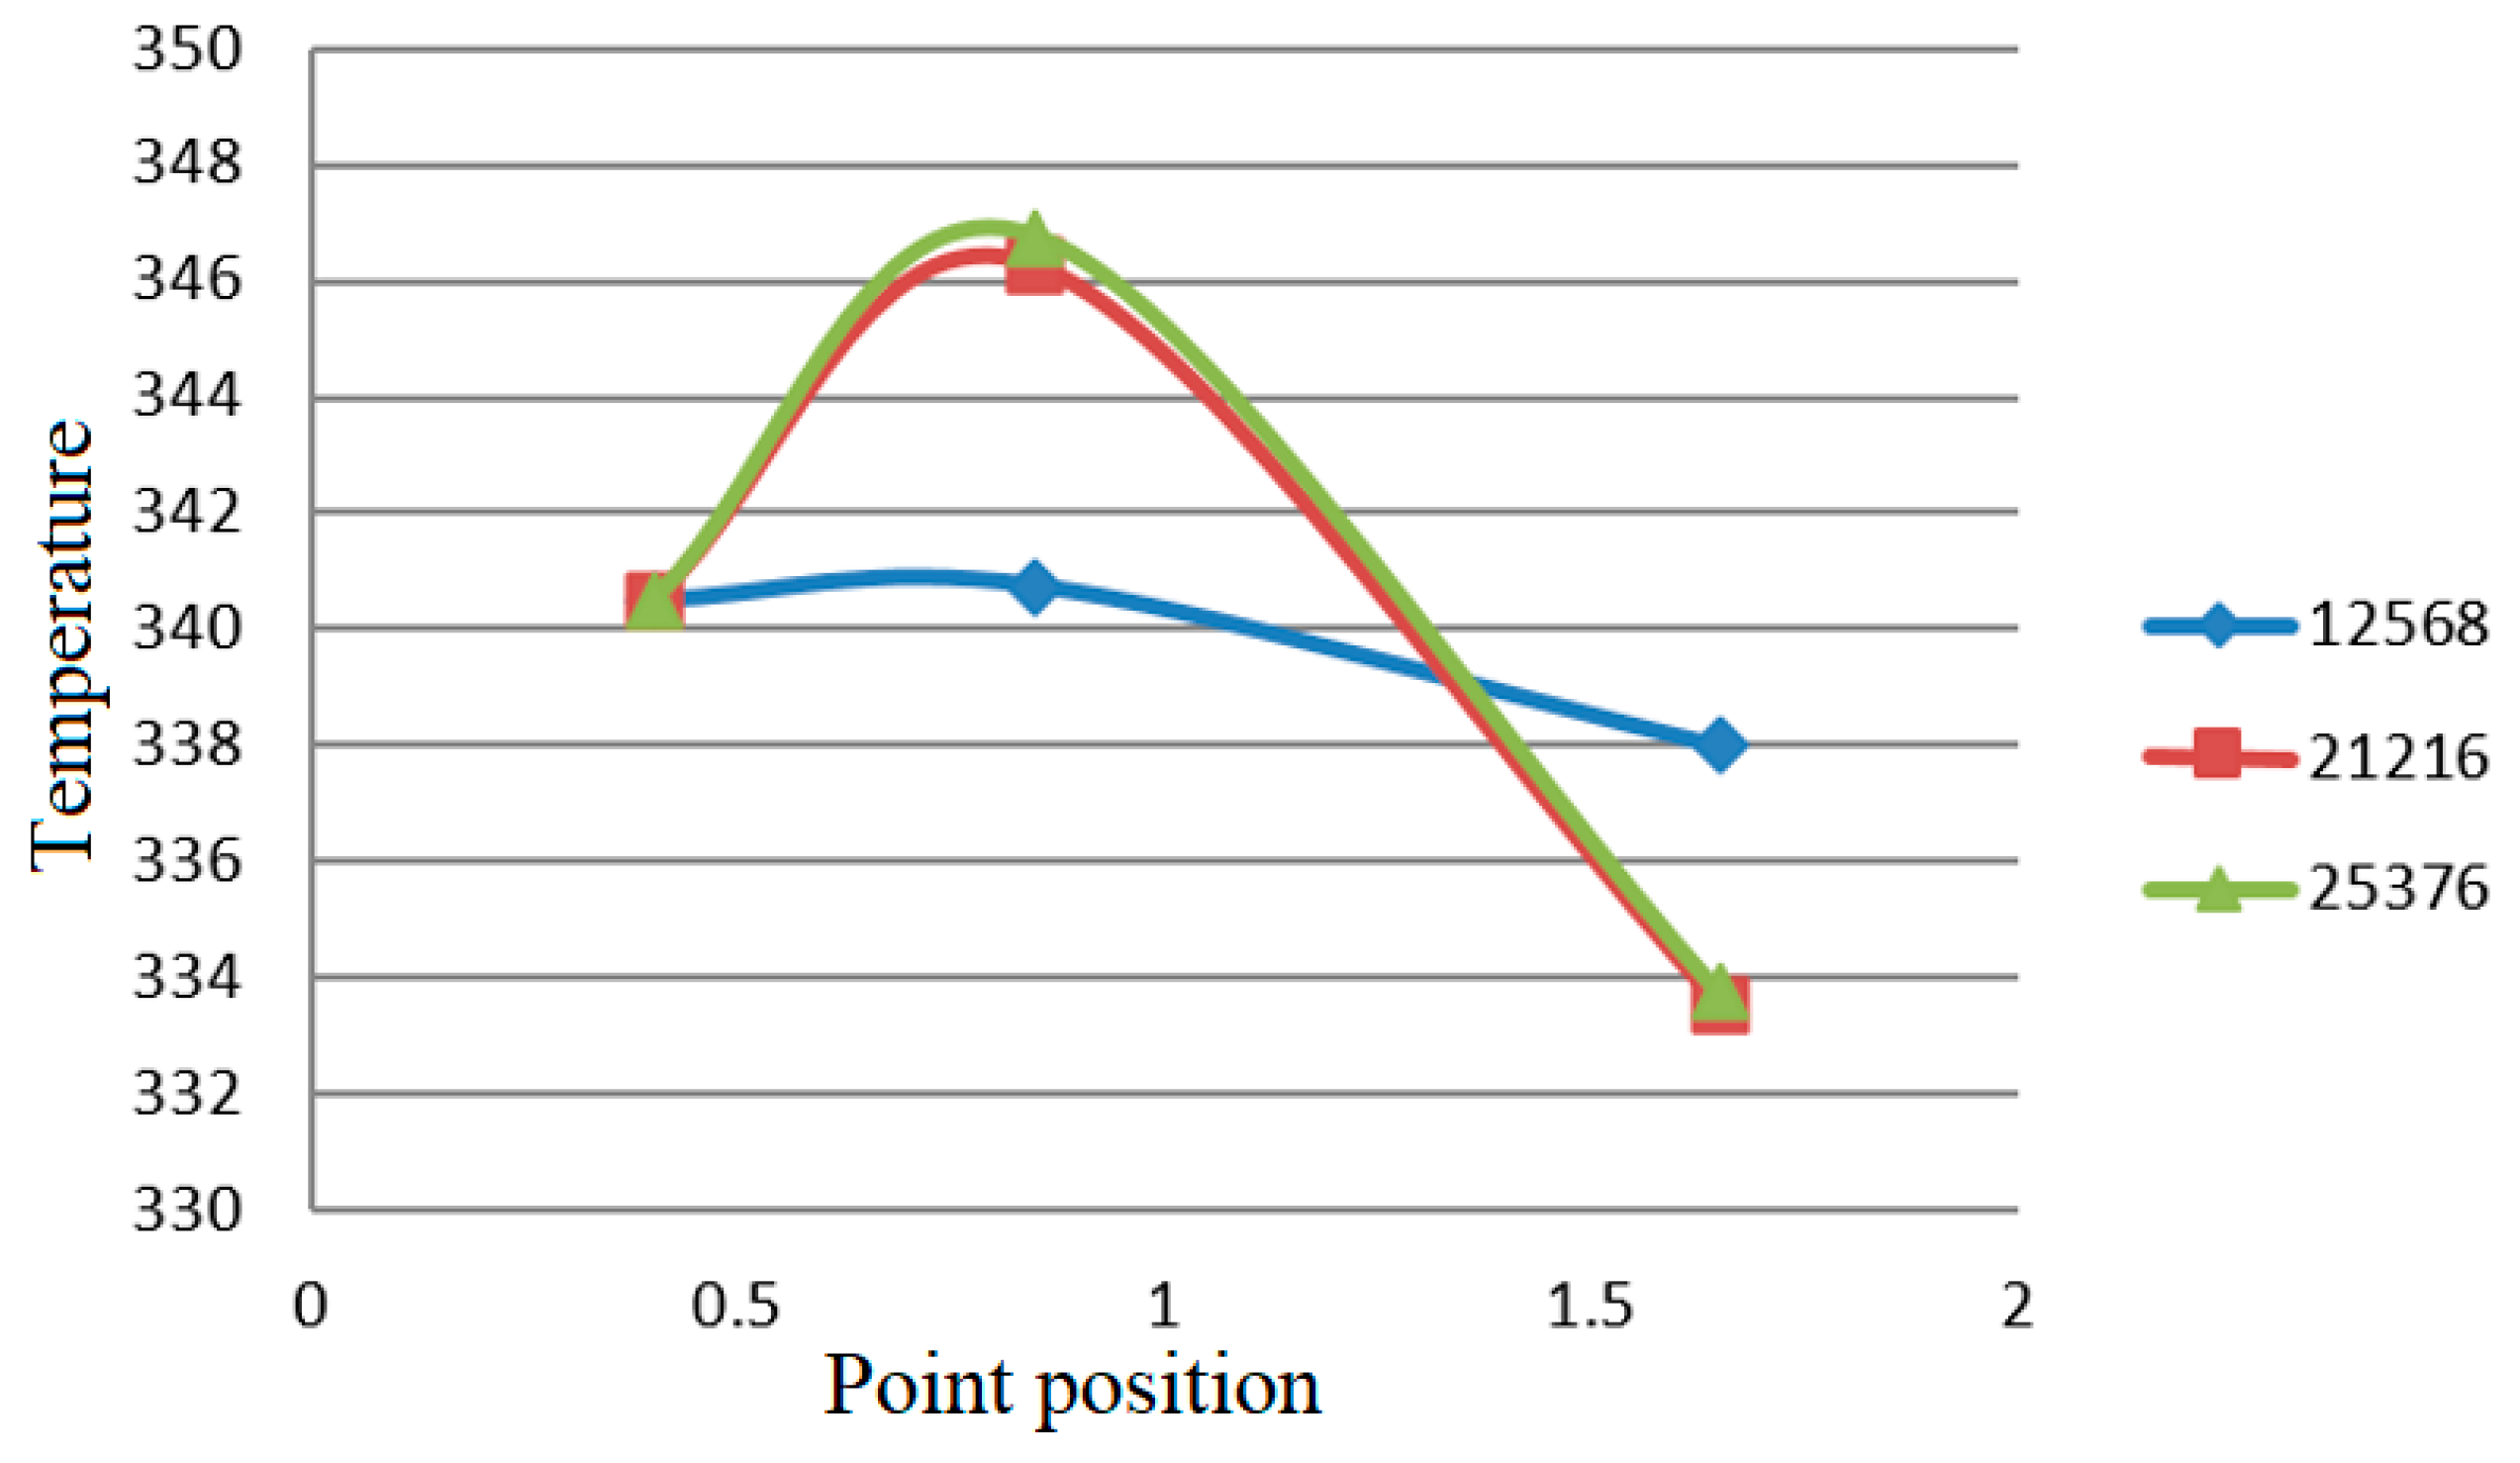
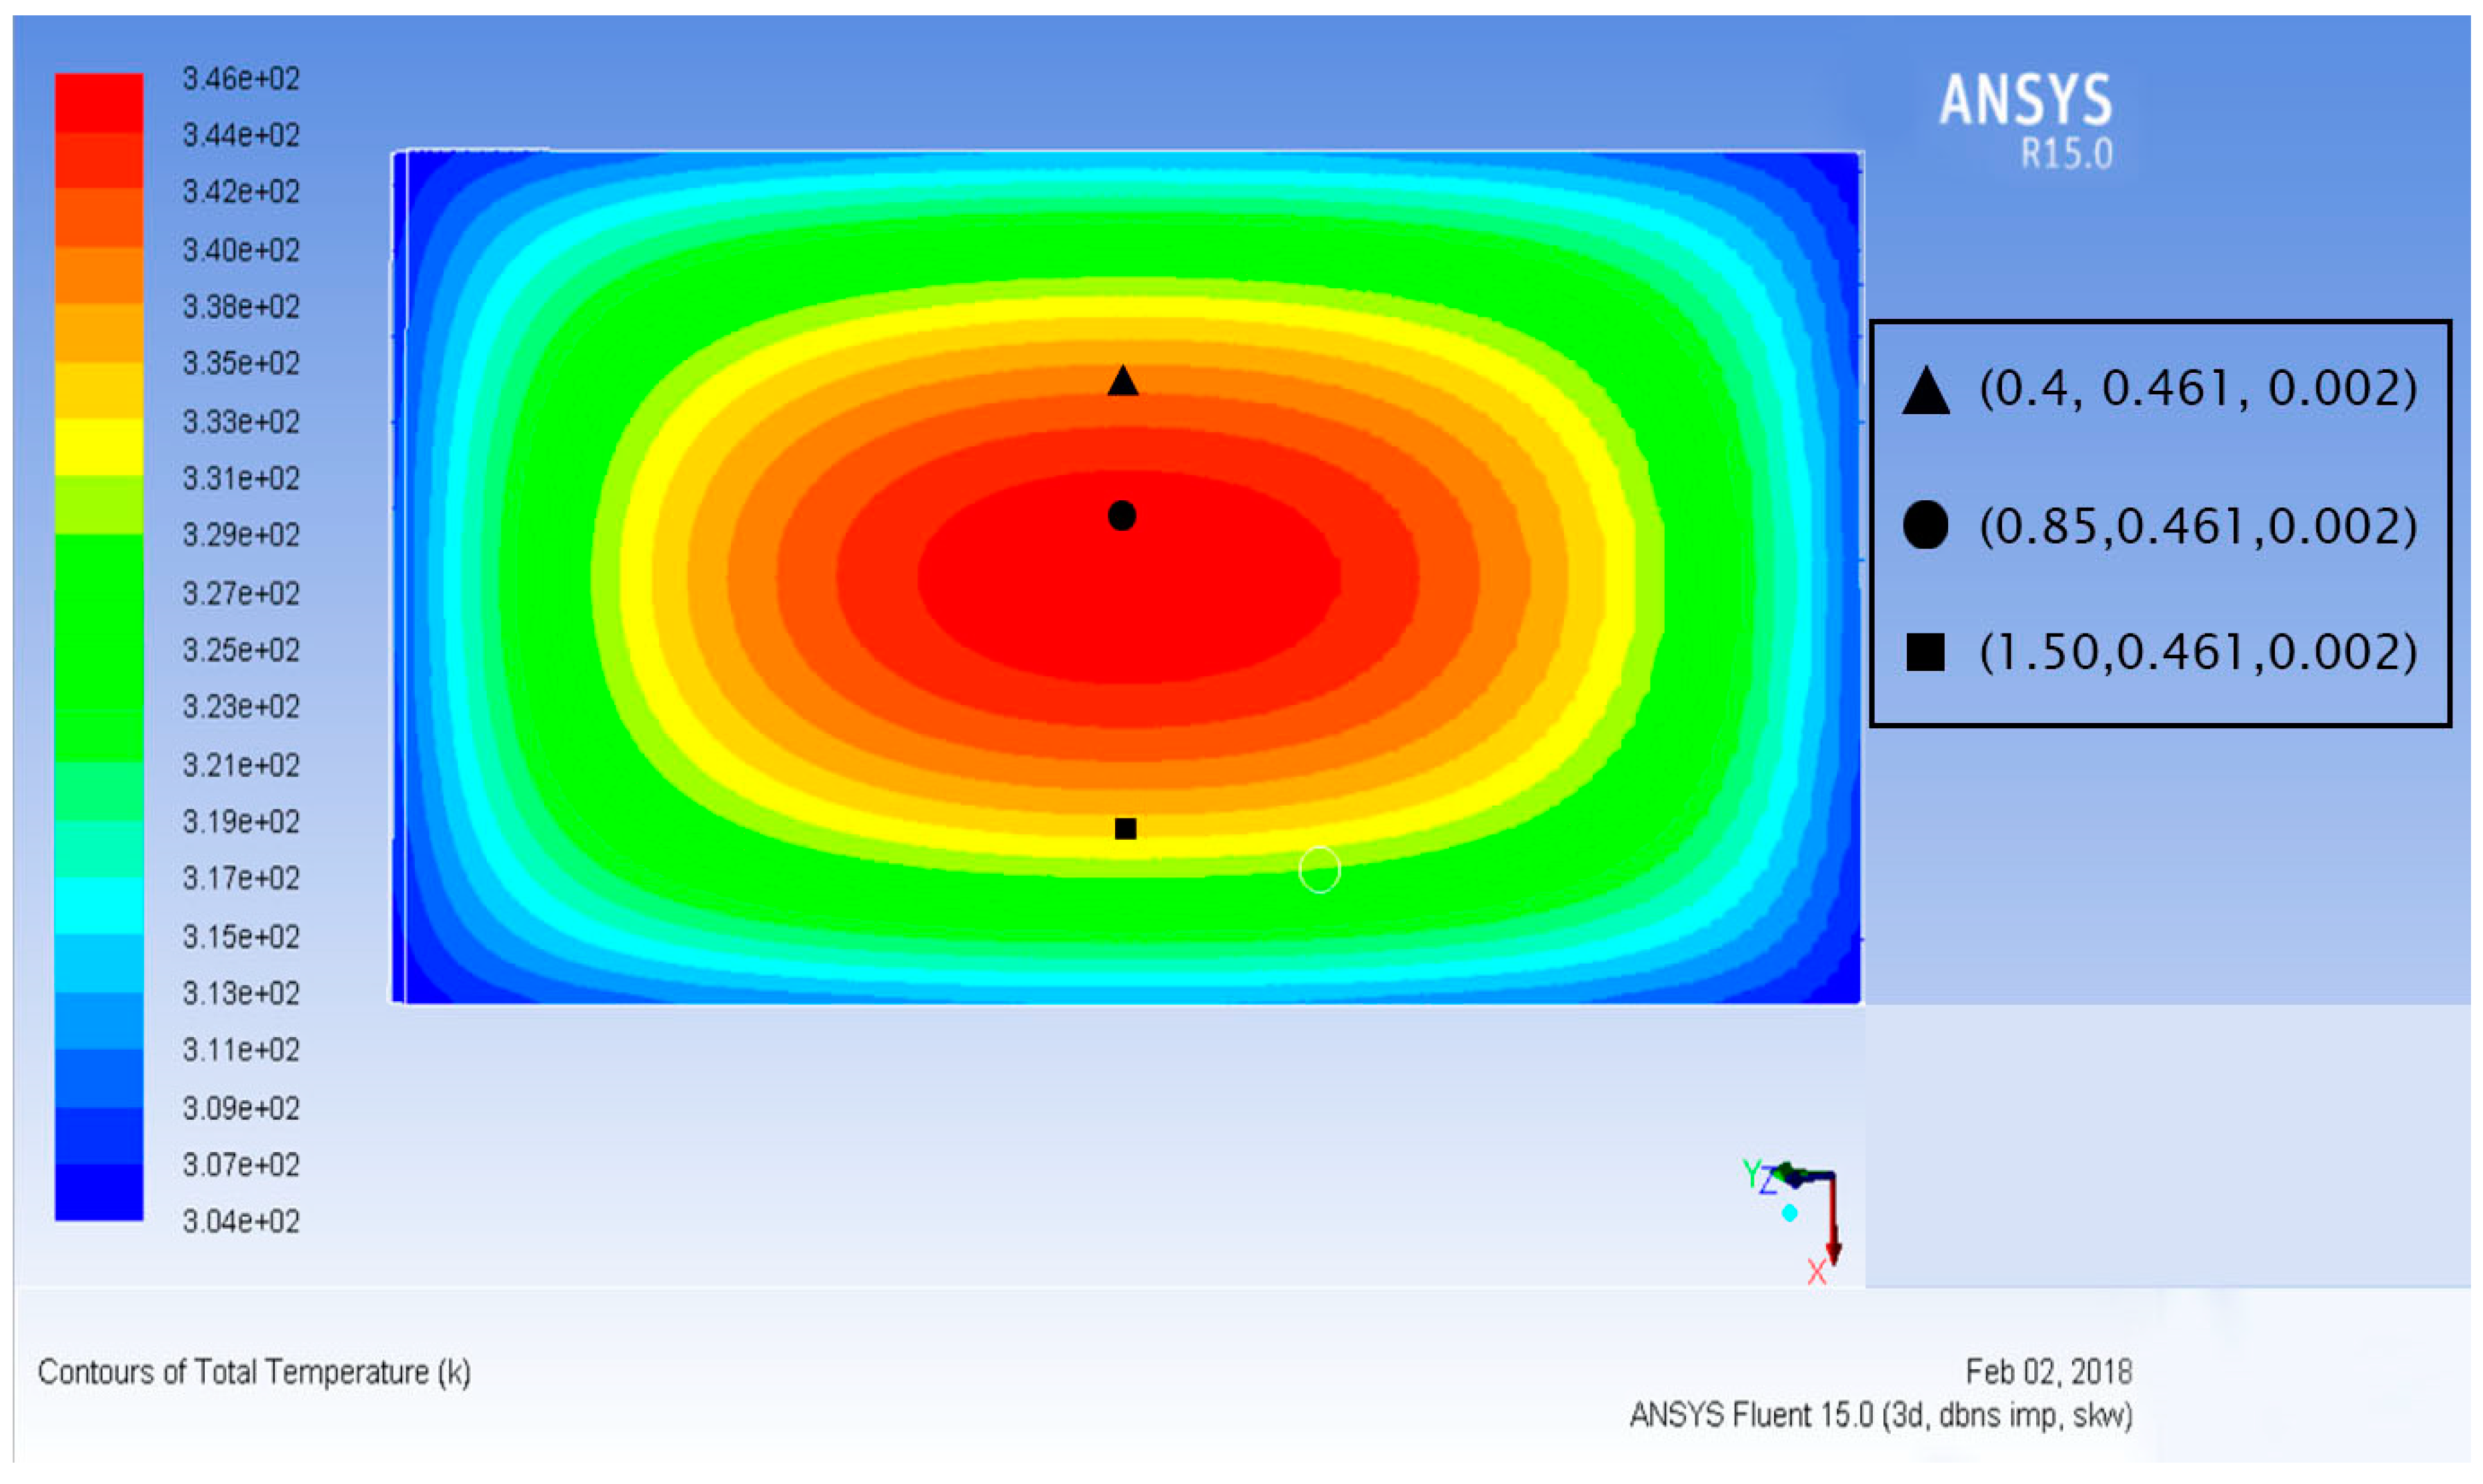
5. Solar PV Panel Thermal Modeling
6. Results and Discussions
7. Conclusion
Author Contributions
Funding
Conflicts of Interest
Appendix A

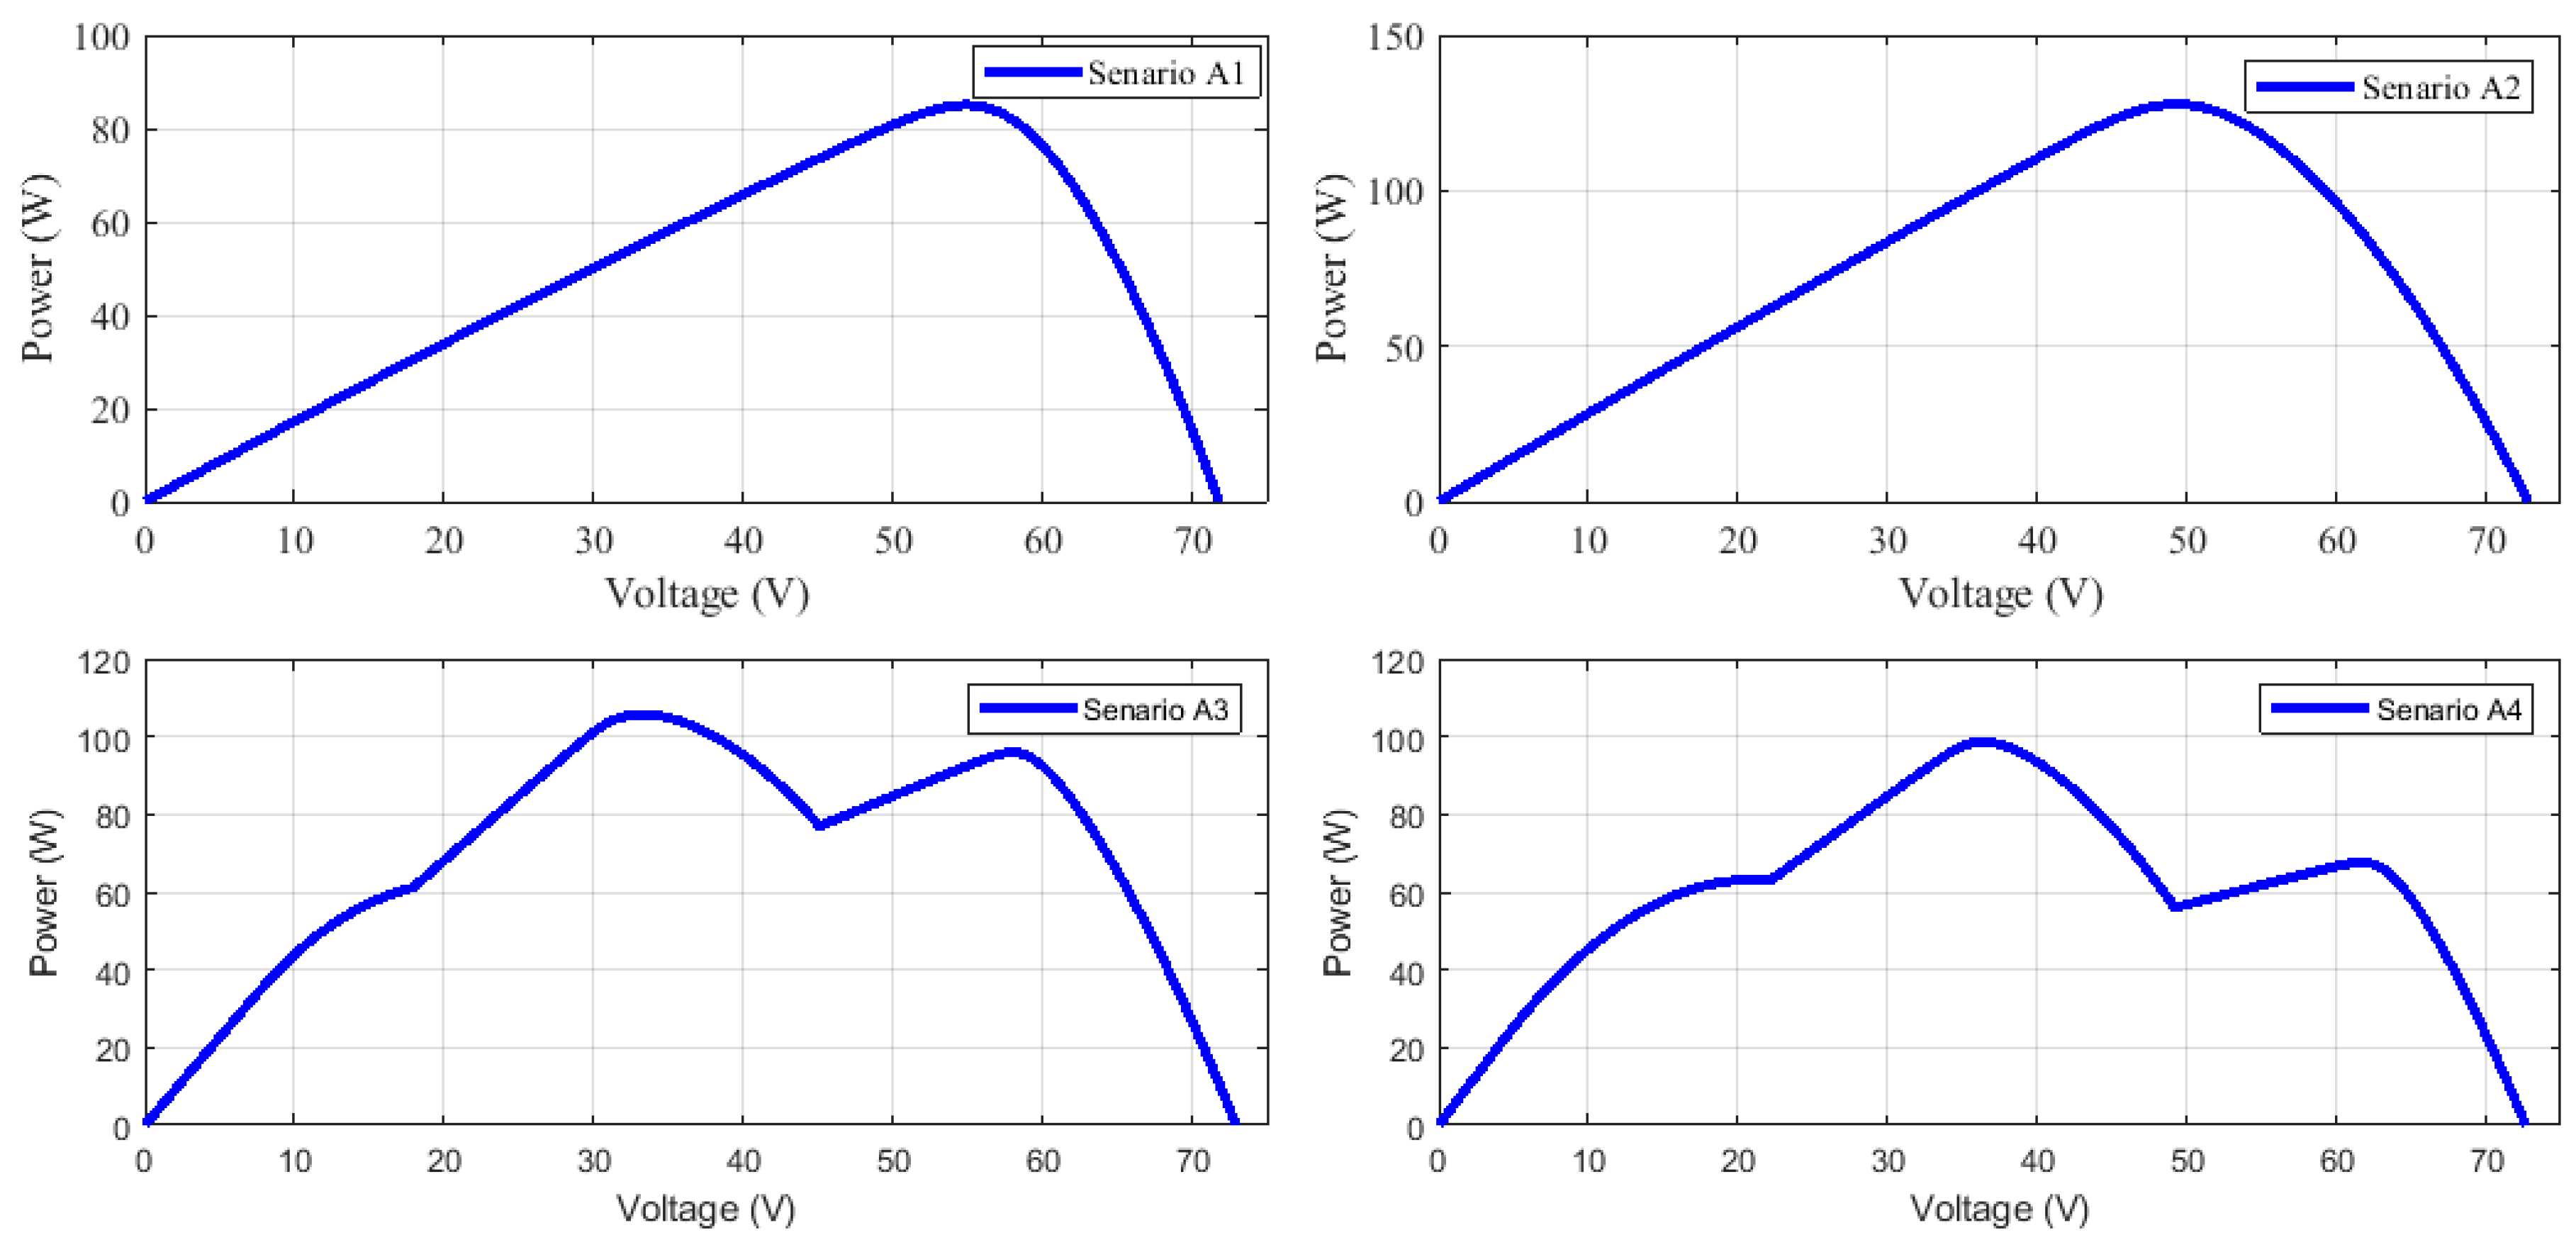
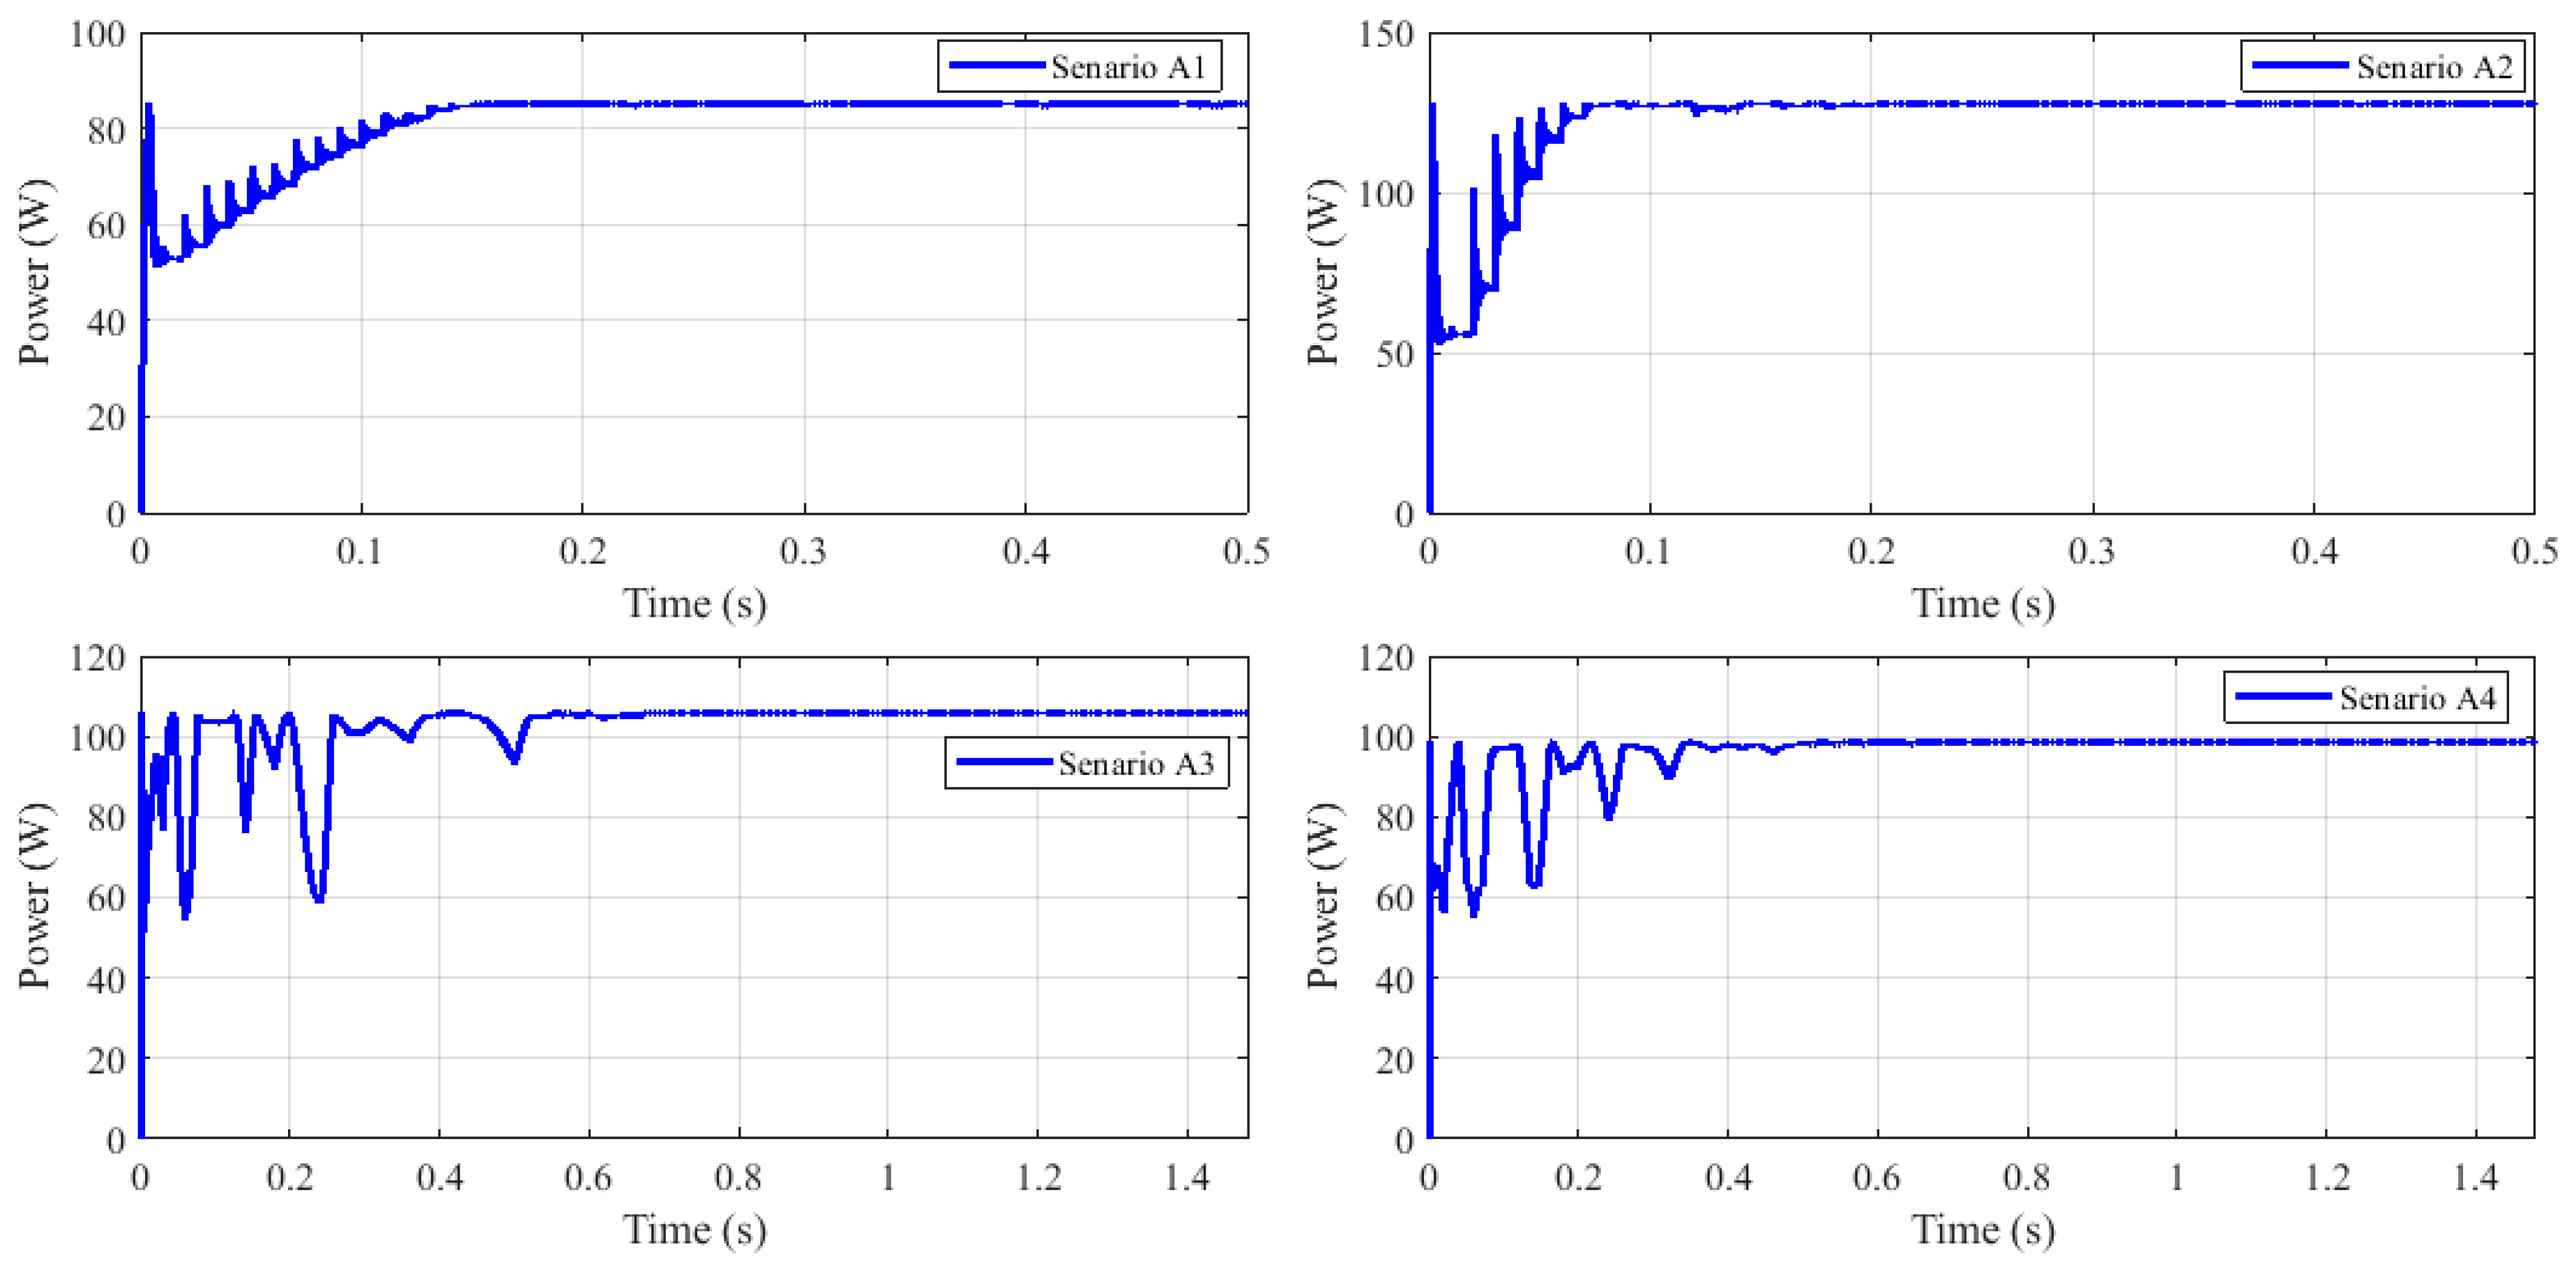
| Scenario | Solar Irradiance W/m2 | TEG Configuration | Voltage, V | Current, A | Power, W | |
|---|---|---|---|---|---|---|
| #A1 | Uniform | 300 | Ns = 12 Np = 6 | 54.9 | 1.55 | 85.0 |
| #A2 | 500 | Ns = 12 Np = 6 | 49.32 | 2.59 | 127.8 | |
| #A3 | Non-uniform | 800,600,300 | Ns = 12 Np = 6 | 33.24 | 3.18 | 105.7 |
| #A4 | 900,500,200 | Ns = 12 Np = 6 | 33.64 | 2.7 | 98.6 | |


References
- Marmoush, M.M.; Rezk, H.; Shehata, N.; Henry, J.; Gomaa, M.R. A novel merging Tubular Daylight Device with Solar Water Heater–Experimental study. Renew. Energy 2018, 125, 947–961. [Google Scholar] [CrossRef]
- Hemeida, M.G.; Rezk, H.; Hamada, M.M. A comprehensive comparison of STATCOM versus SVC-based fuzzy controller for stability improvement of wind farm connected to multi-machine power system. Electr. Eng. 2018, 100, 935–951. [Google Scholar] [CrossRef]
- Rezk, H.; Tyukhov, I.; Raupov, A. Experimental implementation of meteorological data and photovoltaic solar radiation monitoring system. Int. Trans. Electr. Energy Syst. 2015. [Google Scholar] [CrossRef]
- Rezk, H.; Tyukhov, I.; Al-Dhaifallaha, M.; Tikhonov, A. Performance of data acquisition system for monitoring PV system parameters. Measurement 2017, 104, 204–211. [Google Scholar] [CrossRef]
- Rezk, H.; El-Sayed, A.H.M. Sizing of a Stand Alone Concentrated Photovoltaic System in Egyptian Site. Int. J. Electr. Power Energy Syst. 2015, 45, 325–330. [Google Scholar] [CrossRef]
- Rezk, H. A comprehensive sizing methodology for stand-alone battery-less photovoltaic water pumping system under the Egyptian climate. Cogent Eng. 2016, 3, 1242110. [Google Scholar] [CrossRef]
- Rezk, H.; Dousoky, G.M. Technical and economic analysis of different configurations of stand-alone hybrid renewable power systems—A case study. Renew. Sustain. Energy Rev. 2016, 62, 941–953. [Google Scholar] [CrossRef]
- Montecucco, A.; Knox, A.R. Maximum Power Point Tracking Converter Based on the Open-Circuit Voltage Method for Thermoelectric Generators. IEEE Trans. Power Electron. 2015, 30, 828–839. [Google Scholar] [CrossRef]
- Kim, R.; Lai, J.; York, B.; Koran, A. Analysis and Design of Maximum Power Point Tracking Scheme for Thermoelectric Battery Energy Storage System. IEEE Trans. Ind. Electron. 2009, 56, 3709–3716. [Google Scholar]
- Bjørk, R.; Nielsen, K.K. The performance of a combined solar photovoltaic (PV) and thermoelectric generator (TEG) system. Sol. Energy 2015, 120, 187–194. [Google Scholar] [CrossRef]
- Zhang, J.; Xuan, Y.; Yang, L. A novel choice for the photovoltaic-thermoelectric hybrid system: The perovskite solar cell. Int. J. Energy Res. 2016, 40, 1400–1409. [Google Scholar] [CrossRef]
- Zhang, X.; Chau, K.T. An automotive thermoelectric–photovoltaic hybrid energy system using maximum power point tracking. Energy Convers. Manag. 2011, 52, 641–647. [Google Scholar] [CrossRef]
- Daniel, T.C.; Petru, A.C.; Daniela, C. Characterization of Photovoltaic–Thermoelectric–Solar Coll ector Hybrid Systems in Natural Sunlight Conditions. J. Energy Eng. 2017. [Google Scholar] [CrossRef]
- Zhang, X.; Chau, K.T.; Chan, C.C. Design and Implementation of a Thermoelectric-Photovoltaic Hybrid Energy Source for Hybrid Electric Vehicles. In Proceedings of the EVS24, Stavanger, Norway, 13–16 May 2009. [Google Scholar]
- Edgar, A.; Chávez, U.; Yuri, V.V. Design and Investigation of Solar Hybrid Electric/Thermal System with Sun-tracking Concentrator, Photovoltaic and Thermoelectric Generators. In Proceedings of the 7th WSEAS International Conference on Energy and Environment, Kos Island, Greece, 14–17 July 2012; pp. 336–341. [Google Scholar]
- Deng, Y.; Zhu, W.; Wang, Y.; Shi, Y. Enhanced performance of solar-driven photovoltaic–thermoelectric hybrid system in an integrated design. Sol. Energy 2013, 88, 182–191. [Google Scholar] [CrossRef]
- van Sark, W.G.J.H.M. Feasibility of photovoltaic—Thermoelectric hybrid modules. Appl. Energy 2011, 88, 2785–2790. [Google Scholar] [CrossRef]
- Park, K.-T.; Shin, S.-M.; Tazebay, A.S.; Um, H.-D.; Jung, J.-Y.; Jee, S.-W.; Oh, M.W.; Park, S.D.; Yoo, B.; Yu, C.; et al. Lossless hybridization between photovoltaic and thermoelectric devices. Sci. Rep. 2013, 3, 2123. [Google Scholar] [CrossRef] [PubMed]
- Beeri, O.; Rotem, O.; Hazan, E.; Katz, E.A.; Braun, A.; Gelbstein, Y. Hybrid photovoltaic-thermoelectric system for concentrated solar energy conversion: Experimental realization and modeling. J. Appl. Phys. 2015, 118, 115104. [Google Scholar] [CrossRef]
- Cotfas, D.T.; Cotfas, P.A.; Machidon, O.M.; Ciobanu, D. Investigation of the photovoltaic cell/thermoelectric element hybrid system performance. IOP Conf. Ser. Mater. Sci. Eng. 2016, 133, 12037. [Google Scholar] [CrossRef]
- Zhu, W.; Deng, Y.; Wang, Y.; Shen, S.; Gulfam, R. High-performance photovoltaic-thermoelectric hybrid power generation system with optimized thermal management. Energy 2016, 100, 91–101. [Google Scholar] [CrossRef]
- Kossyvakis, D.N.; Voutsinas, G.D.; Hristoforou, E.V. Experimental analysis and performance evaluation of a tandem photovoltaic–thermoelectric hybrid system. Energy Convers. Manag. 2016, 117, 490–500. [Google Scholar] [CrossRef]
- Hsueh, T.-J.; Shieh, J.-M.; Yeh, Y.-M. Hybrid Cd-free CIGS solar cell/TEG device with ZnO nanowires. Prog. Photovolt. Res. Appl. 2015, 23, 507–512. [Google Scholar] [CrossRef]
- Wang, N.; Han, L.; He, H.; Park, N.-H.; Koumoto, K. A novel high-performance photovoltaic–thermoelectric hybrid device. Energy Environ. Sci. 2011, 4, 3676–3679. [Google Scholar] [CrossRef]
- Chen, T.; Guai, G.H.; Gong, C.; Hu, W.; Zhu, J.; Yang, H. Thermoelectric Bi2Te3-improved charge collection for high-performance dye-sensitized solar cells. Energy Environ. Sci. 2012, 5, 6294–6298. [Google Scholar] [CrossRef]
- Zhou, Z.; Yang, J.; Jiang, Q.; Li, W.; Luo, Y.; Hou, Y. Large improvement of device performance by a synergistic effect of photovoltaics and thermoelectrics. Nano Energy 2016, 22, 120–128. [Google Scholar] [CrossRef]
- Zhang, Y.; Fang, J.; He, C.; Yan, H.; Wei, Z.; Li, Y. Integrated energy-harvesting system by combining the advantages of polymer solar cells and thermoelectric devices. J. Phys. Chem. 2013, 117, 24685–24691. [Google Scholar] [CrossRef]
- Zhang, J.; Xuan, Y.; Yang, L. Performance estimation of photovoltaic–thermoelectric hybrid systems. Energy 2014, 78, 895–903. [Google Scholar] [CrossRef]
- Zeb, K. A survey on waste heat recovery: Electric power generation and potential prospects within Pakistan. Renew. Sustain. Energy Rev. 2017, 75, 1142–1155. [Google Scholar] [CrossRef]
- Guo, X.; Zhang, Y.; Qin, D.; Luo, Y.; Li, D.; Pang, Y. Hybrid tandem solar cell for concurrently converting light and heat energy with utilization of full solar spectrum. J. Power Sources 2010, 195, 7684–7690. [Google Scholar] [CrossRef]
- Li, G.; Zhao, X.; Ji, J. Conceptual development of a novel photovoltaic-thermoelectric system and preliminary economic analysis. Energy Convers. Manag. 2016, 126, 935–943. [Google Scholar] [CrossRef]
- Rezk, H.; Eltamaly, A.M. A comprehensive comparison of different MPPT techniques for photovoltaic systems. Sol. Energy 2015, 112, 1–11. [Google Scholar] [CrossRef]
- Rezk, H.; Hasaneen, E.-S. A new MATLAB/Simulink model of triple-junction solar cell and MPPT based on artificial neural networks for photovoltaic energy systems. Ain Shams Eng. J. 2015, 6, 873–881. [Google Scholar] [CrossRef]
- Rezk, H.; Fathy, A.; Abdelaziz, A.Y. A comparison of different global MPPT techniques based on meta-heuristic algorithms for photovoltaic system subjected to partial shading conditions. Renew. Sustain. Energy Rev. 2017, 74, 377–386. [Google Scholar] [CrossRef]
- Fathy, A.; Rezk, H. A novel methodology for simulating maximum power point trackers using mine blast optimization and teaching learning based optimization algorithms for partially shaded photovoltaic system. J. Renew. Sustain. Energy 2016, 8, 023503. [Google Scholar] [CrossRef]
- Rezk, H.; Fathy, A. Simulation of global MPPT based on teaching–learning-based optimization technique for partially shaded PV system. Electr. Eng. 2016. [Google Scholar] [CrossRef]
- Diab, A.A.Z.; Rezk, H. Global MPPT based on flower pollination and differential evolution algorithms to mitigate partial shading in building integrated PV system. Sol. Energy 2017, 157, 171–186. [Google Scholar] [CrossRef]
- Wolpert, D.H.; Macready, W.G. No free lunch theorems for optimization. IEEE Trans. Evol. Comput. 1997, 1, 67–82. [Google Scholar] [CrossRef]
- Mirjalili, S. Knowledge-Based Systems Moth-flame optimization algorithm: A novel nature-inspired heuristic paradigm. Knowl.-Based Syst. 2015, 89, 228–249. [Google Scholar] [CrossRef]
- Datasheet “TSM-205DA01A.05”. Available online: https://www.solarreviews.com/buyers-guide/solar-panels/trina-solar/trina27872tsm205da01a05 (accessed on 29 June 2019).
- Lineykin, S.; Ben-Yaakov, S. Modeling and Analysis of Thermoelectric Modules. IEEE Trans. Ind. Appl. 2007, 43, 505–512. [Google Scholar] [CrossRef]
- Shanmugam, S.; Eswaramoorthy, M.; Veerappan, A.R. Modeling and Analysis of a Solar Parabolic Dish Thermoelectric Generator. Energy Sources Part A 2014, 36, 1531–1539. [Google Scholar] [CrossRef]
- Datasheet “TE-MOD-1W2V-40S”. Available online: http://www.tegpro.com/datasheets/TE-MOD-1W2V-40S.pdf (accessed on 29 June 2019).
- Ahmed, E.M.; Shoyama, M. Scaling factor design issues in variable step size incremental resistance MPPT in PV systems. In Proceedings of the 2011 IEEE Ninth International Conference on Power Electronics and Drive Systems, Singapore, 5–8 December 2011. [Google Scholar] [CrossRef]
- Al-Dhaifallah, M.; Nassef, A.M.; Hegazy, R.; Nisar, K.S. Optimal parameter design of fractional order control based INC-MPPT for PV system. Sol. Energy 2018, 159, 650–664. [Google Scholar] [CrossRef]
- Bachir, B.; Lakhdar, C.; Saliha, C. Optimal Power Flow using the Moth Flam Optimizer: A Case Study of the Algerian Power System. Indones. J. Electr. Eng. Comput. Sci. 2016, 13, 431–445. [Google Scholar]
- Mohamed, A.M.; Diab, A.A.Z.; Rezk, H. Partial shading mitigation of PV systems via different meta-heuristic techniques. Renew. Energy 2019, 130, 1159–1175. [Google Scholar] [CrossRef]
- Available online: https://weatherspark.com/y/148812/Average-Weather-at-Wadi-al-Dawasir-Domestic-Airport-Saudi-Arabia-Year-Round (accessed on 18 April 2019).


| Type of PV/TEG | ΔT (°C) | Overall Power (MW) | Overall Efficiency (%) | Reference | Remark | |
|---|---|---|---|---|---|---|
| PV | TEG | |||||
| Perovskite | ceramic | – | – | 18.6 | [11] | Solar selective absorber (SSA) was used, Concentration ratio (CR) = 1 |
| Monocrystalline | Bi2Te3 | 5.9 | 7% power increasing, 3.4 mW of TEG | 18.93 | [20] | Simulation 720–1020 W/m2 |
| Polycrystalline | Bi2Te3 | 5.6 | 7% power increasing, 3.44 mW of TEG | 16.71 | ||
| amorphous silicon | Bi2Te3 | 3.4 | 5% increasing power, 1.12 mW of TEG | 2.88 | ||
| c-Si | Bi2Te3 | 15 | 65.2 | 16.3 | [18] | – |
| c-Si | Not mentioned | 52 | 24,500 (9 solar cells) | 23 | [21] | – |
| Poly-Si | Bi2Te3 | 36 | 2290 | 12.4 | [22] | – |
| Cd- free CIGS | Bi2Te3 | 11.6 | – | 22.02 | [23] | Use of nanowire (ZnO) |
| DSSC | Bi2Te3 | 6.2 | 13.8 per cm2 | 13.8 | [24] | SSA was used |
| DSSC | 0.89% Bi2Te3 in TiO2 anode | 15 | – | 7.33 | [25] | – |
| DSSC | p-type; Bi0.4Sb1.6Te3 n-type; Bi2.85Se0.15Te3 | – | – | 9.08 | [26] | – |
| Polymer solar cell | Bi2Te3 | 9.5 | 11.29 per cm2 | – | [27] | – |
| Polymer solar cell | Bi0.4Sb1.6Te3 | – | – | ~13.4 | [28] | Concentration system, CR = 1 |
| Thin film | Bi2Te3,ZnSb | 85 | 19.13 μW for TEG only | - | [29] | |
| DSSC | Bi2Te3 | 20 | 11.2% increase compared to PV alone | - | [30] | |
| DSSC | Bi2Te3 | 6.2 | - | 13% increase compared to PV alone | [22] | Using selective layer absorber |
| Multicrystalline | Bi2Te3 | 27 | - | 35 | [17] | Theoretical with 1000 W/m2 |
| Polycrystalline | Bi2Te3 | 40 | - | 11.3 | [31] | Numerical model 100–1000 W/m2 |
| Polycrystalline | Bi2Te3 | Module temp. 25–86 °C cold side temp. constant 20 °C | 22.5% increasing power, 2.26 W of TEG | 30–40 with 1.6 mm TEG thick | [22] | Laboratory experimentation 1000 W/m2 1.6 mm thickness of TEG cools the module than the 1 mm thickness, but 1 mm gives more performance than 1.6 mm |
| Dyesensitized | 22.5% increasing power, 2.28 W of TEG | 30–45 with 1 mm TEG thickness | ||||
| Item | Specification |
|---|---|
| Module | Trina Solar TSM-205DA01A.05 |
| Maximum power (W) | 205 |
| Cells per module | 72 |
| Open-circuit voltage (Voc) (V) | 46.6 |
| Short-circuit current (Isc) (A) | 5.66 |
| Voltage at MPP (V) | 38.6 |
| Current at MPP (A) | 5.32 |
| Temperature coefficient of Voc (%/deg.C) | −0.034 |
| Temperature coefficient of Isc (%/deg.C) | 0.04 |
| Light generated current (A) | 5.6825 |
| Diode saturation current (A) | 9.0933 × 10⁻¹¹ |
| Diode ideality factor | 1.0142 |
| Shunt resistance (ohms) | 402.5112 |
| Series resistance (ohms) | 0.4372 |
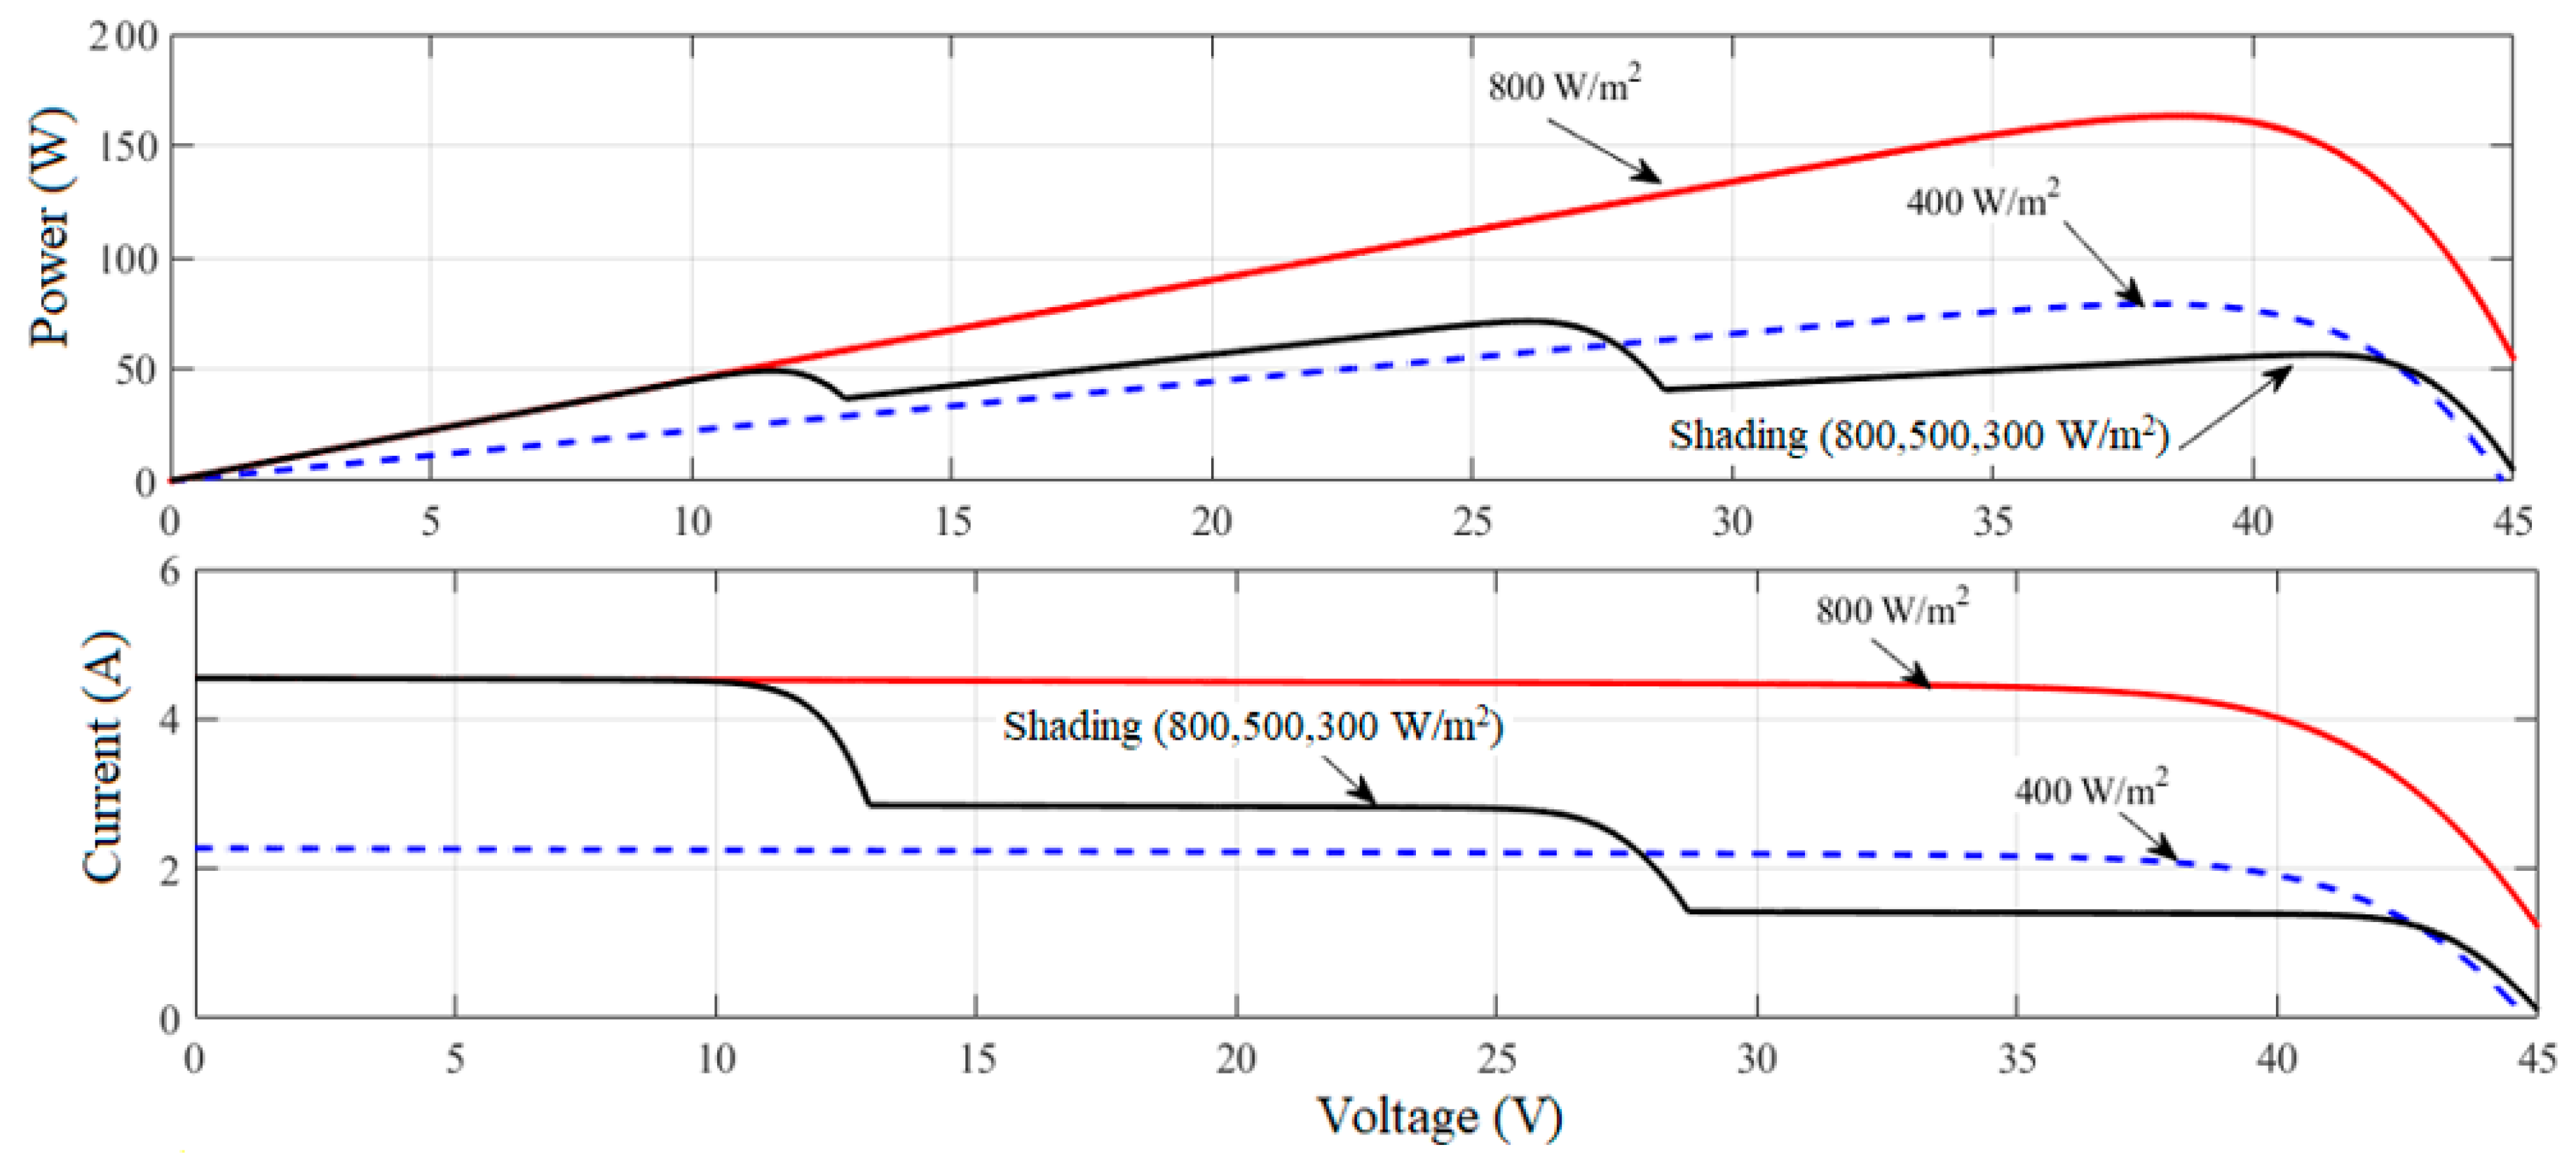
| Radiation | Voltage, V | Current, A | Power, W |
|---|---|---|---|
| 800, W/m2 | 38.57 | 4.23 | 163.29 |
| 400 | 38.10 | 2.07 | 79.10 |
| Shading (800,500,300 W/m2) | 26.07 | 2.74 | 71.45 |
| Item | Unit | Ratings |
|---|---|---|
| Hot side temperature | °C | 100 |
| Cold side temperature | °C | 20 |
| Open-circuit voltage | V | 4.0 |
| Matched load resistance | Ω | 3.25 |
| Matched load output voltage | V | 2.6 |
| Matched load output current | A | 0.8 |
| Matched load output power | W | 0.84 |
| Heat flow density | W cm−2 | 7 |
| Dimension (A × B) | mm | 40 × 40 |
| For the case study | ||
| Hot side temperature | °C | 75 |
| Cold side temperature | °C | 30 |
| Seebeck coefficients | V/°C | 115.5 × 10⁻³ |
| Thermal conductivity | W/m2 K | 0.67 |
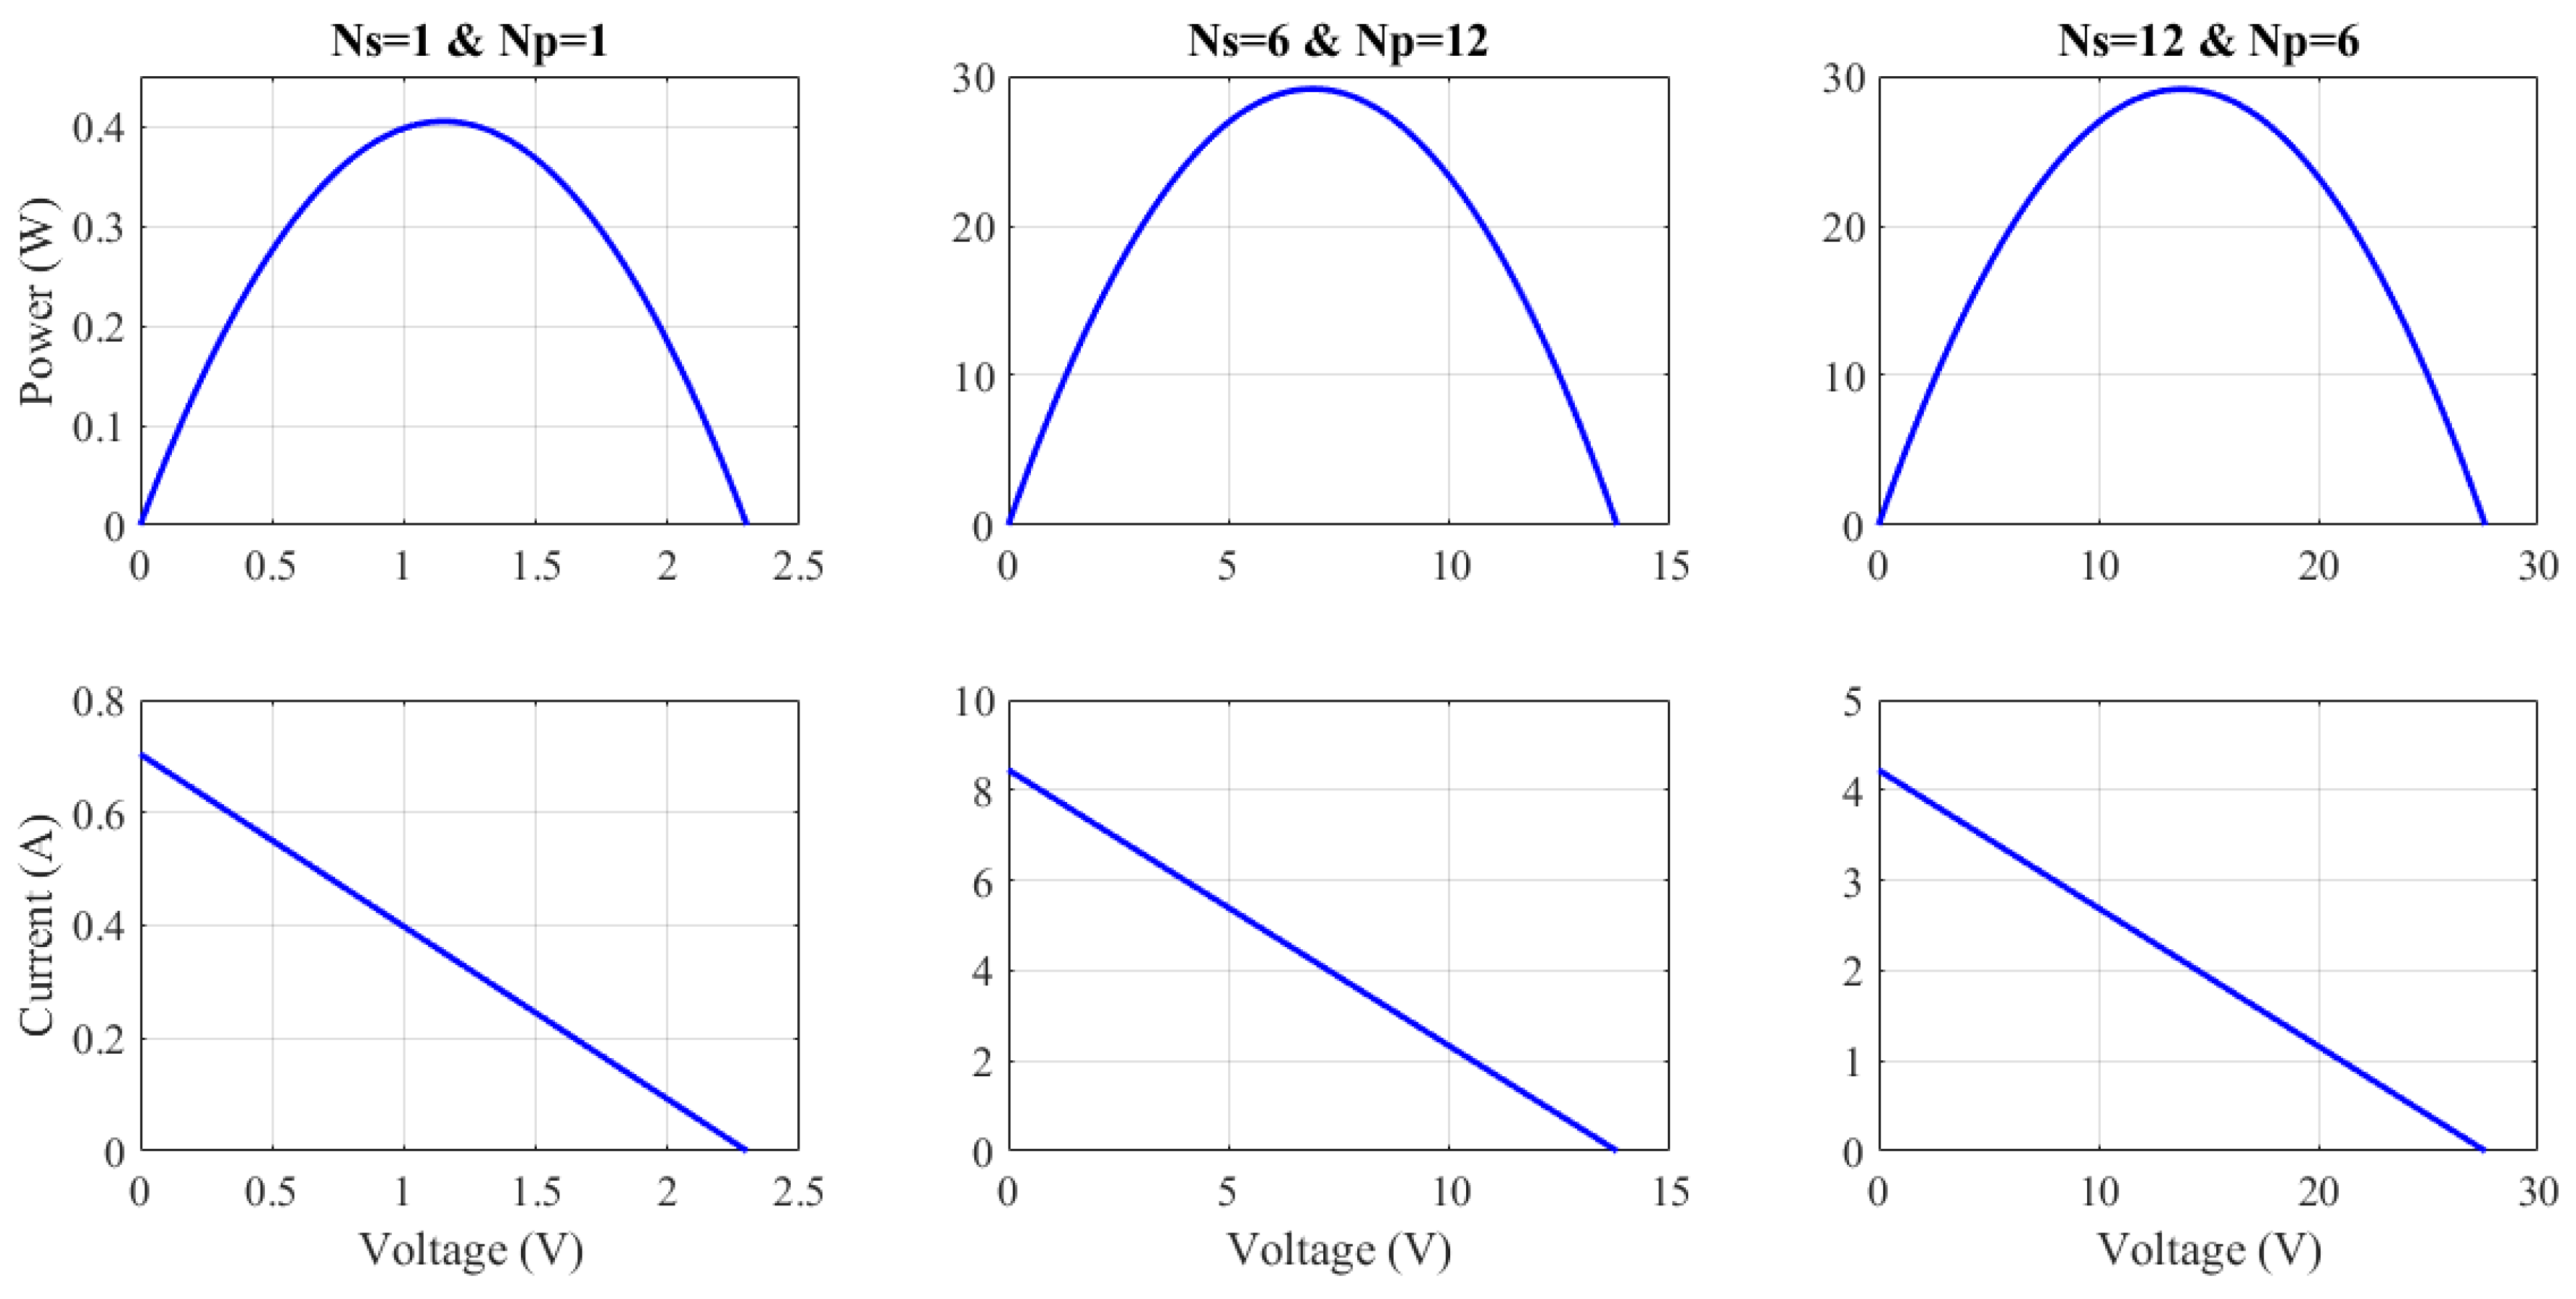
| TEG Configuration | Voltage, V | Current, A | Power, W |
|---|---|---|---|
| Ns = 1 Np = 1 | 1.15 | 0.35 | 0.40 |
| Ns = 6 Np = 12 | 6.9 | 4.22 | 29.14 |
| Ns = 12 Np = 6 | 13.80 | 2.11 | 29.13 |
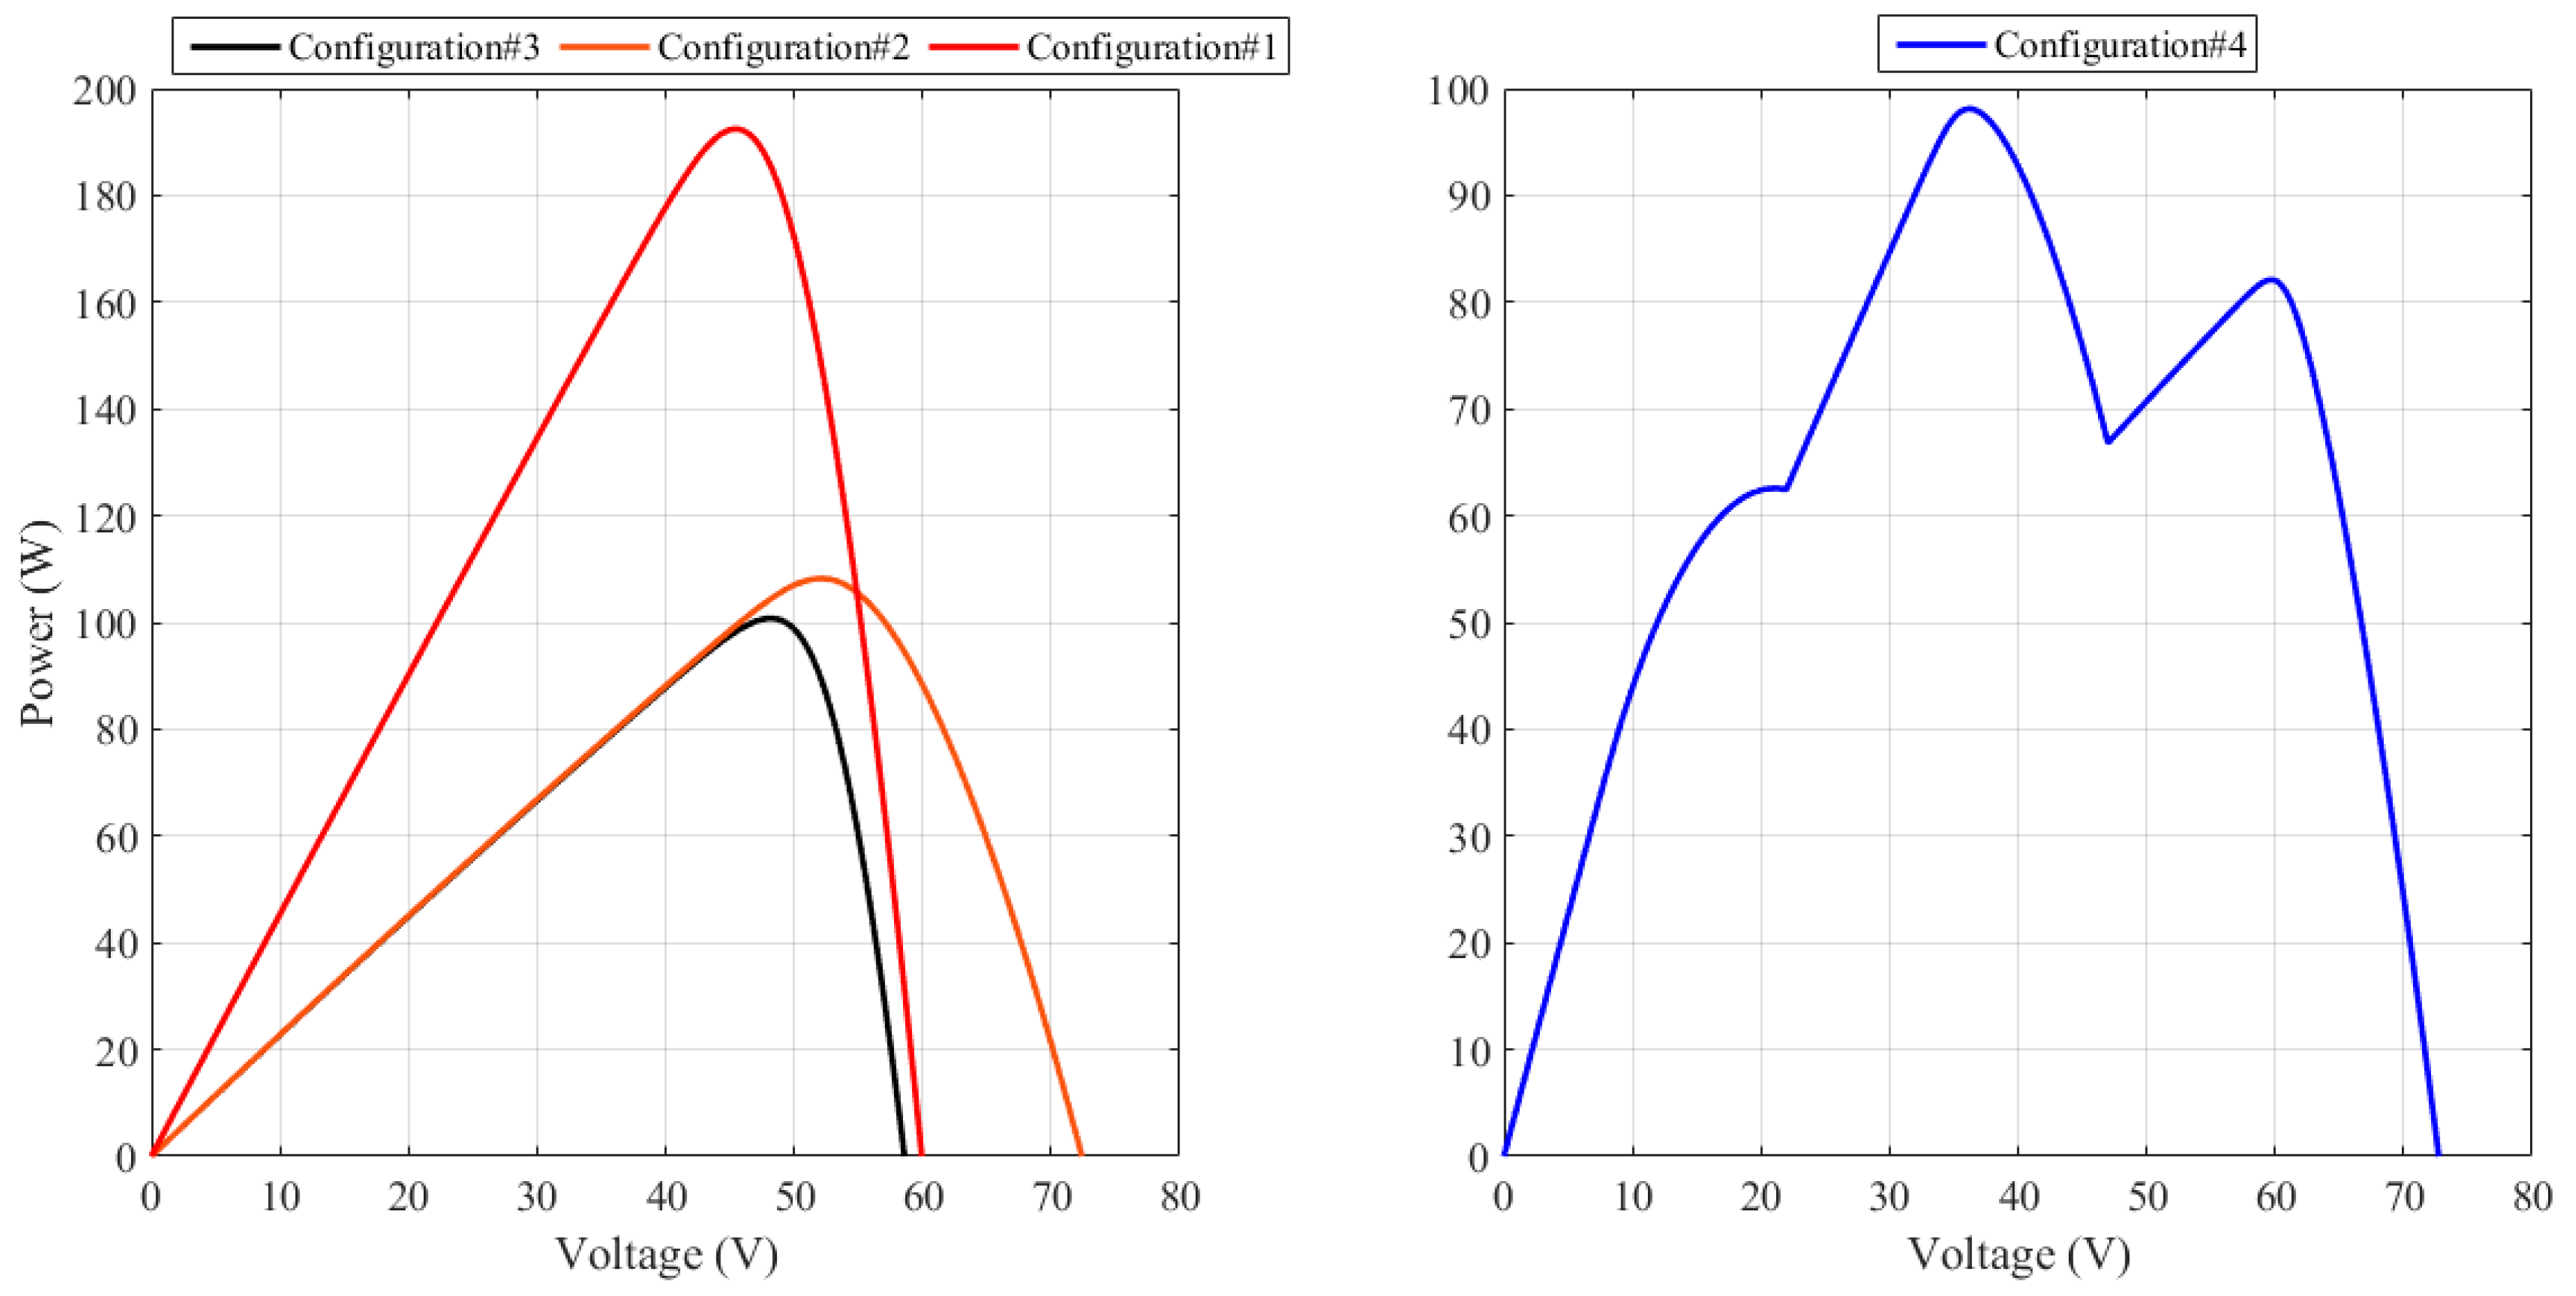
| Configuration | Solar Irradiance W/m2 | TEG Configuration | Voltage, V | Current, A | Power, W | |
|---|---|---|---|---|---|---|
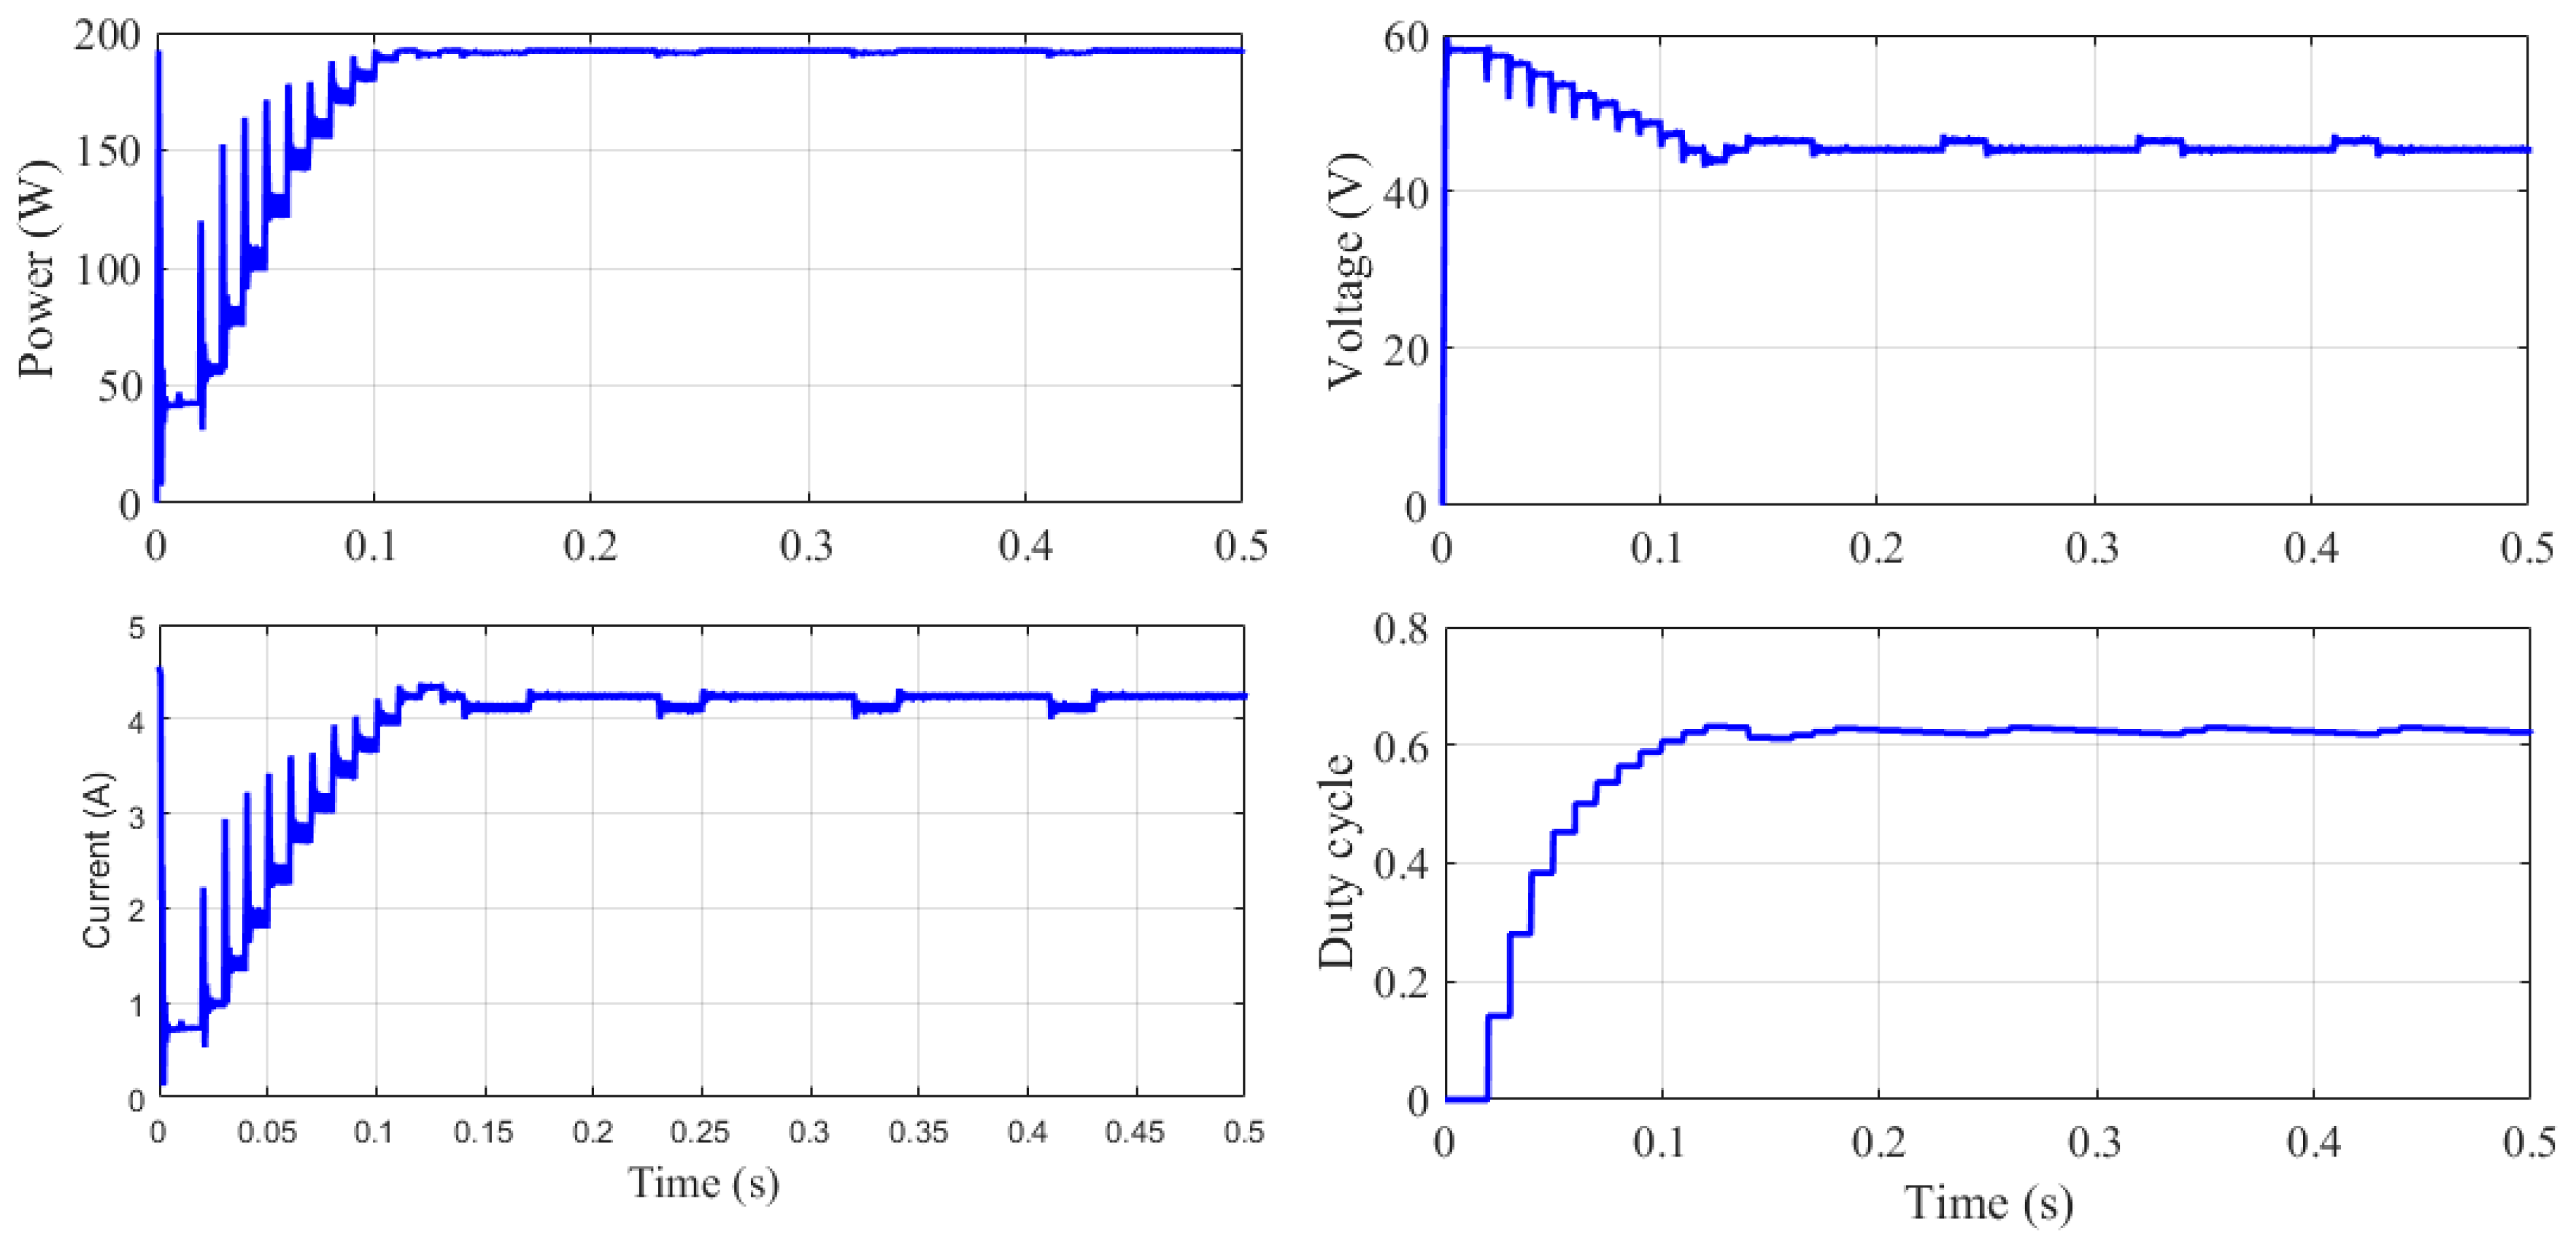
| #1 | Uniform | 800 | Ns = 6 Np = 12 | 45.45 | 4.23 | 192.44 |
| #2 | 400 | Ns = 12 Np = 6 | 52.10 | 2.07 | 108.22 | |
| #3 | 400 | Ns = 6 Np = 12 | 48.17 | 2.09 | 100.77 | |
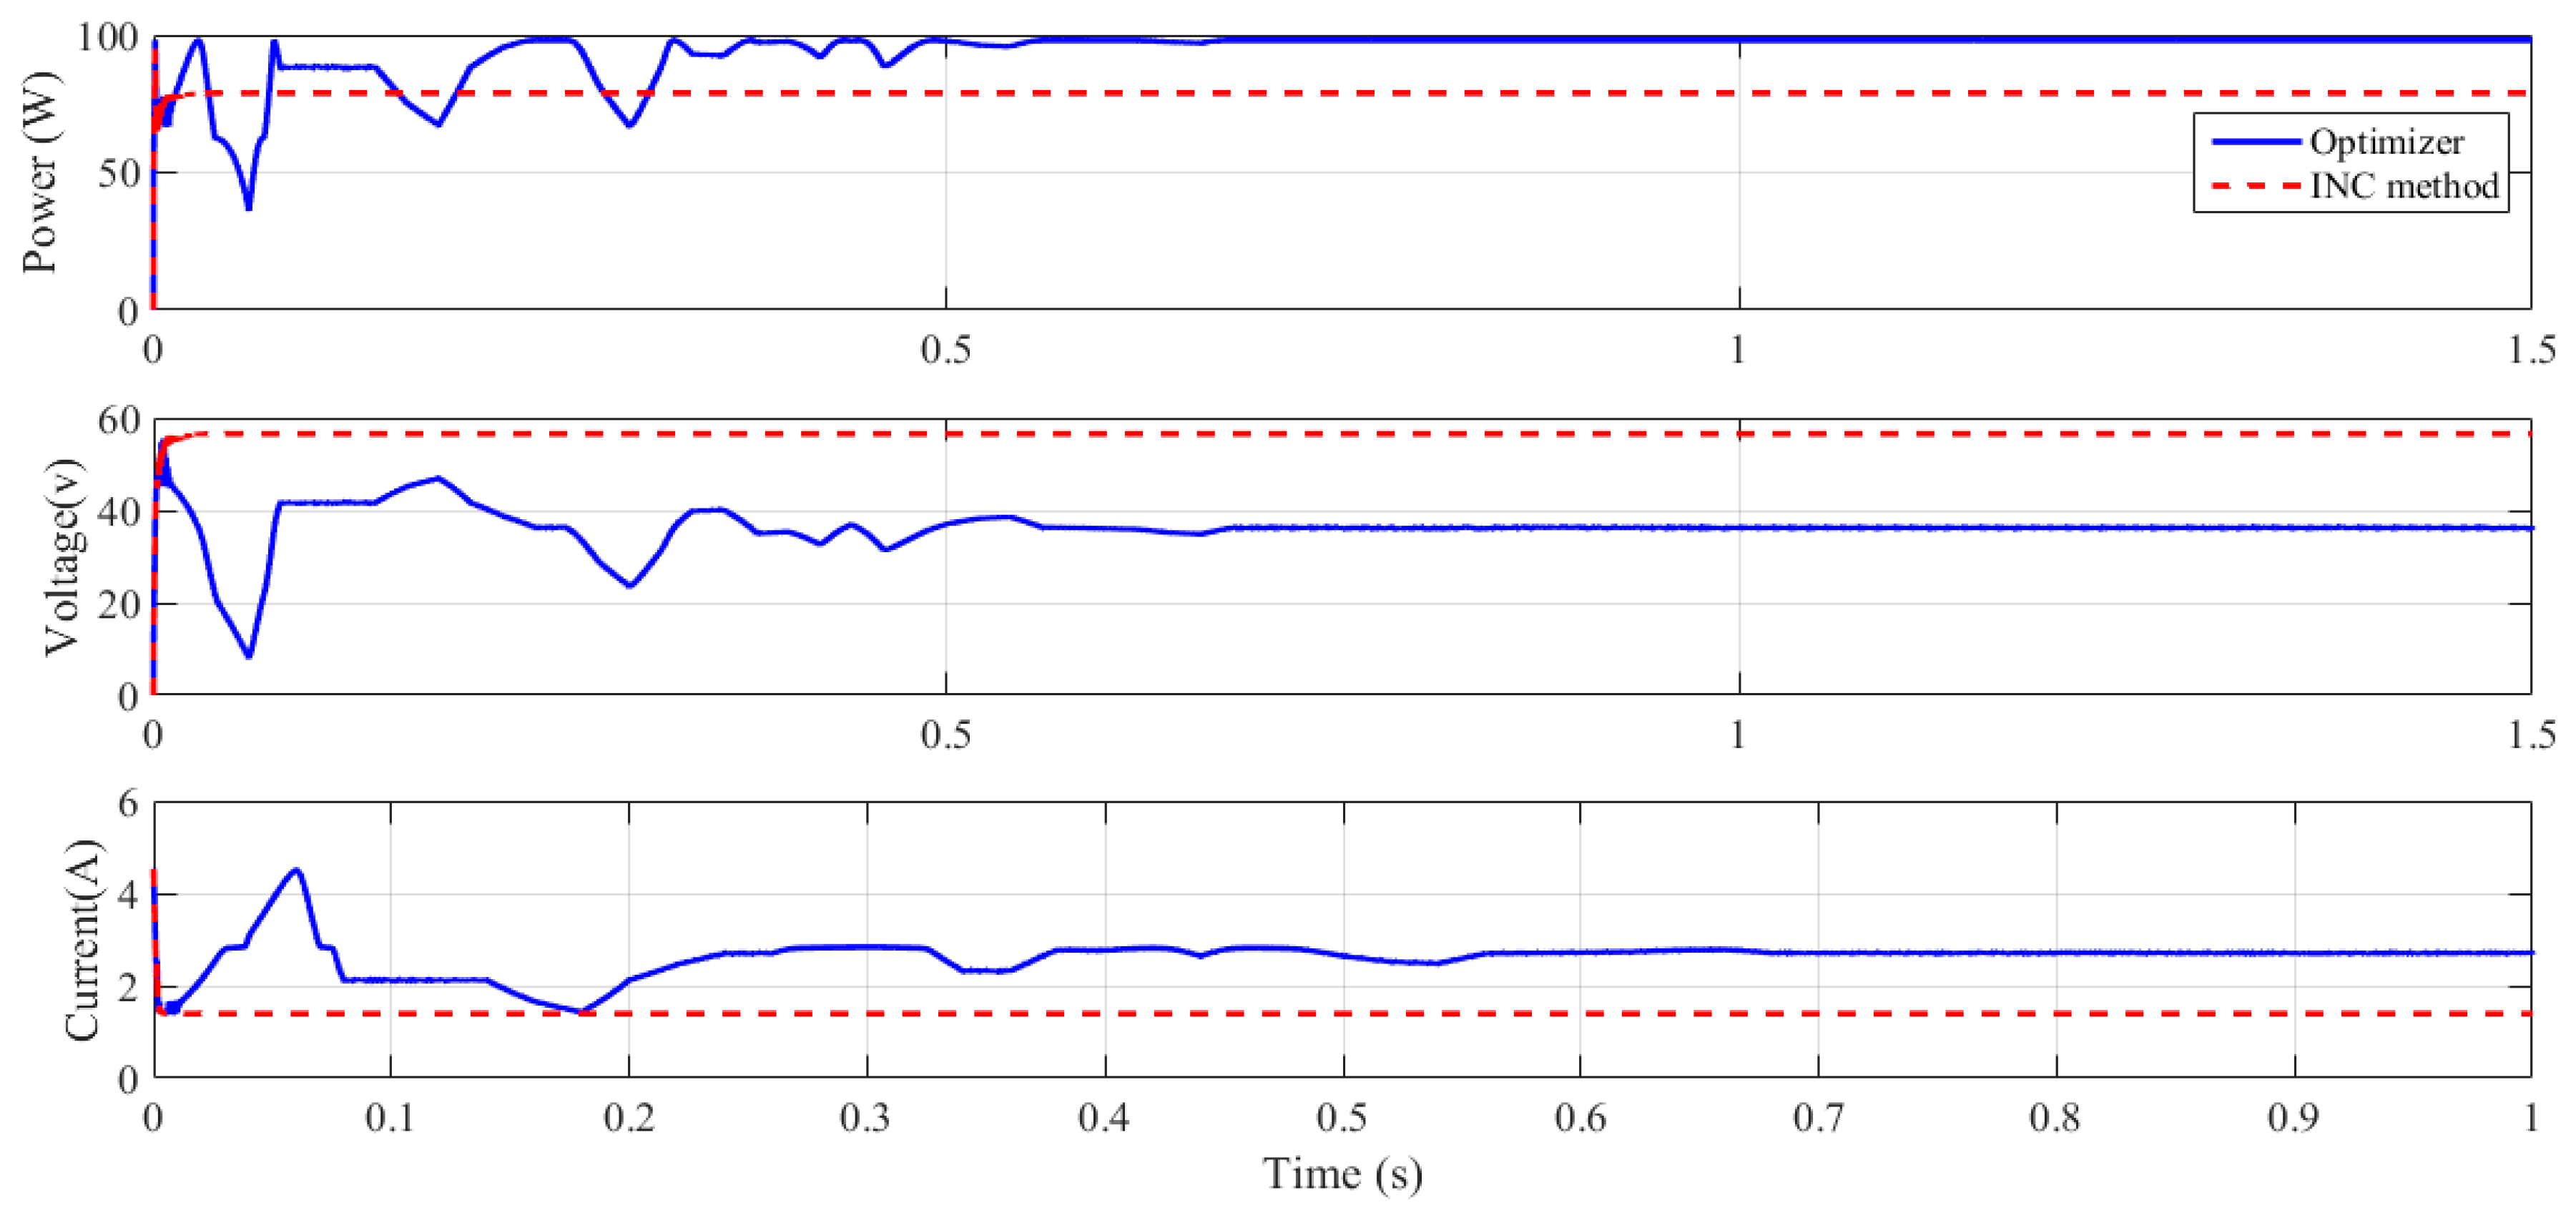
| #4 | Non-uniform | 800,500,300 | Ns = 6 Np = 12 | 36.21 | 2.71 | 98.11 |
© 2019 by the authors. Licensee MDPI, Basel, Switzerland. This article is an open access article distributed under the terms and conditions of the Creative Commons Attribution (CC BY) license (http://creativecommons.org/licenses/by/4.0/).
Share and Cite
Rezk, H.; Ali, Z.M.; Abdalla, O.; Younis, O.; Gomaa, M.R.; Hashim, M. Hybrid Moth-Flame Optimization Algorithm and Incremental Conductance for Tracking Maximum Power of Solar PV/Thermoelectric System under Different Conditions. Mathematics 2019, 7, 875. https://doi.org/10.3390/math7100875
Rezk H, Ali ZM, Abdalla O, Younis O, Gomaa MR, Hashim M. Hybrid Moth-Flame Optimization Algorithm and Incremental Conductance for Tracking Maximum Power of Solar PV/Thermoelectric System under Different Conditions. Mathematics. 2019; 7(10):875. https://doi.org/10.3390/math7100875
Chicago/Turabian StyleRezk, Hegazy, Ziad Mohammed Ali, Omer Abdalla, Obai Younis, Mohamed Ramadan Gomaa, and Mauia Hashim. 2019. "Hybrid Moth-Flame Optimization Algorithm and Incremental Conductance for Tracking Maximum Power of Solar PV/Thermoelectric System under Different Conditions" Mathematics 7, no. 10: 875. https://doi.org/10.3390/math7100875
APA StyleRezk, H., Ali, Z. M., Abdalla, O., Younis, O., Gomaa, M. R., & Hashim, M. (2019). Hybrid Moth-Flame Optimization Algorithm and Incremental Conductance for Tracking Maximum Power of Solar PV/Thermoelectric System under Different Conditions. Mathematics, 7(10), 875. https://doi.org/10.3390/math7100875