Article

Low-Carbon Transport for Prefabricated Buildings: Optimizing Capacitated Truck–Trailer Routing Problem with Time Windows

1
School of Economics and Management, Chang’an University, Xi’an 710064, China
2
Department of Civil and Environmental Engineering, The Hong Kong Polytechnic University, Hong Kong 999077, China
3
School of Transportation Engineering, Chang’an University, Xi’an 710064, China
*
Author to whom correspondence should be addressed.
Mathematics 2025, 13(7), 1210; https://doi.org/10.3390/math13071210
Submission received: 18 February 2025 / Revised: 29 March 2025 / Accepted: 5 April 2025 / Published: 7 April 2025

Abstract

:
The transportation of prefabricated components is challenged by the particularity of large cargo transport and urban road conditions, restrictions on parking, height, and weight. To address these challenges and to promote low-carbon logistics, this paper investigates the transportation of prefabricated components by leveraging separable fleets of trucks and trailers. Focusing on real-world constraints, this paper formulates the capacitated truck and trailer routing problem with time windows (CTTRPTW) incorporating carbon emissions, and designs a dynamic adaptive hybrid algorithm combining simulated annealing with tabu search (DASA-TS) to solve this model. The efficiency and robustness of the methodology are validated through two computational experiments. The results indicate that the DASA-TS consistently demonstrates excellent performance across all evaluations, with significant reductions in both transportation costs and carbon emissions costs for prefabricated components, particularly in large-scale computational instances. This study contributes to promoting the optimization of low-carbon transport for prefabricated components, offering guidance for routing design involving complex and large cargo, and supporting the sustainable development of urban logistics.

1. Introduction

The construction industry is a significant contributor to global carbon emissions. Prefabricated buildings are an emerging construction technique, some building components, such as staircases and balconies, can be manufactured in a prefabricated factory and then transported to the construction site for assembly [1,2]. Compared to traditional construction techniques, this construction technique can reduce construction costs and carbon emissions to promote the sustainable development of cities [3].
While many construction sites are located in urban areas, prefabricated component factories are typically situated in suburban regions. There are many restrictions for the transportation of prefabricated components on urban roads, such as restrictions of weight and height on some city roads. Furthermore, since many construction sites are located in cities with heavy traffic and limited parking spaces, driving a full-sized truck into these cities is very difficult [4,5]. Therefore, using trucks and trailers to deliver products is a more efficient solution compared with the traditional unibody truck.
As shown in Figure 1, the truck–trailer transportation mode involves the combination of a truck and a trailer. Both the truck and the trailer can carry components, but the trailer, being unpowered, must be attached to the truck. The truck can detach the trailer and operate independently or reconnect with the trailer to function as a complete vehicle. This transportation model can more flexibly respond to truck restrictions imposed by different roads and provide a more efficient method for transporting prefabricated components in urban areas. This routing problem is known as the truck and trailer routing problem (TTRP). The chief questions are to decide which trailers should be attached to which trucks, to determine the delivery sequence, and to optimize the overall route plan to meet multiple objectives [6].
Previous studies on the TTRP have mostly focused on minimizing costs, travel distances, and work times [6,7]. With the growing requirement of low-carbon logistics in society, reducing carbon emissions in transportation has garnered significant attention [8,9,10]. The truck–trailer transportation mode could reduce the impact of road restrictions on transport through reduced vehicle downtime, increased delivery flexibility, and improved efficiency [11]. These characteristics make it an effective approach for addressing low-carbon objectives in logistics. More reasonable transport load distribution and delivery sequencing can effectively reduce carbon emissions during the transportation process for distance and transportation time [12,13].
In addition, to ensure construction progress, minimize waiting time, and reduce storage costs, many construction sites implement time windows for the arrival of prefabricated components. Consequently, taking into account the delivery time windows and truck capacity, we formulated the problem as the capacitated truck–trailer routing problem with time windows (CTTRPTW). The complexity of the CTTRPTW is significantly higher than it is for traditional vehicle routing problems (VRPs) due to the truck and detachable trailer transportation modes, as well as the heterogeneity of customer demand and paths.
To efficiently solve this problem, we developed a dynamic adaptive hybrid algorithm (DASA-TS) that combines simulated annealing (SA) and tabu search (TS), referred to as the DASA-TS. This algorithm integrates the stochastic global search capability of SA with the local search efficiency of TS.
The contributions of this research are as follows.
Compared to existing studies [12,14], the CTTRPTW model proposed in this study explicitly considers the impact of vehicle loads on carbon emissions and the practical constraints of the timeliness of large cargo deliveries. These improvements help to more accurately reflect the real-world constraints in the transportation of prefabricated components and extend the research scope of the TTRP.
A customized heuristic algorithm has been developed to solve the CTTRPTW and to optimize the distribution order and movement path. Computation experiments prove the effectiveness and superiority of the proposed algorithm, and demonstrate its good performance in scenarios of different scales. The results indicate that the DASA-TS consistently demonstrates excellent performance across all evaluations, with significant reductions in both transportation costs and carbon emissions costs for prefabricated components, particularly in large-scale computational instances.
The remainder of this study is organized as follows. In Section 2, we provide a review of the relevant literature. Section 3 describes the CTTRPTW problem and the mathematical model in detail. Section 4 proposes the improved heuristic algorithm with a focus on its design improvements and optimization strategies. Section 5 provides a computational evaluation of the DASA-TS algorithm for two instances. Section 6 concludes the paper and discusses future research.

2. Literature Review

In this section, we focus on reviewing the literature on the TTRP of prefabricated components. After that, we provide an overview of the existing solution methods for the TTRP. Table 1 summarizes the studies most related to the TTRP, including the solution algorithm, constraints, and whether carbon emissions are considered in the research.

2.1. The Truck–Trailer Routing Problem for Prefabricated Components

Truck–trailer transportation involves a fleet of trucks and trailers serving a heterogeneous set of geographically dispersed customer locations. Trucks can operate as stand-alone vehicles or can be combined with trailers to form complete vehicles [21]. It is applicable in many transportation scenarios, including road transport [22], station yards [23,24], port docks, and multimodal transport [7,11,25].
Different from traditional VRPs, the complexity of the TTRP comes from the heterogeneity of truck and trailer combinations and customer requirements [4,26]. Gerdessen [27] pioneered the investigation into the optimal deployment of truck–trailer combinations, addressing challenges such as limited space and other site-specific restrictions at customer locations. Chao [15] first formally defined the TTRP. Since then, various studies have appeared to address the TTRP and its different variants. Hoff and Løkketangen [28] extended the TTRP to real-world scenarios using a Norwegian dairy plant as an example. Building on this, Lin et al. [29] proposed a relaxation of the TTRP, demonstrating that using more trailers and fewer trucks can lead to cost savings. Then, the generalized truck and trailer routing problem (GTTRP) proposed by Drexl [30] is important for extension of the TTRP variant. Following this, Lin et al. [4] further advanced the field by introducing time windows into the TTRP (TTRPTW). Belenguer et al. [31] presented the single truck with satellite depots, applying it to milk collection from farms. Following that, Parragh and Cordeau [32] provided the optimal solutions for benchmark instances of the TTRPTW, but with limited real-life applicability. To further enhance the model, Rothenbächer et al. [33] supplemented the existing model further by extending the TTRPTW by taking into account the number of visits and load transfer times.
In recent years, the growing awareness of environmental problems and the continued emphasis on sustainable development have greatly contributed to the growing attention to low-carbon logistics [34,35,36]. In particular, the carbon emission problem in the truck–trailer transportation of prefabricated components is the key direction of research. Studies such as [37,38,39,40,41] have confirmed that vehicle load is a primary factor influencing fuel consumption in transportation. Fuel consumption cost is the largest source of road freight transportation costs and carbon emissions; reducing carbon emissions by properly distributing loads and increasing loading rates is essential [42,43]. Although many studies in VRPs have incorporated carbon emissions into the analysis [44], research on the TTRP in the context of low-carbon logistics remains limited, with the exception of [12].
The distribution of prefabricated components is more complicated and challenging than general logistics, due to the large size, order-based production, fixed delivery routes, and high transportation frequency, all of which significantly impact project costs, time, and scheduling [45]. The transportation of prefabricated components adopts the truck–trailer transportation mode, which can improve transportation efficiency and achieve more flexible and efficient logistics distribution through the flexible separation of trucks and trailers [46]. For prefabricated buildings, on-time delivery of prefabricated components is crucial, it will affect construction progress and costs [47]. Based on the requirements for delivery time, common time window constraints can be further divided into soft time windows and hard time windows [48,49,50]. Soft time windows are particularly suitable for the transportation of large cargo, such as prefabricated components, which are typically made to order and possess high value [51]. However, most studies on the transportation of prefabricated components focus on delivery timeliness and transportation planning, the impact of time windows on the transportation of prefabricated components is not considered [52,53,54,55].
In conclusion, there is limited research on the TTRP for prefabricated component transportation. Unlike traditional models, the proposed CTTRPTW includes load constraints and time window constraints that further translate carbon emissions into costs, as summarized in Table 1. By combining these factors, the proposed CTTRPTW model provides a more practical and applicable framework, which is essential for realistic large-scale cargo transportation, and overcoming the limitations of the existing studies.

2.2. Existing Solution Methods for the TTRP

Regarding the VRP, the solution algorithm for routing problems can be divided into exact algorithms and heuristic algorithms [56,57,58,59]. For exact algorithms, Drexl [30] designed a branch-and-price algorithm for the generalized TTRP, while Parragh and Cordeau [32] developed a branch-and-price algorithm for the TTRPTW. Based on this, Rothenbächer et al. [33] designed a new branch-and-price-and-cut algorithm to solve the TTRPTW. On the other hand, heuristic algorithms are faster and can find approximate solutions when classical methods are inefficient. For example, Tan et al. [15] proposed a hybrid multi-objective evolutionary algorithm for the TTRP to find the Pareto optimal solution. Lin et al. [60] devised the SA algorithm for the TTRP, which yielded eleven new best solutions. Derigs et al. [61] combined local search and large neighborhood search for the Rollon–Rolloff vehicle routing problem.
However, for such NP-hard problems, existing heuristic algorithms, such as the genetic algorithm [62], simulated annealing [63], and particle swarm optimization [64], often have limitations for solving routing problems [65]. This makes it inefficient to solve a problem using general heuristic algorithms, as these algorithms need to be combined or improved to obtain an efficient solution. Based on a review of the existing literature, Table 1 lists the solution methods, constraints and whether carbon emissions in the models.
However, most current studies on the TTRP expansion focus on a single factor, often ignoring the impact of key factors such as vehicle load, customer satisfaction cost, and carbon emissions on cost or transportation distance. A more detailed summary is provided in Table 1. To the best of our knowledge, there are no studies devoted to the CTTRPTW. A comprehensive consideration of these factors is essential to better reflect real-world transportation scenarios and provide more sustainable and practical solutions. To fill this gap, this paper develops the CTTRPTW model and introduces the DASA-TS algorithm, aiming to advance the modeling and optimization of the TTRP.

3. Problem Description and Model Formulation

This section introduces and analyzes the CTTRPTW in prefabricated components logistics. Notations of the variables and parameters used in the model are illustrated in Table 2.

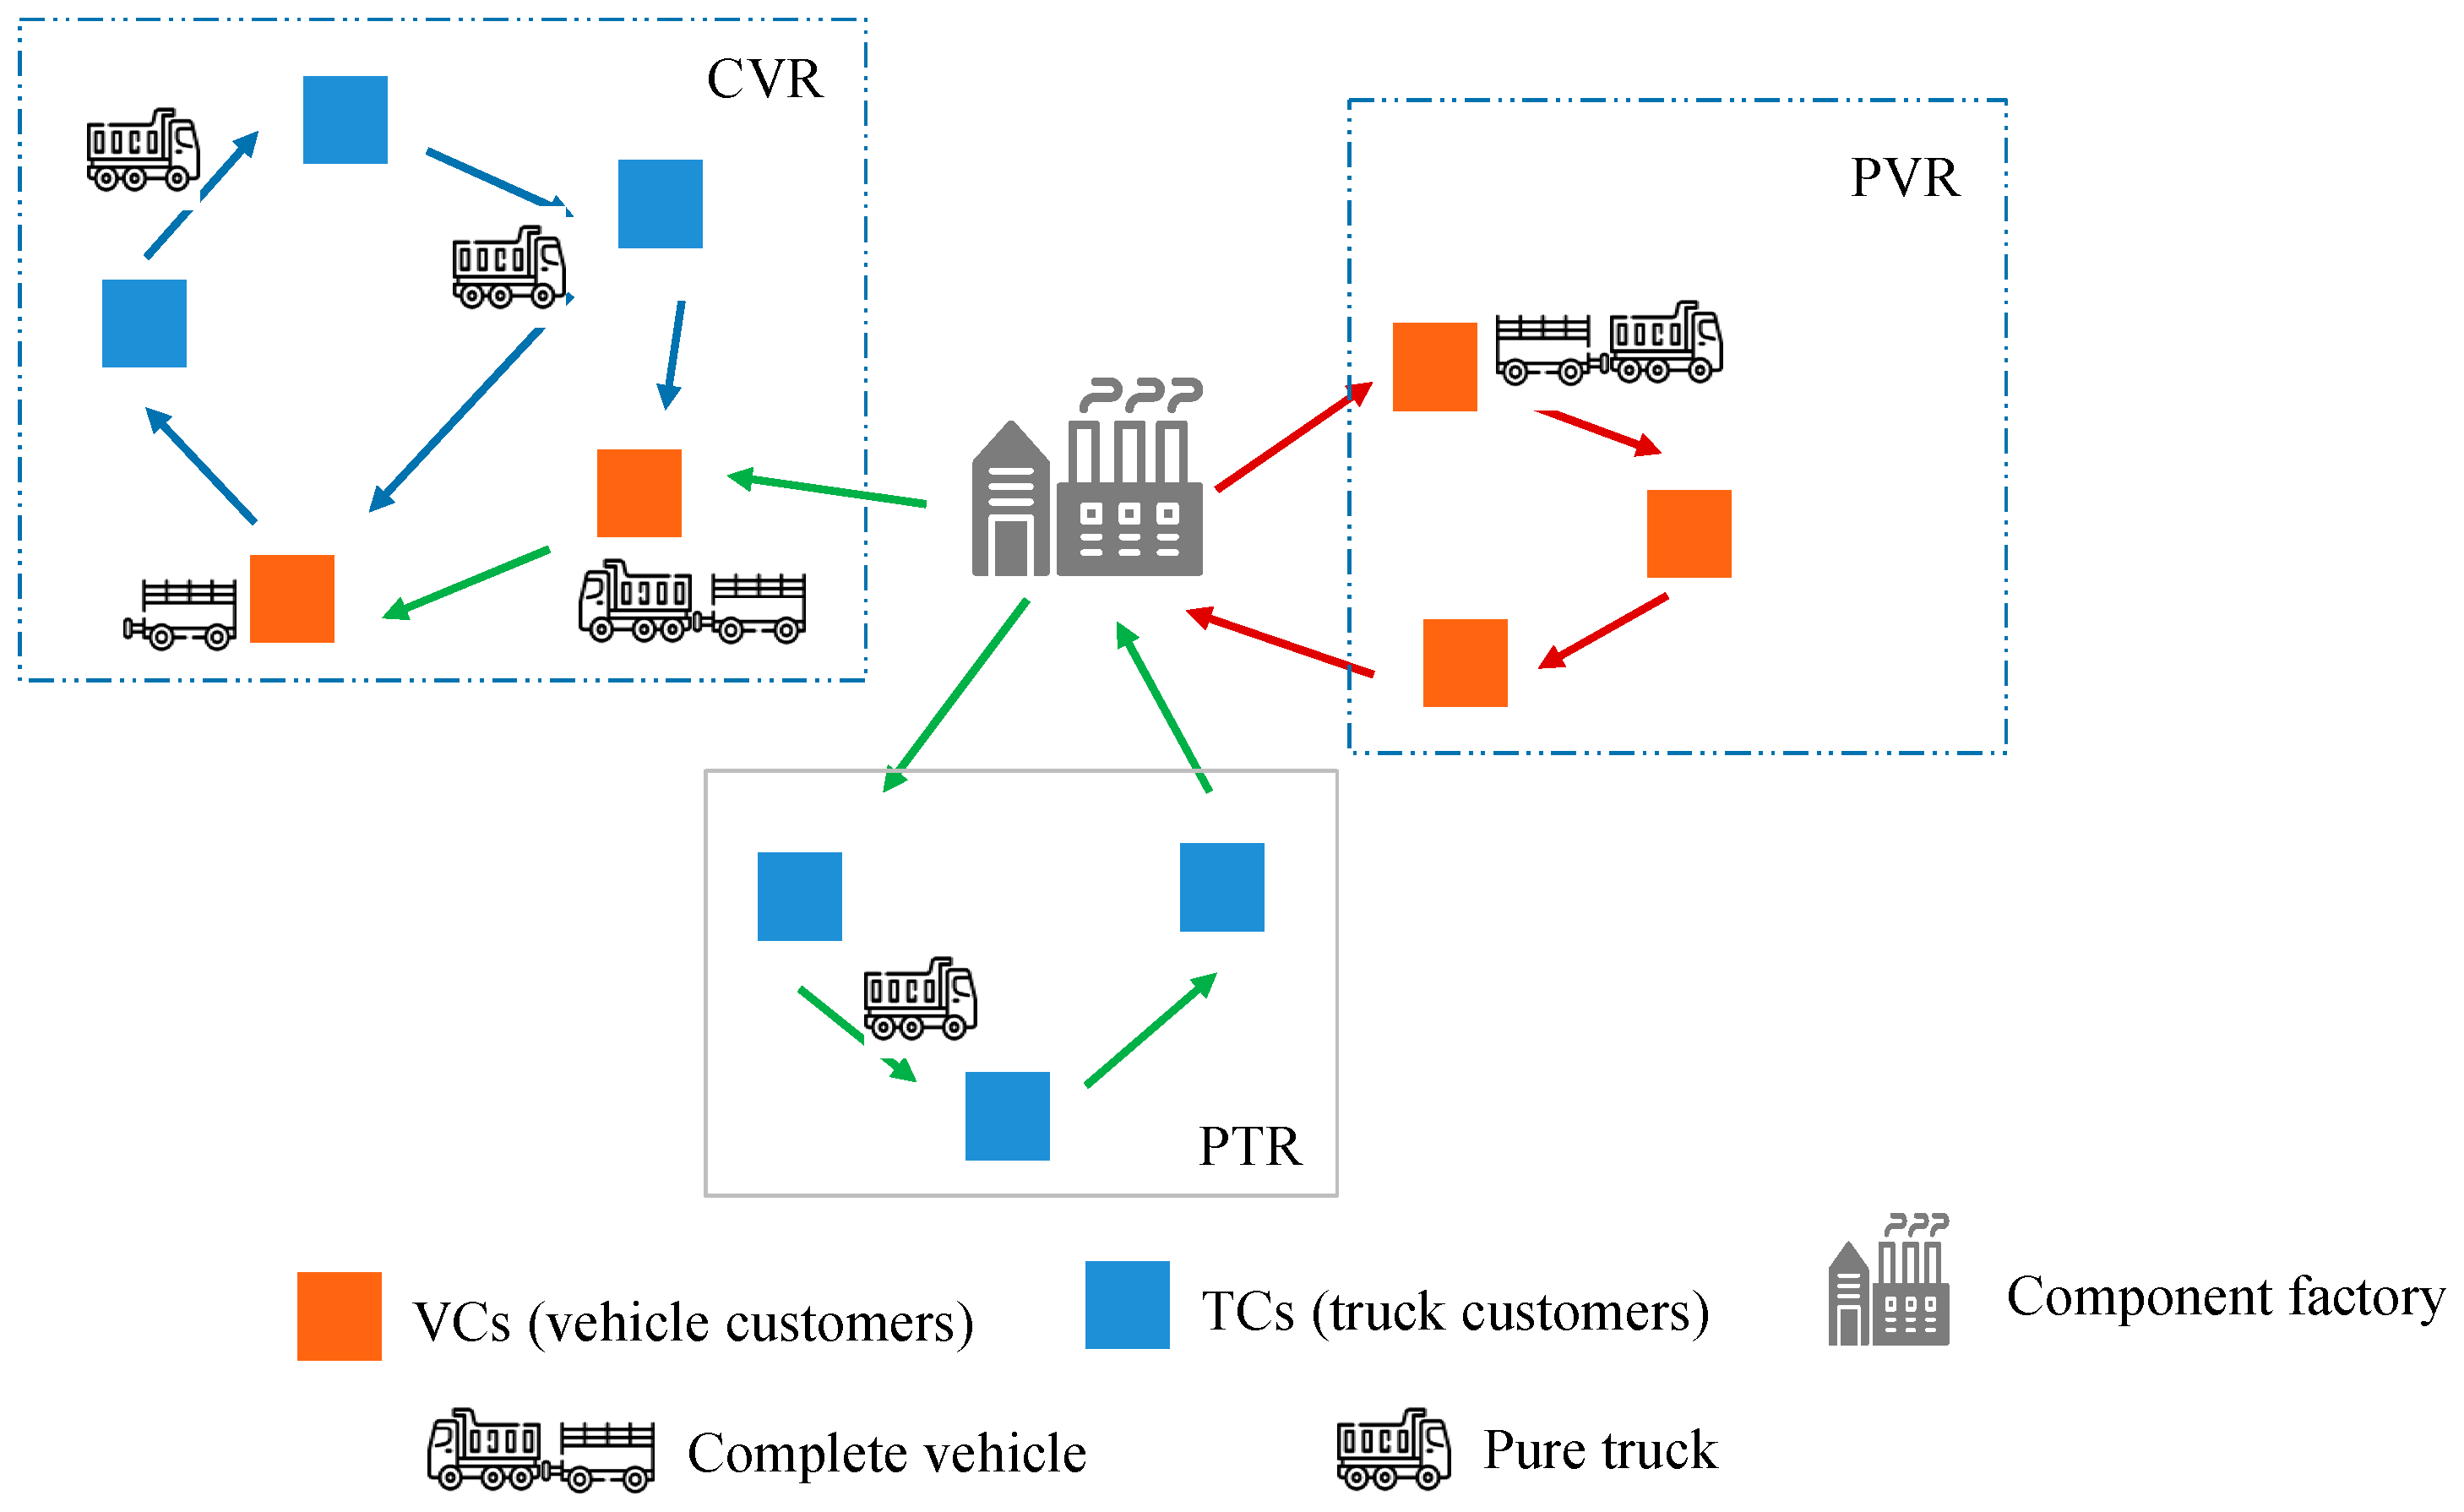
3.1. Problem Description

Prefabricated component factories supply prefabricated components to construction sites dispersed throughout the city, all while adhering to strict time window restrictions. This task is carried out by a fleet of limited, homogeneous trucks and trailers. There are two types of nodes in the model: component factories and demand points. Due to some restrictions of the load and height for vehicle transportation and limited parking areas in urban areas, this research divides the demand points into two categories: vehicle customers (VCs) and truck customers (TCs). Vehicle customers refer to the demand points that only can be delivered by complete vehicles. Truck customers refer to demand points that only can be serviced by separate trucks. Transportation routes can be classified into three categories: (a) pure vehicle routes (PVR), serviced demand points only by VCs; (b) complete vehicle routes (CVR), serviced demand points contain VCs and TCs; (c) pure truck routes (PTR), serviced demand points only contain TCs. We show an example to illustrate how the truck and trailer works. During the optimization process, these route classifications are dynamically determined in the optimization model based on defined constraints and decision variables. The optimization process ensures that each demand point is assigned to the most appropriate mode of transport, taking into account cost, load capacity, and customer satisfaction.
As shown in Figure 2, a fleet of vehicles departs from the prefabricated component factory and selects the appropriate vehicles for transportation based on the type of customer. Depending on the next demand point type, a decision is made whether to unload the trailer. If the next demand point is a TC, the trailer is unloaded, and the truck continues the task. If there is no subsequent assignment and an unloaded trailer is available at a construction site, or if the next demand point is a VC, the truck reconnects with the trailer and either proceeds to the next demand point or returns to the prefabricated component factory. Ultimately, this ensures that all empty trailers are retrieved and returned to the prefabricated component factory.
In this section, we formulate the CTTRPTW as a mixed integer program based on the above problem statement. The transportation routes can be defined by a directed graph, let G = N ,   E   with N = 0 , 1 , , n   as the node set, while E = i , j : i , j N   a n d   i j as the set of arcs connecting nodes. The distance between i   and j is represented by d i j . The complete vehicle is composed of a truck (K; or set of trucks, k K ) and trailer (R; or set of trailers, r R ). The truck and trailer are loaded with prefabricated components from the prefabricated component factory (P; or set of prefabricated component factories,   p P ) to the construction site (S; or set of construction sites, s   S). Relevant parameters are shown in Table 2.

3.2. The Mathematical Formulation for the CTTRPTW

The CTTRPTW model discussed in this paper is an extension of the TTRP model proposed by [4]. The objective is to minimize the total costs, which comprise four main components. Building upon the foundational research of [18,43,66], this study incorporates a comprehensive set of cost factors, including fixed costs ( C F C ), fuel consumption costs ( C F U ), carbon emissions costs ( C E C ), and customer satisfaction with soft time windows ( C T W ).

3.2.1. Fixed Costs

The fixed costs include the departure costs ( C D C ) and labor costs ( C L C ). Once the transportation task is started, the corresponding departure costs will be incurred based on the number of departures. The fixed cost calculation is as follows:
C F C = C D C + C L C
C D C = k K z k ξ
The labor salary is made up of a base salary and a bonus based on the number of deliveries. Although the wages of drivers in freight companies are also related to aspects such as fixed trip allowances and total mileage travelled, the transport discussed in this paper does not involve long-distance haulage, so these influences are not taken into account. The total labor costs are given as follows:
C L C = γ b k K z k + γ q j N q j

3.2.2. Fuel Consumption Costs

The cost of transportation includes the consumption of fuel during the operation of the vehicle [66]. Due to the high weight of the prefabricated components, this paper considers the effect of load on fuel consumption and calculates fuel consumption using the load fuel consumption model (LFCM) used in most studies [66,67,68,69]:
ρ i j k = ρ r 0 + ρ r * ρ r 0 Q r q i j k x i j k t + ρ 0 + ρ * ρ 0 Q q i j k 1 x i j k t
C F U = i , j , k φ c ρ i j k d i j

3.2.3. Carbon Emissions Costs

Carbon emissions costs refer to the carbon dioxide generated by the consumption of fuel during the delivery of the prefabricated components. The correlation between vehicle carbon emissions and fuel consumption is generally positive. In this study, referring to the method in [9,66], the carbon emissions costs generated by loading and unloading are not considered; only the carbon emissions costs generated during transportation are considered.
C E C = i j , k ϑ c σ ρ i j k d i j

3.2.4. Customer Satisfaction with Soft Time Windows

To ensure that construction proceeds on schedule, prefabricated components must arrive at the construction site within the specified time window. This paper quantifies the degree of dissatisfaction of the construction party by establishing a time satisfaction function   F ( t k s ) , and then determines the customer satisfaction costs with soft time windows.
F t k s = 1 1 + T 1 s t k s 2   , t k s < T 1 s 1 , T 1 s t k s T 2 s 0 , t k s > T 2 s
When the transport vehicle arrives earlier than the endurable earliness time   T 1 , it may occupy the construction site and cause inconvenience, making the construction unit feel a certain degree of dissatisfaction. When arriving at the construction site later than the endurable lateness time T 2 , waiting costs will be incurred, the progress of the construction project will be affected, and the construction unit will be dissatisfied to a certain extent. To address these time constraints, a time satisfaction function is formulated based on the construction site’s scheduling requirements:
Furthermore, the customer satisfaction costs with soft time windows can be expressed as follows:
C T W = s S k K C T W k s
where
C T W k s = ϕ 1 F ( t k s ) = ϕ T 1 s t k s 2 1 + T 1 s t k s 2 , t k s < T 1 s 0 , T 1 t k s T 2 s ϕ , t k s > T 2 s
Here, T 1 s   a n d   T 2 s denote the earliest and latest acceptable arrival times for construction site s, respectively. The arrival time t k s is equal to the truck’s departure time plus its travel time to construction site s.
In summary, the CTTRPTW model aims to minimize the comprehensive total costs. The decision variables are presented below.
The objective function and constraints are as follows:
M i n C = C FC + C FU + C EC + C TW
subject to the following:
q i j k ( 1 x i j k t ) Q + x i j k t Q r ,           i , j N ,   k K
j N f j i j N f i j = d i   ,             i N
j i y j i k = j i y i j k   ,             k K , i N
x i j k t y i j k   ,             i , j N ,   k K
q j i N y i j k ,             i N ,   k K
k K q i j k = f i j ,           i , j N
Constraint (11) ensures that the load q i j k transported by truck k along arc (i,j) does not exceed the rated capacity, depending on whether a trailer is attached. Constraint (12) ensures that all the customers’ needs can be satisfied. Constraint (13) ensures that, for each truck, the number of arcs entering a node equals the number of arcs in the exiting node, maintaining truck continuity throughout the route. Constraint (14) ensures that truck k hauls a trailer only if it travels along arc (i,j). Constraint (15) ensures that node j is considered as served if any truck k travels to it. Constraint (16) defines the total amount of goods transported along arc (i,j) as the sum of the loads carried by all trucks on that arc.

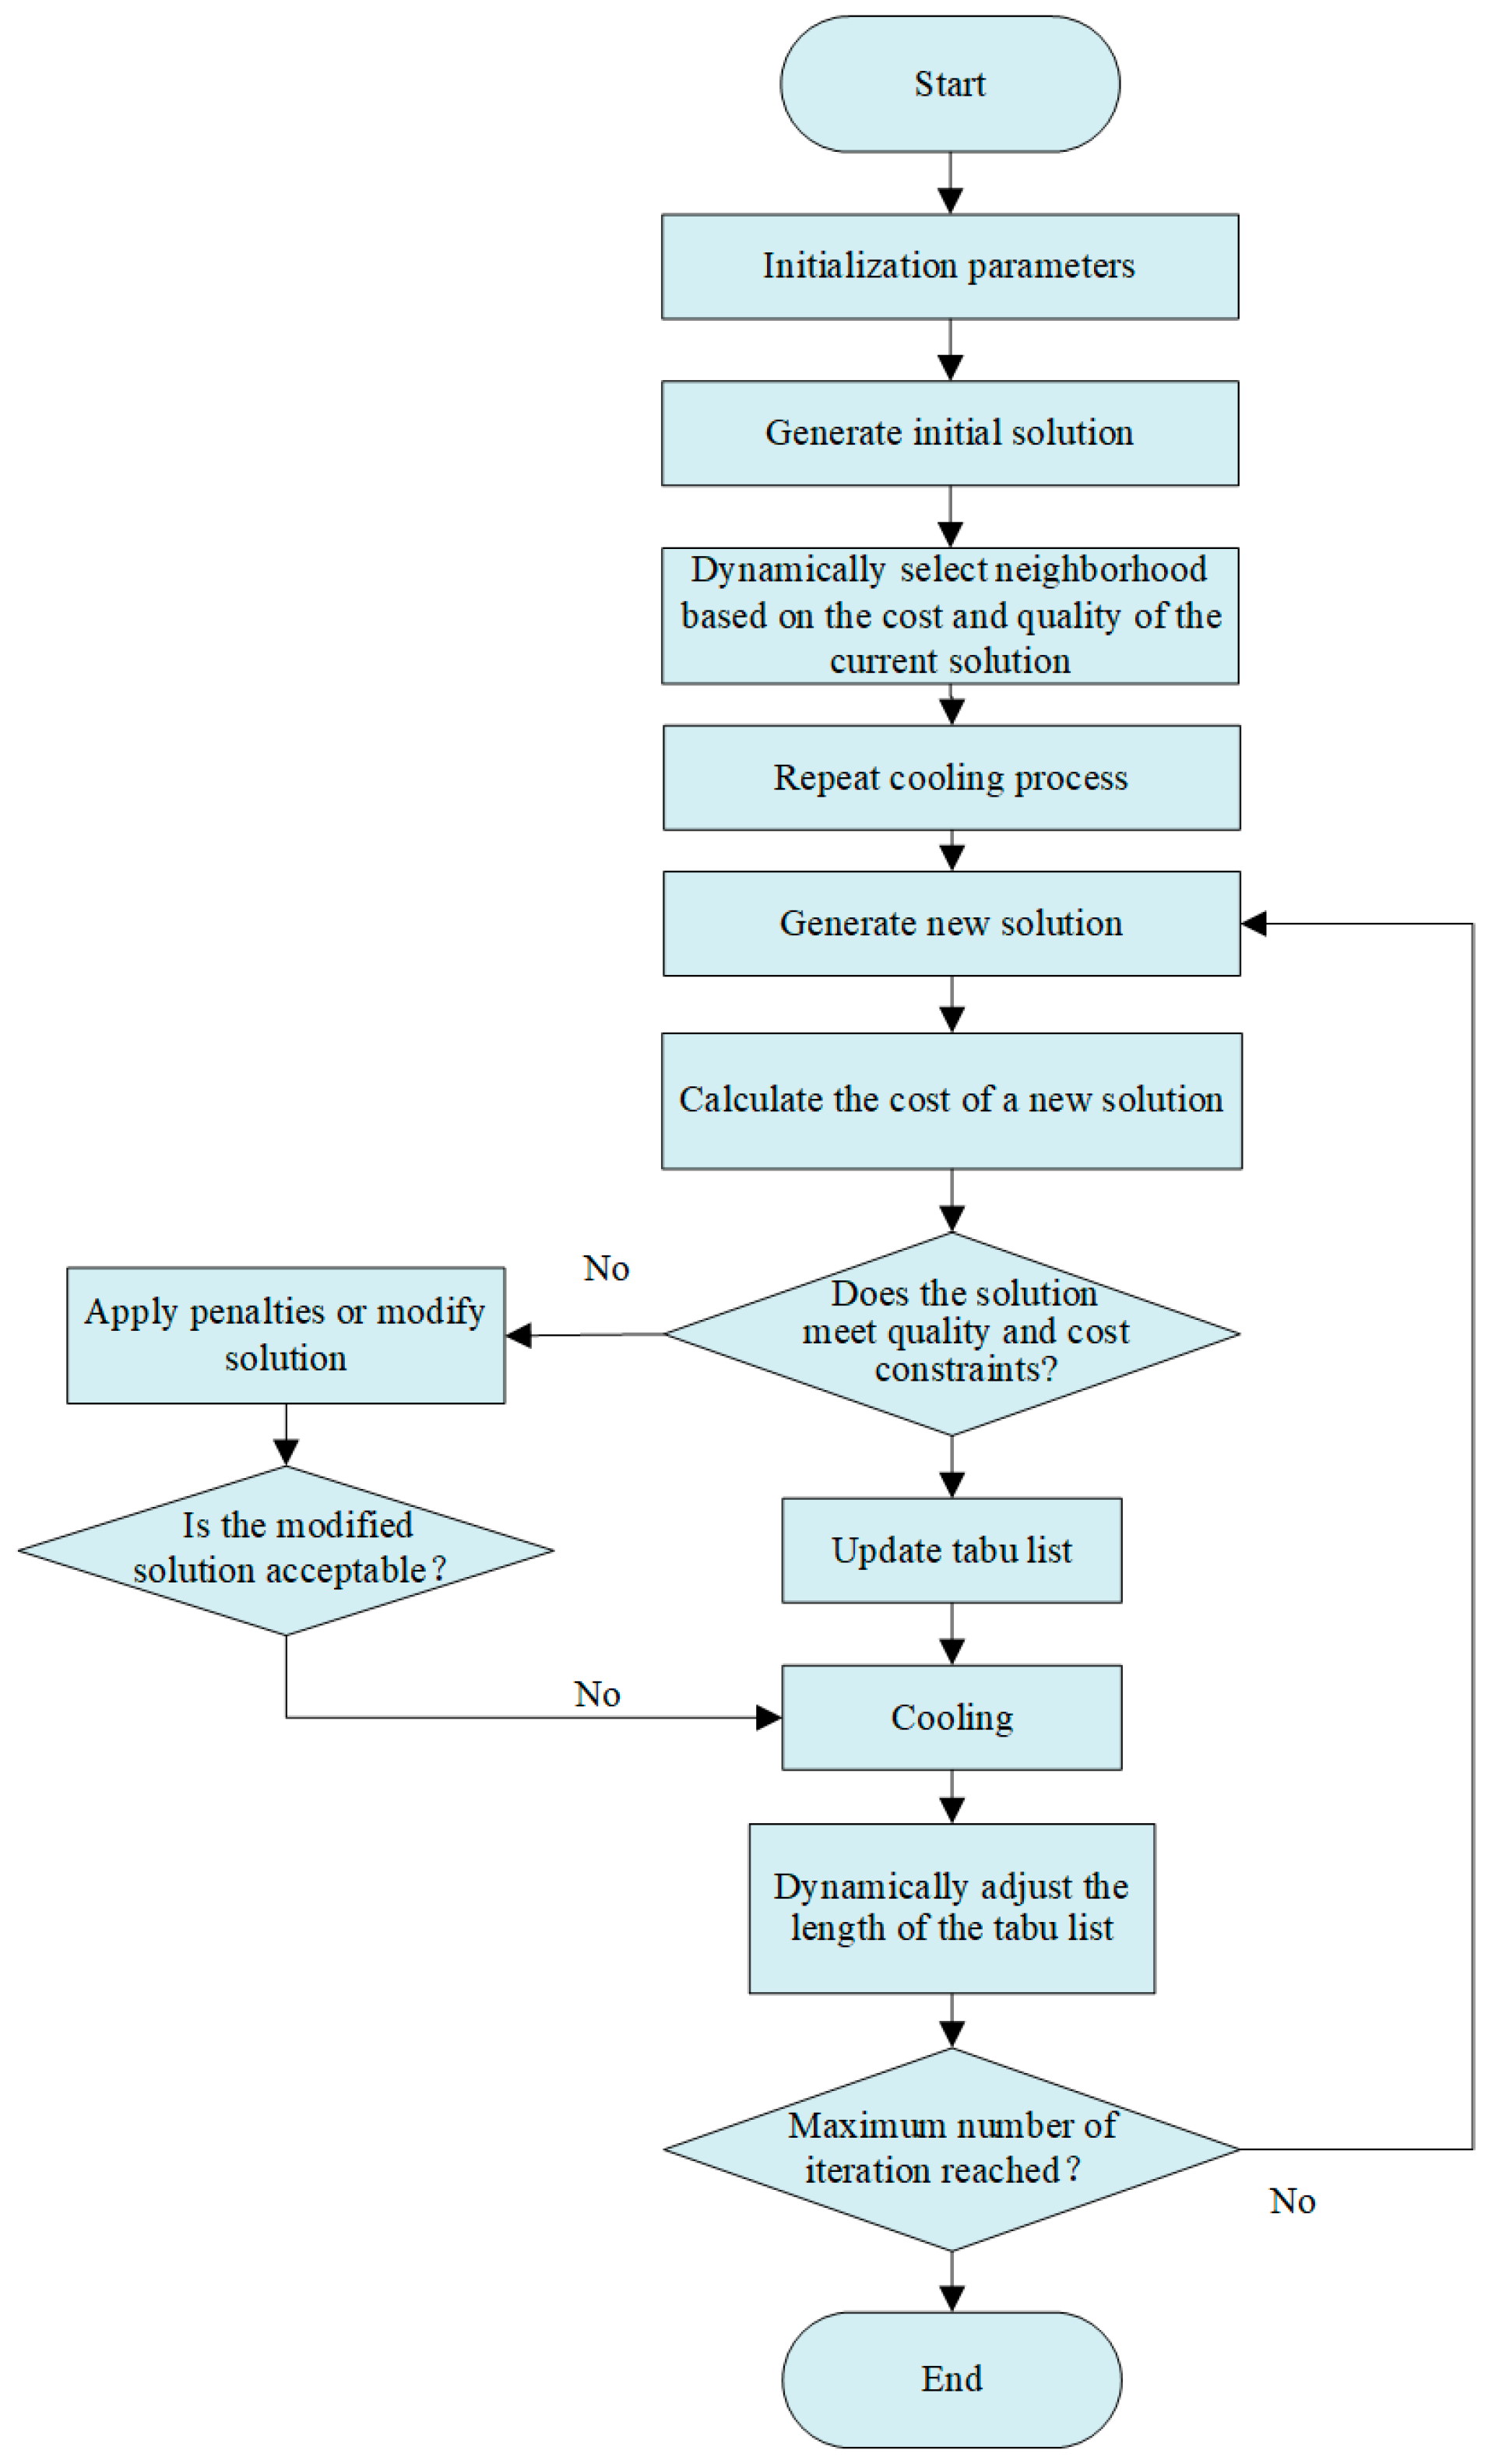
4. Solution Algorithm

The CTTRPTW is an NP-hard problem, with the number of decision variables growing exponentially with the number of demand points and the size of the truck fleet. In addition, the problem contains vehicle load constraints and time windows, which greatly increase the computational complexity. These factors make it challenging to obtain the optimal solution within a reasonable time frame using traditional commercial solvers.
To address these challenges, this study develops a hybrid algorithm that combines two heuristic algorithms, SA and TS, and introduces a dynamic neighborhood selection strategy, which makes it possible to adapt more flexibly to different situations in path planning problems. SA is also widely used to solve optimization problems, where random numbers are used to generate probabilities during iterations to determine the neighborhood in which the optimal solution is explored [70]. Despite its broad applicability, a substantial number of iterations is required to ensure the attainment of high-quality solutions. TS is an extension of local search algorithm, which is a global step-by-step optimal global neighborhood search algorithm. It has been effectively utilized in addressing various combinatorial optimization challenges [28]. In the latter stages of the search process, heightened randomness may emerge, leading to indistinct search directions or diminished objective function values. However, TS may experience randomness due to the lack of an effective control mechanism, which can hinder its convergence to the optimal solution. The combination of these two methods can strike a balance between global exploration and local exploitation, thereby improving the quality and efficiency of the solution process.
Based on the existing study, we designed the DASA-TS algorithm using a dynamic neighborhood structure. It allows solutions to be explored in a larger search space by introducing a dynamic neighborhood structure and adaptive parameters. By randomly selecting different types of moves, such as swap nodes, change path, and double bridge move, the algorithm is able to search more comprehensively for possible solutions. With its strong adaptability and flexibility, it is capable of solving a wide range of complex combinatorial optimization problems. The flowchart of this algorithm is shown in Figure 3.
The proposed DASA-TS can be divided into two steps: initial path construction and path improvement. Firstly, the initial solution generation relies on a random assignment strategy. It begins by randomly selecting nodes and allocating them to various paths. Subsequently, it determines whether each node will be transported by transit truck or complete vehicle and selects the corresponding path type based on the node and task types. This approach ensures a certain degree of diversity and randomness in the initial solution while considering the characteristics and constraints of the problem, thereby enhancing the practicality and feasibility of the generated solution. The second stage integrates SA and TS to improve the initial solution. SA is first used to explore the global search space, allowing the algorithm to accept suboptimal solutions at higher temperatures to avoid local minimization. As the temperature decreases, the algorithm gradually focuses on more promising regions of the search space. TS is applied to enhance the search within these regions, leveraging tabu lists to prevent cycling and to promote the exploration of new solutions. The entire process continues to iterate until the specified number of iterations or convergence conditions are reached to ensure reasonable utilization of resources.
Notably, we include the carbon emissions costs as part of the objective function and select the neighborhood structure based on both the total costs and the carbon emissions costs via the dynamic neighborhood selection function. By combining SA’s global exploration with TS’s local refinement strength, the algorithm enhances its potential to discover globally optimal solutions by effectively navigating the complex solution space.

5. Computational Experiments

5.1. Description of the Test Instances

To evaluate the performance of the proposed DASA-TS algorithm for the formulated CTTRPTW, we derived two sets of benchmark instances from the literature, including the TTRPTW benchmark problem and Solomon’s benchmark problem [4,71].
The standard test set of the TTRPTW, proposed by [3], contains 25 heterogeneous customers with time windows. The second is the Solomon set, which contains 12 instances with up to 100 heterogeneous customers with time windows. The time windows of these test sets are not fixed. For each Solomon instance, two scenarios are considered: one where the number of TCs is greater than the number of VCs, and another where it is less. Table 3 and Table 4 provide the detailed information of the above two test sets.
In vehicle service type configuration, the service vehicle type is designated as either 0 or 1. If a VC is serviced by a complete vehicle, its service vehicle type is labeled as 1; otherwise, it is set to 0. This classification ensures clarity in service type configuration with the logical and normative requirements of a research paper.
The Solomon test set includes instances with 50 and 100 customers. They contain problem instances of varying sizes and complexity, covering a variety of situations and constraints, as listed in Table 4.
For each RC instance, two instances were obtained by designating 25% and 40% of the customers as truck customers and the remaining ones as vehicle customers. All numerical experiments are coded in Python and tested on a PC with an Intel(R) Core (TM) 2.42 GHz processor and 16 GB memory using Windows 11. To evaluate the performance of the proposed DASA-TS algorithm, we conducted a comparative analysis using the CPLEX solver. To ensure a fair and unbiased comparison, both methods utilized the same initial solution generation strategy. The experimental results were obtained by running each data set 10 times and taking the average value.

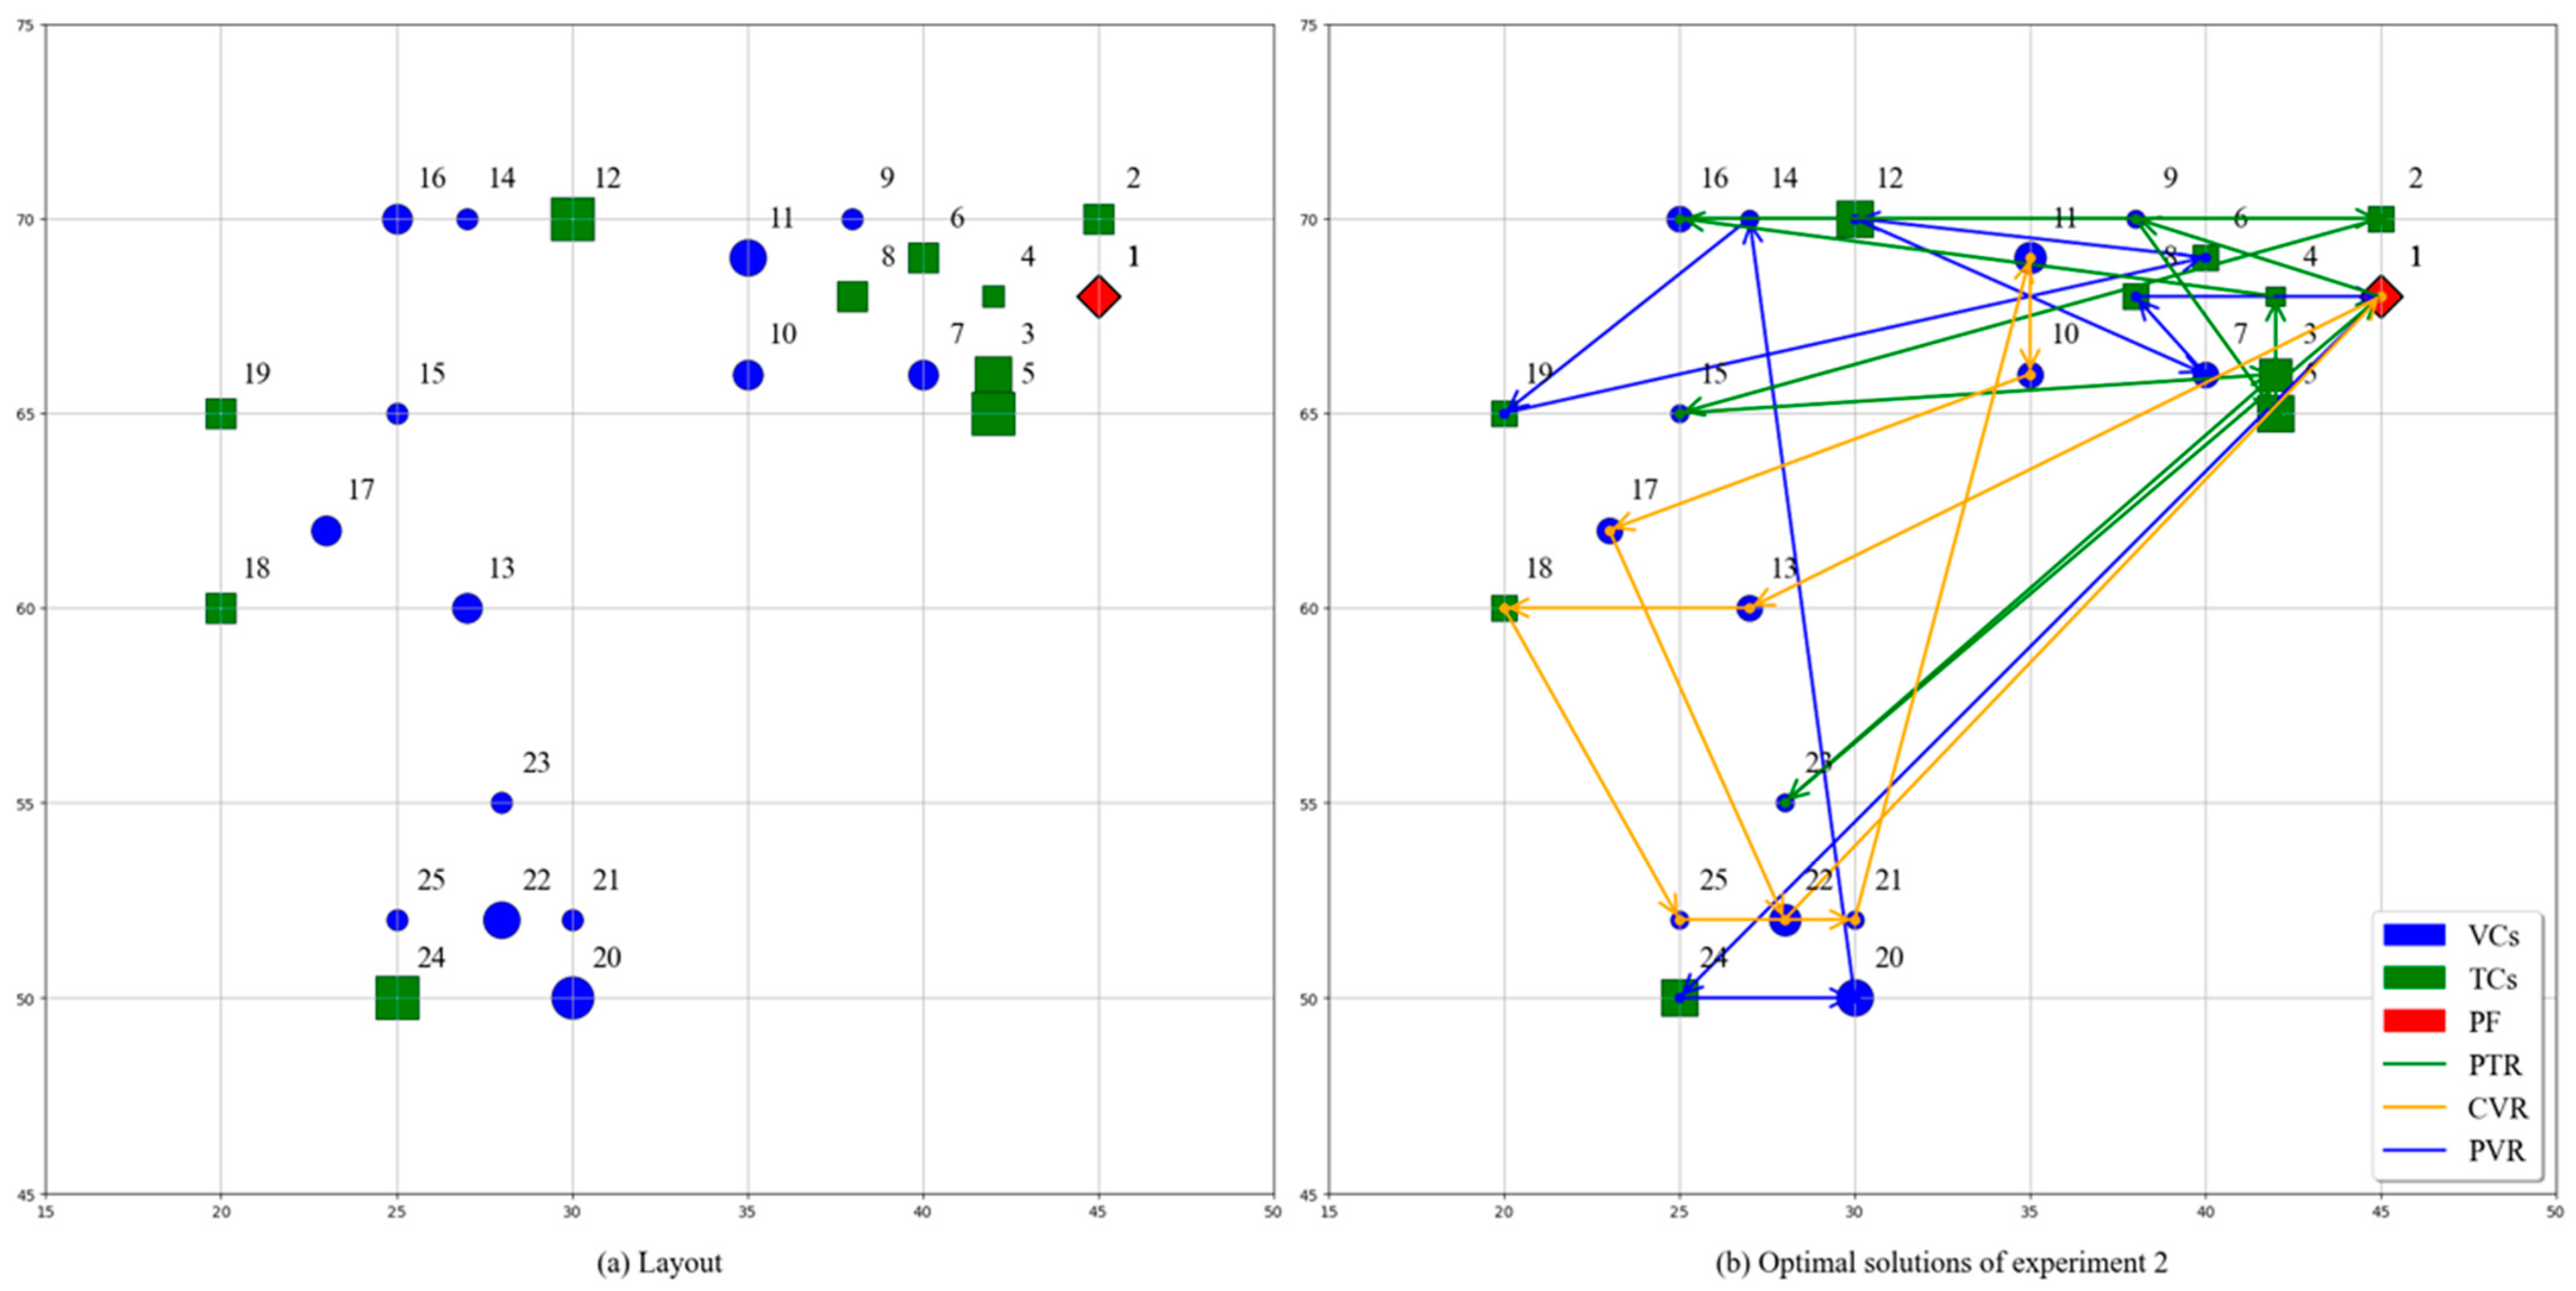
5.2. Computational Results and Discussion

Parameter selection can significantly influence the quality of computational results. Therefore, after extensive tests and thorough reference to the relevant literature [67,72,73], the key parameters for the DASA-TS algorithm in this study were determined as follows: number of iterations per temperature N = 300; number of temperature reduction iterations T = 5; cooling rate a = 0.965; temperature t0 = 1500; tabu length = 20.
In the Lin set, we evaluated the standard TTRPTW test using SA, TS, and the proposed DASA-TS to validate the effectiveness of the proposed approach. The results are summarized in Table 5, which presents the aggregated results. The analysis indicates that the DASA-TS outperforms the independent application of SA and TS, both in solution quality and computational time. While the total costs produced by the DASA-TS are only 0.27% higher than those of the CPLEX solver, the DASA-TS achieves a remarkable 2.91% reduction in carbon emissions costs. Results from conducted studies confirm that the DASA-TS consistently delivers high-quality solutions to the CTTRPTW within a reasonable computational time. Relative to the CPLEX solver, the DASA-TS provides a viable and cost-effective alternative.
Figure 4 presents the optimization results obtained from one of the test scenarios. In Figure 4a, blue circles and green squares denote the 25 heterogeneous demand points, with each node’s size proportional to its corresponding demand. Additionally, prefabricated component factory is indicated by the red diamonds. As depicted, different colored lines represent different paths and the arrow points to the delivery route, which shows the service sequence in Figure 4b.
In the next experiment, we selected RC101 and RC201 in Solomon’s set for analysis, and set up two scenarios, with the number of TCs being greater than the number of VCs in one scenario, and the number of TCs being less than the number of VCs in the other scenario, in order to better reflect the different distribution scenarios in the real world. Through further analysis of the experimental results, as shown in Table 6, the following conclusions can be obtained.
Test 1 is a small-scale test instance involving 25 demand points. The results show that the total costs decrease by an average of 0.46%, with a reduction in the carbon emissions costs (0.621%) being slightly more pronounced than the overall costs reduction. The findings indicate that the DASA-TS algorithm consistently produces total cost solutions that are comparable to, or lower than, those obtained using the CPLEX solver. Overall, the algorithm effectively reduces both transportation costs and carbon emissions costs in small-scale instances.
In Tests 2 and 3, this trend is further confirmed, especially when dealing with larger-scale problems. Test 2 contains 50 demand points. In Case 5, where the number of VCs is greater than the number of TCs, our proposed algorithm shows excellent superiority, resulting in a decrease in total costs of 3.05%. In Test 3, which has 100 demand points, the reduction rates of total costs and carbon emissions costs are both greater than 3.3%, especially in Case 12, reaching 6.78% and 4.79%.
In terms of solution time, the CPLEX solver demonstrates extremely fast performance on small-scale instances, below 0.01 s in almost all cases. However, as the problem size increases, the solution time of the CPLEX solver increases significantly, especially in Case 3, where the solution time reaches more than 10 s. By contrast, the DASA-TS shows a more stable solution time in all tests. Its solution time remains low even on larger problems, showing its potential advantage when dealing with large-scale problems.
In general, the DASA-TS exhibits significant advantages in complex optimization problems due to its cost optimization, stability of solution time, and high adaptability to problems of different scales. These features make the DASA-TS suitable for problems of all sizes, particularly in solving large-scale CTTRPTW problems.
Figure 5 illustrates the reduction rates of total costs and carbon emissions costs of different project sizes (small, medium, and large) under different scenarios (RC101, RC201). Scenarios are further differentiated by color, with blue indicating the total cost reduction rate and gray indicating the carbon emissions cost reduction rate. The proposed algorithm shows greater effectiveness in larger scale environments, possibly due to economies of scale and improved resource allocation.
The findings show that the methodology proposed in this paper is not only suitable for efficiently solving the CTTRPTW problem, but meets the applicability criteria for real-world problem solving. While this observation preliminarily validates our approach, it also suggests that the algorithm can be more widely applied to transport and delivery problems related to the construction and manufacturing industries.

6. Conclusions

To address the low-carbon transportation challenges of urban large cargo logistics, this study proposed a modeling method that takes into account actual load and time window constraints to better reflect the transportation scenario. We introduce a new mathematical formulation for the CTTRPTW, which is an extension of the TTRP, to obtain a transportation optimization solution that considers carbon emissions. We develop the DASA-TS algorithm based on the new formulation and evaluate it computationally on a set of test instances with up to 100 customers and diverse characteristics.
The major findings of this study are summarized as follows: On the one hand, the exploration of this paper in the application field of the TTRP enriches the research on low-carbon logistics of large cargo in theory. The defined innovative variant of the TTRP is a new attempt to combine the consideration of vehicle capacity with the cost of the time window. The formulation of a truck–trailer transportation model can significantly enhance transportation efficiency and sustainability, providing valuable insights for policymakers. On the other hand, the proposed DASA-TS effectively reduces total transportation costs compared to traditional methods, demonstrating strong performance in various benchmark problems. Incorporating carbon emissions costs into the objective function and introducing dynamic neighborhoods can significantly reduce carbon emissions costs. The DASA-TS shows stable and efficient performance across different problem scales, maintaining low solution times even for larger problems, making it a suitable tool for complex optimization challenges.
Despite the promising results, this study has several limitations that suggest directions for future research. Future studies should build on these findings to improve the model’s applicability and robustness in more complex logistical scenarios. One important direction is to incorporate a “truck–trip–time–node” based structure, which allows for explicitly modeling each truck’s routing sequence, trip scheduling, and arrival time at construction sites. In addition, future research should consider collecting and analyzing actual logistics data of the prefabricated building supply chain.

Author Contributions

All authors contributed to the study conception and design. Conceptualization, Q.D. and J.Z.; methodology, J.Z.; software, J.Z. and Q.C.; validation, Z.Y.; formal analysis, Q.C.; investigation, Y.L.; resources, J.Z.; data curation, Z.Y.; writing—original draft preparation, J.Z.; writing—review and editing, J.Z. and Z.Y.; visualization, Q.C.; supervision, Y.L. and L.B.; project administration, Q.D. and L.B.; funding acquisition, Q.D., L.B. and Y.L. All authors have read and agreed to the published version of the manuscript.

Funding

This research work was supported by the National Natural Science Foundation of China [Grant No. 72171025 and 72471034], Fundamental Research Funds for the Central Universities [Grant No. 300102233402], the Science and Technology Foundation for Transportation of Shaanxi Province [Grant No. 23-07R], and the Science and Technology Plan of Shandong Transportation Department [Grant No. 2021B48].

Data Availability Statement

Data will be made available on request.

Acknowledgments

The authors are grateful to the editors and the anonymous reviewers for the numerous valuable suggestions and comments.

Conflicts of Interest

The authors declare no conflicts of interest.

References

  1. Mao, C.; Shen, Q.; Shen, L.; Tang, L. Comparative Study of Greenhouse Gas Emissions between Off-Site Prefabrication and Conventional Construction Methods: Two Case Studies of Residential Projects. Energy Build. 2013, 66, 165–176. [Google Scholar] [CrossRef]
  2. Xiang, Y.; Ma, K.; Mahamadu, A.-M.; Florez-Perez, L.; Zhu, K.; Wu, Y. Embodied Carbon Determination in the Transportation Stage of Prefabricated Constructions: A Micro-Level Model Using the Bin-Packing Algorithm and Modal Analysis Model. Energy Build. 2023, 279, 112640. [Google Scholar] [CrossRef]
  3. Bai, L.; Xie, Q.; Lin, J.; Liu, S.; Wang, C.; Wang, L. Dynamic Selection of Risk Response Strategies with Resource Allocation for Construction Project Portfolios. Comput. Ind. Eng. 2024, 191, 110116. [Google Scholar] [CrossRef]
  4. Lin, S.-W.; Yu, V.F.; Lu, C.-C. A Simulated Annealing Heuristic for the Truck and Trailer Routing Problem with Time Windows. Expert Syst. Appl. 2011, 38, 15244–15252. [Google Scholar] [CrossRef]
  5. Bac, U.; Erdem, M. Optimization of Electric Vehicle Recharge Schedule and Routing Problem with Time Windows and Partial Recharge: A Comparative Study for an Urban Logistics Fleet. Sustain. Cities Soc. 2021, 70, 102883. [Google Scholar] [CrossRef]
  6. Regnier-Coudert, O.; McCall, J.; Ayodele, M.; Anderson, S. Truck and Trailer Scheduling in a Real World, Dynamic and Heterogeneous Context. Transp. Res. Part E Logist. Transp. Rev. 2016, 93, 389–408. [Google Scholar] [CrossRef]
  7. Wang, D.; Zhang, R.; Qiu, B.; Chen, W.; Xie, X. Drop-and-Pull Container Drayage with Flexible Assignment of Work Break for Vehicle Drivers. Comput. Oper. Res. 2024, 162, 106475. [Google Scholar] [CrossRef]
  8. Ehmke, J.F.; Campbell, A.M.; Thomas, B.W. Vehicle Routing to Minimize Time-Dependent Emissions in Urban Areas. Eur. J. Oper. Res. 2016, 251, 478–494. [Google Scholar] [CrossRef]
  9. Toro, E.M.; Franco, J.F.; Echeverri, M.G.; Guimarães, F.G. A Multi-Objective Model for the Green Capacitated Location-Routing Problem Considering Environmental Impact. Comput. Ind. Eng. 2017, 110, 114–125. [Google Scholar] [CrossRef]
  10. Jiang, M.; Wang, B.; Hao, Y.; Chen, S.; Wen, Y.; Yang, Z. Quantification of CO2 Emissions in Transportation: An Empirical Analysis by Modal Shift from Road to Waterway Transport in Zhejiang, China. Transp. Policy 2024, 145, 177–186. [Google Scholar] [CrossRef]
  11. Wang, D.; Moon, I.; Zhang, R. Multi-Trip Multi-Trailer Drop-and-Pull Container Drayage Problem. IEEE Trans. Intell. Transport. Syst. 2022, 23, 19088–19104. [Google Scholar] [CrossRef]
  12. Li, H.; Lv, T.; Li, Y. The Tractor and Semitrailer Routing Problem with Many-to-Many Demand Considering Carbon Dioxide Emissions. Transp. Res. Part D Transp. Environ. 2015, 34, 68–82. [Google Scholar] [CrossRef]
  13. Cheng, C.; Qi, M.; Wang, X.; Zhang, Y. Multi-Period Inventory Routing Problem under Carbon Emission Regulations. Int. J. Prod. Econ. 2016, 182, 263–275. [Google Scholar] [CrossRef]
  14. Accorsi, L.; Vigo, D. A Hybrid Metaheuristic for Single Truck and Trailer Routing Problems. Transport. Sci. 2020, 54, 1351–1371. [Google Scholar] [CrossRef]
  15. Chao, I.-M. A Tabu Search Method for the Truck and Trailer Routing Problem. Comput. Oper. Res. 2002, 29, 33–51. [Google Scholar]
  16. Tan, K.C.; Chew, Y.H.; Lee, L.H. A Hybrid Multi-Objective Evolutionary Algorithm for Solving Truck and Trailer Vehicle Routing Problems. Eur. J. Oper. Res. 2006, 172, 855–885. [Google Scholar] [CrossRef]
  17. Niu, B.; Xie, T.; Tan, L.; Bi, Y.; Wang, Z. Swarm Intelligence Algorithms for Yard Truck Scheduling and Storage Allocation Problems. Neurocomputing 2016, 188, 284–293. [Google Scholar] [CrossRef]
  18. Li, H.; Jian, X.; Chang, X.; Lu, Y. The Generalized Rollon-Rolloff Vehicle Routing Problem and Savings-Based Algorithm. Transp. Res. Part B Methodol. 2018, 113, 1–23. [Google Scholar] [CrossRef]
  19. Bartolini, E.; Schneider, M. A Two-Commodity Flow Formulation for the Capacitated Truck-and-Trailer Routing Problem. Discret. Appl. Math. 2020, 275, 3–18. [Google Scholar] [CrossRef]
  20. Davila-Pena, L.; Penas, D.R.; Casas-Méndez, B. A New Two-phase Heuristic for a Problem of Food Distribution with Compartmentalized Trucks and Trailers. Int. Tran. Oper. Res. 2023, 30, 1031–1064. [Google Scholar] [CrossRef]
  21. Semet, F.; Taillard, E. Solving Real-Life Vehicle Routing Problems Efficiently Using Tabu Search. Ann. Oper. Res. 1993, 41, 469–488. [Google Scholar] [CrossRef]
  22. Chen, H.; Wang, W.; Cheng, B.; Zhou, M. Optimal Method for Allocation of Tractors and Trailers in Daily Dispatches of Road Drops and Pull Transport. J. Adv. Transp. 2022, 2022, 3017196. [Google Scholar] [CrossRef]
  23. Wu, W.; Li, Y. The Multi-Compartment Truck and Trailer Petrol Station Replenishment Problem with Domino Hazard Risks. Transp. Res. Part B: Methodol. 2024, 190, 103078. [Google Scholar] [CrossRef]
  24. Hsu, H.-P.; Wang, C.-N.; Fu, H.-P.; Dang, T.-T. Joint Scheduling of Yard Crane, Yard Truck, and Quay Crane for Container Terminal Considering Vessel Stowage Plan: An Integrated Simulation-Based Optimization Approach. Mathematics 2021, 9, 2236. [Google Scholar] [CrossRef]
  25. Wang, W.F.; Yun, W.Y. Scheduling for Inland Container Truck and Train Transportation. Int. J. Prod. Econ. 2013, 143, 349–356. [Google Scholar] [CrossRef]
  26. Villegas, J.G.; Prins, C.; Prodhon, C.; Medaglia, A.L.; Velasco, N. A Matheuristic for the Truck and Trailer Routing Problem. Eur. J. Oper. Res. 2013, 230, 231–244. [Google Scholar] [CrossRef]
  27. Gerdessen, J.C. Vehicle Routing Problem with Trailers. Eur. J. Oper. Res. 1996, 93, 135–147. [Google Scholar] [CrossRef]
  28. Hoff, A.; Løkketangen, A. A Tabu Search Approach for Milk Collection in Western Norway Using Trucks and Trailers. In Proceedings of the 6th Triennial Symposium on Transportation Analysis, Phuket Island, Thailand, 11–15 June 2007. [Google Scholar]
  29. Lin, S.-W.; Yu, V.F.; Chou, S.-Y. A Note on the Truck and Trailer Routing Problem. Expert Syst. Appl. 2010, 37, 899–903. [Google Scholar] [CrossRef]
  30. Drexl, M. Branch-and-Price and Heuristic Column Generation for the Generalized Truck-and-Trailer Routing Problem. Rev. Métodos Cuantitativos Para Econ. Empresa 2011, 12, 5–38. [Google Scholar]
  31. Belenguer, J.M.; Benavent, E.; Martínez, A.; Prins, C.; Prodhon, C.; Villegas, J.G. A Branch-and-Cut Algorithm for the Single Truck and Trailer Routing Problem with Satellite Depots. Transport. Sci. 2016, 50, 735–749. [Google Scholar] [CrossRef]
  32. Parragh, S.N.; Cordeau, J.-F. Branch-and-Price and Adaptive Large Neighborhood Search for the Truck and Trailer Routing Problem with Time Windows. Comput. Oper. Res. 2017, 83, 28–44. [Google Scholar] [CrossRef]
  33. Rothenbächer, A.-K.; Drexl, M.; Irnich, S. Branch-and-Price-and-Cut for the Truck-and-Trailer Routing Problem with Time Windows. Transport. Sci. 2018, 52, 1174–1190. [Google Scholar] [CrossRef]
  34. Teng, Y.; Li, K.; Pan, W.; Ng, T. Reducing Building Life Cycle Carbon Emissions through Prefabrication: Evidence from and Gaps in Empirical Studies. Build. Environ. 2018, 132, 125–136. [Google Scholar] [CrossRef]
  35. Teng, Y.; Pan, W. Systematic Embodied Carbon Assessment and Reduction of Prefabricated High-Rise Public Residential Buildings in Hong Kong. J. Clean. Prod. 2019, 238, 117791. [Google Scholar] [CrossRef]
  36. Wang, H.; Zhao, L.; Zhang, H.; Qian, Y.; Xiang, Y.; Luo, Z.; Wang, Z. Carbon Emission Analysis of Precast Concrete Building Construction: A Study on Component Transportation Phase Using Artificial Neural Network. Energy Build. 2023, 301, 113708. [Google Scholar] [CrossRef]
  37. Ehsani, M.; Ahmadi, A.; Fadai, D. Modeling of Vehicle Fuel Consumption and Carbon Dioxide Emission in Road Transport. Renew. Sustain. Energy Rev. 2016, 53, 1638–1648. [Google Scholar] [CrossRef]
  38. Santos, G. Road Transport and CO2 Emissions: What Are the Challenges? Transp. Policy 2017, 59, 71–74. [Google Scholar] [CrossRef]
  39. Turkensteen, M. The Accuracy of Carbon Emission and Fuel Consumption Computations in Green Vehicle Routing. Eur. J. Oper. Res. 2017, 262, 647–659. [Google Scholar] [CrossRef]
  40. Rauniyar, A.; Nath, R.; Muhuri, P.K. Multi-Factorial Evolutionary Algorithm Based Novel Solution Approach for Multi-Objective Pollution-Routing Problem. Comput. Ind. Eng. 2019, 130, 757–771. [Google Scholar] [CrossRef]
  41. Shi, Y.; Lin, Y.; Wang, S.; Wen, H.; Lim, M.K.; Li, Y. A Simultaneous Facility Location and Vehicle Routing Problem with Recyclable Express Packaging Consideration for Sustainable City Logistics. Sustain. Cities Soc. 2023, 98, 104857. [Google Scholar] [CrossRef]
  42. Baños, R.; Ortega, J.; Gil, C.; Fernández, A.; De Toro, F. A Simulated Annealing-Based Parallel Multi-Objective Approach to Vehicle Routing Problems with Time Windows. Expert Syst. Appl. 2013, 40, 1696–1707. [Google Scholar] [CrossRef]
  43. Asghari, M.; Al-e-hashem, S.M.J.M. Green Vehicle Routing Problem: A State-of-the-Art Review. Int. J. Prod. Econ. 2021, 231, 107899. [Google Scholar] [CrossRef]
  44. Wu, Z.; Lou, P.; Hu, J.; Zeng, Y.; Fan, C. An Adaptive Large Neighborhood Search for a Green Vehicle Routing Problem with Depot Sharing. Mathematics 2025, 13, 214. [Google Scholar] [CrossRef]
  45. Luo, L.; Jin, X.; Shen, G.Q.; Wang, Y.; Liang, X.; Li, X.; Li, C.Z. Supply Chain Management for Prefabricated Building Projects in Hong Kong. J. Manage. Eng. 2020, 36, 5020001. [Google Scholar] [CrossRef]
  46. Godbole, S.; Lam, N.; Mafas, M.; Fernando, S.; Gad, E.; Hashemi, J. Dynamic Loading on a Prefabricated Modular Unit of a Building during Road Transportation. J. Build. Eng. 2018, 18, 260–269. [Google Scholar] [CrossRef]
  47. Zhang, H.; Yu, L. Dynamic Transportation Planning for Prefabricated Component Supply Chain. Eng. Constr. Archit. Manage. 2020, 27, 2553–2576. [Google Scholar] [CrossRef]
  48. Koskosidis, Y.A.; Powell, W.B.; Solomon, M.M. An Optimization-Based Heuristic for Vehicle Routing and Scheduling with Soft Time Window Constraints. Transp. Sci. 1992, 26, 69–85. [Google Scholar] [CrossRef]
  49. Dan, Y.; Liu, G. Integrated Scheduling Optimization of Production and Transportation for Precast Component with Delivery Time Window. Eng. Constr. Archit. Manag. 2024, 31, 3335–3355. [Google Scholar] [CrossRef]
  50. Liu, L.; He, A.; Tian, T.; Lee, L.S.; Seow, H.-V. Bi-Objective Mixed Integer Nonlinear Programming Model for Low Carbon Location-Inventory-Routing Problem with Time Windows and Customer Satisfaction. Mathematics 2024, 12, 2367. [Google Scholar] [CrossRef]
  51. Liu, H.; Wang, S.; Yang, T.; Chen, Z. Optimized Transportation Scheduling for Precast Concrete Components Considering Heterogeneous Vehicle-Size Matching. Adv. Eng. Inf. 2024, 62, 102658. [Google Scholar] [CrossRef]
  52. Tavares, V.; Gregory, J.; Kirchain, R.; Freire, F. What Is the Potential for Prefabricated Buildings to Decrease Costs and Contribute to Meeting EU Environmental Targets? Build. Environ. 2021, 206, 108382. [Google Scholar] [CrossRef]
  53. Wang, H.; Zhang, H.; Hou, K.; Yao, G. Carbon Emissions Factor Evaluation for Assembled Building during Prefabricated Component Transportation Phase. Energy Explor. Exploit. 2021, 39, 385–408. [Google Scholar] [CrossRef]
  54. Dong, H.; Zhang, L. Transition towards Carbon Neutrality: Forecasting Hong Kong’s Buildings Carbon Footprint by 2050 Using a Machine Learning Approach. Sustain. Prod. Consum. 2023, 35, 633–642. [Google Scholar] [CrossRef]
  55. Han, Y.; Yan, X.; Piroozfar, P. An Overall Review of Research on Prefabricated Construction Supply Chain Management. ECAM 2023, 30, 5160–5195. [Google Scholar] [CrossRef]
  56. Pisinger, D.; Ropke, S. A General Heuristic for Vehicle Routing Problems. Comput. Oper. Res. 2007, 34, 2403–2435. [Google Scholar] [CrossRef]
  57. Zachariadis, E.E.; Tarantilis, C.D.; Kiranoudis, C.T. A Hybrid Metaheuristic Algorithm for the Vehicle Routing Problem with Simultaneous Delivery and Pick-up Service. Expert Syst. Appl. 2009, 36, 1070–1081. [Google Scholar] [CrossRef]
  58. Andelmin, J.; Bartolini, E. An Exact Algorithm for the Green Vehicle Routing Problem. Transport. Sci. 2017, 51, 1288–1303. [Google Scholar] [CrossRef]
  59. You, G. Sustainable Vehicle Routing Problem on Real-Time Roads: The Restrictive Inheritance-Based Heuristic Algorithm. Sustain. Cities Soc. 2022, 79, 103682. [Google Scholar] [CrossRef]
  60. Lin, S.-W.; Yu, V.F.; Chou, S.-Y. Solving the Truck and Trailer Routing Problem Based on a Simulated Annealing Heuristic. Comput. Oper. Res. 2009, 36, 1683–1692. [Google Scholar] [CrossRef]
  61. Derigs, U.; Pullmann, M.; Vogel, U. Truck and Trailer Routing—Problems, Heuristics and Computational Experience. Comput. Oper. Res. 2013, 40, 536–546. [Google Scholar] [CrossRef]
  62. Baker, B.M.; Ayechew, M.A. A Genetic Algorithm for the Vehicle Routing Problem. Comput. Oper. Res. 2003, 30, 787–800. [Google Scholar] [CrossRef]
  63. Yu, V.F.; Redi, A.A.N.P.; Hidayat, Y.A.; Wibowo, O.J. A Simulated Annealing Heuristic for the Hybrid Vehicle Routing Problem. Appl. Soft Comput. 2017, 53, 119–132. [Google Scholar] [CrossRef]
  64. MirHassani, S.A.; Abolghasemi, N. A Particle Swarm Optimization Algorithm for Open Vehicle Routing Problem. Expert Syst. Appl. 2011, 38, 11547–11551. [Google Scholar] [CrossRef]
  65. Sluijk, N.; Florio, A.M.; Kinable, J.; Dellaert, N.; Van Woensel, T. Two-Echelon Vehicle Routing Problems: A Literature Review. Eur. J. Oper. Res. 2023, 304, 865–886. [Google Scholar] [CrossRef]
  66. Guo, X.; Zhang, W.; Liu, B. Low-Carbon Routing for Cold-Chain Logistics Considering the Time-Dependent Effects of Traffic Congestion. Transp. Res. Part D Transp. Environ. 2022, 113, 103502. [Google Scholar] [CrossRef]
  67. Xiao, Y.; Zhao, Q.; Kaku, I.; Xu, Y. Development of a fuel consumption optimization model for the capacitated vehicle routing problem. Comput. Oper. Res. 2012, 39, 1419–1431. [Google Scholar] [CrossRef]
  68. Zhang, S.; Lee, C.K.M.; Choy, K.L.; Ho, W.; Ip, W.H. Design and Development of a Hybrid Artificial Bee Colony Algorithm for the Environmental Vehicle Routing Problem. Transp. Res. Part D Transp. Environ. 2014, 31, 85–99. [Google Scholar] [CrossRef]
  69. Zhou, M.; Jin, H.; Wang, W. A Review of Vehicle Fuel Consumption Models to Evaluate Eco-Driving and Eco-Routing. Transp. Res. Part D Transp. Environ. 2016, 49, 203–218. [Google Scholar] [CrossRef]
  70. Wei, L.; Zhang, Z.; Zhang, D.; Leung, S.C.H. A Simulated Annealing Algorithm for the Capacitated Vehicle Routing Problem with Two-Dimensional Loading Constraints. Eur. J. Oper. Res. 2018, 265, 843–859. [Google Scholar] [CrossRef]
  71. Solomon, M.M. Algorithms for the Vehicle Routing and Scheduling Problems with Time Window Constraints. Oper. Res. 1987, 35, 254–265. [Google Scholar] [CrossRef]
  72. Lin, Y.; Bian, Z.; Liu, X. Developing a Dynamic Neighborhood Structure for an Adaptive Hybrid Simulated Annealing—Tabu Search Algorithm to Solve the Symmetrical Traveling Salesman Problem. Appl. Soft Comput. 2016, 49, 937–952. [Google Scholar] [CrossRef]
  73. Küçükoğlu, İ.; Dewil, R.; Cattrysse, D. Hybrid Simulated Annealing and Tabu Search Method for the Electric Travelling Salesman Problem with Time Windows and Mixed Charging Rates. Expert Syst. Appl. 2019, 134, 279–303. [Google Scholar] [CrossRef]
Figure 1. Schematic diagram of a vehicle consists of a truck and trailer.
Mathematics 13 01210 g001
Figure 2. Prefabricated components truck-and-trailer transportation schematic.
Mathematics 13 01210 g002
Figure 3. DASA-TS algorithm flowchart.
Mathematics 13 01210 g003
Figure 4. Optimized routing for Lin test.
Mathematics 13 01210 g004
Figure 5. Optimization of solutions at different scales.
Mathematics 13 01210 g005
Table 1. An overview of the TTRP.
ReferenceSolution AlgorithmConstraintsCarbon
CTO
Chao [15]Tabu search algorithm
Tan et al. [16]Evolutionary algorithm
Lin et al. [4]Simulated annealing algorithm
Niu et al. [17]Particle swarm optimization algorithm
Regnier-Coudert et al. [6]Greedy algorithm
Li et al. [18]Benders decomposition algorithm
Bartolini and Schneider [19]Branch-and-cut algorithm
Wang et al. [11]Adaptive large neighborhood search algorithm
Davila-Pena et al. [20]Clarke–Wright algorithm
Current paperTabu search and simulated annealing algorithm
Note: C: Capacitated; T: Time windows; O: Others.
Table 2. Notations and definitions.
NotationsDefinitions
Decision Variables
x i j k t Binary   variable ,   indicating   whether   truck   k   hauls   a   trailer   when   moving   along   arc   ( i , j ) (1 if used, 0 otherwise)
y i j k Binary   variable ,   indicating   whether   truck   k   moves   along   arc   ( i , j ) (1 if used, 0 otherwise)
z k Binary variable, indicating whether truck k is used (1 if used, 0 otherwise)
q j Integer variable, representing the number of deliveries made to node j
q i j k Continuous decision variable, representing the transported load on arc (i,j) in truck k
f i j Continuous   decision   variable ,   representing   the   transported   load   in   all   the   trucks   travelling   arc   ( i , j )
Parameters
d i j Distance   between   node   i   and   node   j
ξ Departure costs for the driver
γ b Wages paid to the driver
γ q Driver’s reward for the number of successful deliveries
ρ r 0 Fuel consumption rate per unit distance when an empty truck is hauling an empty trailer (liters/km)
ρ 0 Fuel consumption rate per unit distance of an empty truck running alone (liters/km)
ρ r * Fuel consumption per unit distance of full load complete vehicles (truck + trailer) (liters/km)
ρ * Fuel consumption per unit distance of full load complete trucks without trailers (liters/km)
ρ i j k Effective fuel consumption rate of vehicles on arc (i,j)
Q Rated load capacity of a truck without a trailer (tons)
Q r Rated load capacity of a vehicle (truck + trailer) (tons)
φ c Unit fuel consumption costs (yuan/liter)
ϑ c Unit carbon emissions costs (yuan/kg)
σ Carbon emissions produced per unit of fuel consumed
ϕ Unit penalty costs for delays in the delivery
t k s The time for truck k arriving at the construction site s
d i Demand at node i
Table 3. Test for the CTTRPTW dataset with 25 customers.
No.Coordinate (X, Y)DemandEarliest TimeLatest TimeCustomer Type
035, 54----
145, 68109129671
245, 70308258701
342, 6610651461
442, 68107277821
542, 651015671
640, 69206217020
740, 66201702251
838, 68202553240
938, 70105346050
1035, 66103574100
1135, 69104485050
1230, 70206527210
1327, 603030920
1427, 70105676200
1525, 65403844290
1625, 70404755281
1723, 6220991480
1820, 60201792541
1920, 65102783451
2030, 501010730
2130, 52209149650
2228, 52208128830
2328, 55107327770
2425, 5010651440
2525, 52401692240
Table 4. Description of characteristics of the Solomon dataset.
TypeProblemsCharacteristic
RR1Customers are disperses with narrow time windows, limited vehicle capacities, and short route durations.
R2Customers are disperses with wider time windows, larger vehicle capacities, and longer route durations.
CC1Customers are clustered with narrow time windows, limited vehicle capacities, and short route durations.
C2Customers are clustered with wider time windows, larger vehicle capacities, and longer route durations.
RCRC1A mix of dispersed and clustered customers, characterized by narrow time windows, limited vehicle capacities, and short route durations.
RC2A mix of dispersed and clustered customers, characterized by narrow time windows, limited vehicle capacities, and short route durations.
Table 5. Results of the DASA-TS in the test problems of Lin set.
Total CostsCarbon Emissions CostsSolution Time
(Seconds)
Initial solution63,311.1449102.2990.365
CPLEX52,566.2087120.3290.498
SA62,826.1099002.2130.330
TS60,936.5068612.2950.366
DASA-TS52,393.3156909.4620.306
Table 6. Test for the CTTRPTW dataset.
Original ProblemCPLEXDASA-TS
Case VCsTCsTotal CostsTotal Carbon Emissions CostsSolution Time (Seconds)Total CostsTotal Carbon Emissions CostsSolution Time (Seconds)
Test 1 (25)1RC1011015165,967.836127,020.04140.004165,082.303426,769.68170.290
2RC1011510166,253.225226,909.27860.004164,213.552727,015.23730.274
3RC2011015167,080.276927,265.33590.005166,784.061027,240.81080.234
4RC2011510168,250.758926,754.04130.005168,413.338526,267.75670.213
Test 2 (50)5RC1012030487,822.307892,160.15870.006473,366.302191,477.17350.372
6RC1012030484,050.902193,906.49250.680479,588.261392,397.57030.413
7RC2012030474,065.103189,321.37050.705473,366.302188,373.17350.376
8RC2013713498,091.012095,898.14530.604497,410.787292,075.24180.432
Test 3 (100)9RC10140601,711,778.8260321,391.446010.3071,709,710.6087318,306.79236.631
10RC10160402,431,076.3334449,232.20158.1352,289,416.4772435,534.65206.583
11RC20140601,785,390.2267337,956.713512.3071,751,653.6209323,420.58847.598
12RC20160402,200,800.9498413,090.67219.1102,061,096.9005394,213.64618.309
Disclaimer/Publisher’s Note: The statements, opinions and data contained in all publications are solely those of the individual author(s) and contributor(s) and not of MDPI and/or the editor(s). MDPI and/or the editor(s) disclaim responsibility for any injury to people or property resulting from any ideas, methods, instructions or products referred to in the content.

