1. Introduction
The increasing frequency and severity of natural disasters necessitate more robust and efficient disaster intelligence systems. Traditional disaster management approaches often rely on proprietary data and closed systems, leading to limitations in real-time situational awareness and collaborative decision-making [
1,
2]. These limitations hinder effective disaster response and recovery, particularly in regions with inadequate infrastructure and communication networks. To address these challenges, open-source disaster intelligence (OSDI) has emerged as a transformative paradigm, leveraging publicly available data, social media analytics, and advanced computational models for comprehensive disaster monitoring and response [
3,
4]. OSDI offers the potential to democratize disaster data access, enabling a more inclusive approach to disaster preparedness and mitigation strategies. However, despite the growing interest and adoption of OSDI, several critical research gaps remain unaddressed.
First, while the importance of democratizing disaster data access through open-source platforms is well documented, the existing literature lacks standardized frameworks for effectively integrating social media data with traditional disaster reports [
5,
6]. The absence of standardized integration mechanisms limits the potential of multimodal analytics in enhancing situational awareness and decision-making. Second, although advanced methodologies such as natural language processing (NLP) and machine learning (ML) have been increasingly employed for disaster detection and prediction, their scalability and cross-lingual capabilities for global disaster analytics require further exploration [
6,
7]. Multimodal tweet classification using transformer models has shown promise in contextual disaster intelligence, but challenges related to language diversity and cultural nuances remain unresolved. Third, the reliability of disaster intelligence derived from social media data is frequently compromised due to issues related to data credibility, misinformation, and ethical concerns [
8,
9,
10]. The proliferation of fake accounts and the spread of misinformation during disaster events pose significant challenges to ensuring data integrity and credibility. Therefore, addressing these challenges necessitates the development of robust data verification mechanisms and ethical frameworks.
To bridge these research gaps, this study proposes a novel framework that integrates advanced geospatial and time-series modeling techniques with real-time open-source data sources, including social media feeds and global disaster reports. The proposed framework leverages geospatial clustering algorithms, including K-means and DBSCAN, to detect geographical hotspots and complex spatial distributions of disaster occurrences [
11,
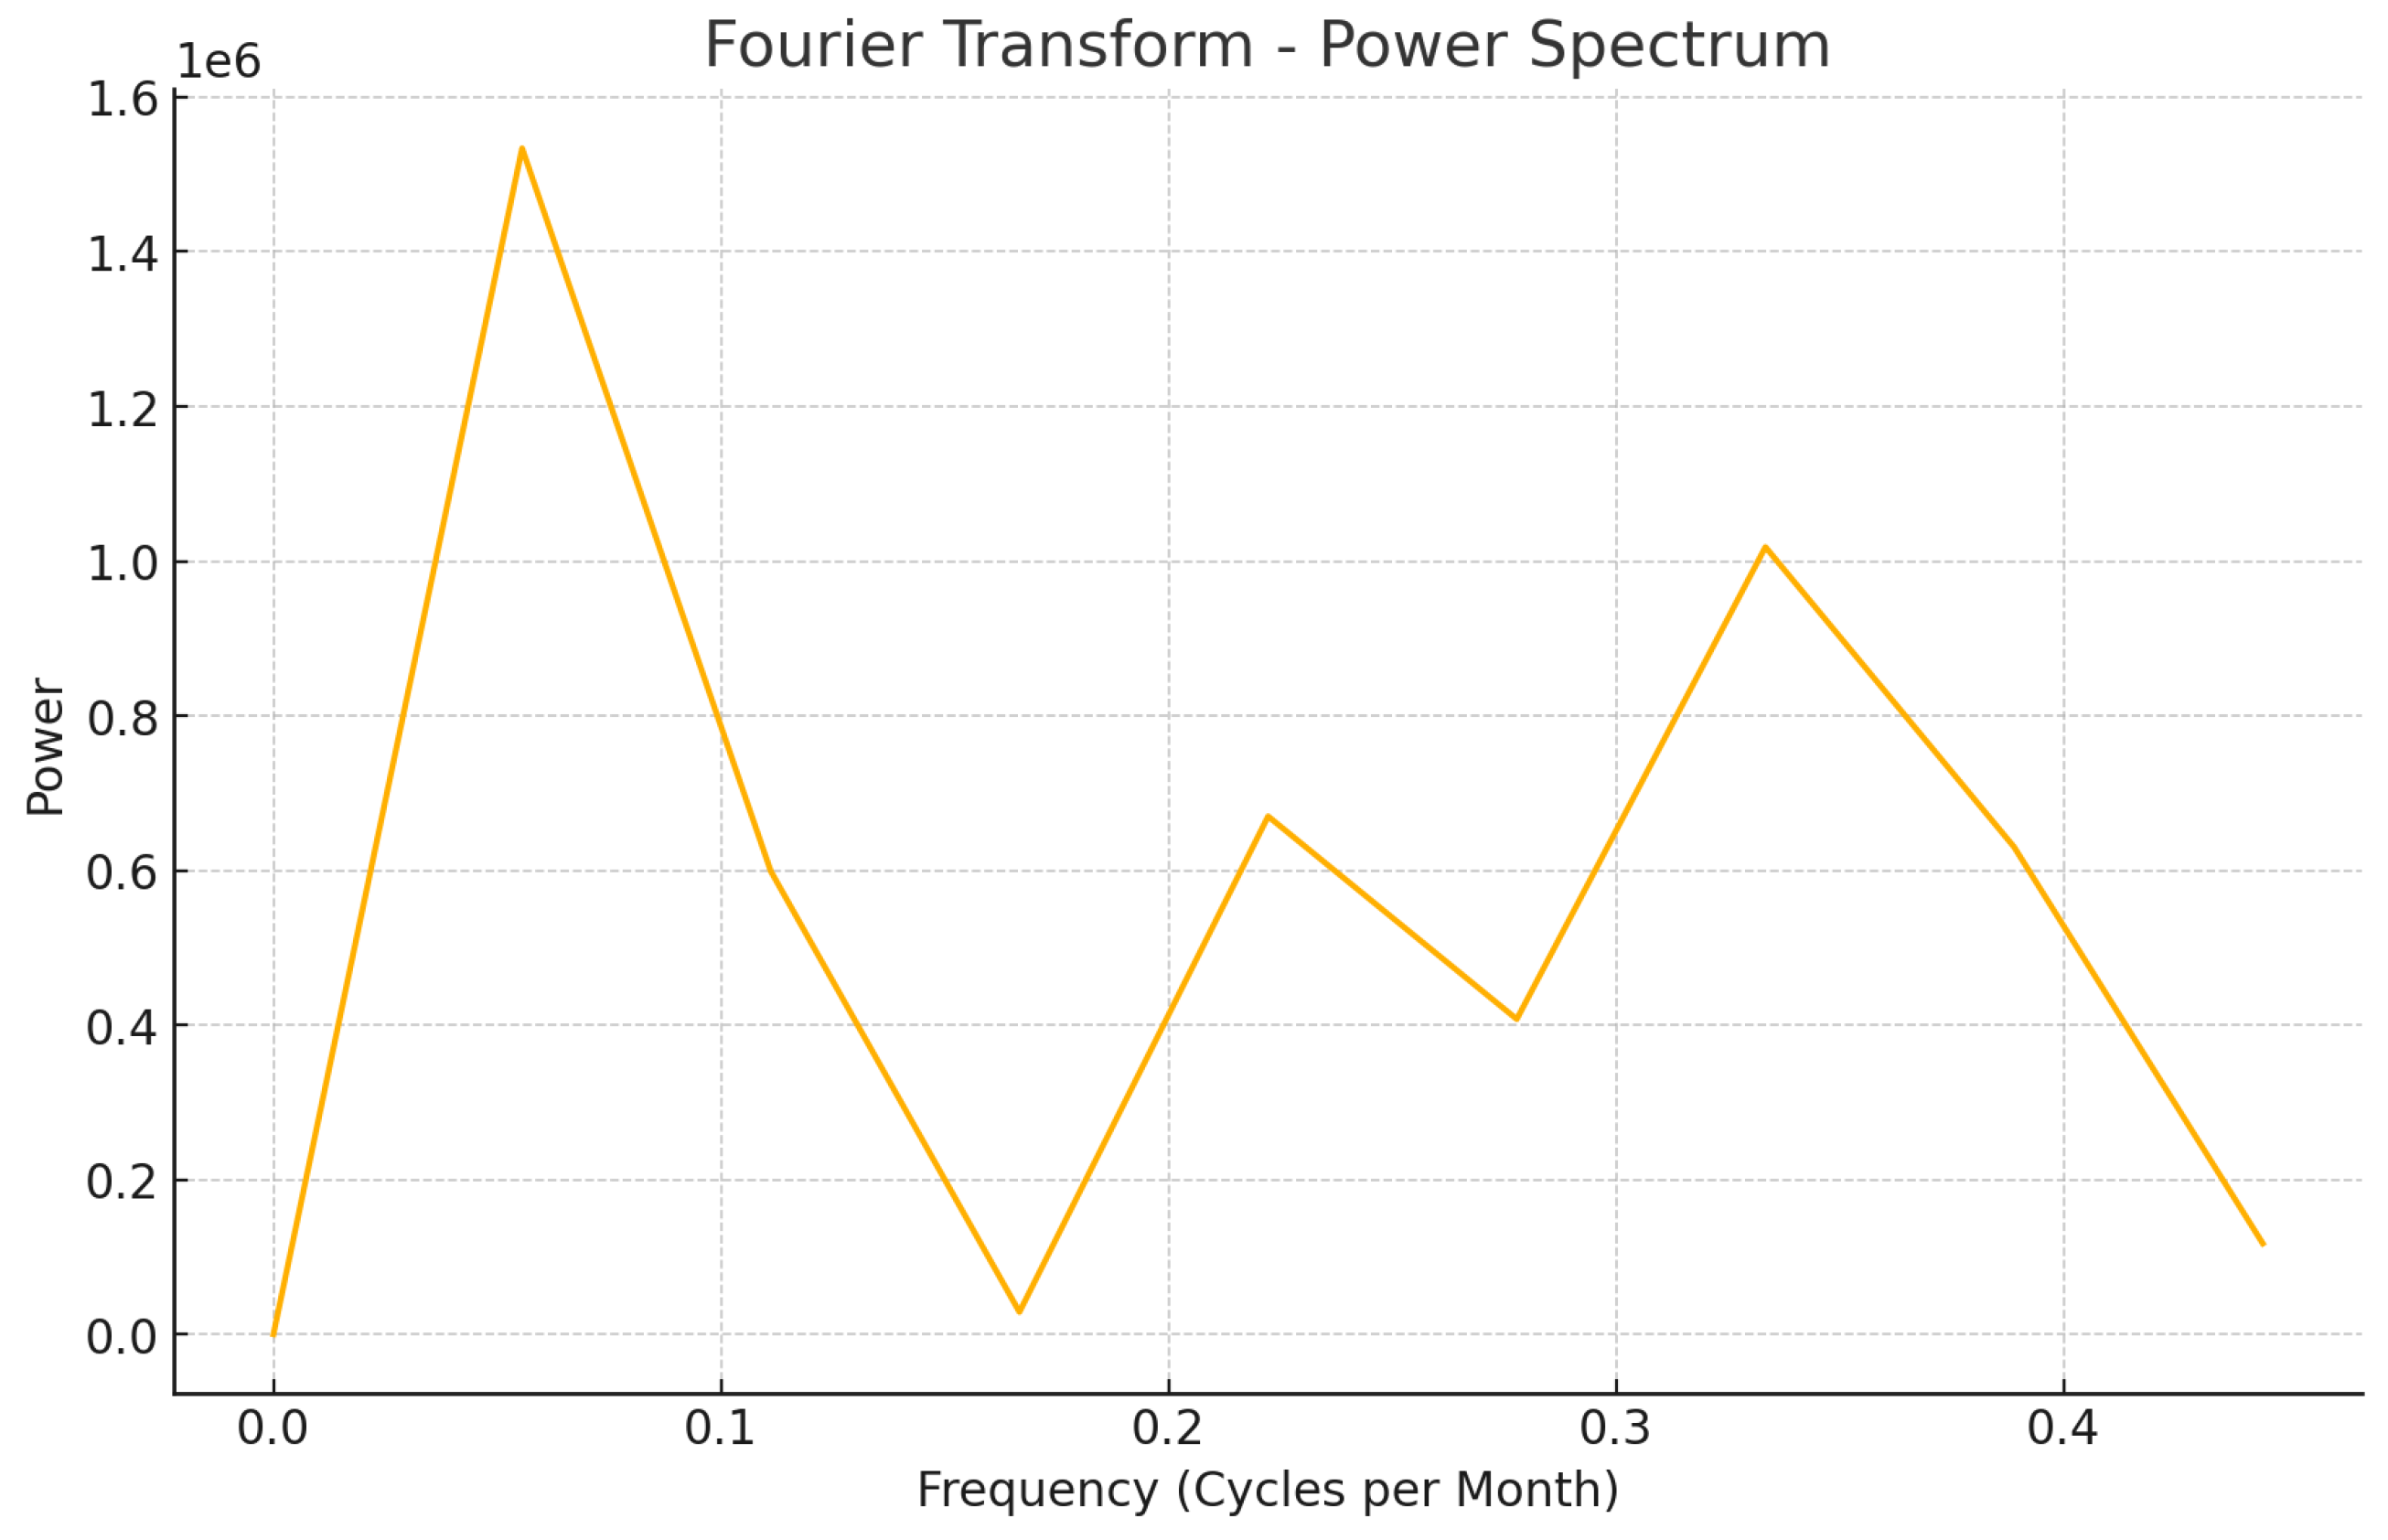
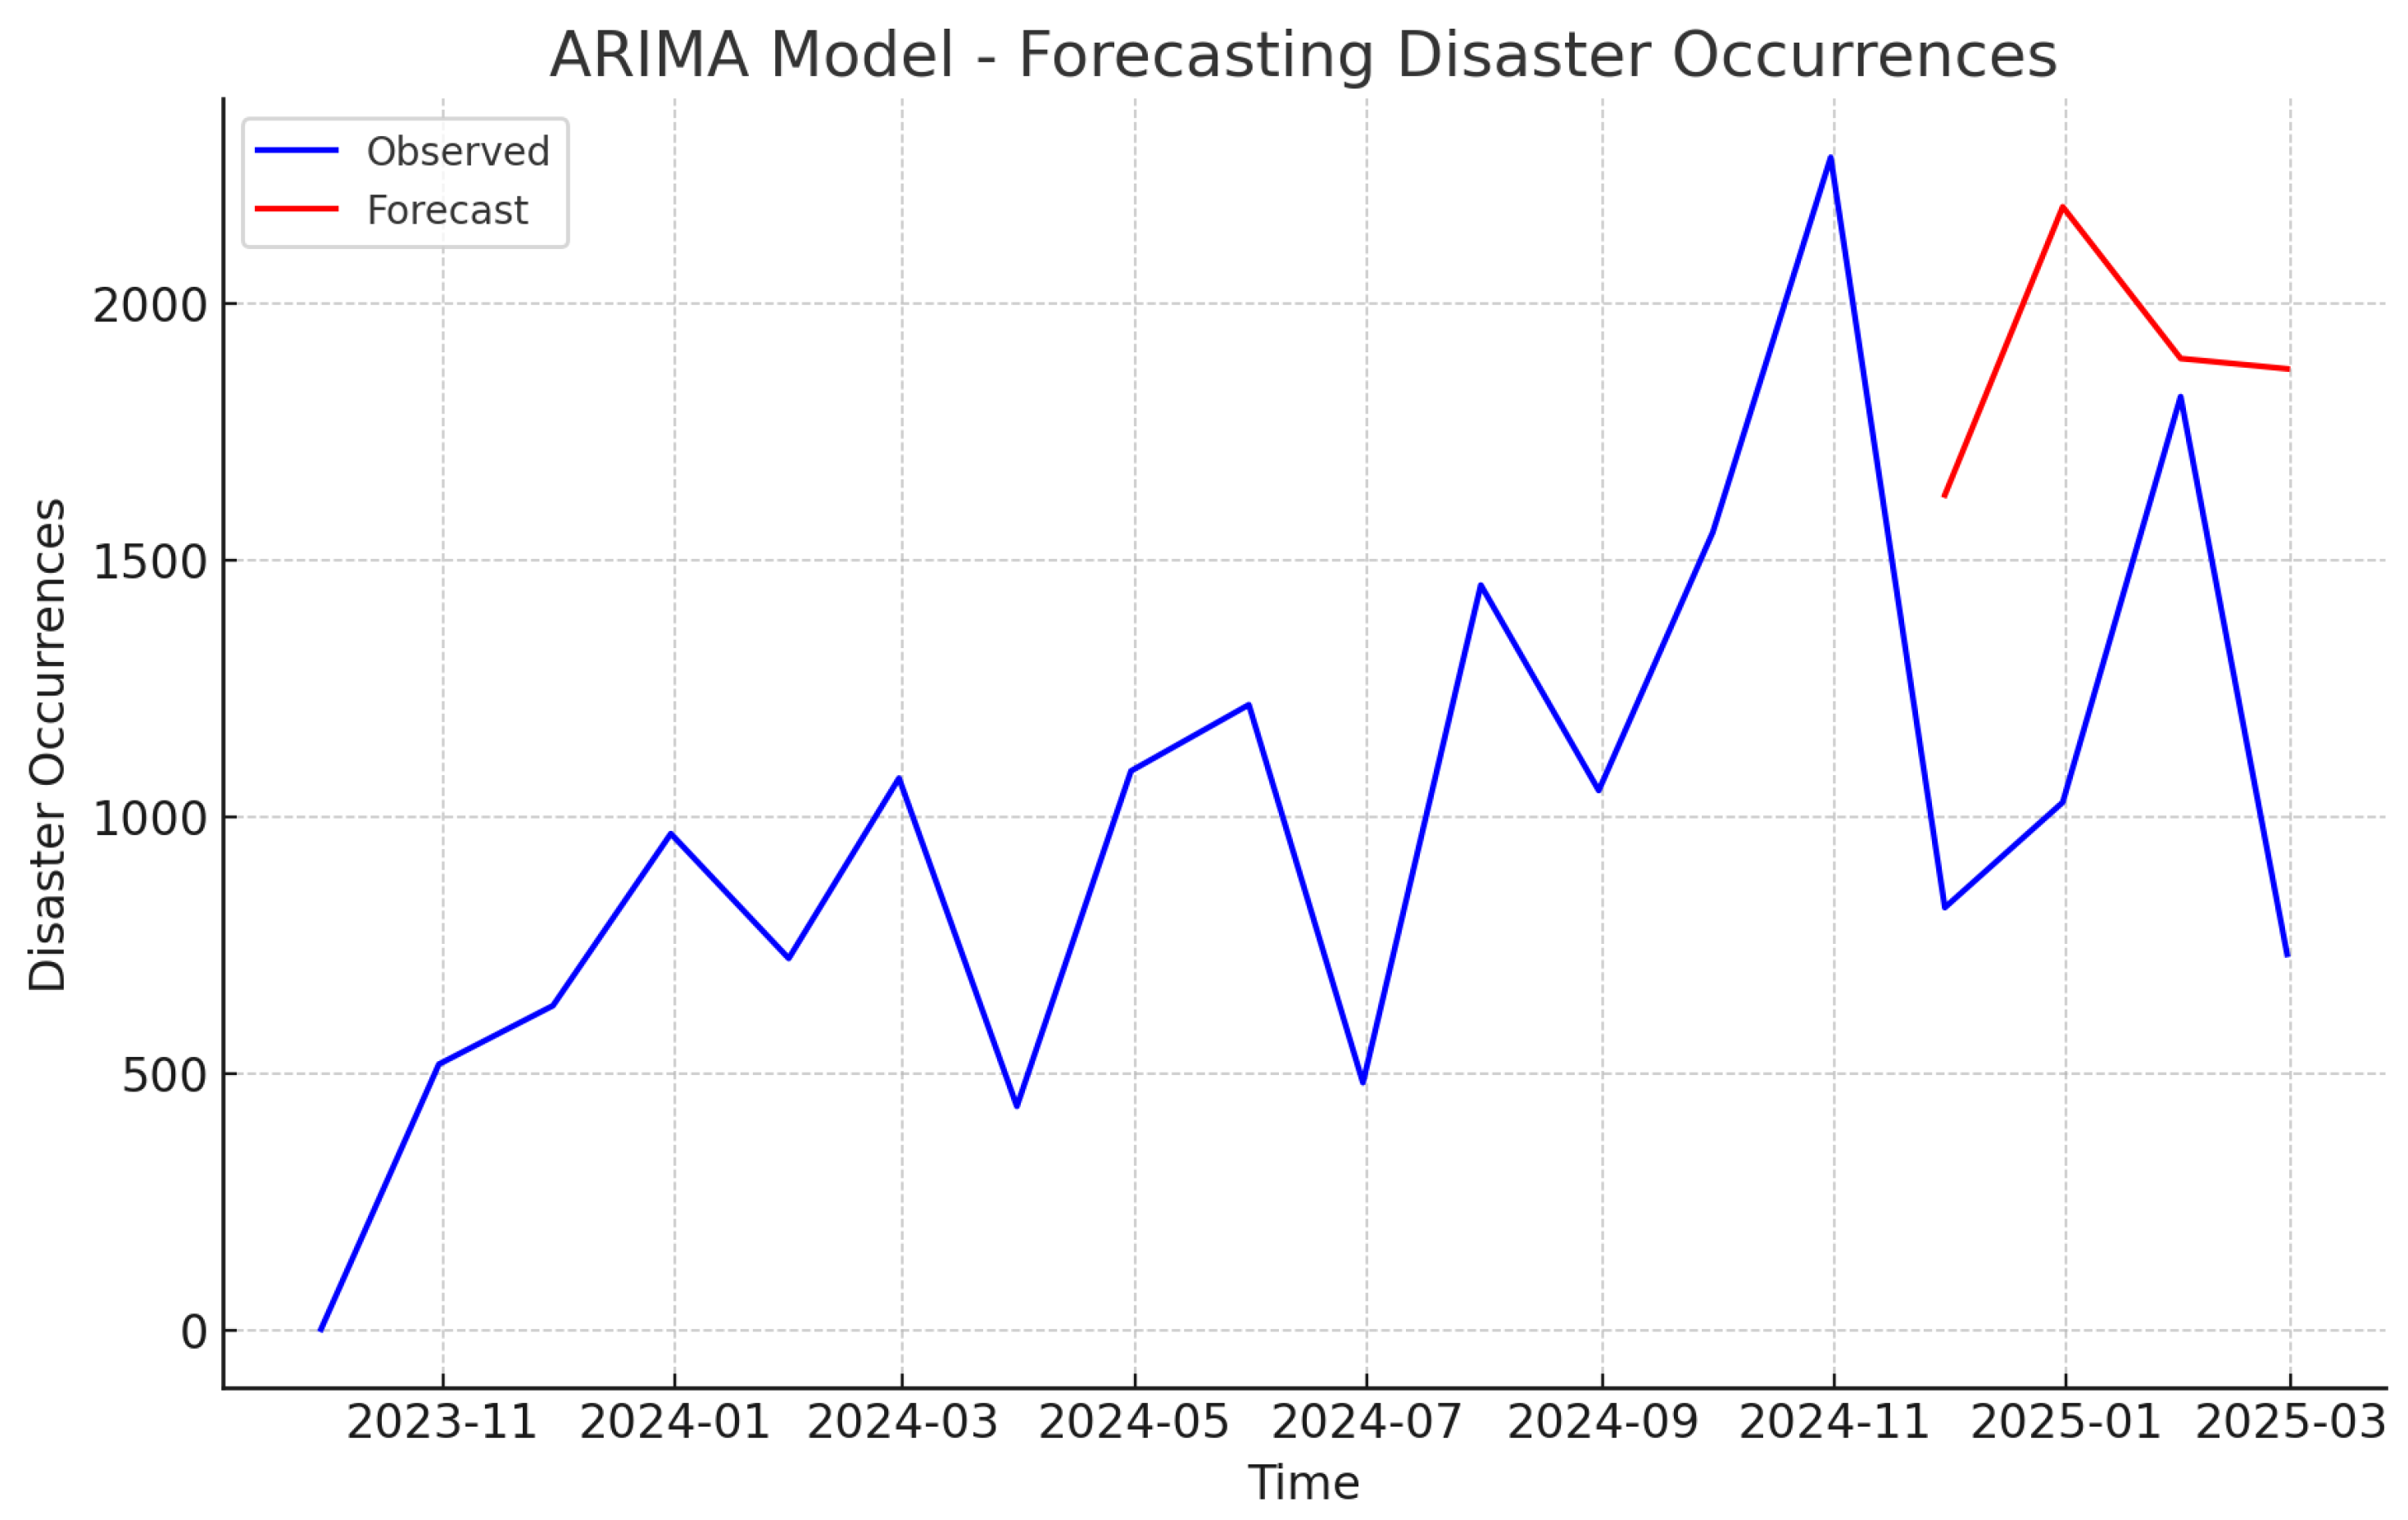
12]. Additionally, it employs temporal pattern analysis using seasonal decomposition (STL), Fourier transform, and ARIMA models to identify cyclical patterns and temporal dependencies in disaster occurrences and severity [
13,
14,
15]. By integrating multimodal tweet classification using transformer models, the framework enhances real-time disaster communication and situational awareness [
6,
7]. Unlike existing approaches, this study uniquely combines geospatial clustering, temporal pattern analysis, and multimodal data integration in a unified framework, providing a more holistic and dynamic approach to disaster intelligence.
This study demonstrates the efficacy of the proposed framework through comprehensive experimentation using a dataset of 17,884 disaster events. The data collection process involved automated extraction using Microsoft Power Automate, ensuring comprehensive coverage of disaster events worldwide. The structured dataset was analyzed using advanced geospatial and time-series techniques, enabling the identification of disaster-prone regions and the development of predictive models for future occurrences and severity levels. The experimental results revealed significant geographical hotspots, with major clusters observed in North America (USA), South Asia (India), and Australia. These findings indicate considerable geographical vulnerability, necessitating region-specific disaster preparedness measures. Additionally, the temporal pattern analysis identified cyclical behaviors corresponding to seasonal climatic influences, enhancing the predictive accuracy of disaster forecasting. The ARIMA model configuration of
yielded a mean squared error (MSE) of approximately 823,761, demonstrating high predictive performance and robustness in capturing temporal dynamics. To mitigate the impact of misinformation, fake accounts, and credibility issues present in social-media-driven disaster intelligence (as discussed in [
8,
9,
10]), this research sourced data using AI-driven automation from 444 large-scale online news portals (e.g., CNN, BBC, CBS News, The Guardian, Daily Mail UK, NDTV, Times of India etc.). This diversified and large range of news media from all parts of the globe (i.e, US, UK, Australia, India, China etc.) provided a much more credible open-source disaster analytics compared to previous studies on Social-Media driven data. Out of 1.25 million news articles captured from 27 September 2023 to 26 February 2025, 17,884 articles were classified by Generative Pre-Trained (GPT) models as news pertaining to global disasters like earthquakes, floods, landslides, cyclones, wildfires, etc. Most importantly, GPT classification identified 185 distinct countries and 6068 distinct locations spanning over 514 days (i.e., 17 months) providing unprecedented geospatial and temporal intelligence that has not been demonstrated in previous studies. The GPT-based classification model exhibits its highest predictive accuracy in the categorization of country, with a precision of approximately 94.5%, a recall of 94.8%, and an F1-score of 94.65%, underscoring its robust capability in geospatial disaster identification. Conversely, the model’s classification accuracy is comparatively lower in deaths and Injuries, where precision and recall values range between 87.5% and 88.5%, highlighting the inherent challenges in extracting precise casualty figures due to the frequent use of non-numeric descriptors in news reports.
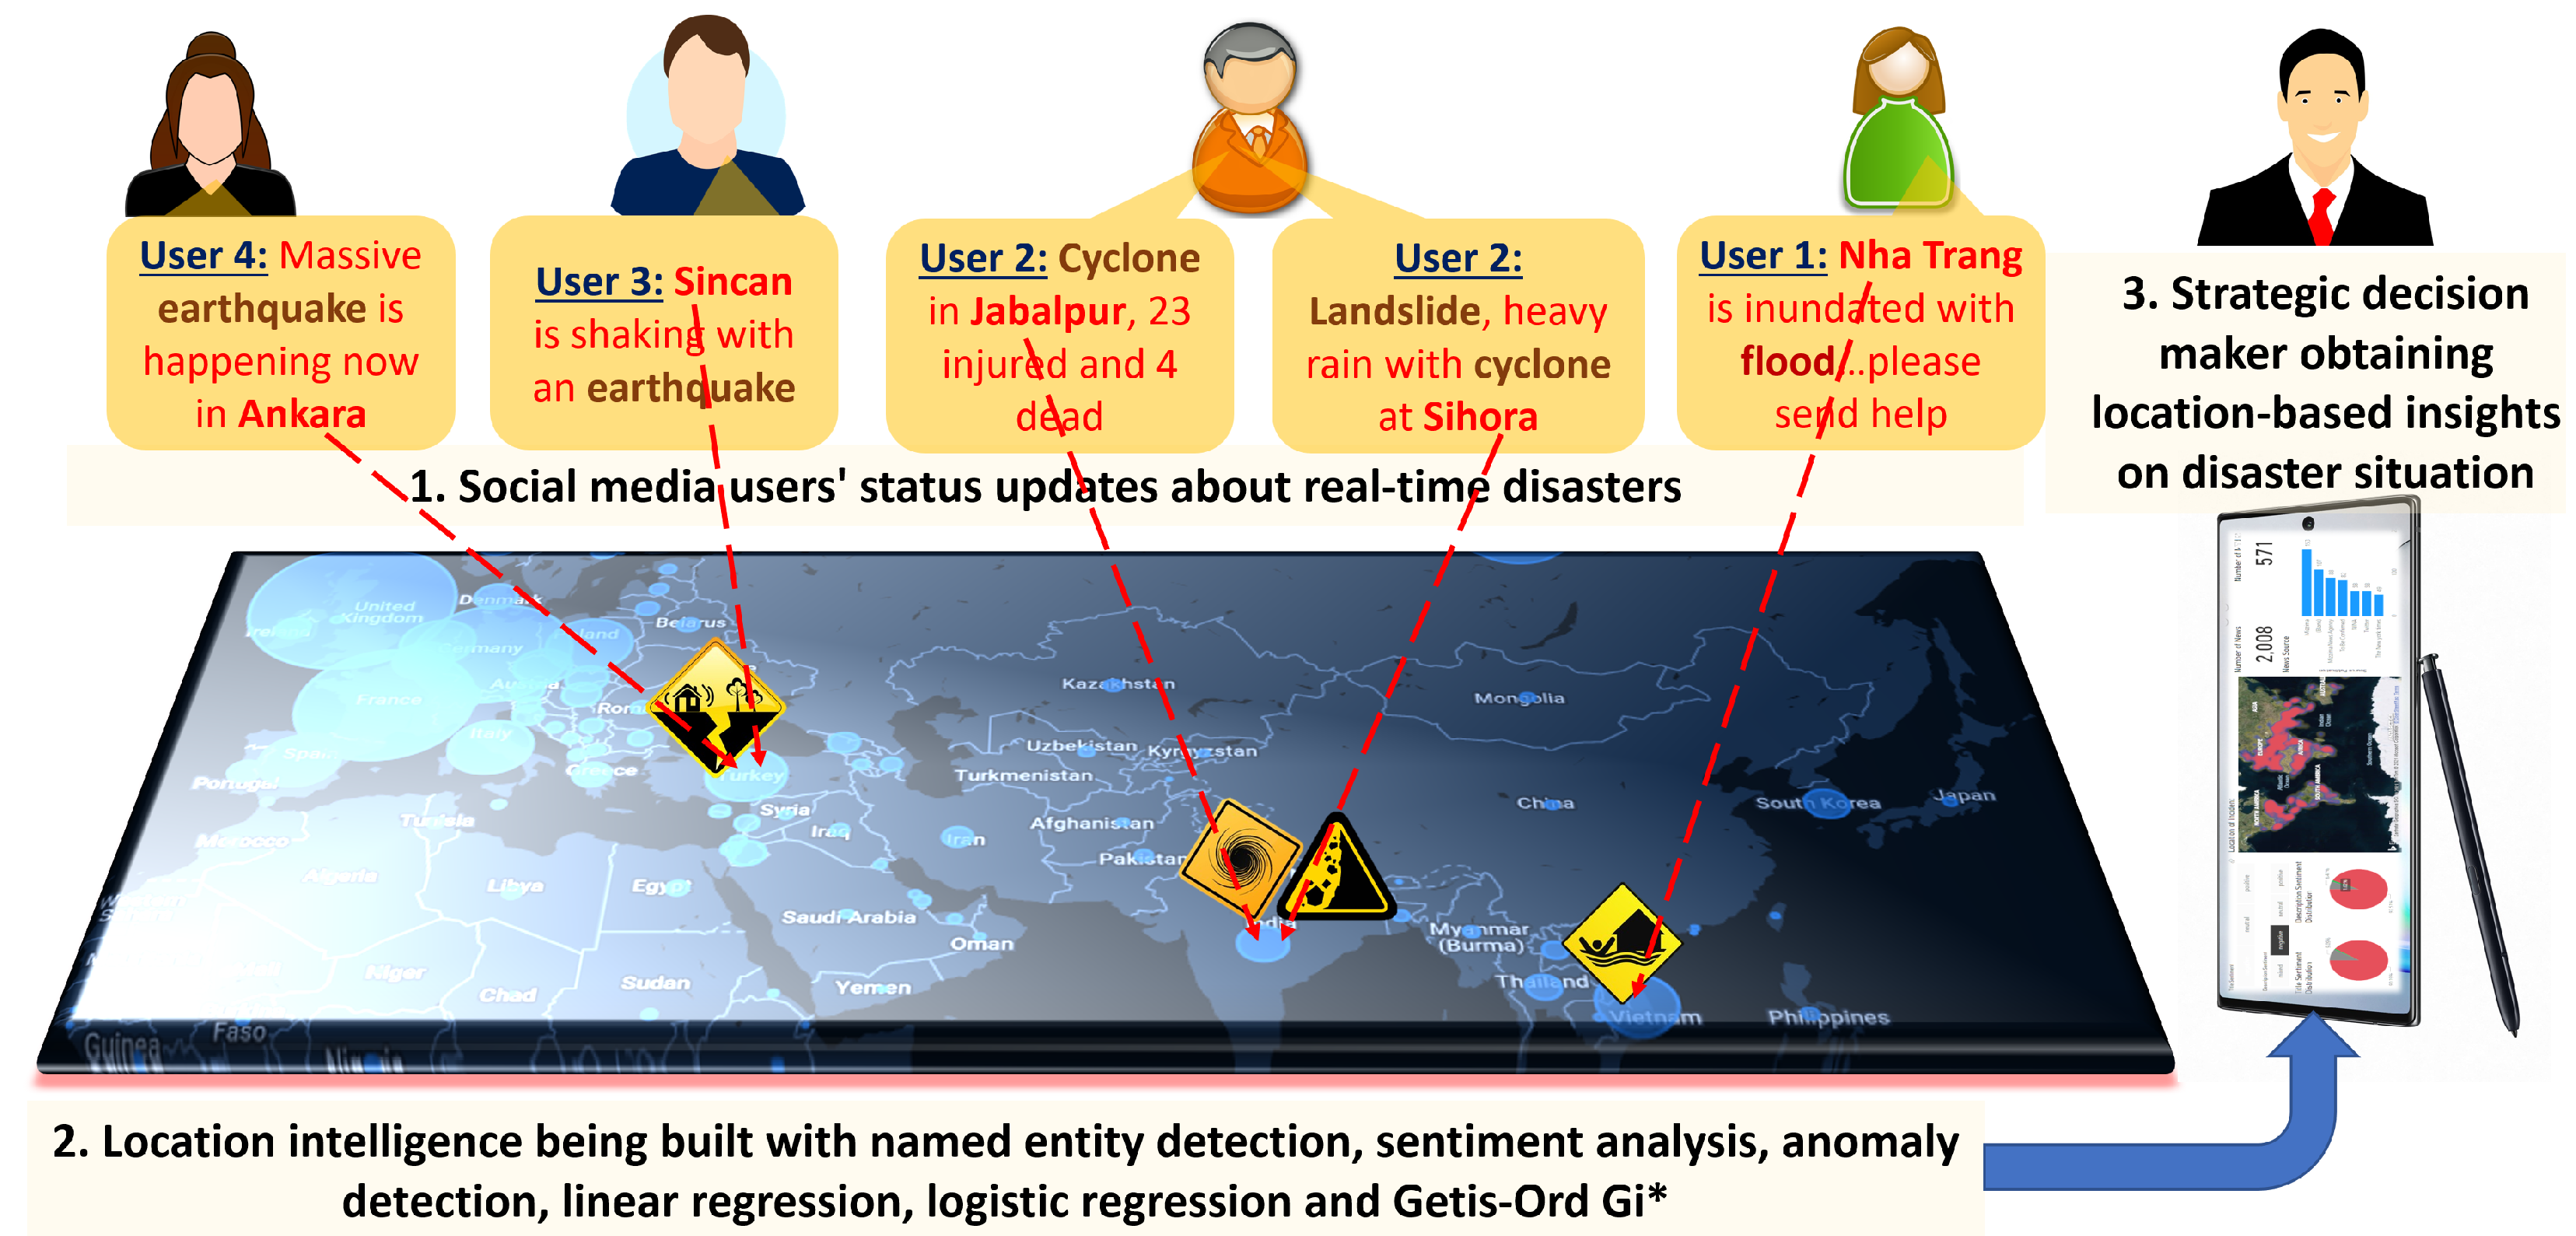
The impact of this research is substantial, contributing to both theoretical and practical advancements in disaster intelligence. By leveraging open-source data and advanced computational models, this study enhances situational awareness, improves predictive accuracy, and promotes collaborative research in disaster management (as shown in
Figure 1). The proposed framework facilitates real-time monitoring and decision-making, reducing disaster response time and enabling proactive disaster management through accurate risk assessment and timely situational awareness. Additionally, the integration of multimodal data analytics fosters a more comprehensive understanding of disaster events, supporting evidence-based policy formulation and resource allocation. The open-source nature of the framework promotes global collaboration, enabling researchers and practitioners worldwide to build upon and extend this work for region-specific applications.
This study not only advances the field of open-source disaster intelligence but also contributes to building resilient communities through enhanced disaster preparedness and mitigation strategies. By leveraging the power of open-source data and advanced computational models, this research paves the way for more inclusive and collaborative disaster management solutions. The key contributions of this study are summarized as follows:
Theoretical contribution to open-source disaster intelligence: Establishes a comprehensive framework for integrating geospatial clustering, temporal pattern analysis, and multimodal data integration in open-source disaster intelligence, bridging the gap between real-time disaster event tracking and AI-driven predictive analytics.
Largest ai-driven disaster intelligence dataset: Collected and processed 1.25 million news articles from 444 global news portals, identifying 17,884 disaster-related reports across 185 countries and 6068 unique locations over 514 days (from 27 September 2023 to 26 February 2025). Dataset available at
https://github.com/DrSufi/NewsDisaster (accessed on 15 March 2025).
High-precision predictive disaster forecasting: Implemented ARIMA (2, 1, 2) modeling, achieving a mean squared error (MSE) of 823,761, along with Fourier transform and seasonal decomposition (STL) to detect cyclical disaster patterns, improving early warning capabilities.
Empirical identification of global disaster hotspots: Determined the top three most disaster-affected countries—USA (6548 disasters), India (1393 disasters), and Australia (1260 disasters)—and confirmed through geospatial clustering that North America, South Asia, and Australia are the most disaster-prone regions.
Comprehensive analysis of disaster types and frequency: Identified the three most frequent disasters—hurricanes/typhoons/cyclones (5227 occurrences), floods (3360 occurrences), and wildfires/bushfires (2724 occurrences)—providing critical insights for disaster preparedness and mitigation strategies.
2. Contextual Background
Open-source disaster intelligence (OSDI) has emerged as a pivotal area of research, leveraging the power of publicly available data, social media analytics, and advanced computational models to enhance situational awareness, disaster preparedness, and mitigation strategies. This section critically examines the relevant literature, categorizing the studies into four main areas: importance and requirements of open-source disaster intelligence, unique methodologies in open-source disaster intelligence, data requirements, and drawbacks associated with open-source disaster intelligence.
2.1. Importance and Requirements of Open-Source Disaster Intelligence
The significance of open-source disaster intelligence lies in its ability to democratize disaster data access, thereby enhancing situational awareness and decision-making for a broader audience, including governments, NGOs, and local communities. The use of open-source platforms reduces dependency on proprietary systems and facilitates collaborative disaster management strategies.
Ref. [
1] emphasized the need for automated machine learning algorithms to extract actionable insights from global disaster data, highlighting the critical role of open-source systems in real-time disaster monitoring and decision support systems. Ref. [
2] explored flood detection using Twitter streams, demonstrating how open-source tools can be leveraged for real-time disaster detection and response. Similarly, Ref. [
3] discussed the importance of social media analytics in understanding disaster-related misinformation, advocating for open-source frameworks to enhance data credibility and accuracy.
Further, Ref. [
4] demonstrated the efficacy of open-source image analysis tools for landslide mapping, emphasizing the role of collaborative platforms in geospatial disaster intelligence. Ref. [
16] illustrated the importance of open-source inventory systems for long-term disaster data curation and analysis, thereby supporting sustainable disaster management.
The systematic review by Ref. [
5] provided a comprehensive overview of open-source disaster intelligence dimensions, advocating for a standardized framework to integrate social media data and traditional disaster reports. Ref. [
6] further underscored the importance of multimodal analytics using open-source transformer models, emphasizing cross-lingual capabilities in global disaster detection.
Ref. [
17] contributed to the importance of open-source disaster intelligence by presenting a global dataset of tropical cyclone measurements, which is crucial for comprehensive disaster analysis. Additionally, refs. [
18,
19] highlighted the importance of systematic review methodologies and academic search systems, emphasizing the need for open-access disaster data repositories to enhance collaborative research.
Other studies, such as [
20], demonstrated the significance of transformer-deep neural network models in Twitter disaster detection, showcasing the potential of open-source platforms in contextual disaster intelligence. Ref. [
7] highlighted the need for multimodal tweet classification in disaster response systems, advocating for open-source NLP models to improve disaster communication and sentiment analysis.
Ref. [
21] presented a decision support system that integrates live Twitter feeds for disaster monitoring, showcasing the scalability and adaptability of open-source platforms for real-time disaster intelligence. Ref. [
22] proposed the use of recurrent GAN models to augment disaster displacement data, emphasizing the importance of open-source synthetic data generation for comprehensive disaster analytics.
2.2. Unique Methodologies in Open-Source Disaster Intelligence
Open-source disaster intelligence employs diverse methodologies to enhance disaster detection, prediction, and response. These methodologies primarily utilize advanced natural language processing (NLP), machine learning (ML), and deep learning models integrated with open-source platforms.
Ref. [
23] introduced AI-SocialDisaster, a novel AI-based software that leverages NLP and sentiment analysis to identify and analyze natural disasters from social media posts, demonstrating the potential of open-source transformer architectures in disaster analytics. Ref. [
24] proposed TPredDis, a unique hybrid model that combines semantic intelligence and machine learning for disaster prediction using social media data.
Ref. [
6] introduced a visual and linguistic transformer fusion model for multimodal tweet classification, highlighting the power of open-source models in integrating text and image data for comprehensive disaster intelligence. Ref. [
7] implemented a bidirectional attention model for multimodal tweet classification, emphasizing the role of open-source transformer architectures in cross-lingual disaster analytics.
Ref. [
25] employed entity-based transformer methods to detect emergency events on social media, showcasing the effectiveness of open-source NLP models for event detection and classification. Ref. [
20] demonstrated the utility of deep neural networks integrated with transformer architectures in Twitter-based disaster detection, highlighting the scalability of open-source models for global disaster intelligence.
Ref. [
26] proposed Topic2Labels, a framework that combines LDA topics with deep learning models for classifying social media data during crises, showcasing the potential of hybrid methodologies in open-source disaster intelligence. Ref. [
27] developed a novel framework for assessing the criticality of retrieved disaster information, emphasizing the role of open-source decision support systems in disaster management.
Ref. [
28] introduced AI-based location intelligence for automated disaster monitoring, highlighting the role of transformer architectures in enhancing situational awareness. Furthermore, Ref. [
29] proposed a pre-trained ensemble model for emotion identification during crises, showcasing the integration of social media sentiment analysis in disaster intelligence.
2.3. Data Requirements of Open-Source Disaster Intelligence
Data requirements for open-source disaster intelligence encompass real-time social media data, historical event datasets, and multimodal data integration. The fusion of multiple data sources is essential for accurate disaster prediction, situational awareness, and risk assessment.
Ref. [
30] highlighted the importance of the NASA Global Landslide Catalog as a foundational dataset for disaster intelligence, advocating for open-access data repositories to enhance collaborative research. Ref. [
31] introduced AI-Landslide, a tool that extracts insights from global landslide data using AI, demonstrating the importance of open-source datasets for comprehensive disaster analysis.
Ref. [
21] presented a decision support system utilizing live Twitter feeds, showcasing the need for real-time social media integration in open-source disaster intelligence. Ref. [
22] proposed RGAN-LS, a recurrent GAN model that augments disaster displacement data, highlighting the role of open-source synthetic data generation for enhancing predictive analytics.
Ref. [
32] introduced a metadata-driven knowledge graph for disaster tweets, emphasizing the importance of structured social media data in open-source disaster analytics.
2.4. Drawbacks of Open-Source Disaster Intelligence
Despite its advantages, open-source disaster intelligence faces significant challenges, particularly concerning ethical issues, data credibility, and model limitations.
Ref. [
8] provided a comprehensive survey on hallucination in natural language generation models, highlighting the risks associated with transformer models in disaster intelligence. Ref. [
9] explored sycophantic behavior in language models, revealing potential biases in disaster detection models.
Ref. [
10] highlighted the prevalence of fake accounts and misinformation on social media platforms, emphasizing the ethical challenges of using open-source social media data for disaster intelligence. Ref. [
33] discussed the credibility issues in disaster-related social media analytics, advocating for enhanced data verification mechanisms.
Ref. [
34] discussed ethical concerns regarding data privacy and misinformation, emphasizing the need for ethical frameworks in open-source disaster intelligence. Ref. [
35] highlighted cross-lingual biases in query-based summarization models, showcasing the challenges of using open-source transformer models in multilingual disaster analytics.
This comprehensive review contextualizes the significance of open-source disaster intelligence, rationalizes the methodologies employed, and critically evaluates the data requirements and challenges. This study aims to build upon this body of knowledge by integrating advanced geospatial and time series models, leveraging open-source news data for real-time disaster analytics.
4. Experimentation
In this study, this research employed AI-driven automation to systematically collect data from 444 prominent online news portals, including major outlets such as CNN, BBC, CBS News, The Guardian, Daily Mail UK, NDTV, and Times of India. The system was designed to extract disaster news from multiple sources, including web scraping, RSS feeds, and event-based APIs, ensuring comprehensive coverage of disaster events worldwide. Web scraping involved parsing HTML elements to extract key information such as headlines, news content, and publication dates, while RSS feeds and event APIs provided structured data streams for real-time updates. By sourcing data from a diverse and extensive range of news media across different regions worldwide (e.g., US, UK, Australia, India, China), this study achieved a more credible and comprehensive open-source disaster analytics framework compared to previous research that predominantly relied on social media-driven data.
Between 27 September 2023 and 26 February 2025, a total of 1.25 million news articles were captured, out of which 17,884 articles were classified as disaster-related using GPT models. Over the course of 518 days, news reports were systematically aggregated and analyzed in real time, necessitating the deployment of multiple generative language models to ensure computational efficiency and contextual accuracy. The selection of models was contingent upon their availability and technical capabilities during the respective timeframes. Specifically, from 27 September 2023 to 17 June 2024, GPT-3.5 Turbo was employed, followed by GPT-4.0 from 17 June 2024 onward, marking a transition to a more advanced model with improved reasoning capabilities. Subsequently, on 4 December 2024, the analysis framework adopted Google Gemini 1.5 Flash API, a significantly more stable language model with an expanded token capacity of up to 1,048,576 tokens, thereby facilitating the processing of extensive textual corpora with enhanced contextual depth and computational robustness. The 17,884 articles covered global disaster events, including earthquakes, floods, landslides, cyclones, and wildfires. Notably, the GPT classification process identified disaster events in 185 distinct countries and 6068 unique locations over a span of 514 days (approximately 17 months). This comprehensive geospatial and temporal intelligence provides an unprecedented level of insight, surpassing the capabilities demonstrated in previous studies. The classification process also identified the number of deaths, the number of injuries, the severity of the disaster, and the type of disaster. The categorization model was formulated as follows:
where
represents the category of the
ith news article,
is the content of the
ith news article, and
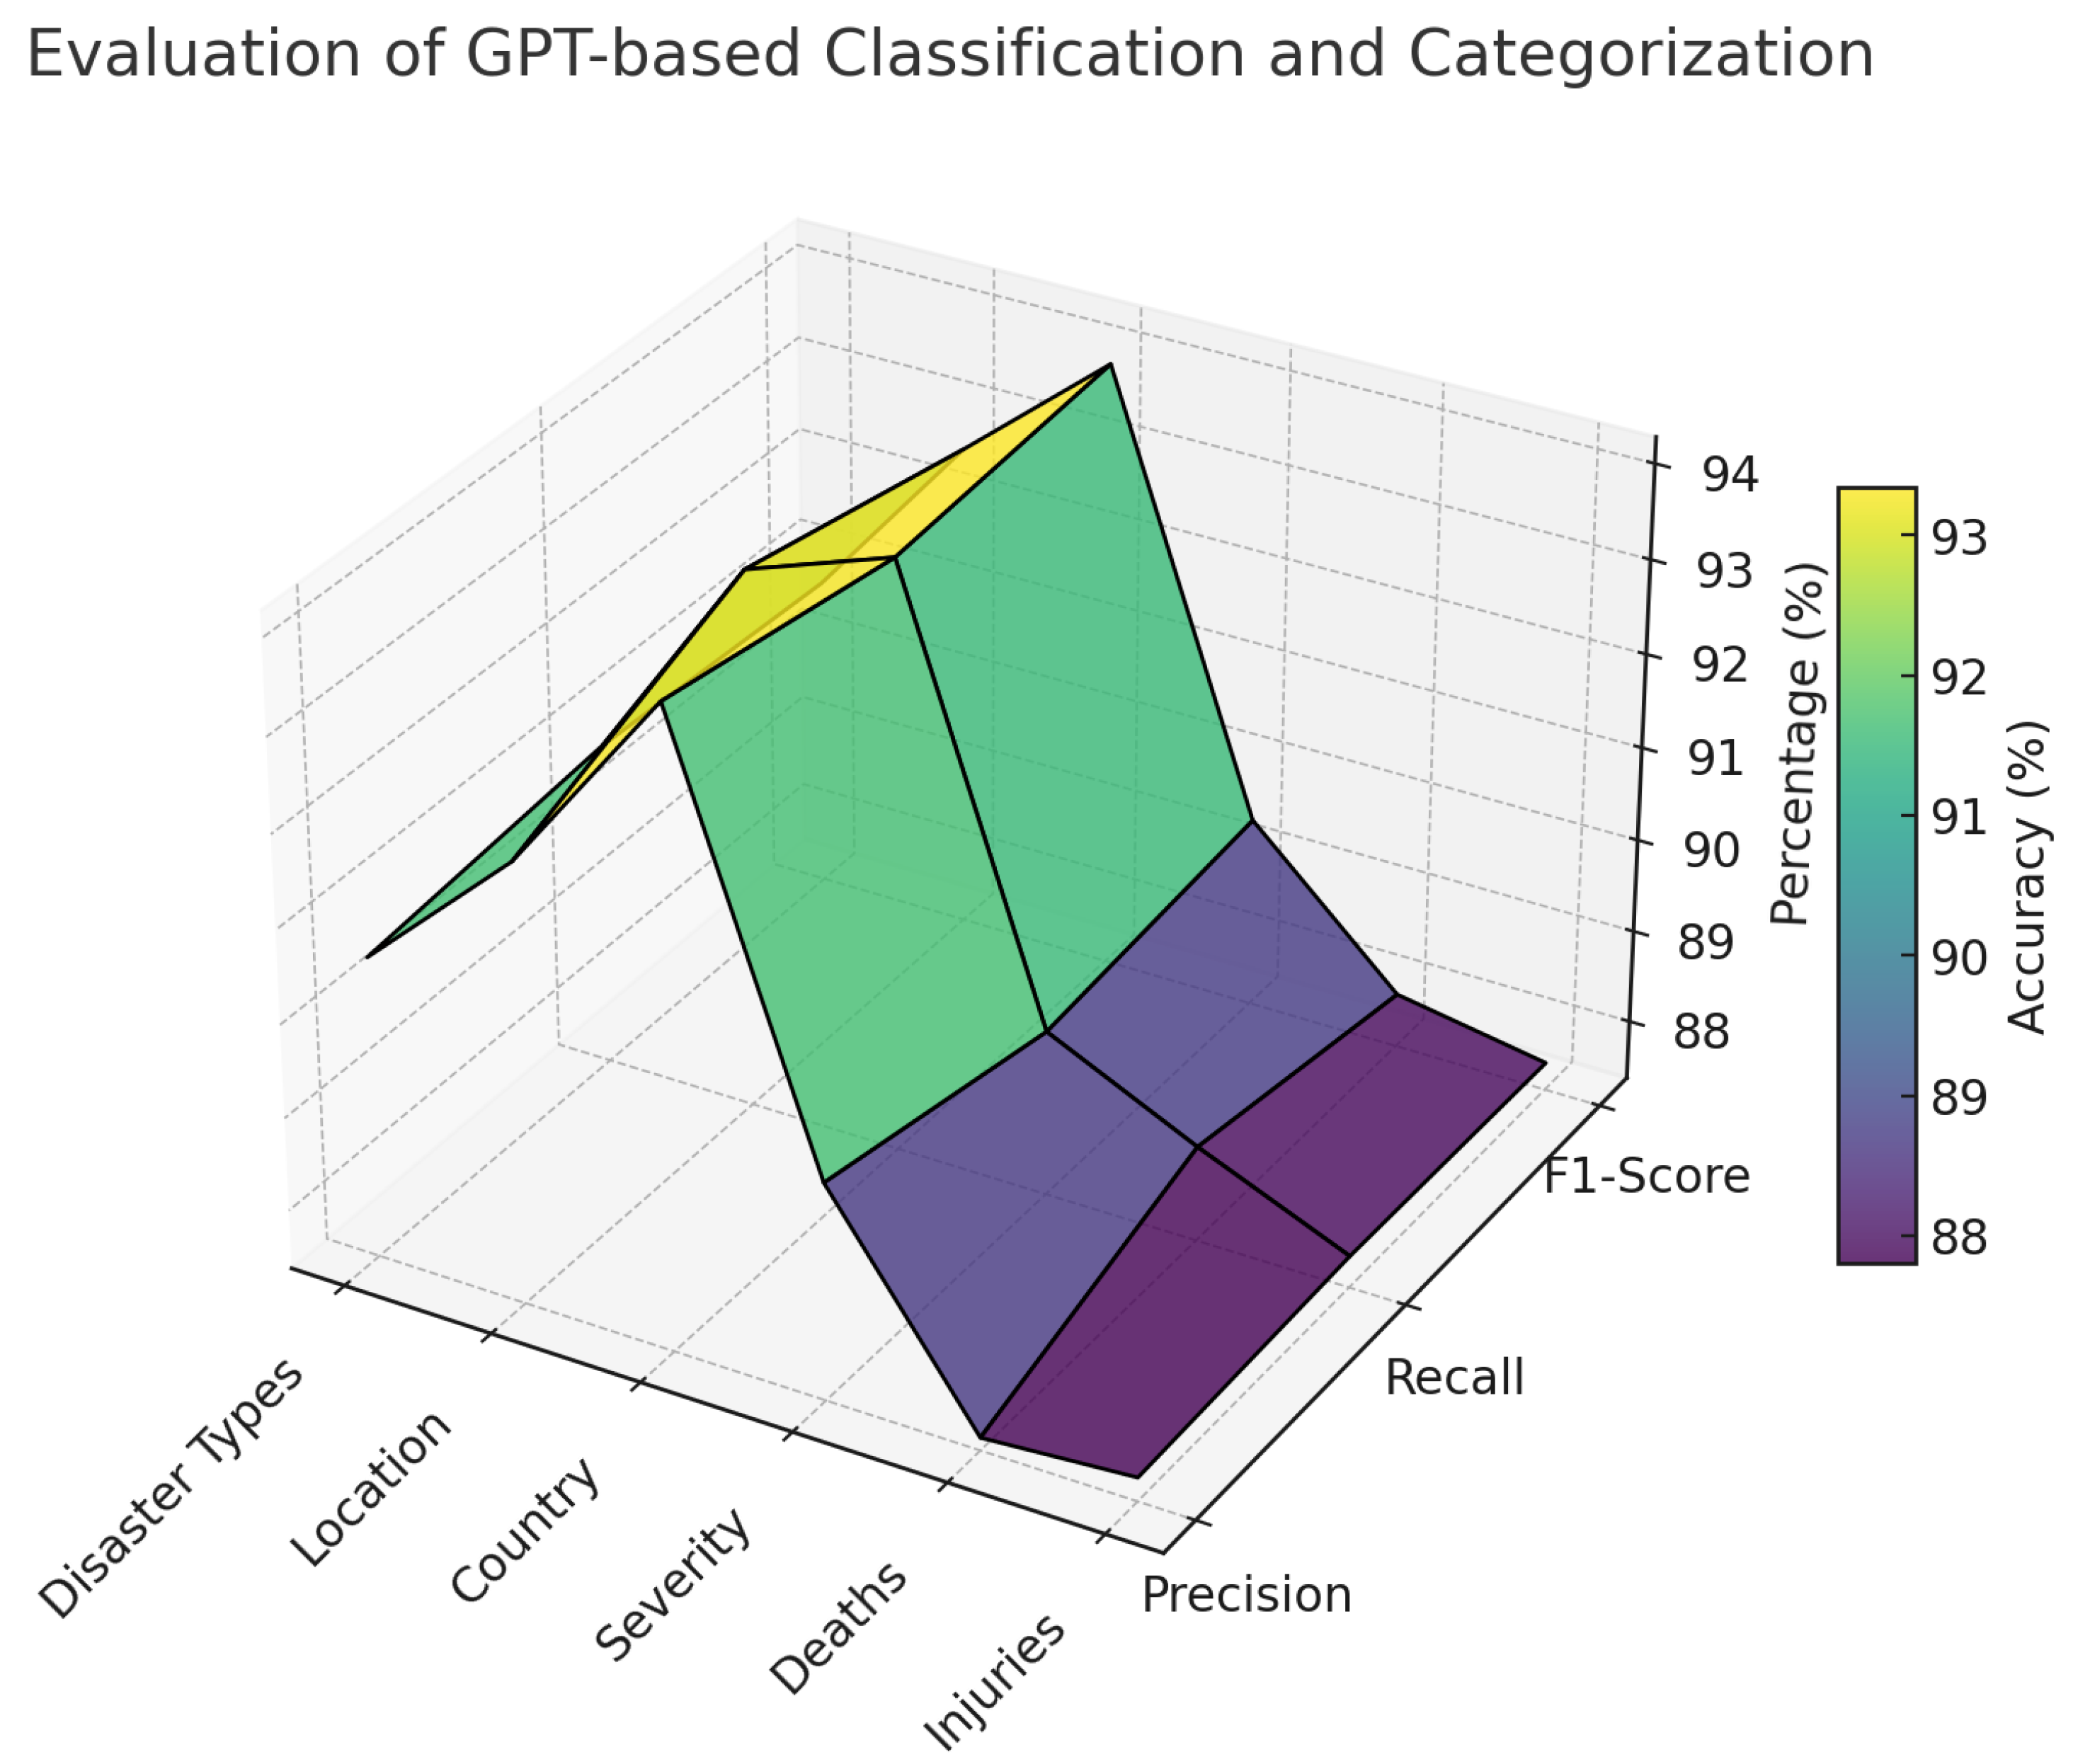
denotes the predefined classification parameters. As seen in
Figure 3, the 3D surface plot presents a comprehensive evaluation of the classification accuracy of the GPT-based model in systematically categorizing disaster-related information across six key dimensions: disaster types, location, country, severity, deaths, and injuries. The model’s classification efficacy is measured using precision, recall, and F1-score, with performance metrics ranging between 88% and 95%, demonstrating a high level of reliability in disaster intelligence extraction. The classification of country attains the highest accuracy, followed by location and disaster types, underscoring the model’s robust capacity to geospatially contextualize disaster events. In contrast, the accuracy for deaths and injuries is comparatively lower, reflecting the inherent complexities associated with extracting precise casualty figures from textual news reports. A significant factor contributing to this reduced accuracy is the frequent use of imprecise descriptors such as “several dozens”, “several hundreds”, or “several thousands” instead of explicit numerical values, thereby complicating automated data extraction and classification. The inclusion of a color legend further improves interpretability by visually delineating variations in accuracy levels, thereby underscoring both the strengths of the GPT model in disaster intelligence processing and the challenges associated with certain categorical classifications.
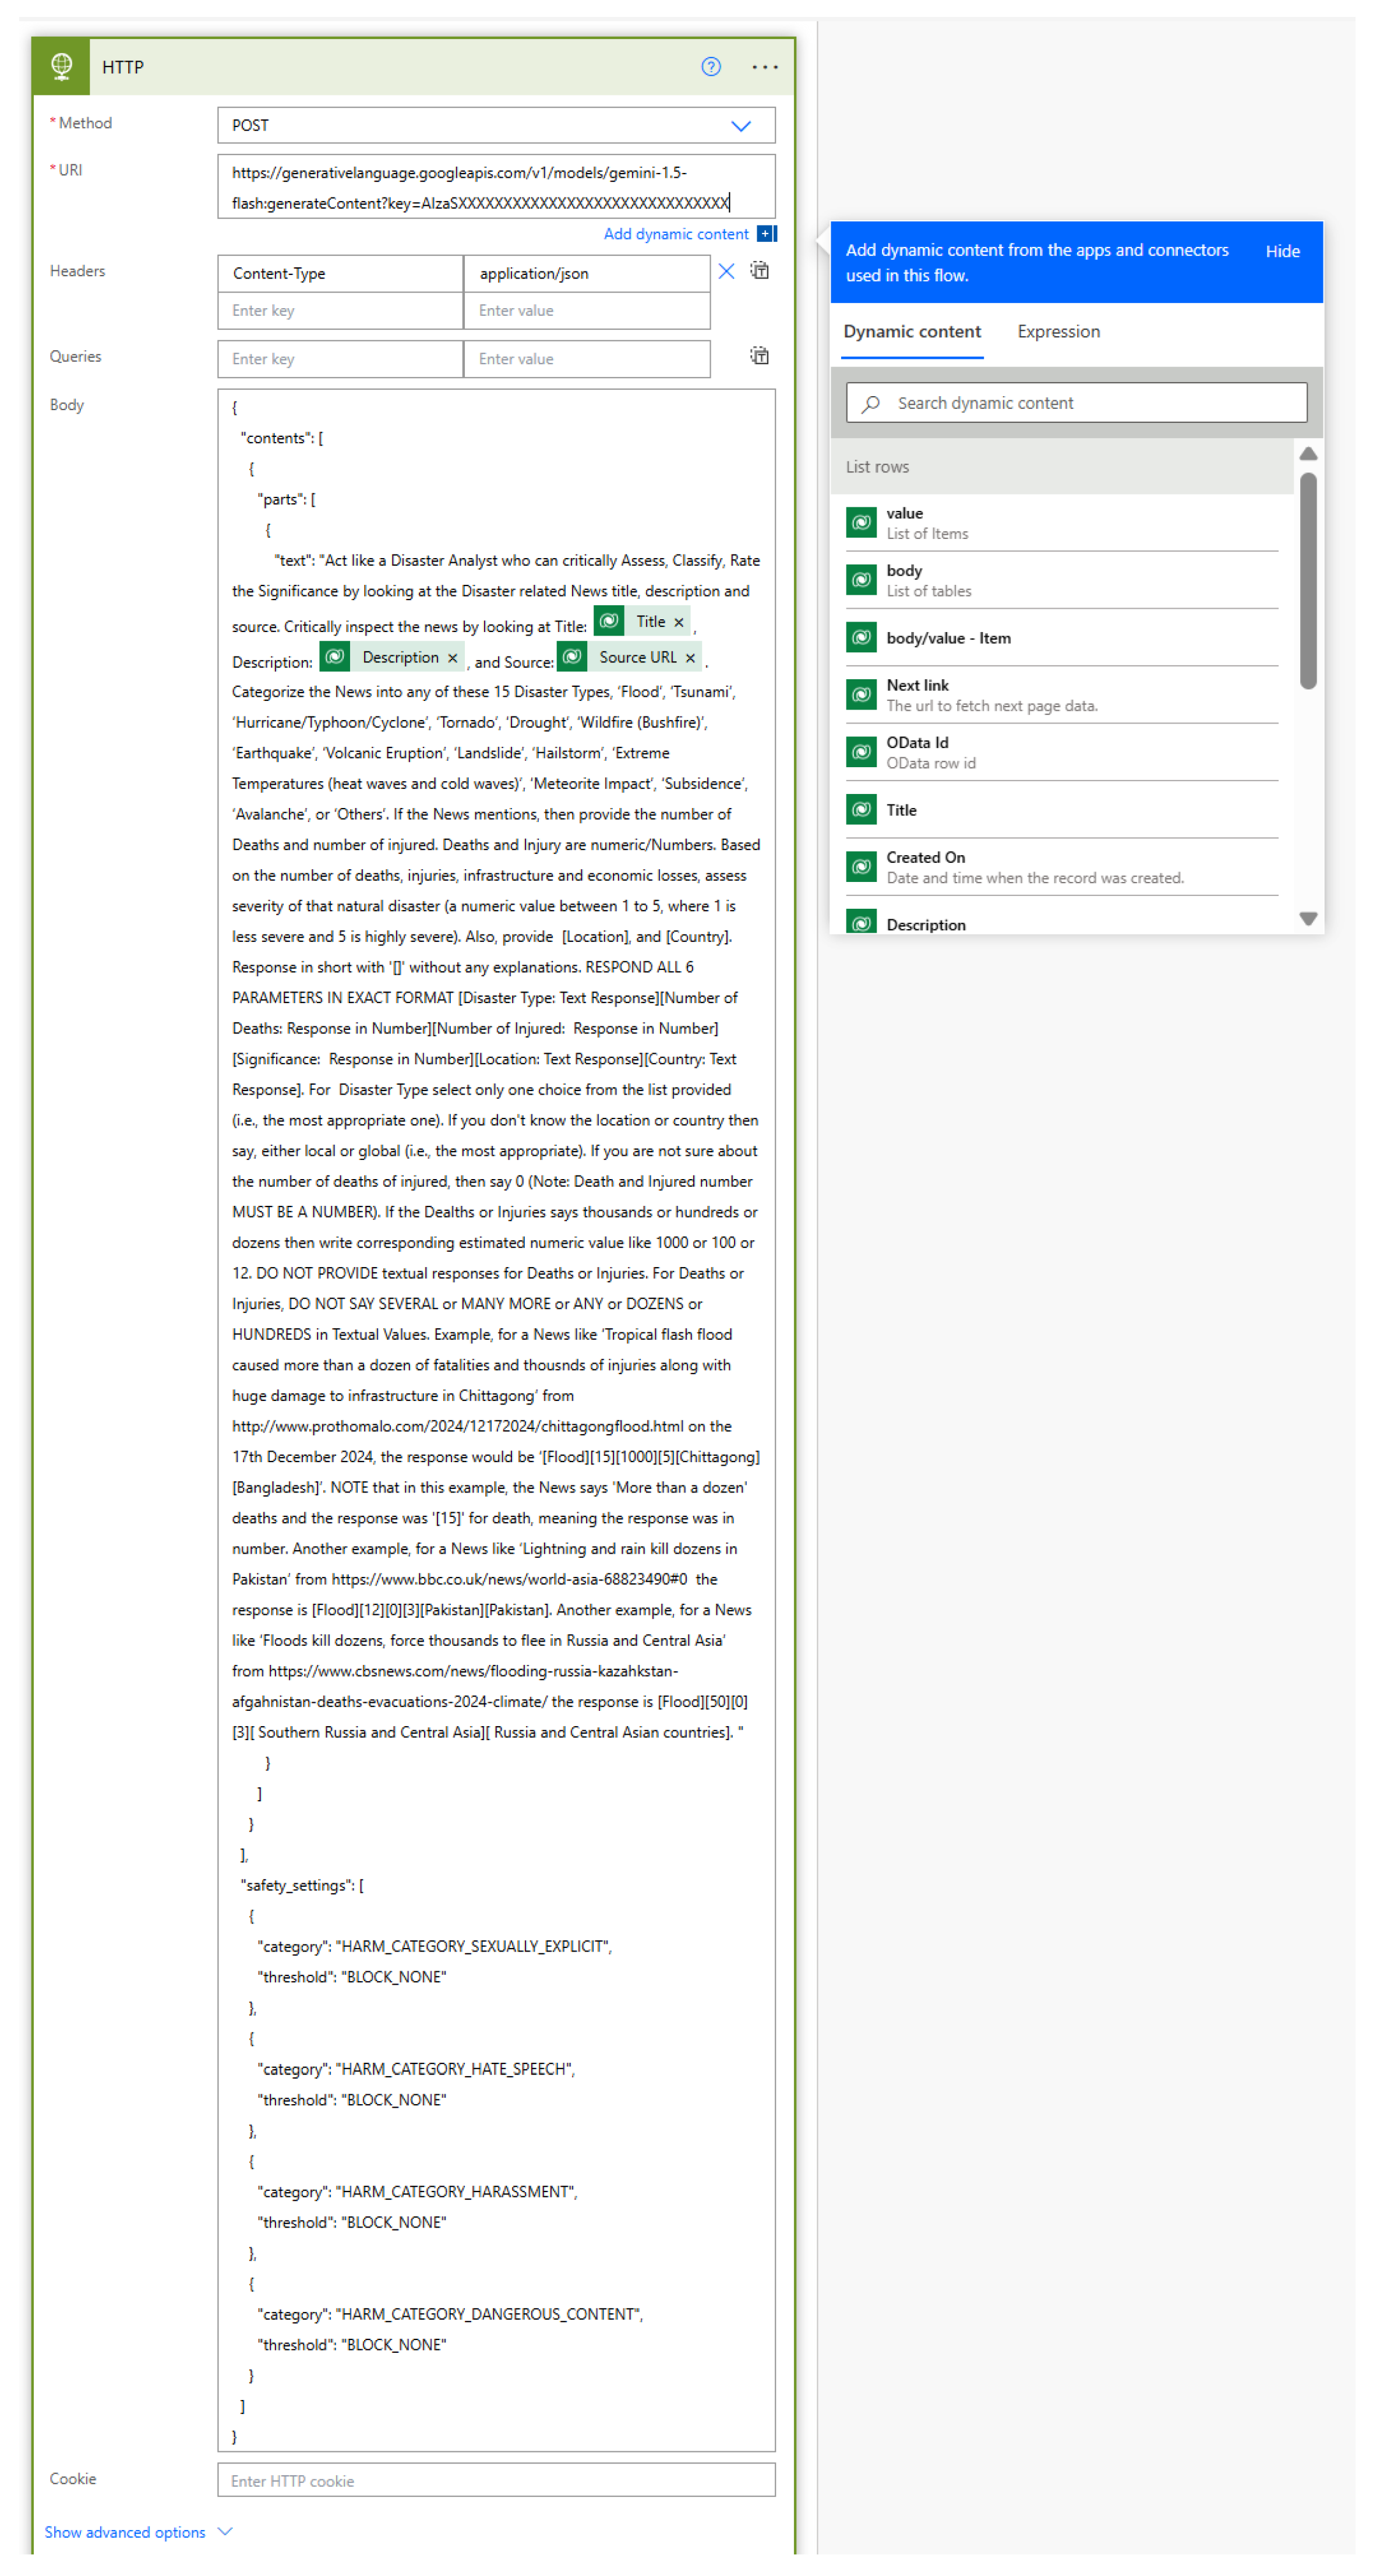
It should be noted that such a high level of predictive accuracy demonstrated by GPT-Classification (e.g., for country the F1-score reached up to 94.65%), because of sophisticated prompt engineering techniques. As seen from
Figure 4, the prompt was meticulously designed to guide the classification process by structuring disaster type selection within a predefined list of 15 distinct categories, including flood, tsunami, hurricane/typhoon/cyclone, tornado, drought, wildfire (bushfire), earthquake, volcanic eruption, landslide, hailstorm, extreme temperatures, meteorite impact, subsidence, avalanche, and others. Additionally, the prompt explicitly instructed the model to output disaster severity as a numerical value ranging from 1 to 5, ensuring consistency in severity classification. To address ambiguity in casualty reporting, the prompt incorporated specific guidelines on interpreting vague numerical references such as “Several Hundreds”, “Several Dozens”, or “Thousands”, standardizing their representation for structured data processing. Most importantly, the prompt enforced a rigid output format using square-bracketed structured outputs, with illustrative examples to maintain uniformity in extracted information.
After categorization, the structured data were stored in Microsoft Dataverse tables to maintain consistency and facilitate subsequent analysis. The structured dataset contained nine fields:
Event Date (crd69_eventdate): The date on which the disaster event occurred.
Disaster Type (crd69_disastertype): The category of the disaster (e.g., earthquake, flood, volcanic eruption).
Location (crd69_location): The specific location where the disaster occurred.
Country (crd69_country): The country in which the disaster took place, normalized for consistency.
Severity (crd69_severity): A numerical scale representing the severity of the disaster, ranging from 1 to 5.
Deaths (crd69_deaths): The number of deaths caused by the disaster.
Injuries (crd69_injuries): The number of people injured due to the disaster.
Source (crd69_source): The news source or portal from which the information was obtained.
Event Description (crd69_eventdescription): A textual description of the disaster event.
The structured dataset can be mathematically represented as:
where
represents the event date,
is the disaster type,
is the location,
is the country,
is the severity,
is the number of deaths,
is the number of injuries,
is the source,
is the event description, and
N is the total number of news articles.
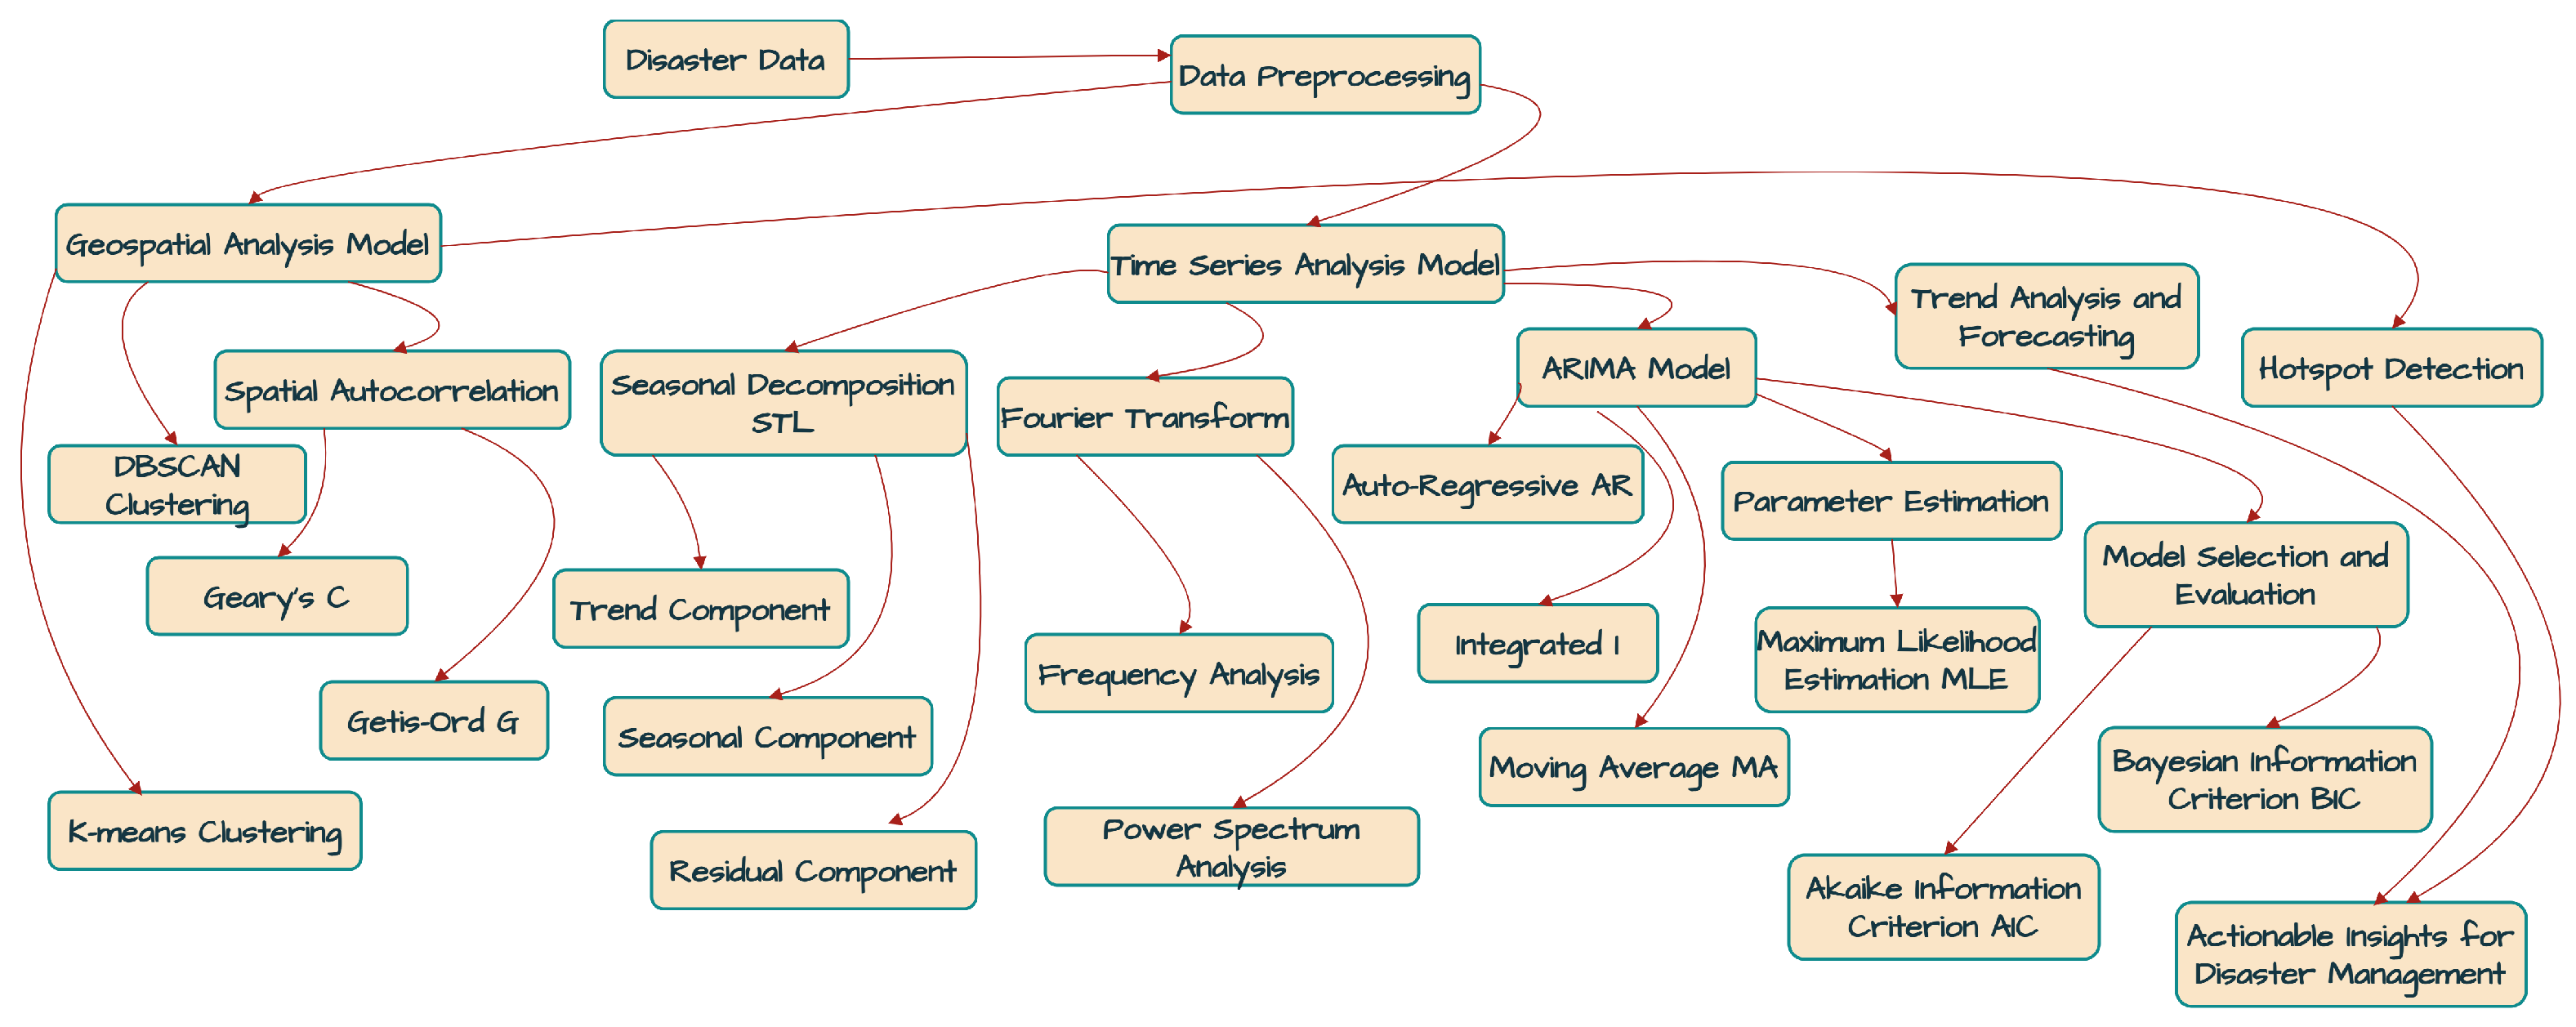
The structured dataset was analyzed using geospatial and time-series techniques. The geospatial analysis included hotspot detection and spatial autocorrelation to identify regions with high disaster intensity. Time-series analysis involved seasonal decomposition and ARIMA modeling to detect temporal patterns, trends, and cycles in disaster occurrences and severity. ARIMA assumes a stationary time series, requiring non-stationary data to be transformed, often through differencing. While effective for linear trends, differencing struggles with non-linear patterns and complex causal relationships [
41,
42].
Table 2 presents the summary statistics for the disaster dataset, focusing on the severity of disasters, the number of deaths, and the number of injuries. The dataset comprises 17,884 disaster events, with the severity scale ranging from 0 to 5. The average severity is 2.69, with a standard deviation of 0.92, indicating moderate variability. The number of deaths and injuries exhibits a high degree of variance, with a mean of 727.85 deaths and 18.10 injuries per disaster event. The maximum recorded deaths and injuries are 830,000 and 190,000, respectively, highlighting the catastrophic impact of some disaster events.
Table 3 illustrates the geographical distribution of disaster occurrences, highlighting the top seven countries most frequently affected. The United States leads the count with 6548 disaster events, followed by India and Australia, indicating significant geographical vulnerability in these regions. This spatial pattern may be attributed to climatic factors, population density, and urbanization trends, necessitating targeted disaster preparedness and mitigation strategies.
Table 4 provides a more granular view by presenting the specific locations with the highest number of disaster incidents. Notably, Los Angeles and Florida are prominent disaster hotspots, reflecting their susceptibility to wildfires, hurricanes, and other climatic hazards. The inclusion of “Global” and “Local” as categories suggests widespread media reporting, emphasizing the global relevance of disaster events. The concentration of disaster reports in specific urban areas underscores the need for localized risk management approaches.
Table 5 categorizes disaster events by type, revealing that hurricanes, typhoons, and cyclones collectively represent the most common disaster type, with 5227 occurrences. This is followed by floods and wildfires, emphasizing the impact of extreme weather events likely linked to climate change. The prevalence of earthquakes, landslides, and volcanic eruptions further highlights the significance of geological hazards. Understanding these patterns is crucial for prioritizing disaster risk reduction initiatives and allocating resources effectively.
Table 6 ranks news portals by the volume of disaster-related articles published, with “
www.dailymail.co.uk” (accessed 15 March 2025) leading the list. This ranking reflects the media’s role in shaping public perception and awareness of disaster events. The prominence of global news platforms, including BBC, The Guardian, and CBS News, indicates widespread international attention to disaster reporting. Analyzing news coverage patterns can provide valuable insights into information dissemination, influencing public response and policy-making.
The data presented in
Table 3,
Table 4,
Table 5 and
Table 6 collectively offer a comprehensive understanding of the spatial-temporal dynamics of disaster occurrences, types, and reporting patterns. The geographical hotspots identified in
Table 3 and
Table 4 align with known disaster-prone regions, reinforcing the necessity for region-specific disaster preparedness measures.
Table 5’s categorization of disaster types aids in risk assessment and resource allocation, while
Table 6’s analysis of news coverage highlights the importance of strategic communication in disaster management. Together, these insights contribute to a holistic approach to disaster risk reduction, policy formulation, and community resilience building.
In summary,
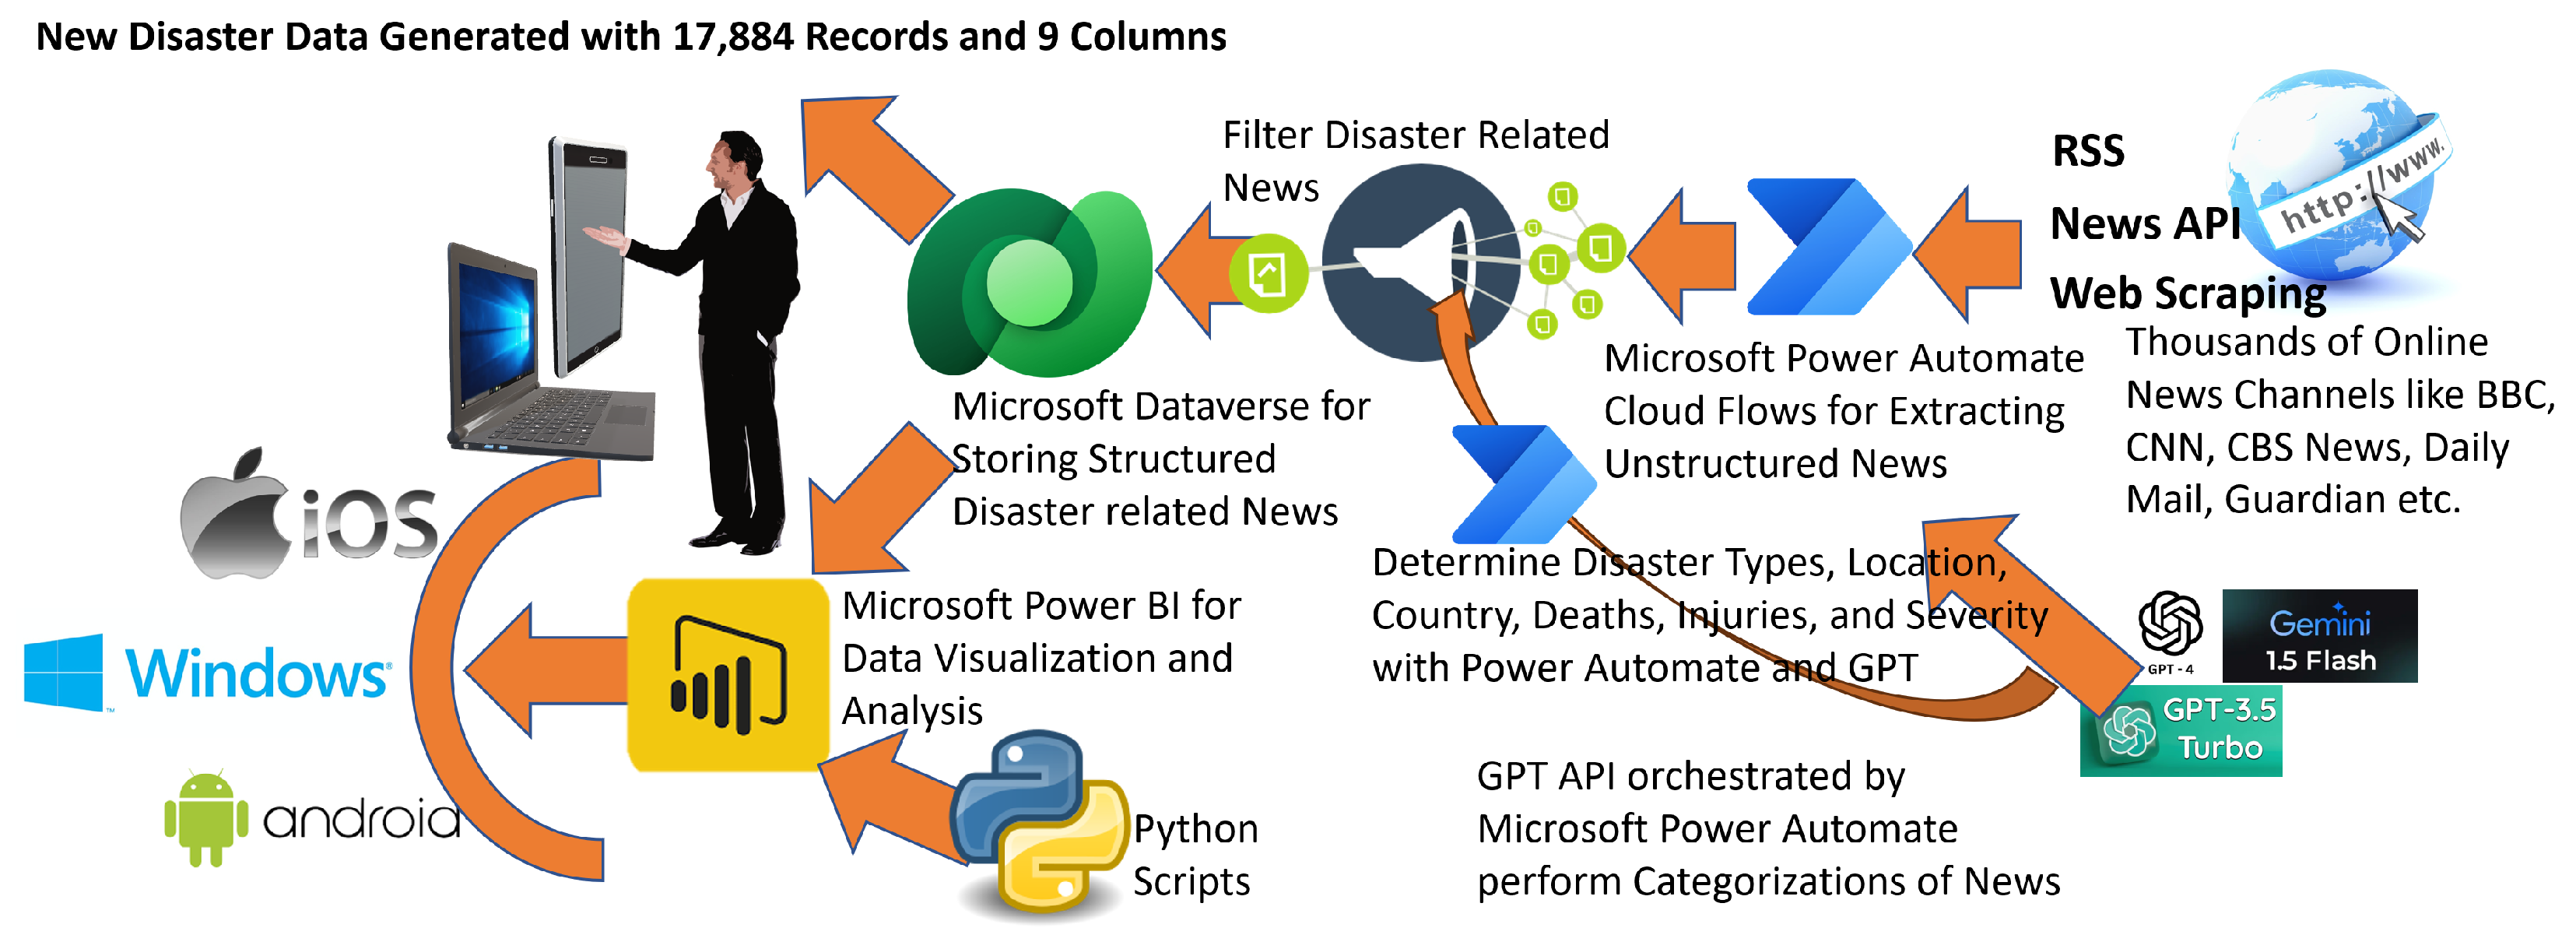
Figure 5 provides a comprehensive overview of the entire data processing pipeline, including the tools and technologies utilized to generate the new dataset comprising 17,884 rows and 9 columns. As depicted in this figure, unstructured news reports are sourced in real-time via RSS feeds, APIs, and web scraping from 444 online news sources using Microsoft Power Automate. The Power Automate workflow orchestrates the automated acquisition and categorization of disaster-related news by leveraging GPT-based models for classification.
Figure 4 illustrates the API invocation of GPT models within the Microsoft Power Automate flow, where disaster-related reports are systematically filtered and categorized. Microsoft Power Automate further distinguishes disaster-related news—belonging to one of the 15 predefined disaster categories—from non-disaster reports such as business, sports, and entertainment news.
Once structured, the processed dataset is stored within Microsoft Dataverse, facilitating seamless data retrieval and analysis. Subsequent analytical processes, including K-means clustering, DBSCAN, STL decomposition, Fourier transform, and ARIMA-based forecasting, are executed within the Microsoft Power BI environment, utilizing Python (version: 3.11) scripts for computational modeling. Finally, Microsoft Power BI disseminates the analytical outputs through the Microsoft Power BI service, making the reports accessible across multiple platforms and form factors, including mobile devices, tablets, and desktops.
This structured and categorized dataset enabled a comprehensive geospatial and temporal analysis of global disaster patterns, contributing to the identification of disaster-prone regions and the development of predictive models for future occurrences and severity levels. The dataset is available from
https://github.com/DrSufi/NewsDisaster (accessed 15 March 2025).
6. Discussion
The findings highlight the efficacy of advanced mathematical modeling techniques in disaster analytics. The integration of geospatial and time series methodologies facilitated a holistic analysis of disaster occurrences, uncovering complex spatial-temporal patterns. The implementation of dual clustering, combining K-means and DBSCAN, is essential for capturing both structured and unstructured spatial patterns in disaster intelligence. K-means clustering efficiently identifies well-defined disaster-prone regions by grouping locations with similar disaster frequencies and severity levels, whereas DBSCAN is employed to detect natural clusters of disaster occurrences without requiring a predefined number of clusters, making it particularly effective for identifying anomalous and irregular disaster distributions in sparsely populated or highly localized regions. The combination of these two clustering techniques ensures a comprehensive geospatial analysis, enabling both systematic hotspot identification and adaptive anomaly detection, thereby improving the accuracy and robustness of disaster intelligence. These insights provide a strategic foundation for policymakers and disaster management agencies to develop proactive mitigation and preparedness measures.
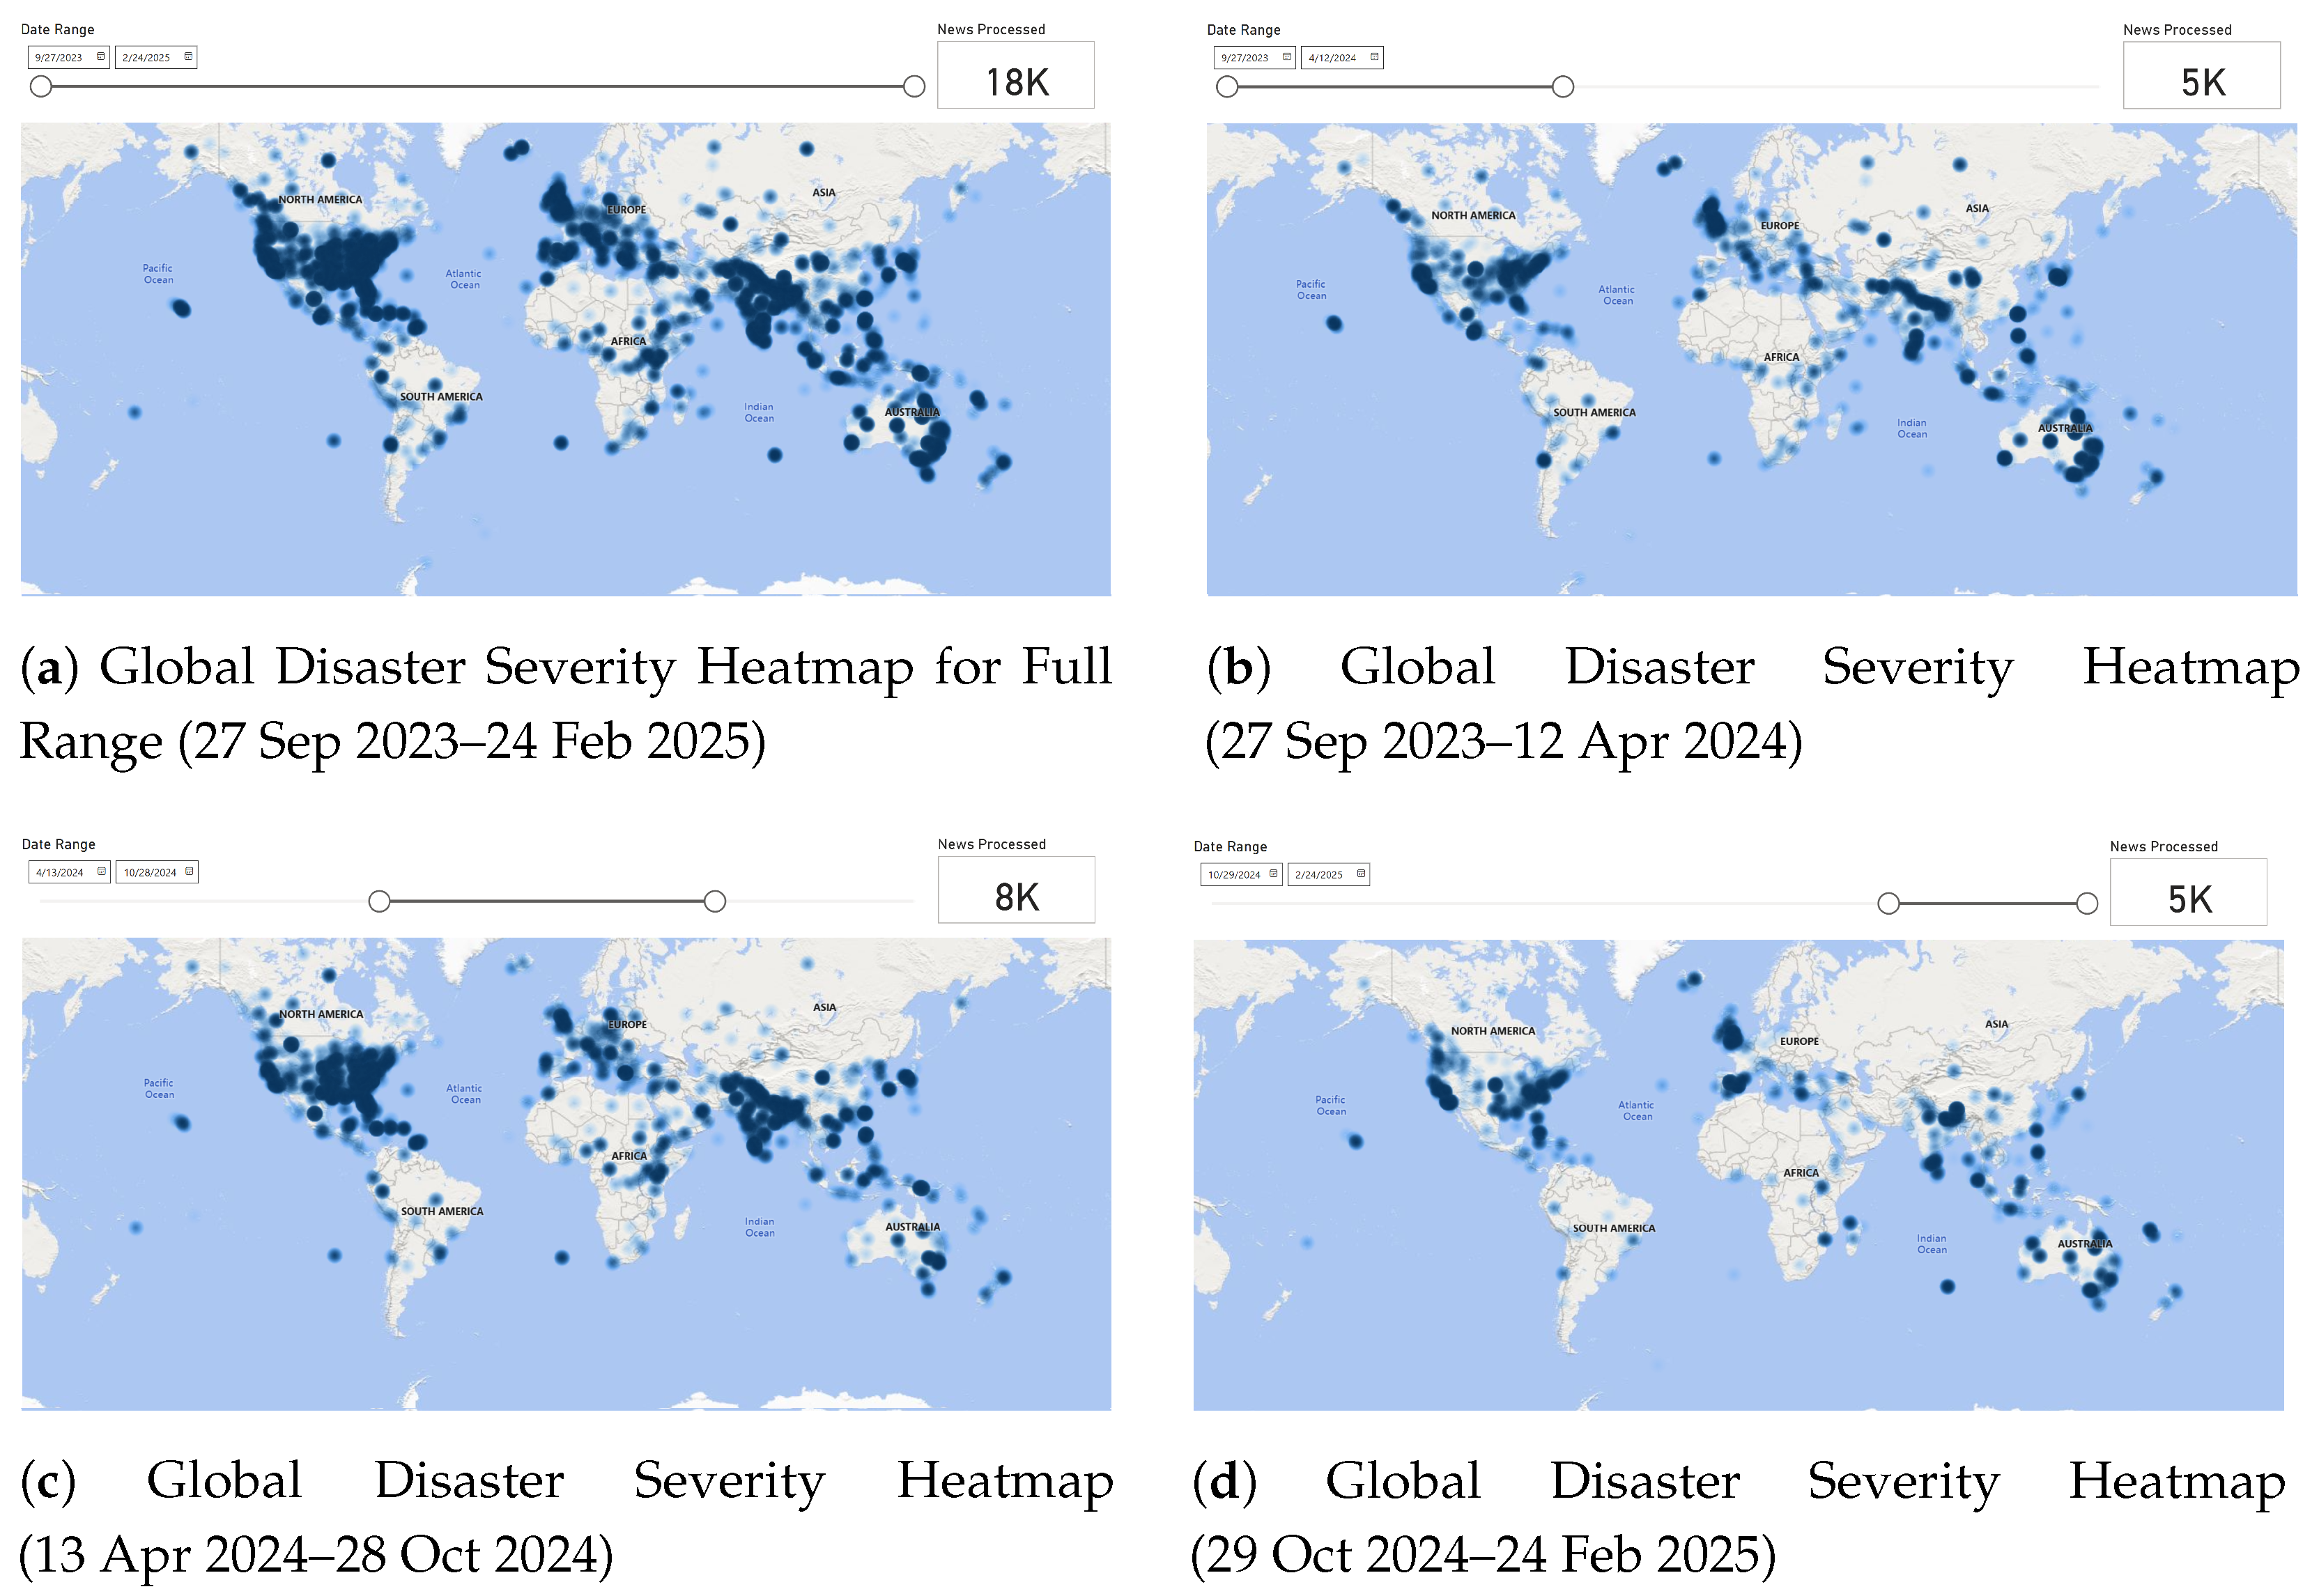
6.1. Temporal Analysis of Disaster Severity Using Heatmaps
To better understand the geospatial distribution of disaster severity across different time periods, heatmaps were generated by segmenting the dataset into three equal intervals. To analyze the temporal distribution of disaster severity, we defined the severity function at time
t:
where:
represents the severity of disasters at time t.
is the number of deaths at time t.
is the number of injuries at time t.
is the location of the disaster at time t.
The cumulative severity over a given time window
T is:
where
provides the total severity score over the selected period.
Figure 11 illustrates the progression of disaster occurrences from 27 September 2023 to 24 February 2025. The first subplot (a) presents the cumulative severity across the entire duration, highlighting high-impact disaster zones in North America, South Asia, Australia, and parts of Europe and Africa. The subsequent subplots detail the spatial evolution of disasters across three periods: September 2023–April 2024, April 2024–October 2024, and October 2024–February 2025. Notably, North America and South Asia remain consistently high-risk regions, while fluctuations in disaster intensity are observed in Europe and Australia across different timeframes. The segmentation of disaster occurrences facilitates a temporal understanding of hazard evolution, aiding policymakers in designing region-specific response strategies. These insights, derived from AI-driven disaster intelligence, play a crucial role in early warning systems and proactive disaster management.
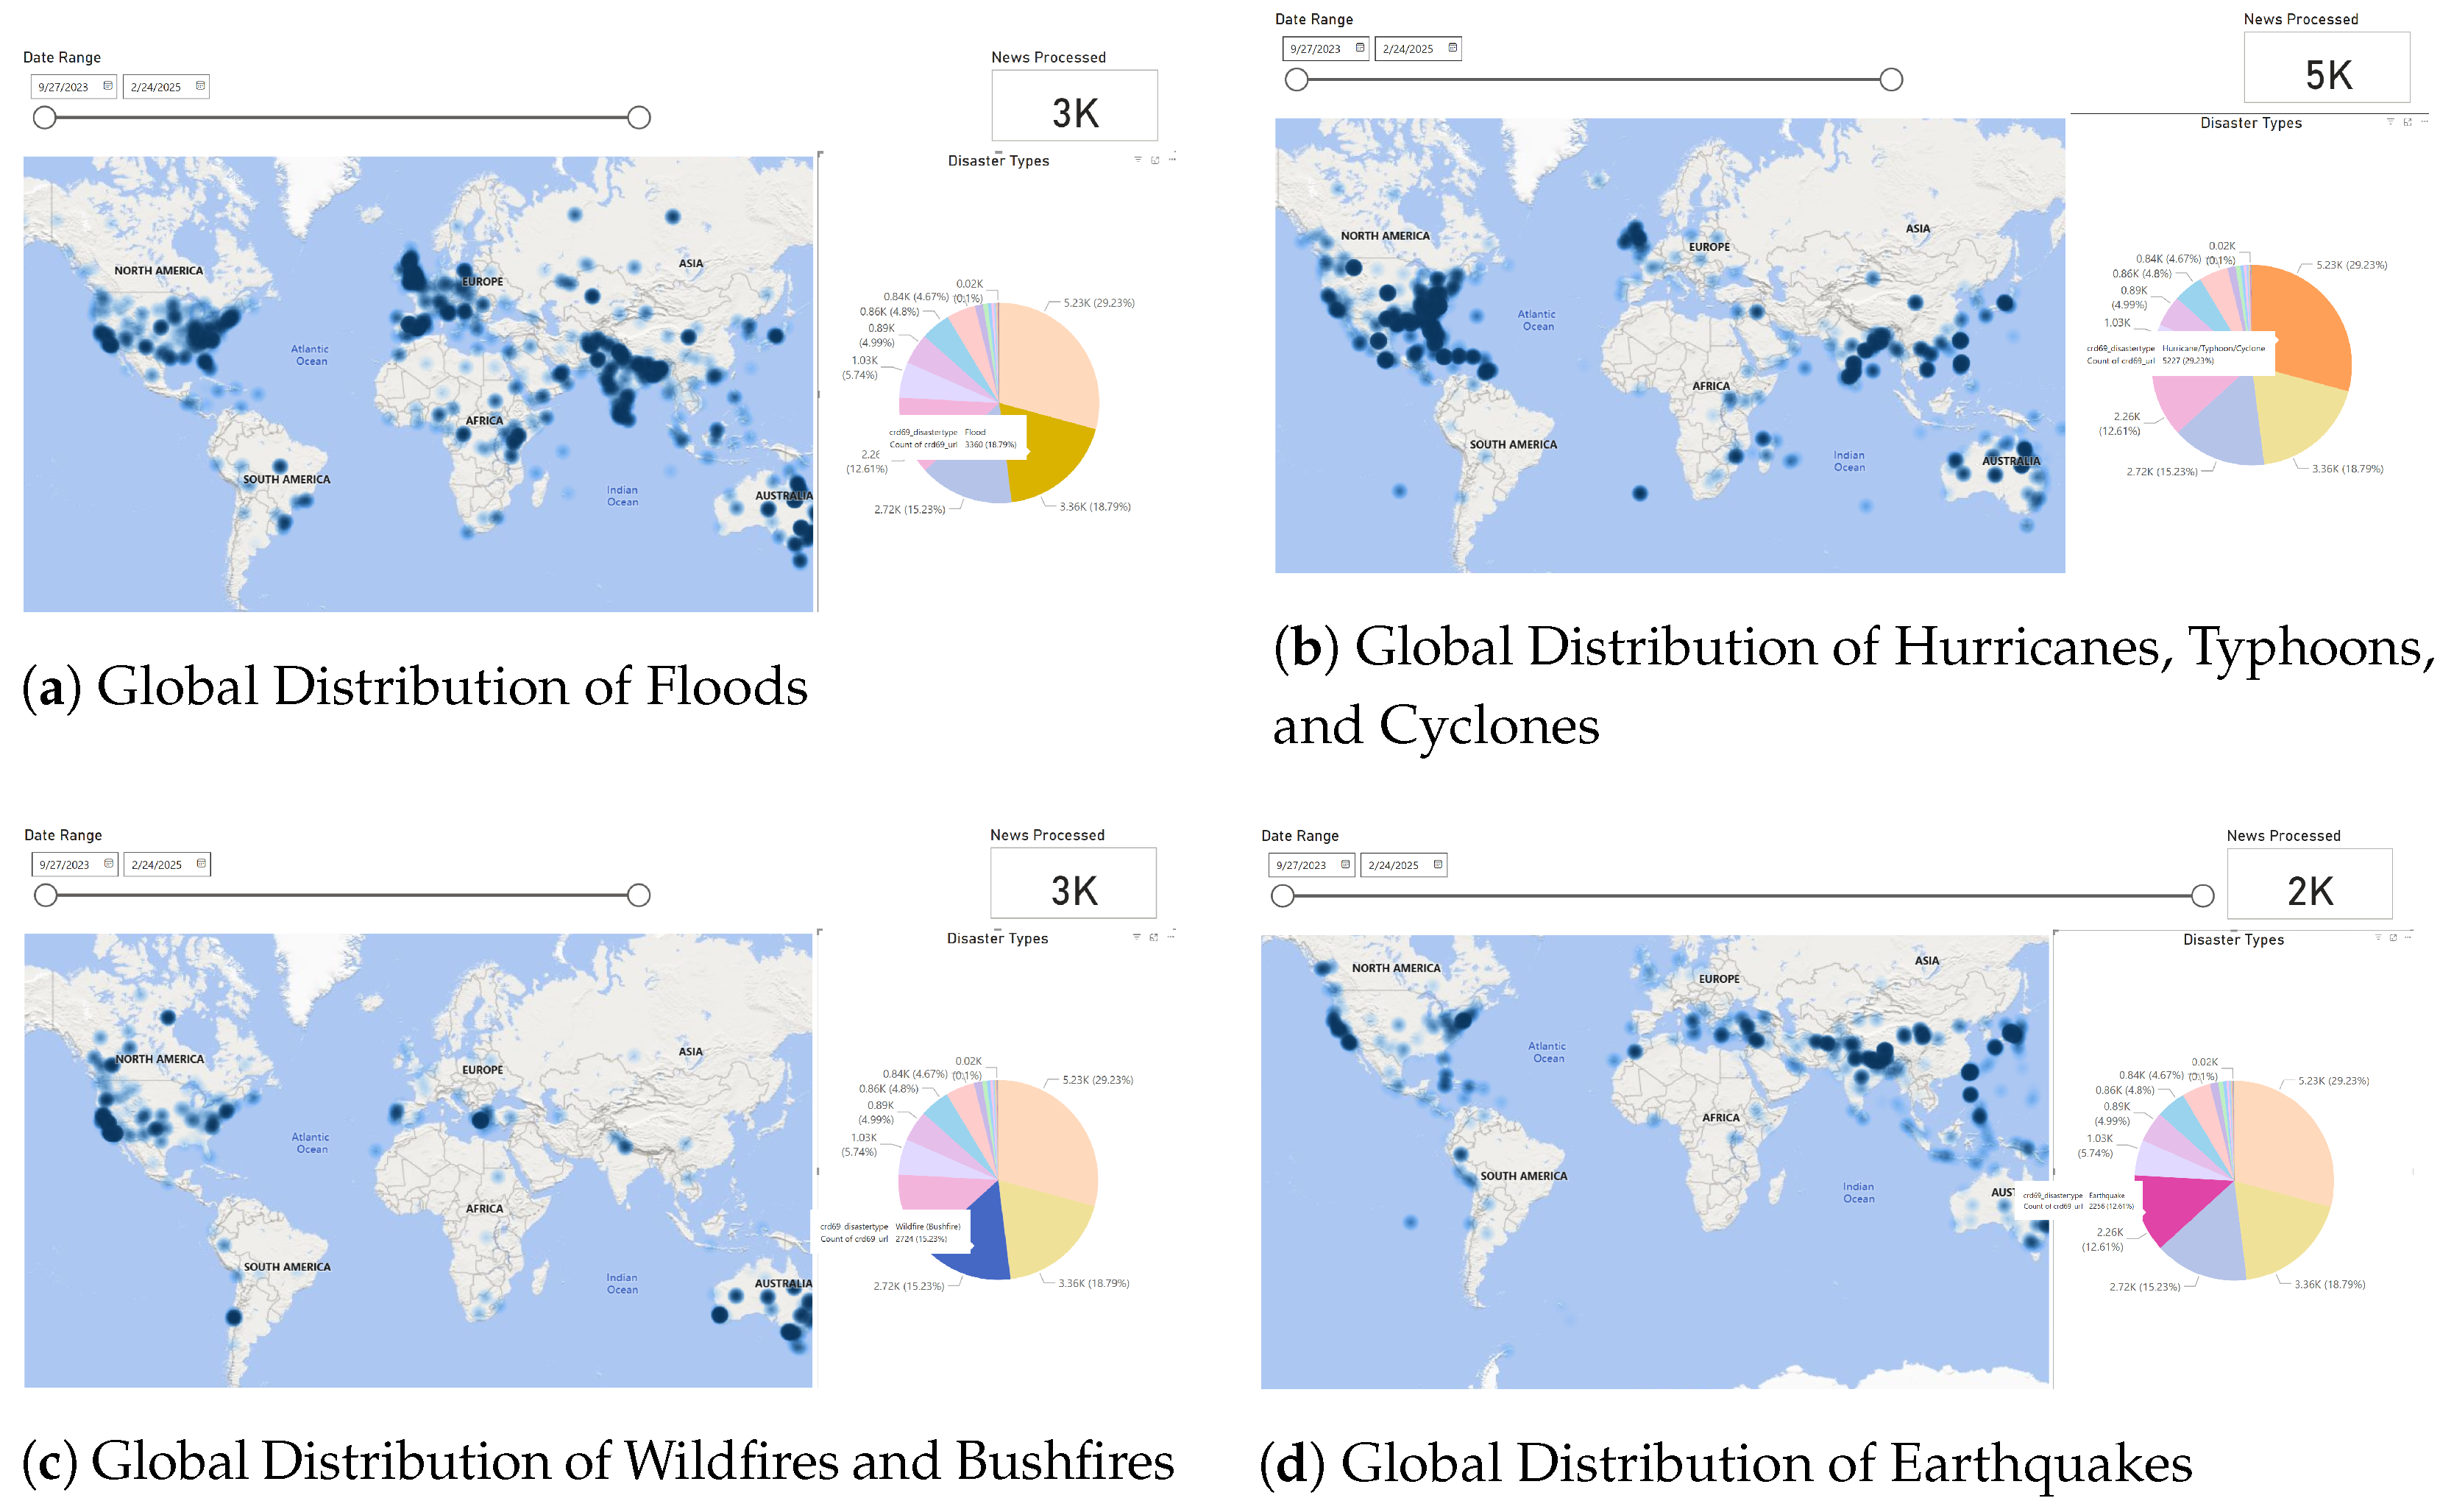
6.2. Global Distribution of Key Disaster Types
The disaster-specific heatmaps presented in
Figure 12 provide an insightful geospatial perspective on the occurrence patterns of major disaster types worldwide. These heatmaps highlight the high-risk zones for each type of disaster, offering valuable insights for researchers, policymakers, and emergency response teams. Each disaster type
d occurring at location
l and time
t can be represented using an indicator function:
The total number of occurrences of disaster type
d over a period
T and across all locations
L is:
where
represents the cumulative count of disaster type
d.
For regional analysis, the probability of disaster type
d occurring at location
l is given by:
which provides insights into high-risk regions for specific disaster types.
Floods, as seen in
Figure 12a, are highly concentrated in South Asia, Southeast Asia, and parts of North America, reflecting regions prone to heavy rainfall and seasonal monsoon impacts. Bangladesh, India, and the United States are among the most affected nations, emphasizing the need for improved flood management infrastructure and early warning systems.
Tropical storms, including hurricanes, typhoons, and cyclones, illustrated in
Figure 12b, predominantly impact coastal regions of the Atlantic, the Pacific, and the Indian Ocean. Notably, the eastern United States, the Philippines, and Japan exhibit high densities of storm occurrences. These findings align with historical meteorological data and stress the need for hurricane-resistant infrastructure and coastal disaster preparedness measures.
Wildfires and bushfires, represented in
Figure 12c, are most prevalent in Australia, California (USA), and parts of South America. The Australian bushfire season and the increasing frequency of wildfires in California reflect the growing influence of climate change on wildfire occurrences. These patterns underscore the necessity for enhanced forest management policies, controlled burns, and improved firefighting strategies.
Earthquakes, depicted in
Figure 12d, follow a well-defined global pattern along tectonic plate boundaries. The Pacific Ring of Fire, covering Japan, Indonesia, the western coasts of North and South America, and parts of the Himalayas, is a dominant earthquake hotspot. The visualization supports the seismic hazard maps used in earthquake risk mitigation and highlights the urgent need for earthquake-resistant urban planning in vulnerable regions.
By analyzing these heatmaps, disaster management authorities can optimize resource allocation, enhance early warning systems, and refine mitigation strategies tailored to specific disaster types. Moreover, these findings serve as a foundation for further scientific research on disaster frequency, intensity, and regional vulnerability.
6.3. Mobile Deployment of the Disaster Intelligence System
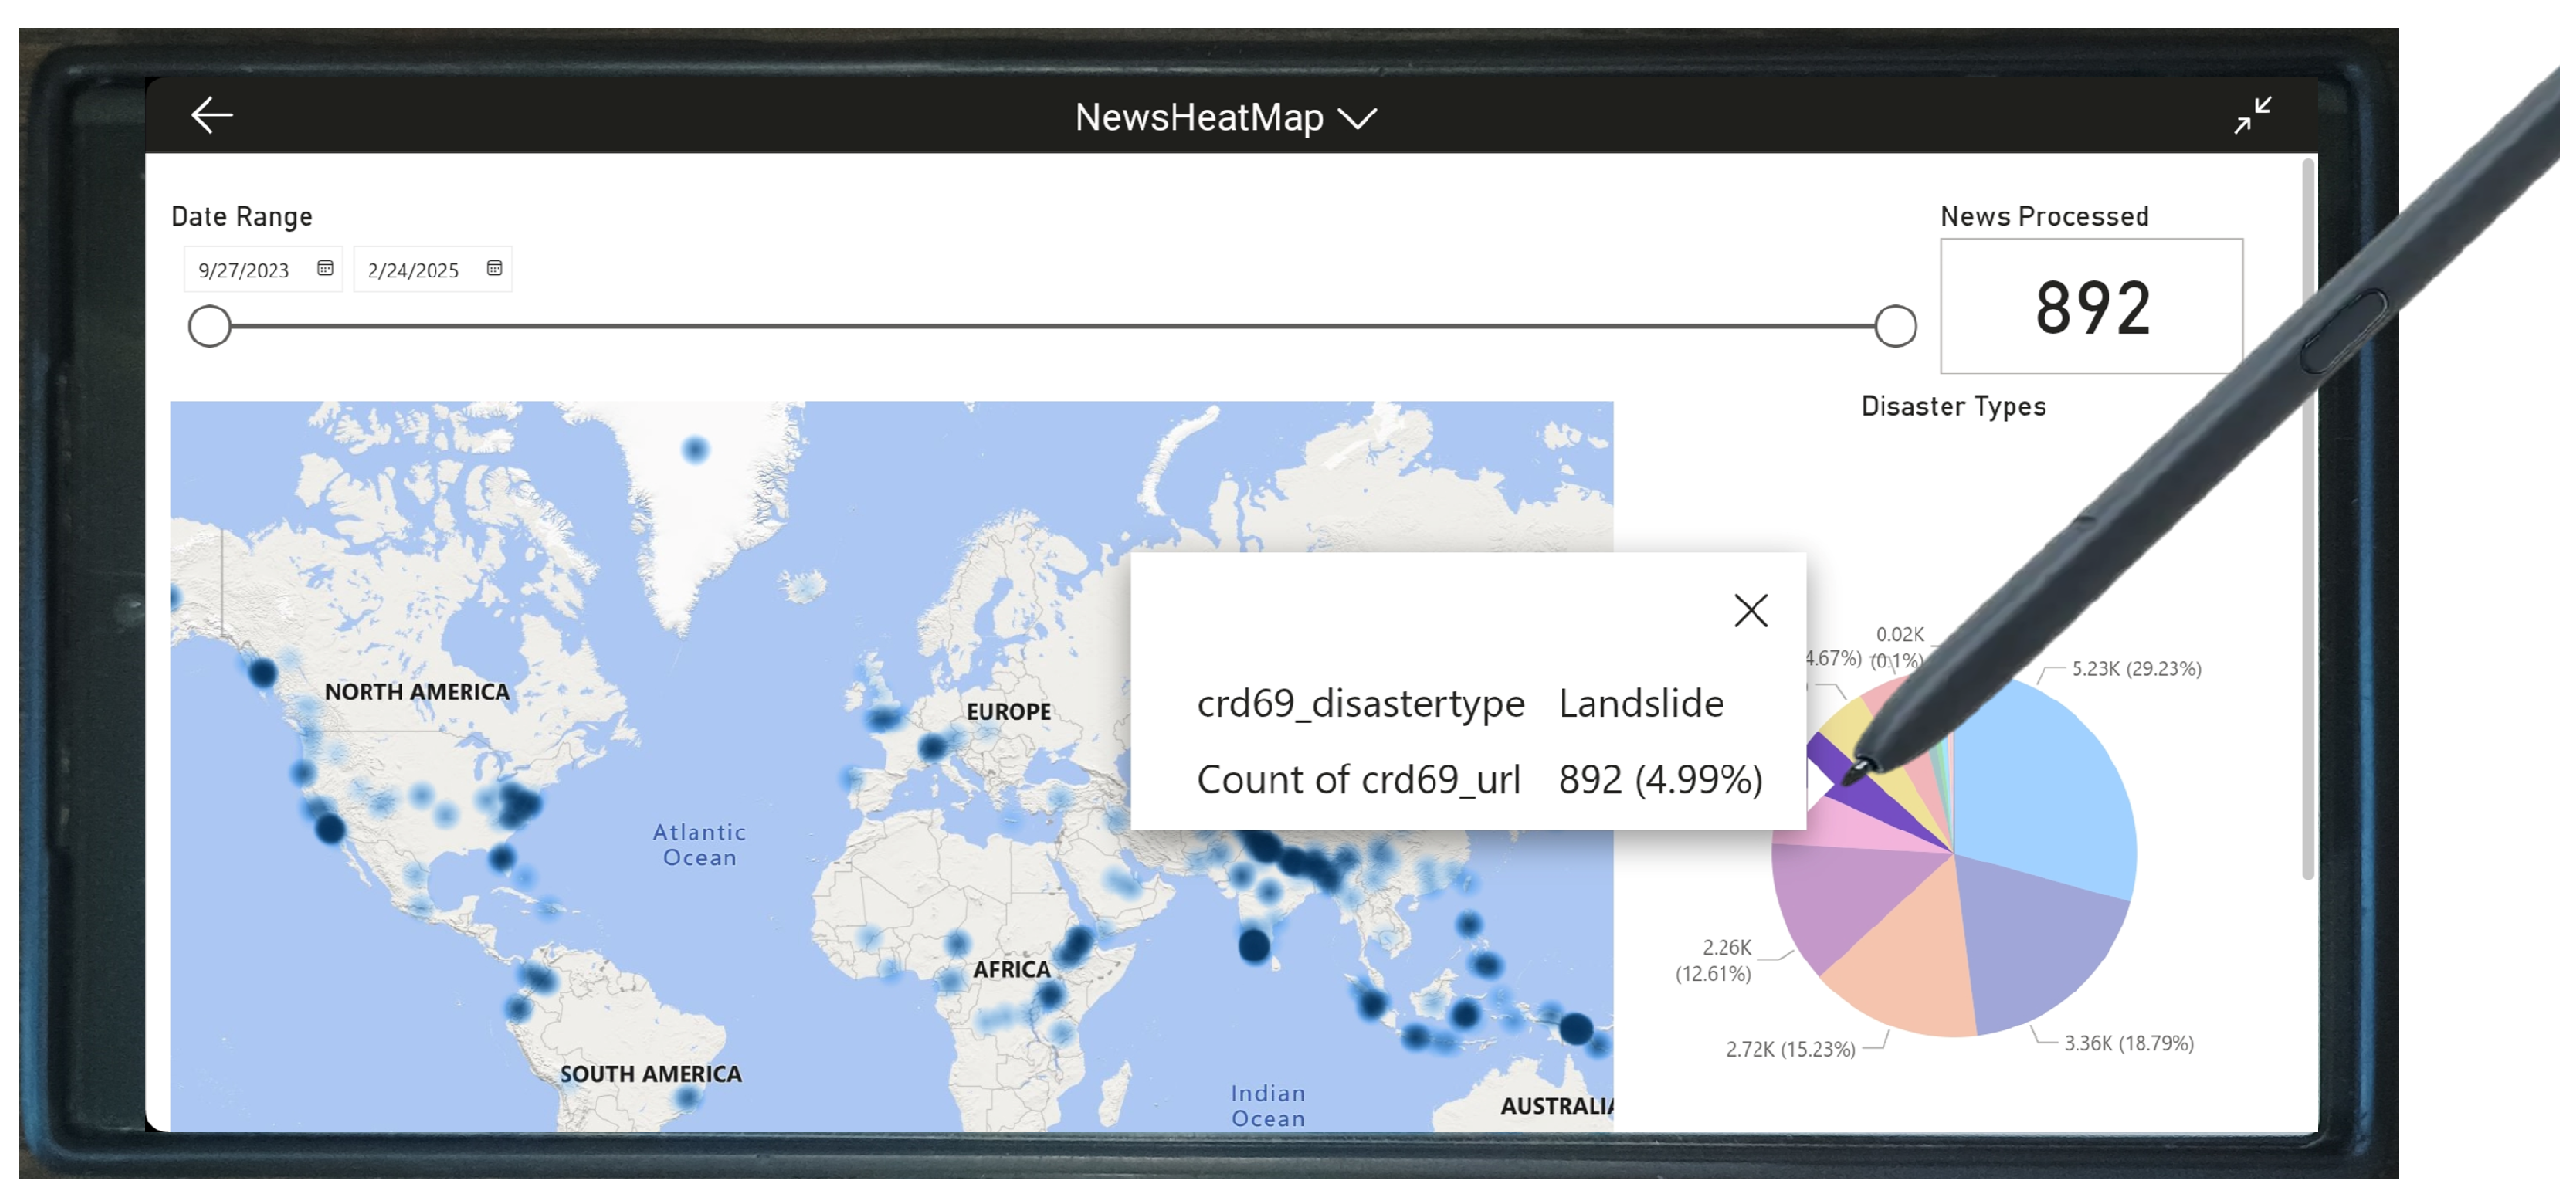
The integration of the proposed AI-driven disaster intelligence framework into mobile platforms significantly enhances its accessibility, usability, and real-time responsiveness.
Figure 13 illustrates the system’s mobile deployment, allowing users to visualize disaster data through an intuitive geospatial interface. By enabling mobile access, emergency responders, policymakers, and disaster management personnel can receive real-time intelligence, make informed decisions, and respond swiftly without reliance on stationary computing infrastructure.
Mobile deployment ensures that field responders and humanitarian organizations can access disaster intelligence instantly, even in remote or unstable environments. Real-time alerts, geospatial analysis, and predictive insights on mobile devices improve situational awareness, optimize resource allocation, and enhance coordinated response efforts. By placing advanced disaster analytics directly in the hands of decision-makers, the system facilitates rapid, evidence-based decision-making, ultimately strengthening global disaster preparedness and response.
6.4. Selection Criteria and Bias Mitigation in News Source Aggregation
The selection of news sources in this study was guided by popularity, prominence, and geographical diversity, ensuring that disaster reports were collected from a wide range of regions, linguistic backgrounds, and editorial perspectives. The dataset comprises news articles from 444 prominent online news portals, including major global media organizations such as CNN, BBC, The New York Times, and LA Times from the United States, Daily Mail, Reuters, and The Guardian from the United Kingdom, and India Times and NDTV from India, among others. This diverse selection ensures broad geopolitical coverage, minimizing regional biases in disaster intelligence reporting.
To further enhance representativeness, the dataset integrates news sources from multiple linguistic backgrounds, spanning English, Spanish, French, Hindi, Arabic, and Chinese, among others. This linguistic diversity reduces Western-centric biases and ensures that disaster intelligence reflects global events, including those reported in regions where English-language media may not have extensive coverage. However, despite these efforts, certain linguistic biases may still exist, particularly in underrepresented languages with limited digital news availability.
To mitigate ideological and editorial biases, the study incorporated sources reflecting a spectrum of political orientations. Left-leaning news portals such as CNN and BBC were complemented by right-leaning sources such as Fox News and The Epoch Times, ensuring a balanced representation of disaster reports across ideological divides. The aggregation of reports from diverse sources minimizes narrative distortions, as disaster events appearing across multiple news outlets from different editorial standpoints are more likely to represent objective realities rather than editorialized perspectives.
Additionally, the study acknowledges potential regional and cultural biases in disaster reporting. Some regions may receive disproportionately higher media attention, especially when disasters occur in densely populated areas or developed nations. Conversely, disasters in remote or politically unstable regions may be underreported due to limited journalistic presence, censorship, or infrastructural constraints. While our methodology attempts to counteract these imbalances through broad source selection, some structural biases inherent in global news media may still persist.


