
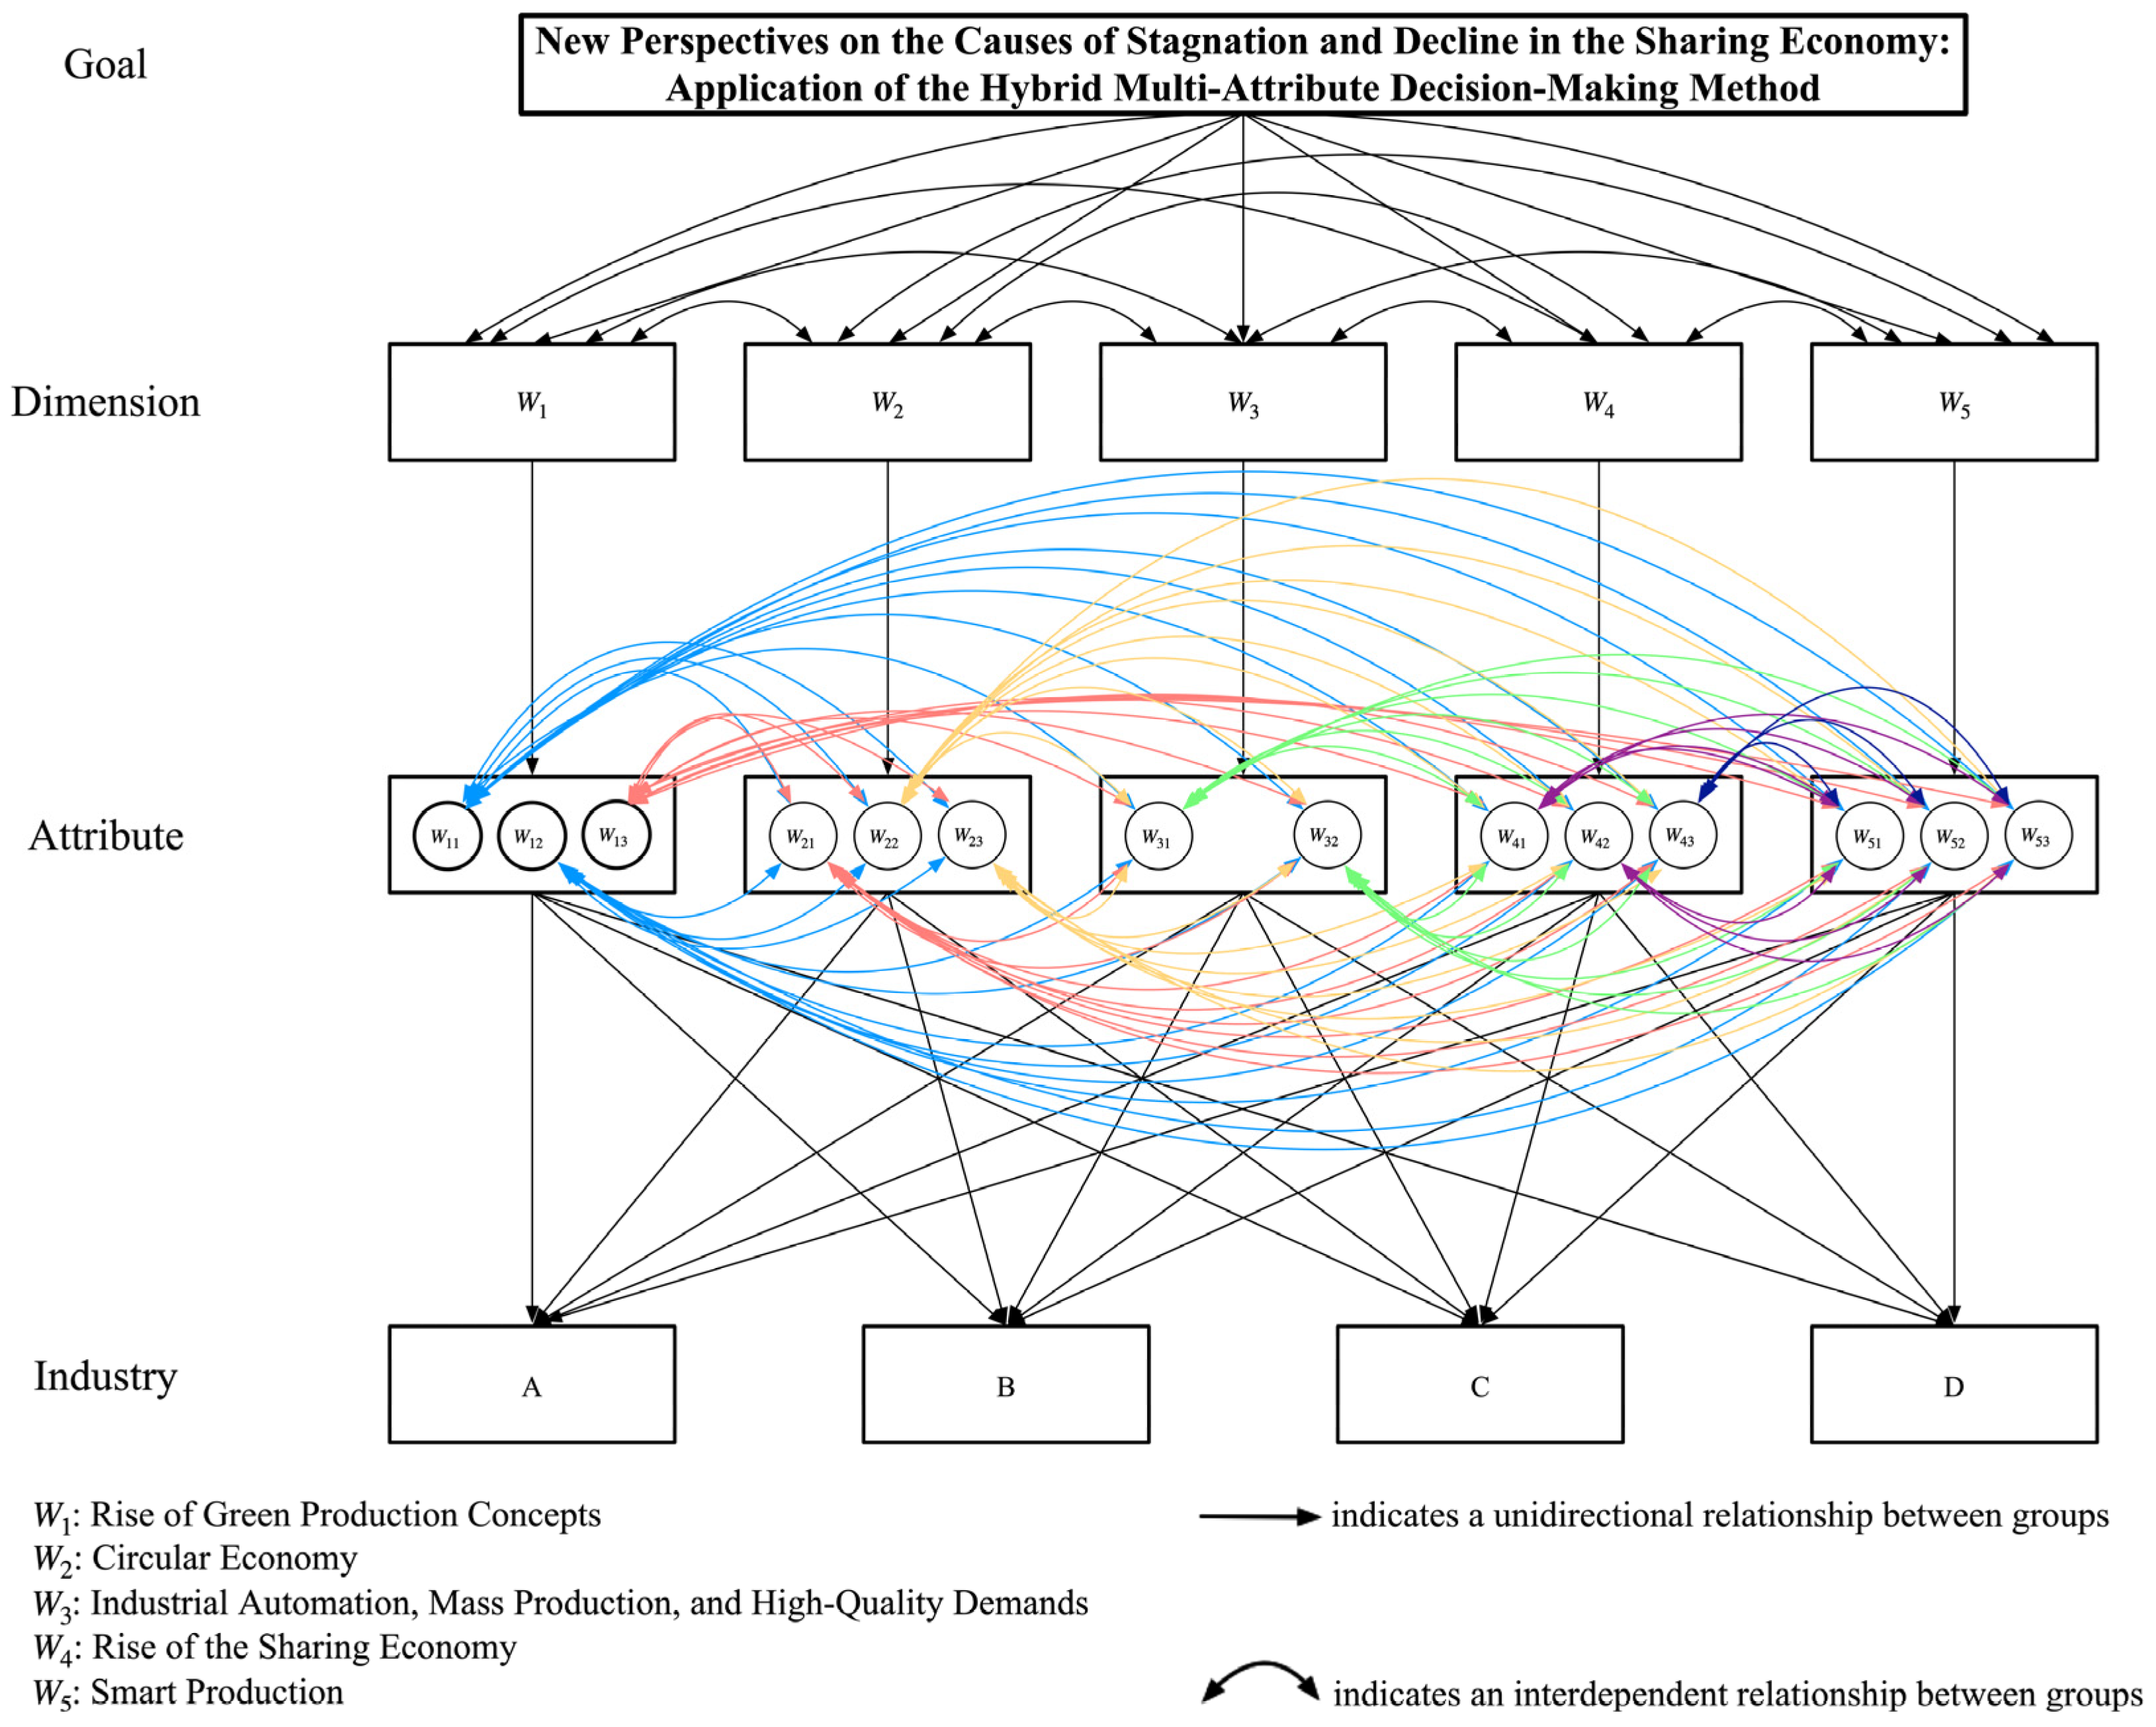
New Perspectives on the Causes of Stagnation and Decline in the Sharing Economy: Application of the Hybrid Multi-Attribute Decision-Making Method


Abstract
1. Introduction
Research Objectives
- Identify key factors of economic stagnation and recession:
- Utilize the DEMATEL and ANP (D&ANP) method to identify 5 key dimensions and 14 attributes influencing economic stagnation and recession.
- Analyze the interrelationships and significance of these factors and integrating the two methods to generate D&ANP influential weights, thereby establishing a more comprehensive decision-making analysis framework.
- Assess industry suitability and perform a comparative analysis:
- Apply D&ANP influential weights in conjunction with expert evaluations of the suitability of potential causes (or attributes) contributing to economic stagnation and recession.
- Calculate the average performance values of attribute suitability and compare them with benchmark suitability performance values to distinguish ideal and non-ideal conditions across different industries in economic stagnation and recession scenarios.
- Optimize industry strategies and provide improvement recommendations:
- Based on the study’s findings on non-ideal industry conditions, propose specific improvement recommendations to help industries adjust business models and resource allocation.
2. Literature Review
2.1. Rise of Green Production Concept
2.2. Circular Economy
2.3. Industrial Automation, Mass Production, and High-Quality Demands
2.4. The Rise of the Sharing Economy
2.5. Smart Production
2.6. Methodologies in Practice
3. Materials and Methods
3.1. Data Analysis Method
4. Analysis and Verification
4.1. Basic Information of DEMATEL Questionnaire
4.2. DEMATEL Analysis of Interdependence Between Dimensions
- Calculate the Normalized Direct Influence Matrix R. According to Equation (3), first, the maximum values of the column and row sums are 12.857 and 12.959, respectively (refer to Table 1). By taking 1/12.857 and 1/12.959, we obtain the values 0.078 and 0.077. Then, we multiply each value in Table 1 by the smaller value, 0.078 or 0.077, to obtain the normalized matrix R, as shown in Table 4.
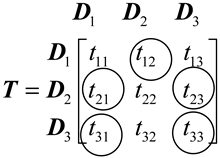
- Set the Threshold Value by Using the Total Influence Relationship Matrix T. From Table 5, the threshold is set according to Equation (8). To filter out dimensions with smaller influences in matrix T, we set the threshold and obtain = 1.14 (i.e., the average total influence of all dimensions) and the value . This is the normalized total influence matrix. By calculating with an Excel worksheet, as shown in Equation (13), the value 1.302 in Table 6 represents the value of “W2: Circular Economy” after pairwise comparison in the total influence matrix. The value 1.302, which is greater than the threshold, indicates that “W2: Circular Economy” is positively correlated. The value 1.017 in the table represents the result of the pairwise comparison between “W1: Rise of Green Production Concepts” and “W4: Emergence of the Sharing Economy.” Since 1.017 is smaller than the threshold value of 1.14, the value in the total influence matrix becomes 0. This process continues accordingly.
4.3. Calculation of ANP Weights
4.4. DEMATEL Combined with ANP to Form D&ANP
4.5. Average Performance Value Analysis
4.6. Discussion
5. Conclusions
- The current state of the economic environment
- 2.
- Industries must accelerate corporate innovation and adapt to environmental changes
- 3.
- Moving towards the development of smart production
Author Contributions
Funding
Data Availability Statement
Conflicts of Interest
Abbreviations
| DEMATEL | Decision-Making Trial and Evaluation Laboratory |
| ANP | Analytic Network Process |
| D&ANP | DEMATEL and ANP |
| MADM | Multi-Attribute Decision Making |
| AHP | analytic hierarchical process |
| ESG | environmental, social, and governance |
| entry 2 | data |
| MMI | metal manufacturing industry |
| OI | optoelectronics industry |
| MEI | machinery and equipment industry |
| 3CI | 3C industry (computers, communications, and consumer electronics industry) |
References
- Vijaya, A.; Meisterknecht, J.P.S.; Angreani, L.S.; Wicaksono, H. Advancing Sustainability in the Automotive Sector: A Critical Analysis of Environmental, Social, and Governance (ESG) Performance indicators. Clean. Environ. Syst. 2025, 16, 100248. [Google Scholar] [CrossRef]
- Paoloni, M.; Coluccia, D.; Fontana, S.; Solimene, S. Knowledge management, intellectual capital and entrepreneurship: A structured literature review. J. Knowl. Manag. 2020, 24, 1797–1818. [Google Scholar] [CrossRef]
- Morrow, D.; Rondinelli, D. Adopting corporate environmental management systems: Motivations and results of ISO 14001 and EMAS certification. Eur. Manag. J. 2002, 20, 159–171. [Google Scholar] [CrossRef]
- Serafeim, G.; Yoon, A. Stock price reactions to ESG news: The role of ESG ratings and disagreement. Rev. Account. Stud. 2023, 28, 1500–1530. [Google Scholar] [CrossRef]
- Nations United. For a Livable Climate: Net-Zero Commitments Must Be Backed by Credible Action. Available online: https://www.un.org/en/climatechange/net-zero-coalition (accessed on 24 May 2024).
- Chen, Y.; Ren, J. How Does Digital Transformation Lmprove ESG Performance? Empirical research from 396 enterprises. Intermation Entren. Manag. J. 2024, 21, 27. [Google Scholar] [CrossRef]
- Gamal, H. Technological Integration and Innovative Strategies Harnessing Artificial Intelligence for Operational Excellence. In Building Business Knowledge for Complex Modern Business Environments; IGI Global: Hershey, PA, USA, 2025; pp. 237–270. [Google Scholar] [CrossRef]
- Alam, S.S.; Ahsan, M.N.; Kokash, H.A.; Ahmed, S.; Di, W. Remanufactured Consumer Goods Buying Intention in Circular Economy: Insight of Value-Belief-norm Theory, Self-Identity Theory. J. Remanufacturing 2025, 15, 179–206. [Google Scholar] [CrossRef]
- Leal-Arcas, R. The Future of Global Economic Governance: Balancing Trade, Sustainability, and Social Justice. Sustain. Soc. Justic 2025, 35, 1–40. [Google Scholar]
- Rashid, A.; Rasheed, R.; Amirah, N.A. Synergizing TQM, JIT, and Green Supply Chain Practices: Strategic Insights for Enhanced Environmental Performance. Logistics 2025, 9, 18. [Google Scholar] [CrossRef]
- Blumberg, D.F. Introduction to Management of Reverse Logistics and Closed Loop Supply Chain Processes; CRC Press: Boca Raton, FL, USA, 2004; p. 296. [Google Scholar]
- Dai, J.; Mehmood, U.; Nassani, A.A. Empowering Sustainability Through Energy Efficiency, Green Innovations, and the Sharing Economy: Insights from G7 Economies. Energy 2025, 318, 134768. [Google Scholar] [CrossRef]
- Hamari, J.; Sjöklint, M.; Ukkonen, A. The Sharing Economy: Why People Participate in Collaborative Consumption. J. Assoc. Inf. Sci. Technol. 2016, 67, 2047–2059. [Google Scholar] [CrossRef]
- Farrukh Shahzad, M.; Liu, H.; Zahid, H. Industry 4.0 technologies and sustainable performance: Do green supply chain collaboration, circular economy practices, technological readiness and environmental dynamism matter? J. Manuf. Technol. Manag. 2025, 36, 1–22. [Google Scholar] [CrossRef]
- Guo, Y. Enhancing DVNN-WCSM Technique for Double-Valued Neutrosophic Multiple-Attribute Decision-Making in Digital Economy: A Case Study on Enhancing the Quality of Development of Henan’s Cultural and Tourism Industry. Neutrosophic Sets Syst. Vol. 75/2025 Int. J. Inf. Sci. Eng. 2025, 49, 390. [Google Scholar]
- Zhang, Z. Enhanced Decision-Making Technique for Innovation Capability Evaluation in the Core Industries of Digital Economy Under Double-Valued Neutrosophic Sets. Neutrosophic Sets Syst. 2025, 77, 492–509. [Google Scholar]
- Panigrahi, S.S.; Bahinipati, B.K.; Govindan, K.; Parhi, S. An Advanced Dual-layered Framework for Sustainable Supply Chain Performance. J. Model. Manag. 2025, 20, 732–796. [Google Scholar] [CrossRef]
- Shamekhi Amiri, A.; Torabi, S.A.; Tavana, M. An Asssessment of the Prominence and Total Engagement Metrics for Ranking Interdependent Attributes in DEMATEL and WINGS. Omega 2025, 130, 103176. [Google Scholar] [CrossRef]
- Basavaraju, S.; Vinod, R.B.; Anil Kumar, K.M.; Patil, S.J.; Jamuna Bai, A. Solid Waste Transportation, Collection, Storage, Public Health, and Ecological Impacts. In Solid Waste Management: A Roadmap for Sustainable Environmental Practices and Circular Economy; Pandey, A., Suthar, S.S., Amesho, K.T.T., Eds.; Springer Nature: Cham, Switzerland, 2025; pp. 383–409. [Google Scholar]
- Chen, R.; Cao, L. How Do Enterprises Achieve Sustainable Success in Green Manufacturing Era? The Impact of Organizational Environmental Identity on Green Competitive Advantage in China. Kybernetes 2025, 54, 71–89. [Google Scholar] [CrossRef]
- Al-Shboul, M.d.A. Assessing Sustainability of Green Supply Chain Performance: The Roles of Agile Innovative Products, Business Intelligence Readiness, Innovative Supply Chain Process Integration, and Lean Supply Chain Capability as a Mediating Factor. J. Open Innov. Technol. Mark. Complex. 2025, 11, 100476. [Google Scholar] [CrossRef]
- Ahmed, M.; Raouf, M.; Siddig, K. What Are the Economic and Poverty Implications for Sudan If the Conflict Continues Through 2024? International Food Policy Research Institute: Washington, DC, USA, 2025. [Google Scholar]
- Jindal, P. Economic, Social, and Environmental Aspects of Sustainable Development-direct and Indirect Effects on Business Practices. In Greening Our Economy for a Sustainable Future; Grima, S., Sood, K., Özen, E., Gonzi, R.D., Eds.; Elsevier: Amsterdam, The Netherlands, 2025; pp. 227–240. [Google Scholar]
- Panza, L.; Peron, M. The Role of Carbon Tax in the Transition from a linear Economy to a cCrcular Economy Business Model in Manufacturing. J. Clean. Prod. 2025, 492, 144873. [Google Scholar] [CrossRef]
- Hassan, S.M. Circular Economy and ESG: Building Sustainable Business Models in the Manufacturing Sector. J. Bus. Econ. Stud. 2025, 2, 1–12. [Google Scholar] [CrossRef]
- Mehta, A.K.; Wadhwa, G.; Shukla, R.; Chandel, P.S.; Selvakumar, P. Opportunities for Green Entrepreneurship. In Examining Green Human Resources Management and Nascent Entrepreneurship; Tunio, M.N., Qureshi, M.A., Qureshi, J., Eds.; IGI Global: Hershey, PA, USA, 2025; pp. 223–248. [Google Scholar] [CrossRef]
- Saunders, C. 23: Environmental Movements and Environmental Political Theory in the Anthropocene. In Handbook of Environmental Political Theory in the Anthropocene; Amanda, M., Marcel, W., Eds.; Edward Elgar Publishing: Cheltenham, UK, 2025; pp. 217–226. [Google Scholar] [CrossRef]
- Thangam, D.; Pavan, K.A.; Patil, S.; Park, J.Y.; Kandasamy, R.; Chikkandar, R.J. Intelligent Process Automation and Its Relevance to Various Industries. In Advancements in Intelligent Process Automation; Thangam, D., Ed.; IGI Global: Hershey, PA, USA, 2025; pp. 387–412. [Google Scholar] [CrossRef]
- Dai, N.; Zhang, K.; Zhang, F.; Li, J.; Zhong, J.; Huang, Y.; Ding, H. AI-Assisted Flexible Electronics in Humanoid Robot Heads for Natural and Authentic Facial Expressions. Innovation 2025, 6, 100752. [Google Scholar] [CrossRef]
- Moraru, G.-M.; Popa, D. Potential Resistance of Employees to Change in the Transition to Industry 5.0. MATEC Web Conf. 2021, 343, 07005. [Google Scholar] [CrossRef]
- Psarommatis, F.; May, G.; Azamfirei, V. Product Reuse and Repurpose in Circular Manufacturing: A Critical Review of Key Challenges, Shortcomings and Future Directions. J. Remanuf. 2025, 1–38. [Google Scholar] [CrossRef]
- Tan, Q.H.; Yeoh, B.S.A. Circular Sharing: Community-Initiated Free(Cycling) Markets/Workshops Encouraging Reuse in Singapore. J. Clean. Prod. 2025, 493, 144740. [Google Scholar] [CrossRef]
- Mont, O. Assessing Sharing of Household Goods: Tool and Toy Sharing in Melbourne and Toronto. In Understanding the Urban Sharing Economy; Mont, O., Ed.; Edward Elgar Publishing: Cheltenham, UK, 2025; pp. 110–130. [Google Scholar]
- Hartl, B.; Penz, E.; Schuessler, E. Creating a Trusting Environment in the Sharing Economy: Unpacking Mechanisms for Trust-Building used by Peer-to-Peer Carpooling Platforms. J. Clean. Prod. 2025, 489, 144661. [Google Scholar] [CrossRef]
- Gontarz, M.; Sulich, A. The Sustainable Transportation Solutions: Smart Shuttle Example. In Proceedings of the 34th International Business Information Management Association Conference (IBIMA), Madrid, Spain, 29 January 2021; pp. 10833–10840. [Google Scholar]
- Subramanian, B.; Mishra, A.; Bharathi V, R.; Mandala, G.; Kathamuthu, N.D.; Srithar, S. Big Data and Fuzzy Logic for Demand Forecasting in Supply Chain Management: A Data-Driven Approach. J. Fuzzy Ext. Appl. 2025, 6, 260–283. [Google Scholar] [CrossRef]
- Wang, Q.; Lyu, M. The Relationship Between Data-Intelligence Empowerment, Knowledge Diversification, and Knowledge Recombinant Capabilities: Research on Sustainability of Chinese High-Tech Listed Firms. Sustainability 2025, 17, 291. [Google Scholar] [CrossRef]
- Johri, P.; Singh, J.N.; Sharma, A.; Rastogi, D. Sustainability of Coexistence of Humans and Machines: An Evolution of Industry 5.0 from Industry 4.0. In In Proceedings of the 2021 10th International Conference on System Modeling & Advancement in Research Trends (SMART), Moradabad, India, 10–11 December 2021; pp. 410–414. [Google Scholar]
- Boddapati, V.N.; Bauskar, S.R.; Madhavaram, C.R.; Galla, E.P.; Sunkara, J.R.; Gollangi, H.K. Optimizing Production Efficiency in Manufacturing using Big data and AI/ML. In Proceedings of the 3rd International Conference on Optimization Techniques in the Field of Engineering ICOFE-2024 Online, Debre Tabor University, Tamilnadu, India, 6 January 2025; p. 18. [Google Scholar]
- Iqbal, M.; Lee, C.K.M.; Ren, J.Z. Industry 5.0: From Manufacturing Industry to Sustainable Society. In Proceedings of the 2022 IEEE International Conference on Industrial Engineering and Engineering Management (IEEM), Kuala Lumpur, Malaysia, 7–10 December 2022; pp. 1416–1421. [Google Scholar]
- Lu, Y.; Zheng, H.; Chand, S.; Xia, W.; Liu, Z.; Xu, X.; Wang, L.; Qin, Z.; Bao, J. Outlook on Human-Centric Manufacturing Towards Industry 5.0. J. Manuf. Syst. 2022, 62, 612–627. [Google Scholar] [CrossRef]
- Gabus, A.; Fontela, E. Perceptions of the World Problematique: Communication Procedure, Communicating with Those Bearing Collective Responsibility; Battelle Geneva Research Centre: Geneva, Switzerland, 1973. [Google Scholar]
- Tan, R.-P.; Zhang, W.-D. Decision-Making Method Based on New Entropy and Refined Single-Valued Neutrosophic sets and its Application in Typhoon Disaster Assessment. Appl. Intell. 2021, 51, 283–307. [Google Scholar] [CrossRef]
- Li, Y.; Xiong, Y.; Shuai, Y. Reply to “Discussion on the Studies of Position-Specific Carbon Isotopes of Propane by Li et al. (2018), Zhang et al. (2022) and Shuai et al. (2023)”. Org. Geochem. 2024, 192, 104797. [Google Scholar] [CrossRef]
- Ye, J.; Du, S.; Yong, R. Multi-Criteria Decision-Making Model using Trigonometric Aggregation Operators of Single-Valued Neutrosophic Credibility Numbers. Inf. Sci. 2023, 644, 118968. [Google Scholar] [CrossRef]
- Saaty, T.L. A Scaling Method for Priorities in Hierarchical Structures. J. Math. Psychology 1977, 15, 234–281. [Google Scholar] [CrossRef]
- Saaty, T.L. Decision Making with Dependence and Feedback: The Analytic Network Process; RWS Publications: Pittsburgh, PA, USA, 1996; Volume 4922. [Google Scholar]
- Saaty, T.L. Making and Validating Complex Decisions with the AHP/ANP. J. Syst. Sci. Syst. Eng. 2005, 14, 1–36. [Google Scholar] [CrossRef]
- Saaty, T.L. Fundamentals of the Analytic Network Process. In Proceedings of the 5th International Symposium on the Analytic Hierarchy Process, Kobe, Japan, 12–14 August 1999; pp. 34–45. [Google Scholar]


| Service Unit | Job Title | Work Experience | Service Department | Number of Interviewees |
|---|---|---|---|---|
| 3C I | Product Manager | 10~20 years | Product Planning Department | 25 |
| MEI | Product Manager | 10~20 years | Business Department | 23 |
| OI | Product Manager | 10~20 years | Business Department | 20 |
| MMI | Product Manager | 10~20 years | Product Planning Department | 24 |
| Dimension | Attribute | Definition | References |
|---|---|---|---|
| W1: Rise of Green Production Concepts (%) | W11: Enhancement of Organizational Operations for Environmental Awareness (%) | The green supply chain covers supply, production, sales, and recycling, optimizing transportation, packaging, storage, and waste management. | [20] |
| W12: Emergence of Environmental Issues (%) | Greenhouse gas and hazardous substance regulations impact global industries, driving an urgent increase in environmental protection demands. | [19] | |
| W13: Corporate Sustainable Management (%) | Enterprises implement sustainable development through quality management, driving open innovation and green strategies to promote environmental protection. | [22] | |
| W2: Emergence of Environmental Issues as Hot Topics (%) | W21: Strengthening of Policies and Regulations (%) | Strengthen policies and regulations to promote national circular economy development. | [24] |
| W22: Incentives for Technology Research and Development Policies (%) | Support the circular economy, incentivize the entire industry chain, ensure fair profit distribution, and promote business and consumer participation. | [25] | |
| W23: Strong Promotion of the Environmental Protection Movement (%) | The environmental movement focuses on economic impact, promotes sustainable development, and preserves environmental quality and natural resources. | [27] | |
| W3: Large-Scale Industrial Automation (%) | W31: Rapid and Mass Production Through Equipment Automation (%) | Automation enhances efficiency, reduces costs, and boosts productivity through scale expansion. | [28] |
| W32: High-Quality Products Extend Product Lifespan (%) | Automated production enhances quality, optimizes materials, and extends product lifespan. | [31] | |
| W4: Rise of the Sharing Economy (%) | W41: Reduction in Industry-Owned Production Equipment Due to Repeated Equipment Rentals (%) | Sharing platforms facilitate service rentals, enhance convenience, and emphasize access over ownership. | [32] |
| W42: Full Utilization of Idle Items (%) | Online platforms release idle resources, enabling transactions of skills, space, and assets to enhance value utilization. | [33] | |
| W43: Reduction in Workforce for Companies | The sharing economy matches supply and demand through the internet, facilitating usage rights transfer, driving model growth, and addressing labor reduction challenges. | [34] | |
| W5: Smart Production (%) | W51: Accurate Estimation of Market Demand and Equipment Utilization Rate (%) | Big data optimize supply chain and product strategies, enhancing production efficiency, energy management, and quality control. | [36] |
| W52: Flexible Adaptation to Market Changes and Diverse Customer Demands (%) | Smart products collect data, optimize R&D and operations, enhance flexibility, conserve energy, and reduce inventory. | [37] | |
| W53: Enhancement of Smart Production (%) | Smart IoT enables automated production, enhances efficiency, optimizes resource utilization, and maximizes unmanned manufacturing. | [39] |
| Dimension | W1 | W2 | W3 | W4 | W5 | Row Sum |
|---|---|---|---|---|---|---|
| W1 | 0.000 | 3.714 | 2.571 | 2.714 | 2.571 | 11.571 |
| W2 | 3.571 | 0.000 | 2.367 | 3.286 | 2.571 | 11.796 |
| W3 | 2.429 | 2.776 | 0.000 | 3.143 | 2.571 | 10.918 |
| W4 | 2.429 | 3.469 | 3.429 | 0.000 | 2.000 | 11.327 |
| W5 | 3.286 | 3.000 | 3.143 | 3.429 | 0.000 | 12.857 |
| Row Sum | 11.714 | 12.959 | 11.510 | 12.571 | 9.714 |
| Dimension | W1 | W2 | W3 | W4 | W5 |
|---|---|---|---|---|---|
| W1 | 0 | 0.289 | 0.198 | 0.209 | 0.198 |
| W2 | 0.276 | 0 | 0.183 | 0.254 | 0.198 |
| W3 | 0.187 | 0.214 | 0 | 0.243 | 0.198 |
| W4 | 0.187 | 0.268 | 0.265 | 0 | 0.154 |
| W5 | 0.254 | 0.231 | 0.243 | 0.265 | 0 |
| Dimension | W1 | W2 | W3 | W4 | W5 |
|---|---|---|---|---|---|
| W1 | 1.650 | 2.020 | 1.784 | 1.917 | 1.576 |
| W2 | 1.889 | 1.824 | 1.799 | 1.970 | 1.596 |
| W3 | 1.726 | 1.885 | 1.543 | 1.855 | 1.507 |
| W4 | 1.767 | 1.964 | 1.791 | 1.703 | 1.513 |
| W5 | 1.995 | 2.142 | 1.959 | 2.107 | 1.535 |
| Dimension | W1 | W2 | W3 | W4 | W5 |
|---|---|---|---|---|---|
| W1 | 0.8830 ( 0) | 0.9920 ( 0) | 1.173 ( 1.173) | 1.185 ( 1.185) | 0.9330 ( 0) |
| W2 | 1302 ( 1.302) | 1.0390 ( 0) | 1.398 ( 1.398) | 1.459 ( 1.459) | 1.158 ( 0) |
| W3 | 1.204 ( 1.204) | 1.216 ( 1.216) | 1.143 ( 1.143) | 1.456 ( 1.456) | 1.154 (= 0) |
| W4 | 1.0170 ( 0) | 0.9530 ( 0) | 1.0600 ( 0) | 0.9900 ( 0) | 0.9370 ( 0) |
| W5 | 1.159 ( 1.159) | 0.0000 ( 0) | 1.254 ( 1.254) | 1.403 ( 1.403) | 0.9170 ( 0) |
| Attribute | W11 | W12 | W13 | W21 | W22 | W23 | W31 | W32 | W41 | W42 | W43 | W51 | W52 | W53 |
|---|---|---|---|---|---|---|---|---|---|---|---|---|---|---|
| W11 | 0 | 0 | 0 | 0 | 0 | 0 | 0.08 | 0.05 | 0 | 0 | 0 | 0.07 | 0.03 | 0.04 |
| W12 | 0 | 0 | 0 | 0 | 0 | 0 | 0.05 | 0.08 | 0 | 0 | 0 | 0.03 | 0.05 | 0.06 |
| W13 | 0 | 0 | 0 | 0 | 0 | 0 | 0.07 | 0.07 | 0 | 0 | 0 | 0.1 | 0.12 | 0.1 |
| W21 | 0 | 0 | 0 | 0 | 0 | 0 | 0.07 | 0.1 | 0.12 | 0 | 0 | 0 | 0 | 0 |
| W22 | 0 | 0 | 0 | 0 | 0 | 0 | 0.1 | 0.06 | 0.05 | 0 | 0 | 0 | 0 | 0 |
| W23 | 0 | 0 | 0 | 0 | 0 | 0 | 0.03 | 0.04 | 0.03 | 0 | 0 | 0 | 0 | 0 |
| W31 | 0.31 | 0.13 | 0.63 | 0.11 | 0.05 | 0.11 | 0 | 0 | 0.09 | 0.09 | 0.14 | 0.07 | 0.1 | 0.08 |
| W32 | 0.94 | 1.13 | 0.63 | 0.11 | 0.16 | 0.11 | 0 | 0 | 0.09 | 0.09 | 0.05 | 0.11 | 0.08 | 0.1 |
| W41 | 0.95 | 1.14 | 0.63 | 0.14 | 0.12 | 0.06 | 0.09 | 0.11 | 0.09 | 0 | 0 | 0.14 | 0.14 | 0.14 |
| W42 | 0.63 | 0.25 | 0.18 | 0.06 | 0.08 | 0.09 | 0.04 | 0.05 | 0 | 0 | 0 | 0.06 | 0.06 | 0.06 |
| W43 | 0.39 | 0.39 | 0.42 | 0.04 | 0.03 | 0.08 | 0.06 | 0.03 | 0 | 0 | 0 | 0.04 | 0.04 | 0.04 |
| W51 | 0 | 0 | 0 | 0.08 | 0.1 | 0.11 | 0.14 | 0.14 | 0.03 | 0.06 | 0.06 | 0 | 0 | 0 |
| W52 | 0 | 0 | 0 | 0.05 | 0.06 | 0.05 | 0.04 | 0.06 | 0.08 | 0.13 | 0.04 | 0 | 0 | 0 |
| W53 | 0 | 0 | 0 | 0.06 | 0.03 | 0.03 | 0.06 | 0.04 | 0.12 | 0.05 | 0.14 | 0 | 0 | 0 |
| Attribute | W11 | W12 | W13 | W21 | W22 | W23 | W31 | W32 | W41 | W42 | W43 | W51 | W52 | W53 | Dimension |
|---|---|---|---|---|---|---|---|---|---|---|---|---|---|---|---|
| W11 | 0.00 | 0.00 | 0.00 | 0.00 | 0.00 | 0.00 | 0.08 | 0.05 | 0.00 | 0.00 | 0.00 | 0.07 | 0.03 | 0.04 | 0.14 |
| W12 | 0.00 | 0.00 | 0.00 | 0.00 | 0.00 | 0.00 | 0.05 | 0.08 | 0.00 | 0.00 | 0.00 | 0.03 | 0.05 | 0.06 | |
| W13 | 0.00 | 0.00 | 0.00 | 0.00 | 0.00 | 0.00 | 0.07 | 0.07 | 0.00 | 0.00 | 0.00 | 0.10 | 0.12 | 0.10 | |
| W21 | 0.00 | 0.00 | 0.00 | 0.00 | 0.00 | 0.00 | 0.07 | 0.10 | 0.12 | 0.00 | 0.00 | 0.00 | 0.00 | 0.00 | 0.11 |
| W22 | 0.00 | 0.00 | 0.00 | 0.00 | 0.00 | 0.00 | 0.10 | 0.06 | 0.05 | 0.00 | 0.00 | 0.00 | 0.00 | 0.00 | |
| W23 | 0.00 | 0.00 | 0.00 | 0.00 | 0.00 | 0.00 | 0.03 | 0.04 | 0.03 | 0.00 | 0.00 | 0.00 | 0.00 | 0.00 | 0.26 |
| W31 | 0.31 | 0.13 | 0.63 | 0.11 | 0.05 | 0.11 | 0.00 | 0.00 | 0.09 | 0.09 | 0.14 | 0.07 | 0.10 | 0.08 | |
| W32 | 0.94 | 1.13 | 0.63 | 0.11 | 0.16 | 0.11 | 0.00 | 0.00 | 0.09 | 0.09 | 0.05 | 0.11 | 0.08 | 0.10 | |
| W41 | 0.95 | 1.14 | 0.63 | 0.14 | 0.12 | 0.06 | 0.09 | 0.11 | 0.09 | 0.00 | 0.00 | 0.14 | 0.14 | 0.14 | 0.28 |
| W42 | 0.63 | 0.25 | 0.18 | 0.06 | 0.08 | 0.09 | 0.04 | 0.05 | 0.00 | 0.00 | 0.00 | 0.06 | 0.06 | 0.06 | |
| W43 | 0.39 | 0.39 | 0.42 | 0.04 | 0.03 | 0.08 | 0.06 | 0.03 | 0.00 | 0.00 | 0.00 | 0.04 | 0.04 | 0.04 | |
| W51 | 0.00 | 0.00 | 0.00 | 0.08 | 0.10 | 0.11 | 0.14 | 0.14 | 0.03 | 0.06 | 0.06 | 0.00 | 0.00 | 0.00 | 0.23 |
| W52 | 0.00 | 0.00 | 0.00 | 0.05 | 0.06 | 0.05 | 0.04 | 0.06 | 0.08 | 0.13 | 0.04 | 0.00 | 0.00 | 0.00 | |
| W53 | 0.00 | 0.00 | 0.00 | 0.06 | 0.03 | 0.03 | 0.06 | 0.04 | 0.12 | 0.05 | 0.14 | 0.00 | 0.00 | 0.00 |
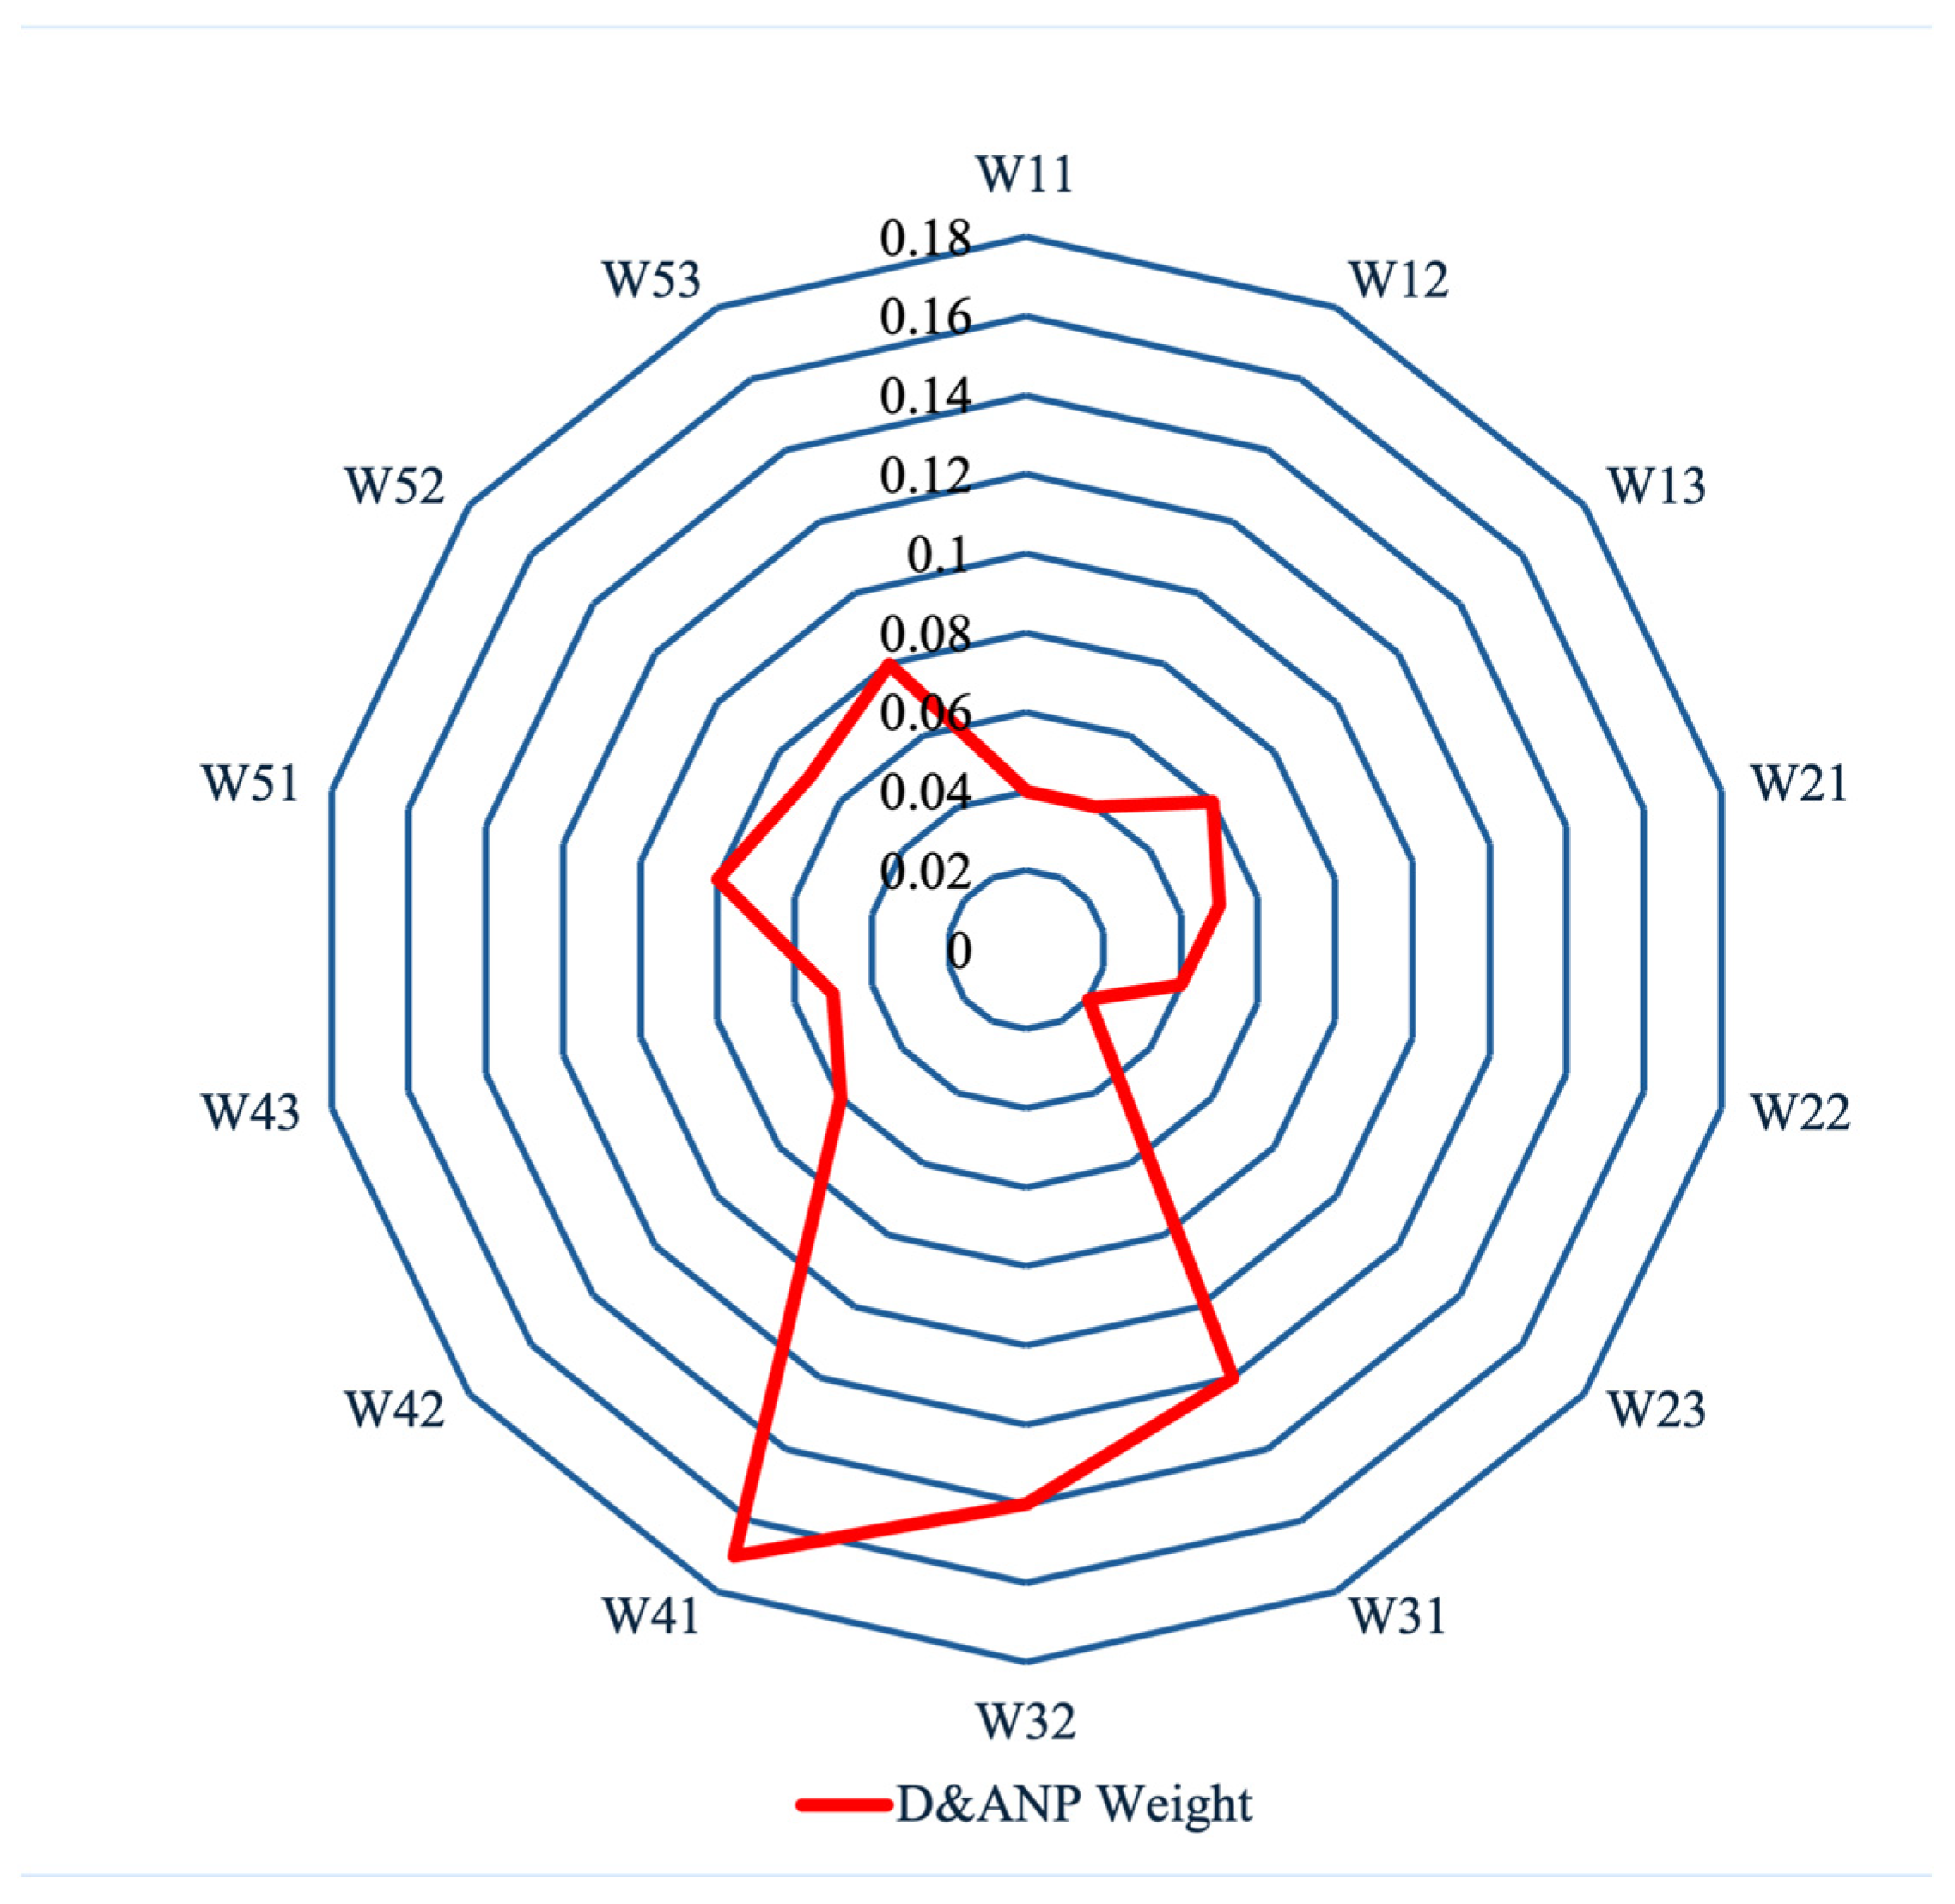
| Attribute | D&ANP Weight | Average Suitability | Average Performance Value |
|---|---|---|---|
| W11 | 0.04 (11) | 6.75 (12) | 0.27 (12) |
| W12 | 0.04 (11) | 6.75 (12) | 0.27 (12) |
| W13 | 0.06 (7) | 6.75 (12) | 0.41 (8) |
| W21 | 0.05 (9) | 8.25 (1) | 0.41 (8) |
| W22 | 0.04 (11) | 8.25 (1) | 0.33 (11) |
| W23 | 0.02 (14) | 8.00 (4) | 0.16 (14) |
| W31 | 0.12 (3) | 7.25 (9) | 0.87 (3) |
| W32 | 0.14 (2) | 7.75 (5) | 1.09 (2) |
| W41 | 0.17 (1) | 8.25 (3) | 1.40 (1) |
| W42 | 0.06 (7) | 7.50 (6) | 0.45 (7) |
| W43 | 0.05 (9) | 7.25 (9) | 0.36 (10) |
| W51 | 0.08 (4) | 7.25 (9) | 0.58 (5) |
| W52 | 0.07 (6) | 7.50 (6) | 0.53 (6) |
| W53 | 0.08 (4) | 7.50 (6) | 0.60 (4) |
| Summation | 1.00 | 105.00 | 7.72 |
| Attribute | MMI | OI | MEI | 3CI |
|---|---|---|---|---|
| W11 | Ideal | Ideal | Non-ideal | Non-ideal |
| W12 | Ideal | Ideal | Non-ideal | Non-ideal |
| W13 | Ideal | Non-ideal | Non-ideal | Ideal |
| W21 | Ideal | Non-ideal | Non-ideal | Non-ideal |
| W22 | Ideal | Ideal | Non-ideal | Non-ideal |
| W23 | Ideal | Non-ideal | Non-ideal | Non-ideal |
| W31 | Ideal | Ideal | Non-ideal | Non-ideal |
| W32 | Ideal | Ideal | Ideal | Non-ideal |
| W41 | Ideal | Non-ideal | Ideal | Non-ideal |
| W42 | Ideal | Ideal | Ideal | Non-ideal |
| W43 | Ideal | Non-ideal | Non-ideal | Non-ideal |
| W51 | Ideal | Non-ideal | Non-ideal | Non-ideal |
| W52 | Ideal | Non-ideal | Non-ideal | Ideal |
| W53 | Ideal | Ideal | Non-ideal | Non-ideal |
Disclaimer/Publisher’s Note: The statements, opinions and data contained in all publications are solely those of the individual author(s) and contributor(s) and not of MDPI and/or the editor(s). MDPI and/or the editor(s) disclaim responsibility for any injury to people or property resulting from any ideas, methods, instructions or products referred to in the content. |
© 2025 by the authors. Licensee MDPI, Basel, Switzerland. This article is an open access article distributed under the terms and conditions of the Creative Commons Attribution (CC BY) license (https://creativecommons.org/licenses/by/4.0/).
Share and Cite
Lee, H.-H.; Chen, C.-H.; Kao, L.-Y.; Wu, W.-T.; Liu, C.-H. New Perspectives on the Causes of Stagnation and Decline in the Sharing Economy: Application of the Hybrid Multi-Attribute Decision-Making Method. Mathematics 2025, 13, 1051. https://doi.org/10.3390/math13071051
Lee H-H, Chen C-H, Kao L-Y, Wu W-T, Liu C-H. New Perspectives on the Causes of Stagnation and Decline in the Sharing Economy: Application of the Hybrid Multi-Attribute Decision-Making Method. Mathematics. 2025; 13(7):1051. https://doi.org/10.3390/math13071051
Chicago/Turabian StyleLee, Hsu-Hua, Chien-Hua Chen, Ling-Ya Kao, Wen-Tsung Wu, and Chu-Hung Liu. 2025. "New Perspectives on the Causes of Stagnation and Decline in the Sharing Economy: Application of the Hybrid Multi-Attribute Decision-Making Method" Mathematics 13, no. 7: 1051. https://doi.org/10.3390/math13071051
APA StyleLee, H.-H., Chen, C.-H., Kao, L.-Y., Wu, W.-T., & Liu, C.-H. (2025). New Perspectives on the Causes of Stagnation and Decline in the Sharing Economy: Application of the Hybrid Multi-Attribute Decision-Making Method. Mathematics, 13(7), 1051. https://doi.org/10.3390/math13071051