1. Introduction
Convolutional neural networks (CNNs) have radically transformed the field of computer vision, becoming the primary tool for the task of image classification [
1,
2]. This popularity is not fortuitous, but the result of unique characteristics that make them extremely efficient and effective for processing data in grid form through key features such as convolutions, which extract local patterns in a hierarchical form [
3]. In addition, its structure takes advantage of spatial relationships in the data. Traditional methods using machine learning techniques such as support vector machines (SVMs) or K-Nearest Neighbors (KNNs) need descriptors such as Histogram of Oriented Gradients (HOGs), Speeded-Up Robust Features (SURFs), and Scale-Invariant Feature Transform (SIFT) to extract features from images [
4,
5,
6], carefully designed for each type of problem, which is expensive. Unlike traditional methods, which require the manual design of features in the images, CNNs learn these features directly from the data during the training process. The first layers of the network detect basic patterns, such as edges and lines, while deeper layers combine these patterns into more complex representations [
7]. This allows CNNs to adapt to a wide range of tasks and images, without the need for human intervention to define which features are relevant. CNNs consist of basic layers such as convolutional layers that are responsible for extracting important features through the convolution operation. On the other hand, pooling layers reduce the size of the feature maps generated by the convolution layers. Finally, the fully connected layers are responsible for classifying the features found.
However, due to the need to adjust multiple architectural aspects to optimize training, CNNs have a considerable amount of hyperparameters. The hyperparameters are parameters that are configured before the training process and affect the architecture and performance of the model [
8]. Some examples of hyperparameters are the number of convolutional layers, size of convolution filters, number of pooling layers, etc. The number of hyperparameters available to modify generates a research question for this work: what values should the hyperparameters have to obtain the best possible result in image classification? The response to this question is complex because it is possible to consider the architecture of a neural network as a combinatorial problem that depends on how many hyperparameters are considered to define the number of possible solutions.
To avoid this combinatorial problem, some authors use pretrained networks such as VGG16 [
9] and VGG19 [
10]; however, it is not always possible to have an extensive database, and the deeper a CNN is, the more likely it is that the model will be over-fitted. Basically, a model that suffers from overfitting performs exceptionally well on the training set, but its performance drops significantly when evaluated with test data. It is common to try to find the best possible architecture manually, i.e., by trying different architectures and conserving the best one found. This method is very time consuming and requires a lot of human effort [
11].
Therefore, it is important to have a method that automatically generates CNN architectures and finds the best solution. Neural Architecture Search (NAS) is a branch of machine learning and artificial intelligence aimed at automating the design of neural network architectures [
12]. Its primary goal is to discover highly effective network structures for specific tasks with minimal human intervention [
13]. NAS uses optimization techniques to automatically explore the search space and evaluate different neural network architectures to deliver the best solution found based on a chosen evaluation metric. These strategies include random search, evolutionary algorithms, and gradient-based optimization techniques, etc.
In the literature, a convention is reached for NAS in terms of search space and evaluation strategy. However, the search strategy is approached in different ways by different authors. For instance, in the works [
14,
15,
16,
17] the authors use Bayesian optimization for classification of medical images of different improvements over the state of the art. On the other hand, using evolutionary computation and genetic algorithms (GAs) in the works [
18,
19,
20], due to their versatility in multi-purpose databases, authors concluded that these algorithms are effective in finding architectures with better results than the literature. Proceeding with the exploration of population-based algorithms as discussed in the literature [
21,
22,
23,
24], the particle swarm optimization algorithm (PSA) is used in multi-purpose databases demonstrating efficient results. The choice of technique is influenced by the author’s preferences and the computational hardware available. The advantage of using population algorithms such as GAs is that they are highly parallelizable to reduce the execution time of the techniques. The key contributions of this study include the following:
A novel method to generate automatically convolutional neural networks architectures for binary classification on image databases using an estimation of distribution algorithm.
The present method was tested on five databases with different sizes obtaining an F1-score of 98.2%, 98.7%, 97.2%, 98.4%, and 98.7% for each one, better results than the literature.
Comparative analysis of different metaheuristics in NAS demonstrating the effectiveness of the Boltzmann Univariate Marginal Distribution (BUMDA) optimization method in the field of NAS.
In this work, the following sections are presented:
Section 2 shows the proposed methods for the search of architectures. In
Section 3, the databases used in this work are presented in detail.
Section 4 shows the tests performed and the results obtained from BUMDA with the compared methods. Finally, in
Section 5, the work is concluded and future work for this research is presented.
2. Methods
This section presents the general method on which the proposed method is based and the optimization technique selected for the automatic search of architectures. Finally, the proposal for this research is described.
2.1. Neural Architecture Search
NAS has evolved along with advances in deep neural networks (DNNs). The effectiveness of a deep learning model for a specific task is highly dependent on the complexities of its network architecture. To address this challenge, it is necessary to automate the design process using machine learning, which is the main goal of NAS [
25]. The steps of NAS are described below, and the general methodology is shown in
Figure 1.
Search space: A search space is defined that describes all possible architectures that could be evaluated. This space includes network hyperparameters such as the number of layers, the type of layers (convolutional, recurrent, fully connected, etc.), the connectivity between layers, the learning ratio, among others.
Architecture generation: Algorithms are used to automatically generate new architectures within the search space. These architectures can be generated randomly or using more sophisticated approaches, such as metaheuristics.
Performance evaluation: Each generated architecture is evaluated on a training dataset using some performance criterion, such as F1-score in the classification task.
Model update: Based on the evaluation results, the automatic search model adjusts its parameters to improve the generation of architectures in subsequent iterations. This process is repeated several times to continuously refine the model performance.
Selection of the best architecture: After a given number of iterations, the automatic search model selects the architecture that has demonstrated the best performance according to the specified criteria.
NAS has three basic concepts: the search space, the search strategy, and the evaluation strategy. The search space defines the possible potential architectures that can be theoretically represented. Integrating prior knowledge about the typical properties of architectures suitable for a given task can reduce the search space and speed up the exploration process. The search strategy is based on the approach to navigating the search space, addressing the delicate balance between exploration and exploitation. The goal is to quickly identify high-performance architectures, while avoiding premature convergence to a zone of local optima. Hence, use is made of metaheuristics, as they inherently possess the necessary capabilities to effectively achieve this balance. For performance estimation, any CNN evaluation metric such as accuracy or F1-score can be used. This implies that each performance estimation involves training a CNN architecture and computing its performance by means of the metrics.
2.2. Boltzmann Univariate Marginal Distribution
Soft computing constitutes a subfield of artificial intelligence that is distinguished by its reliance on uncertainty management, imprecision, and approximation to address real-world problems [
26]. Unlike hard computing, which employs precise methods, soft computing encompasses techniques that can effectively handle ambiguity [
27]. Metaheuristics are closely associated with the soft computing domain because of their characteristic of not guaranteeing optimal solutions [
28]. However, they excel in discovering feasible solutions in a reasonable amount of time, especially when faced with complex and high-dimensional problems. One of the characteristics of metaheuristics is their potential to prolong execution times. Consequently, it is crucial to discern the appropriate context for their application. These techniques are often used to address non-polynomial problems (NPs), i.e., those in which, given a proposed solution, verification can be performed in polynomial time, but the determination of the optimal solution is intractable in polynomial time, as exemplified by the NAS problem.
According to several works [
29,
30,
31], metaheuristic methods represent a primary domain within stochastic optimization, employing varying degrees of randomness to discover solutions that are as optimal as possible for challenging optimization problems. In designing a metaheuristic, two features must be considered in the techniques: exploration of the search space to diversify and exploitation of the best solutions to intensify [
32]. In exploitation, promising regions continue to be explored with the prospect of finding better solutions. On the other hand, exploration causes unexplored regions to be visited to rule out whether promising solutions exist there. Population metaheuristics are optimization algorithms that operate on a population of candidate solutions, rather than working on a single solution at a time, as trajectory metaheuristics do. Some techniques are based on evolutionary computation, such as genetic algorithms, and others on probabilistic methods known as estimation of distribution algorithms (EDAs). In an EDA, the statistical distribution of promising solutions is modeled to generate new solutions. These algorithms learn a probabilistic model that describes the most suitable solutions.
In the present research, as part of the EDAs, the Boltzmann Univariate Marginal Distribution (BUMDA) obtained the best results compared to iterated local search (ILS), simulated annealing (SA), and genetic algorithms (GAs). BUMDA in particular uses a Normal-Gaussian model to approximate the Boltzmann distribution, so the formulas for calculating the mean and variance parameters of the Gaussian model are derived from the analytical minimization of the Kullback–Leibler divergence [
33]. The Gaussian distribution obtains a better bias for intensively sampling the most promising regions than simply using the maximum likelihood estimator of the selected set. Algorithm 1 shows the BUMDA pseudocode.
| Algorithm 1. Pseudocode of BUMDA. |
| | Input: Population size N, minimum variance allowed |
| | Output: Best individual found I* |
| 1 | ; |
| 2 | do |
| 3 |
|
| 4 | Evaluate and truncate the population; |
| 5 | by using the selected set |
| 6 |
|
| 7 | and insert the elite individual; |
| 8 | return best individual found I*; |
Therefore, BUMDA has the following features:
BUMDA converges to best approximation.
The variance tends to 0 for a large number of generations.
BUMDA has a low number of parameters required for tuning.
The average quickly shifts to the region where the best solutions are found.
2.3. Proposed Method
First, the search space was defined with binary encoding in order to allow the metaheuristics to work naturally with the representation of the architectures. For the search space, in this work hyperparameters are selected based on the literature [
15,
18,
21] to build the architectures, as shown in
Table 1. The hyperparameters were encoded in a binary array of size 29 that contains each of them, and the range of values depends on the length of each hyperparameter; in consequence, the complexity of the problem is
. For instance, if the hyperparameter has only 2 options, a bit is used where 0 represents the first option and 1 the second. If the hyperparameter can have a range of values, that range is explicitly defined by the bit-to-decimal conversion.
Following the workflow in
Figure 1, four metaheuristics were tested defining as objective function maximizing the F1-score as metrics to assess the effectiveness of the network during the optimization process [
34,
35,
36]. The metrics typically employed for the assessment of CNNs are presented in Equations (1)–(4). The F1-score is used in this work because it is the harmonic mean between precision and recall and is important because it penalizes both false positive and false negative errors.
Accuracy refers to the proportion of correct predictions over the number of observations.
Precision is calculated by dividing the number of correct predictions by the total number of predictions. This metric evaluates the accuracy of the correct data and compares it to the overall data returned.
The recall metric reports how much the machine learning model can identify.
F-Measure is calculated by taking the harmonic mean between precision and recall.
The elite architecture was retained for each technique and database considering the best F1-score in training and finally tested on a test set validating the efficient performance.
4. Results and Discussion
In this section, we emphasize the selection of the selected metaheuristic for the proposed method with a statistical analysis and compare it with other techniques in the literature showing superior results with an architecture found automatically by the method.
The experiments were conducted using a server equipped with robust specifications: 128 GB of RAM, an Intel Xeon Silver 4214 processor, and an NVIDIA Titan RTX 24 GB graphics card. This server compatibility and powerful tools that helped the execution of the population algorithms, such as the Parallel Computing Toolbox, allowed us to leverage the cores and finish the process more efficiently. In addition, MATLAB 2024b integrates with hardware such as GPUs (NVIDIA) to accelerate training. The construction of CNNs from scratch during algorithms execution was facilitated by the Deep Learning Toolbox.
Comparative Analysis of Metaheuristics
Some of the selected techniques have been previously tested in NAS as described in the literature review. The iterated local search (ILS), simulated annealing (SA), and genetic algorithms (GAs) were chosen because of their effectiveness in combinatorial problems and low computational cost. In addition, the algorithms work naturally with binary coding. The objective function of each algorithm was set as the F1-score, in order to maximize its value.
Table 3 shows an overview of the parameters of each algorithm, ensuring the same number of iterations to standardize all processes. A total of 200 function evaluations were considered as it was proven to be sufficient to find an efficient solution due to the convergence of the algorithms.
The algorithms used for NAS were run 30 times for each database with the same number of function evaluations.
Table 3 shows the minimum, maximum, mean, median, and standard deviation statistical results for the F1 score. For the experiments, the database was taken and divided into 80% for training, 10% for validation, and 10% for testing. The results shown in
Table 4 are from the training set.
As can be seen from the results in
Table 4, the technique with the best F1-score was BUMDA, which also has the lowest standard deviation. As mentioned, the techniques were tested 30 times on each database.
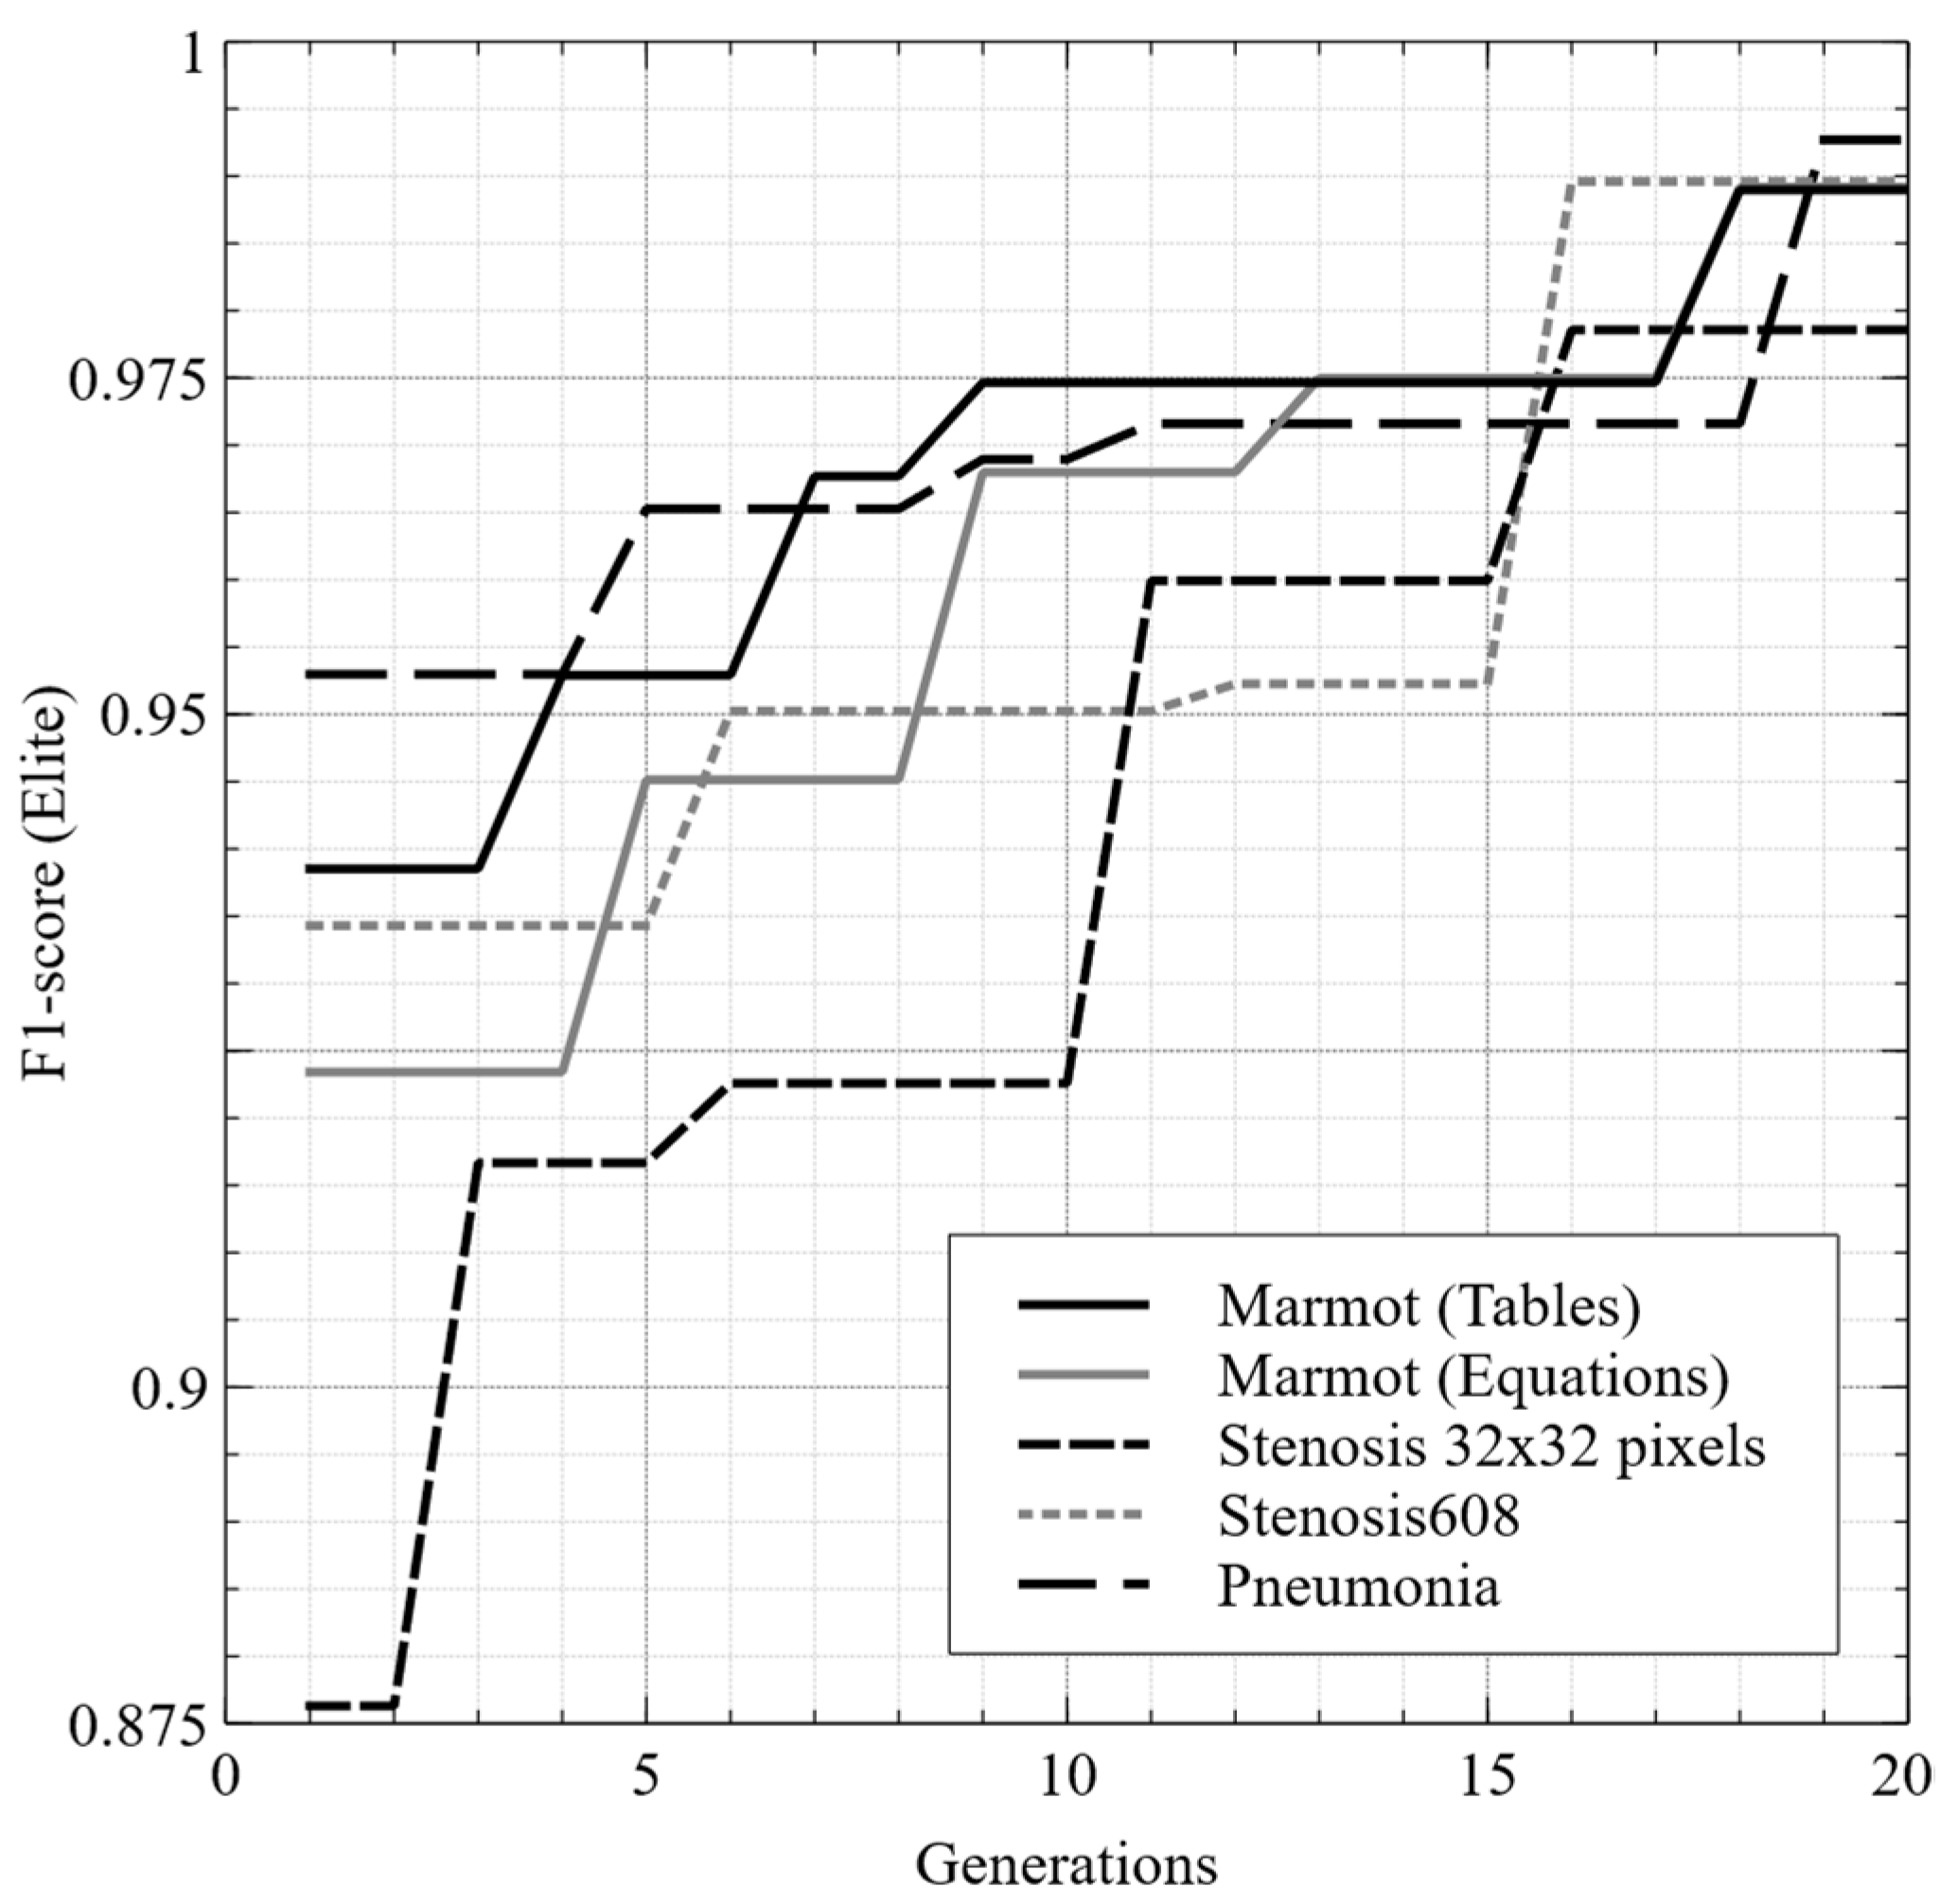
Figure 7 shows the best training of BUMDA on each of them, observing the evolution of the elite solution over 20 generations. A low mean in the F1-score statistical data indicates that the algorithm on average did not find better solutions than the other algorithms. Probably, some algorithms with a low mean were trapped in local optima. On the other hand,
Table 5,
Table 6,
Table 7,
Table 8 and
Table 9 show a comparison of the best result (BUMDA) with the best results in the literature using the same databases. The methods described in the literature review use techniques that, according to the authors, need more computational weight due to the different ways of testing performance. The execution times of the reviewed papers are not provided; moreover, the acronym NP stands for not provided by the author.
In
Table 5, most of the works reported in the literature for classification and detection of tables use deformable convolutional networks or some of their variants. All reported architectures were proposed empirically by testing different configurations. The proposed method overcame literature, generating the architecture automatically. In this case, the authors provide three possible metrics to evaluate the models.
Table 5.
Comparison of the best results in the literature for the Marmot database for tables [
37] with the proposed method in testing set.
Table 5.
Comparison of the best results in the literature for the Marmot database for tables [
37] with the proposed method in testing set.
| Models | Accuracy | Precision | Recall | F1-Score |
|---|
| DeCNT [42] | NP | 84.9 | 94.6% | 89.5% |
| CDeC-Net [43] | NP | 97.5% | 93% | 95.2% |
| HybridTabNet [44] | NP | 96.2% | 96.1% | 95.6% |
| CasTabDetectorRS [45] | NP | 95.2% | 96.5% | 95.8% |
| DCTable [46] | NP | 96.9% | 97.1% | 96.9% |
| Proposed | 97.4% | 97% | 97.5% | 97.2% |
In
Table 6, authors used the Marmot database [
38] for classification of equations in digital documents using deformable convolutional networks and variants. The proposals were empirical, having efficiencies that were overcome by the proposed method.
Table 6.
Comparison of the best results in the literature for the Marmot database for equations [
38] with the proposed method in testing set.
Table 6.
Comparison of the best results in the literature for the Marmot database for equations [
38] with the proposed method in testing set.
| Models | Accuracy | Precision | Recall | F1-Score |
|---|
| WAP method [47] | 93% | NP | NP | NP |
| Cascade Network [48] | 93% | NP | NP | NP |
| Proposed | 98.71% | 98.75% | 98.72% | 98.73% |
Table 7 shows two different approaches to compare with the proposed method. In the work [
49], metaheuristics are used to choose the best features to classify coronary stenosis images using machine learning. This generates an approach that in execution and testing times is superior to using deep learning as CNNs that are used in work [
39], generating the architecture empirically but having better efficiency. However, combining both concepts as in the proposed method produced better results than separately.
Table 7.
Comparison of the best results in the literature for the natural stenosis database [
39] with the proposed method in testing set.
Table 7.
Comparison of the best results in the literature for the natural stenosis database [
39] with the proposed method in testing set.
| Models | Accuracy | Precision | Recall | F1-Score |
|---|
| Features selection [49] | 88% | NP | NP | NP |
| CNN stenosis [39] | 90% | NP | NP | NP |
| Proposed | 97.27% | 97.73% | 96.73% | 97.23% |
Paper [
40] released the database for coronary stenosis whose results are shown in
Table 8. As in this paper, the authors used BUMDA to optimize the number of extracted features to be used in a machine learning system to classify coronary stenosis. As can be seen, the difference between literature and this work is the proposal to optimize a deep learning method such as CNNs, resulting in a better efficiency than using machine learning.
Table 8.
Comparison of the best results in the literature for the natural Stenosis608 database [
40] with the proposed method in testing set.
Table 8.
Comparison of the best results in the literature for the natural Stenosis608 database [
40] with the proposed method in testing set.
| Models | Accuracy | Precision | Recall | F1-Score |
|---|
| Feature selection with BUMDA [40] | 92% | NP | NP | 92% |
| Proposed | 98.33% | 98.39% | 98.33% | 98.36% |
For the results in
Table 9 with the pneumonia database, the authors generally use pretrained CNNs and data augmentation as the classes are unbalanced. The authors in paper [
50] use a weighted classifier to solve this problem. In the proposal of this work, the database was truncated to balance it and by the method used it was not necessary to make efforts to generate more data.
Table 9.
Comparison of the best results in the literature for the pneumonia database [
41] with the proposed method in testing set.
Table 9.
Comparison of the best results in the literature for the pneumonia database [
41] with the proposed method in testing set.
| Models | Accuracy | Precision | Recall | F1-Score |
|---|
| CNN from scratch and data augmentation [51] | 93.73 | NP | NP | NP |
| Lightweight deep learning architecture [52] | 97.09% | 97% | 98% | 97% |
| CNN with weighted classifier [50] | 98.43% | 98.26% | 99% | 98.63% |
| Proposed | 98.72% | 98.76% | 98.68% | 98.7% |
According to the comparative results, the method that always obtained better results with respect to accuracy or F1-score was the method proposed using BUMDA. One of the advantages of BUMDA is that it is a population algorithm with solutions independent of each other; it is also highly parallelizable, which facilitates the efficiency of the technique with respect to path algorithms. BUMDA found solutions that the other algorithms did not find, so we conclude that it exploited the search space better. The results were obtained automatically for each database with the proposed method using BUMDA so human intervention was minimal in the proposal of each architecture. While EDAs such as BUMDA have already been used to optimize the total of features extracted from images for classification with machine learning, to the best of our knowledge, this is the first EDA applied to NAS. The testing times for classification of each database were 0.6 s, 1 s, 0.7 s, 0.5 s, and 0.1 s, respectively, as the databases were presented. It can be seen that the deeper an architecture is, the longer it takes to classify, also depending on the size of the input.
Figure 8,
Figure 9,
Figure 10,
Figure 11 and
Figure 12 show the architectures obtained from the proposed method for each database. A single architecture is not able to classify all databases; however, the proposed method is generic as the database can be replaced to obtain a specific architecture for each problem.
The proposal presented in this paper is limited by the restrictions of the value ranges. Some hyperparameters such as the learning ratio are continuous variables; therefore, the number of values considered in this work may not be adequate, despite taking into consideration the typical values used. The computational time is crucial to consider increasing the hyperparameter ranges; the hardware with which the experiments were performed is robust, but is limited by availability. As the search space increases, iterations must be increased to explore it efficiently, which increases the computational cost. This also affects the exploration of various kernel sizes in the convolutions and the number of layers. Therefore, the values were determined to maintain the search in size-controlled architectures.
5. Conclusions
In this paper, a novel method for automatic search of neural architectures based on an estimation of distribution algorithm (EDA) for binary classification problems was presented. The proposal helped to better explore the search space with a complexity of O() with , finding better architectures with optimal results. The hyperparameters were encoded in a binary array of size 29 and using the Boltzmann Univariate Marginal Univariate Distribution algorithm (BUMDA) chosen from four metaheuristics; the best possible architectures were obtained for five databases. In addition, the proposed method was compared with multiple state-of-the-art methods, testing its efficiency in terms of accuracy and F1-score. In experimental results, the proposed method with BUMDA was run 30 times in training and achieved F1-scores of 97.2%, 98.73%, 97.23%, 98.36%, and 98.7% in its best architecture with the test set, better results than the literature. The proposals of the state of the art, besides being empirically generated, tried to solve problems with the databases such as unbalancing to obtain the best possible efficiency, which generated a greater effort for the authors. With the proposed method this was not necessary, and the results were superior. For the test set, the computational time of the proposed method was ≈0.6 s, 1 s, 0.7 s, 0.5 s, and 0.1 s, respectively, being an efficient time but depending on the network depth and input size due to the increased number of calculations and memory usage.


