Article

Optimal Design of Integrated Energy Systems Based on Reliability Assessment

1
Department of Electrical Engineering, Kangwon National University, Samcheok 25913, Republic of Korea
2
Department of Quantum Information Science and Engineering, Sejong University, Seoul 05006, Republic of Korea
*
Authors to whom correspondence should be addressed.
Mathematics 2025, 13(23), 3734; https://doi.org/10.3390/math13233734
Submission received: 30 October 2025 / Revised: 17 November 2025 / Accepted: 19 November 2025 / Published: 21 November 2025

Abstract

This paper presents an optimal-design methodology for small-scale Integrated Energy Systems (IESs) that couple electricity and heat in distributed networks. A hybrid reliability assessment integrates probabilistic state enumeration with scenario-based simulation. Mathematically, the design is cast as a stochastic, reliability-driven ranking: time-sequential Monte Carlo (MC) produces estimators of Loss of Load Probability (LOLP), Expected Energy Not Supplied (EENS), and Self-Sufficiency Rate (SSR), which are normalized and combined into a Composite Reliability Index (CRI) that orders candidate siting/sizing options. The case study is the D-campus microgrid with Photovoltaic (PV), Combined Heat and Power (CHP), Fuel Cell (FC), Battery Energy Storage Systems (BESSs), and Heat Energy Storage Systems (HESSs; also termed TESs), across multiple siting and sizing scenarios. Results show consistent reductions in LOLP and EENS and increases in SSR as distributed energy resource capacity increases and resources are placed near critical nodes, with the strongest gains observed in the best-performing configurations. The CRI also reveals trade-offs across intermediate scenarios. The operational concept of the campus Energy Management System (EMS), including full operating modes and scheduling logic, is developed to maintain a design focus on reliability-driven decision making. Probability-based formulations, reliability metrics, and the sequential MC setup underpin the proposed ranking framework. The proposed method supports Distributed Energy Resource (DER) sizing and siting decisions for reliable, autonomy-oriented IESs.

1. Introduction

Integrated energy systems (IESs) have emerged as a practical means to address contemporary challenges in energy management. By coordinating multiple energy carriers (e.g., electricity, thermal energy, and gas), IESs can improve overall efficiency, reliability, and operational flexibility, particularly in distributed settings such as campus microgrids and residential clusters.
Reliability assessment for multi-energy systems is more complex than for single-carrier networks. Traditional methods developed for electrical grids typically rely on metrics such as Loss of Load Probability (LOLP) and Expected Energy Not Supplied (EENS), and therefore do not fully represent cross-domain interactions. To overcome these limitations, prior studies have proposed multi-energy reliability frameworks. Lei et al. introduced a hierarchical decoupling strategy for electricity–gas systems that improves computational efficiency [1], while Chen et al. presented a fast analytical method that reduces evaluation time without sacrificing accuracy [2]. Fu et al. analyzed correlated failures across electricity, gas, and heat infrastructures [3]; Meng et al. explored user-centric metrics that consider the impact of interruptions across carriers [4]; and Cao et al. developed a reliability tracing approach, using cooperative game theory to identify critical components in multi-energy networks [5]. Collectively, this literature provides a strong foundation for modeling coupled infrastructures.
Building on these contributions, a number of subsequent studies have examined electricity–heat (and, in some cases, gas) coupled systems with a stronger focus on operational uncertainty, sectoral interactions, and the buffering role of shared resources. Wang et al. developed an operational reliability framework for integrated energy systems that explicitly models gas-flow dynamics and demand-side flexibilities, showing that coordinated multi-carrier operation can improve adequacy over time-sequential operation horizons [6]. Xie et al. studied multi-regional, sector-coupled energy systems in which demand response alliances and shared energy storage are scheduled jointly, illustrating how cross-regional coordination and common storage can mitigate variability originating in different carriers [7]. To address the computational burden that typically accompanies probabilistic assessment of systems with large renewable shares, Wang et al. proposed a four-stage, fast reliability assessment framework that preserves accuracy while enabling large-scale storage to act as an adequacy-supporting resource [8]. On the network-security side, Li et al. introduced a simulation method for cascading failures in integrated electric–gas systems based on an energy-circuit representation, thereby clarifying how faults in one carrier can propagate to the other [9]. Wang et al. further extended reliability evaluation to long-term horizons in integrated electricity–gas systems with distributed hydrogen injections, highlighting that fuel-pathway dynamics can materially influence adequacy outcomes [10]. Recently, Niu et al. presented a dynamic reliability assessment framework that tracks cross-carrier cascading effects in integrated energy systems, pointing toward fully time-dependent, operation-aware reliability analysis [11]. Taken together, these studies indicate that state-of-the-art work is moving toward probabilistic, multi-carrier, and operationally detailed reliability assessment.
Nevertheless, most of these frameworks have been formulated with large or meshed urban/regional infrastructures in mind, where multi-node thermal networks, extensive gas grids, and long-term carrier dynamics are all present. As a result, they tend to prioritize system-level adequacy and methodological generality over application-oriented guidance—such as how to site distributed energy resources (DERs) on a small campus feeder, how to divide capacity between electrical and thermal assets, or how to report cross-domain reliability in a form that planners can directly use. This creates a gap between current multi-energy reliability methods [6,7,8,9,10,11] and the practical needs of campus or microgrid operators. To address this gap, this paper tailors a reliability-driven design workflow specifically to a small-scale IES in a distribution network and restructures the assessment so that electrical and thermal reliability indices, together with the Self-Sufficiency Rate (SSR), can be aggregated into a single Composite Reliability Index (CRI) directly usable for siting/sizing comparisons. Recent campus- or community-scale studies have mainly addressed multi-energy coordination from an operational or economic viewpoint, but they seldom report electrical and thermal reliability together with self-sufficiency in a form directly usable for siting/sizing decisions. This paper therefore advances the application-oriented side of IES planning by making reliability the primary driver of design.
Accordingly, this paper develops a reliability assessment framework for small-scale IESs in distributed networks. The framework blends probabilistic reliability modeling with scenario-based sequential simulation to reflect stochastic renewables, load fluctuations, and component up/down states. To compare alternatives consistently, the CRI normalizes and aggregates cross-domain reliability metrics (LOLP and EENS for electricity and heat) together with SSR under user-set weights. Applied to a campus microgrid (“D-campus”), the framework evaluates multiple siting and sizing scenarios and sensitivity cases. The contributions are threefold:
  • Stochastic, reliability-driven design workflow: Uncertainty representation, sequential Monte Carlo (MC), cross-domain indices, and a normalized aggregation are linked into a single ranking rule for siting and sizing.
  • Compact index for transparent trade-offs: The CRI provides a single, monotone score across planning priorities; lower values indicate better overall reliability and autonomy.
  • Reproducible campus-scale case study: The step-by-step procedure and results show how the workflow guides DER siting and sizing toward an improved configuration.

2. Materials and Methods

The proposed methodology is implemented in four sequential steps: (i) define the IES configuration and Energy Management System (EMS) operating modes; (ii) model component reliabilities and formulate electrical/thermal adequacy indices; (iii) run time-sequential MC simulations for alternative DER siting/sizing scenarios under identical load and renewable profiles; and (iv) normalize and aggregate the resulting indices into the CRI for comparative assessment.

2.1. Reliability-Driven Design Framework for Small IESs

The proposed hybrid reliability assessment framework for designing small-scale integrated energy systems (IESs) in distributed networks is structured into several stages, systematically combining probabilistic reliability modeling and scenario-based simulations. This integrated approach explicitly addresses stochastic variability in renewable generation, system loads, and the interdependencies between electrical, thermal, and gas networks.

2.1.1. Configuration and Operational Concept of the IES

The studied IES, referred to as the D-campus microgrid [12], is modeled with key energy components including photovoltaic (PV) generation, battery energy storage systems (BESS), combined heat and power (CHP) units, fuel cells (FC), heat energy storage systems (HESS; also termed thermal energy storage, TES), gas boilers, and electric heaters, as illustrated in Figure 1. Each component is characterized by technical specifications (capacity, efficiency, operational constraints), reliability parameters (failure rates λ, repair rates μ, unavailability U), and operational interactions. Electricity is primarily supplied by PV (1000 kWe), CHP (115 kWe), and FC (5 kWe), interconnected via an internal electrical grid, which includes BESS (2000 kWhe) to manage variability in generation and demand. Thermal demands, including domestic hot water and space heating, are satisfied by CHP (502 MJt/h), FC (14 MJt/h), gas boilers, and thermal storage (HESS, 7745 MJt), interconnected through a dedicated heat grid. External connections to the main electricity network (KEPCO, Korea Electric Power Corporation, Rohyo City, Republic of Korea) and gas network (HYGAS, Hae-Yang City Gas Co., Ltd., Gwangju, Republic of Korea) allow the exchange of surplus or deficit energy as required, enhancing operational flexibility and reliability.
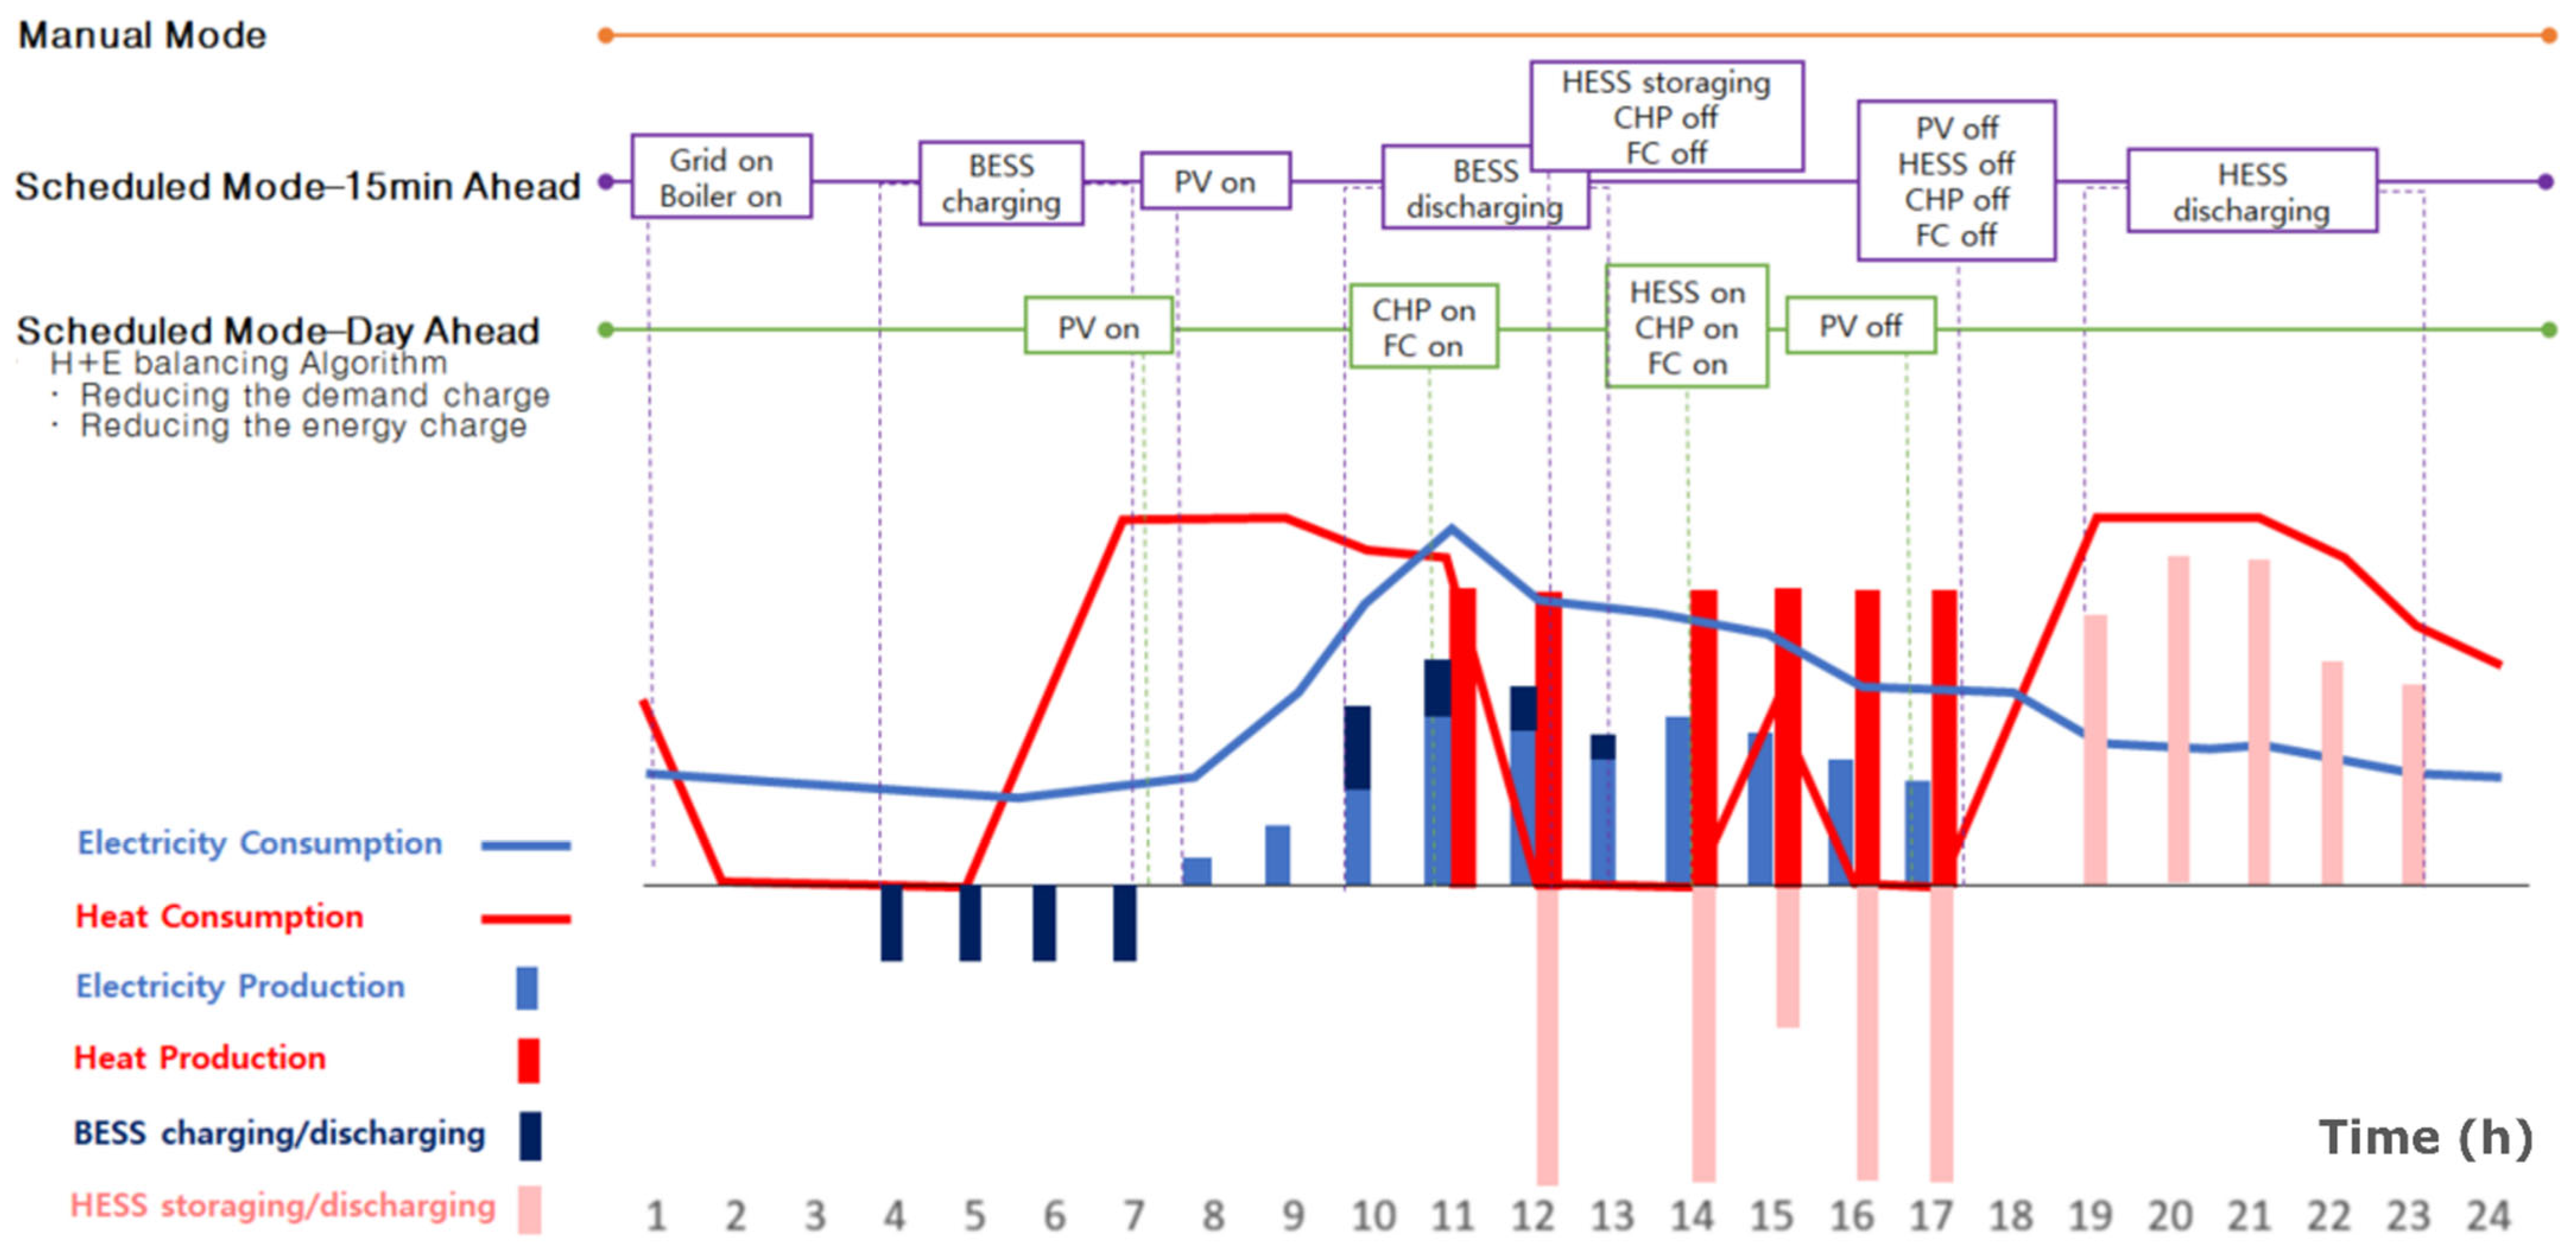
Given the inherent interdependencies between heat and electricity infrastructure, optimizing the operation of the IES represents a complex challenge that requires sophisticated functionalities within the EMS. The operational concept of the EMS for the D-campus IES, demonstrating integrated heat and electricity management, is illustrated in Figure 2.
Only a brief conceptual reference to EMS operations is retained in the main text (Figure 2). Full operating modes and scheduling logic are provided in Appendix A and can be adopted without altering the design methodology.

2.1.2. Probabilistic Reliability Modeling and Metrics Formulation

The reliability assessment begins with probabilistic modeling, employing a state enumeration approach to represent possible component states (operational, derated, or failed). Transition probabilities among these states are derived from historical reliability data. To efficiently handle system complexity and computational requirements, hierarchical decoupling strategies, similar to the methods presented by Lei et al. [1], are adapted. This process partitions the integrated system into manageable sub-systems (electric, thermal, and gas domains), enabling targeted analyses before recombining them into an integrated reliability model.
Scenario-based simulations are subsequently conducted to incorporate uncertainties associated with renewable energy generation, load fluctuations, and the stochastic availability of components. MC simulations generate S annual scenarios; each is evaluated sequentially at hourly resolution to capture temporal variability, storage dynamics, and failure/repair responses (details in Appendix B). In this paper, Equations (1)–(3) state the probability-based definitions of LOLP, EENS, and SSR. In the sequential MC simulations, these indices are estimated using their operational counterparts in Appendix B—Equations (A1)–(A3) compute scenario-level indicators and Equations (A4)–(A6) form the MC estimators aggregated over S runs.
The indices are defined as follows [13,14]:
L O L P = Σ Δ t i × P i T  
E E N S = Σ E i × P i
where Δ t i and E i represent the duration of load loss and the energy not supplied in state i , respectively. P i is the probability of state i , and T is the total observation time.
S S R = E s e l f E t o t a l
where E s e l f is the amount of energy supplied by local or on-site generation and storage, and E t o t a l is the total energy demand of the system.
LOLP quantifies the probability of supply inadequacy occurring at any time step, EENS provides an estimate of the expected magnitude of unmet energy demands, and SSR measures the proportion of energy demand successfully supplied from internal system resources, thereby reflecting overall energy independence.
To comprehensively evaluate the reliability of integrated energy systems, this study introduces a CRI that integrates electrical and thermal reliability metrics into a single aggregated measure [15]. The CRI captures cross-domain interactions (such as the interdependence between electricity and heat generation or storage) and is mathematically defined as follows:
C R I = ω e L O L P e L O L P e m a x + E E N S e E E N S e m a x + ω t L O L P t L O L P t m a x + E E N S t E E N S t m a x + ω s 1 S S R
where L O L P and E E N S are reliability metrics for the electrical subsystem, and L O L P and E E N S are the corresponding metrics for the thermal subsystem. S S R denotes the self-sufficiency rate, reflecting the system’s energy autonomy. L O L P e m a x , E E N S e m a x , L O L P t m a x and E E N S t m a x represent the maximum permissible or worst-case values used for normalization. ω e , ω t , and ω are the weighting factors for electrical reliability, thermal reliability, and self-sufficiency, respectively, and satisfy the condition ω e + ω t + ω = 1 . The weighting factors ω e , ω t and ω s are determined based on operational priorities, reflecting user preferences or policy guidelines that define the relative importance of electrical versus thermal reliability and self-sufficiency objectives. For example, assuming weighting factors ω e = 0.4 , ω t = 0.3 , ω s = 0.3 , the CRI can reflect system priorities emphasizing electrical reliability slightly higher than thermal reliability and self-sufficiency. Normalization ensures balanced integration across multiple reliability dimensions, enabling a straightforward interpretation of the composite index: lower CRI values indicate superior reliability.
The proposed CRI provides system planners and operators with a quantitative tool to evaluate cross-domain interactions, illustrating how changes in thermal reliability might influence overall energy autonomy. This capability supports the identification of optimal system configurations and operational strategies that concurrently enhance electrical reliability, thermal performance, and self-sufficiency.

2.1.3. Mathematical Mapping and Objective

Let d D denote a design alternative (siting/sizing vector), and let ξ collect the random elements (renewable profiles, loads, and component up/down states). For a given d and scenario ξ , the sequential simulation yields scenario-level indicators L O L P c , s ( d ) , E E N S c , s ( d ) for c e , h and S S R s ( d ) . Their MC estimators over S runs are L O L P c d = 1 S S L O L P c , s d , E E N S c d = 1 S S E E N S c , s ( d ) , S S R d = S S S R s d S (operational counterparts summarized in Appendix B).
The estimators are then normalized and aggregated through the CRI in Equation (4), i.e., C R I ( d ; ω ) = ω e L O L P e ( d ) L O L P e m a x + E E N S e ( d ) E E N S e m a x + ω t L O L P t ( d ) L O L P t m a x + E E N S t ( d ) E E N S t m a x + ω s 1 S S R ( d ) where ω e + ω t + ω = 1 . In this study, D consists of several candidate configurations, and the final selection is obtained by ranking C R I d ; ω across d D . Equivalently, the design choice can be written as
d * arg min d D C R I ( d ; ω )
Hereafter, the sequential MC estimators in Appendix B (Equations (A4)–(A6)) are used.

2.2. System Overview and Simulation Setup for Case Study

2.2.1. System Description

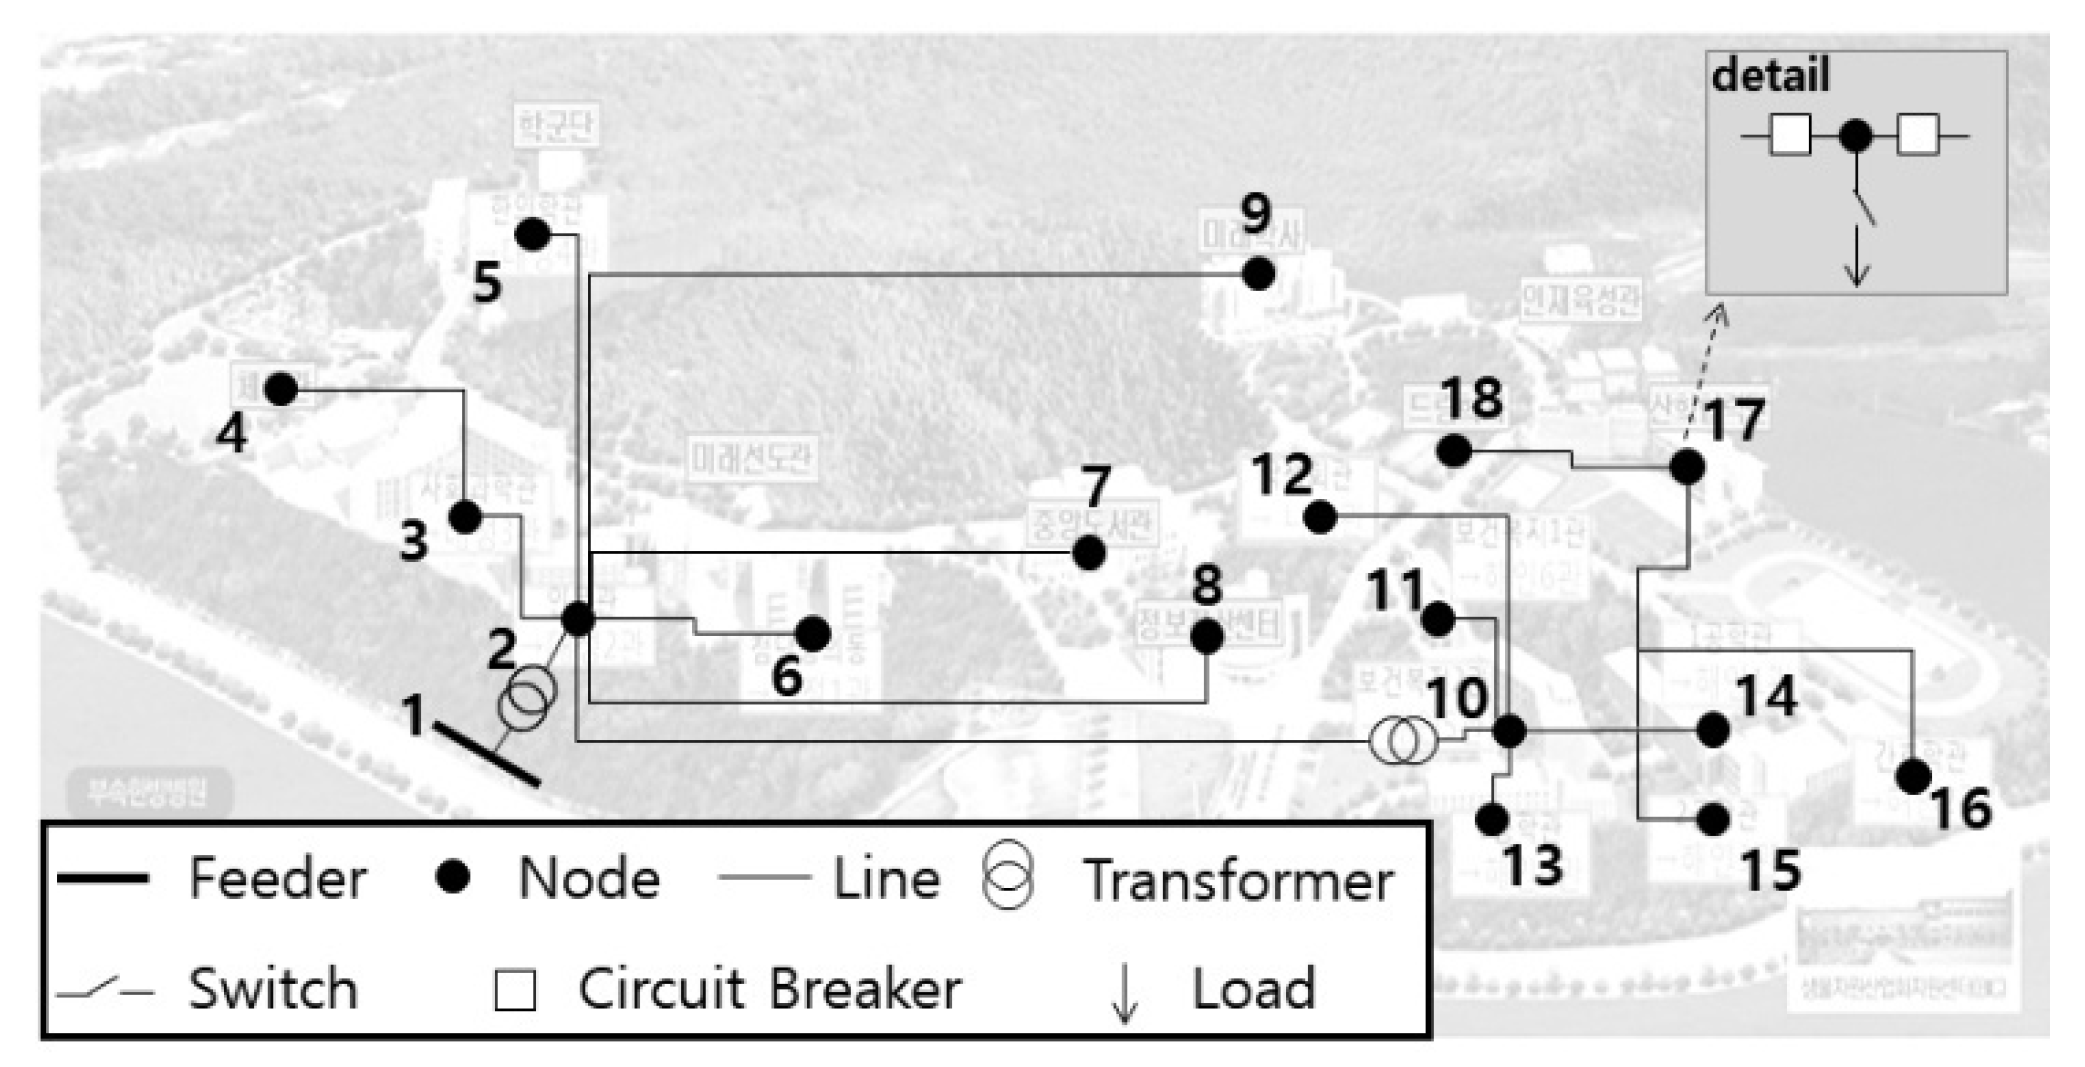
The electric power grid topology used for the case study is illustrated in Figure 3, depicting the D-campus microgrid in Korea [16]. Actual peak load data and Distributed Energy Resource (DER) capacities at each node were utilized for the reliability assessment. Electrical energy is supplied to the campus buildings through PV systems, CHP units, FC, and the main electricity network (KEPCO), with surplus energy managed using BESS connected via the electric power grid. The heat grid comprises liquefied-natural-gas (LNG) supply pipelines for heat generation and air or water pipelines for heat transfer; it connects to the CHP and FC units and to the external gas network (HYGAS). Node 2 is located near the main electric substation of the D-campus. Thermal energy is supplied to heat loads (selected dormitories and office buildings) via FC, CHP units, and the heat grid, with excess heat stored in HESS. The heat DERs are installed on the heat grid near Node 17, as indicated in Figure 3.
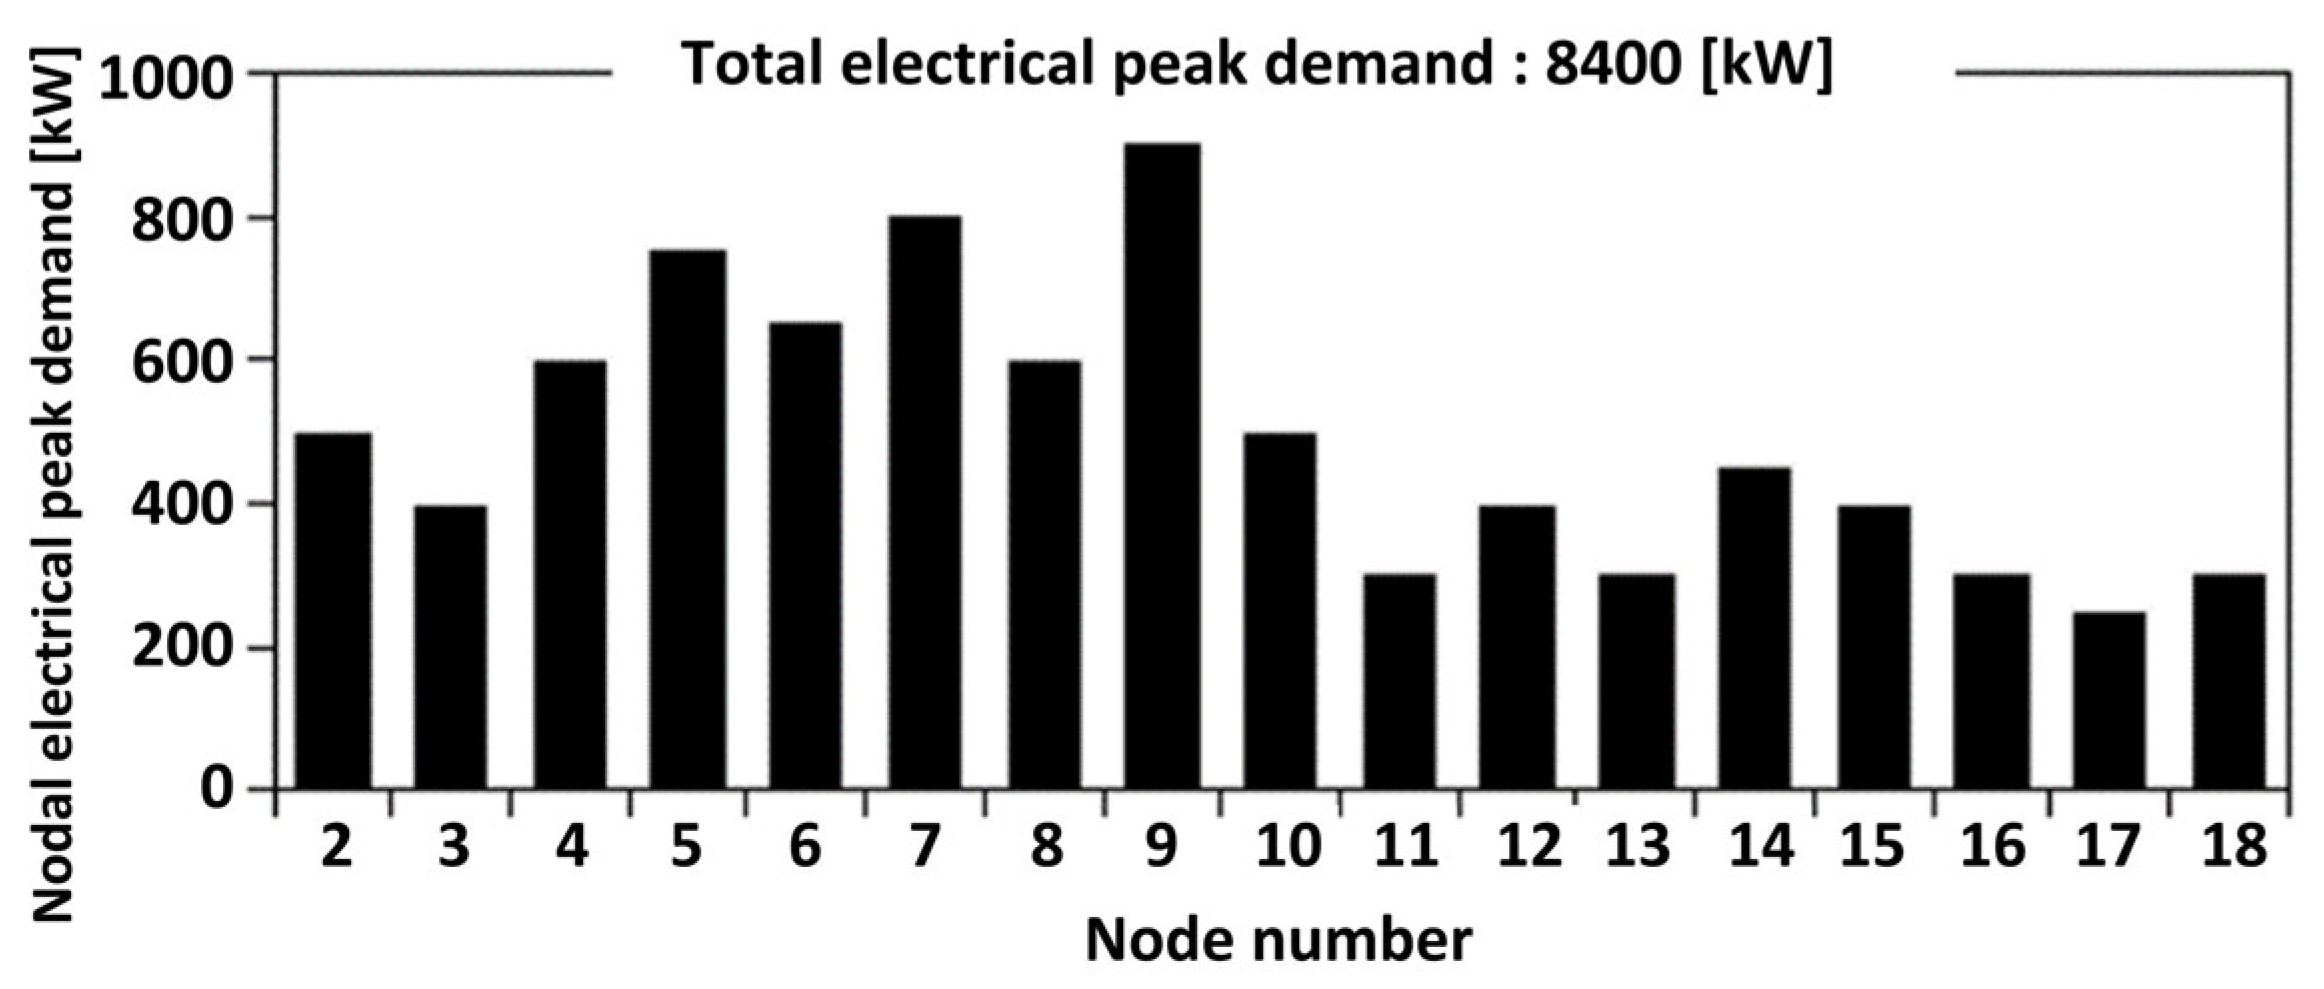
Figure 4 illustrates the actual nodal peak electrical demand in the D-campus power grid [16].

2.2.2. Simulation Conditions for the Reliability Assessment

All simulations use an hourly resolution over a one-year horizon (H = 8760 h). A total of S = 1000 sequential MC runs are performed. The sequential MC simulation framework was developed in Python 3.11 using the NumPy and pandas libraries for efficient numerical processing, and all simulations were executed on a 12th Gen Intel® Core™ i7-12700 (2.10 GHz) system with 16 GB RAM and a 64-bit OS (x64-based processor). Electric and thermal demand profiles are taken from D-campus measurements [17]. Failure and repair events follow the typical constant rates (details in Section 2.2.3) [18]. The EMS operates under the time-of-use (TOU) tariffs in Table A1 and the operating modes described in Appendix A.
The scenarios considered in the reliability assessment simulations are summarized in Table 1. To ensure a fair comparison, all scenarios were evaluated with the same annual demand, PV, and component-availability profiles; thus, the observed changes in LOLP, EENS, and SSR can be attributed solely to DER capacity and placement choices.
Table 1. IES conditions for each scenario used in the reliability assessment simulation.
ScenarioElectric DERs’ CapacityElectric DERs’ LocationHeat DERs’ Capacity Heat DERs’
Location
PV
[kWe]
BESS
[kWhe]
FC
[kWe]
CHP
[kWe]
FC
[MJt/h]
HESS
[MJt]
CHP
[MJt/h]
1100020005115Distributed across all nodes
(FC, CHP are fixed at Node 17)
147745502Heat grid
near Node 17
2Node 2
3Node 17
430040035800Node 2---
550015001303000
630040035800Node 17515493492
7500150013030007580913,096
Scenario 1 in Table 1 represents the actual, current configuration of the D-campus IES. The peak heat demand of the D-campus microgrid was estimated from the component sizes of Scenario 1 (CHP: 502 MJt/h, FC: 14 MJt/h, HESS: 7745 MJt).
Scenarios 1 through 3 share the same DER capacities as Scenario 1 but differ in the installation locations of electric DERs. Scenarios 4 through 7 consider additional DER capacities beyond the base scenario (Scenario 1). Scenarios 2 to 7 explore various DER capacity combinations, with electric DERs assumed to be installed specifically at Node 2 or Node 17, because Node 2 is electrically proximate to the campus main substation, whereas Node 17 is hydraulically proximate to the dominant heat loads. Focusing on these two nodes allows the impact of electrical versus thermal proximity to be isolated across scenarios.

2.2.3. Reliability Parameters

To realistically model component reliability within the D-campus IES, standard reliability parameters from the established IEEE Reliability Test System for distribution systems, as presented by Allan et al. [18], are utilized. Each key component within the studied system—such as transformers, circuit breakers, switches, lines, and DERs—is characterized by the following parameters:
  • Failure Rate λ : the frequency with which the component experiences failure [failures/year];
  • Repair Rate μ : the frequency of successful repairs [repairs/year];
  • Unavailability U : the probability of the component being unavailable for operation at any random time [p.u.].
Table 2 summarizes the reliability parameters used for the components of the D-campus IES, adapted from [18].
Table 2. Reliability parameters for key components used in the D-campus IES reliability assessment.
ComponentFailure Rate
λ  [Failures/Year]
Repair Rate
μ  [Repairs/Year]
Unavailability
U  [p.u.]
Transformer0.0152007.5 × 10−5
Circuit Breaker0.006501.2 × 10−4
Switch0.0011001.0 × 10−5
Underground Cable0.020102.0 × 10−3
PV0.0501503.3 × 10−4
CHP0.0301003.0 × 10−4
FC0.0401203.3 × 10−4
Gas Boiler0.0252001.25 × 10−4
BESS0.0202508.0 × 10−5
HESS0.0103003.3 × 10−5
These parameters provide a robust probabilistic basis for accurately simulating system performance and quantifying reliability indices (LOLP, EENS, SSR, and CRI) under various operational scenarios and configurations.

3. Results and Discussion

The simulation scenarios in Table 1 were analyzed using the proposed reliability assessment framework. Reliability metrics (LOLP, EENS, and SSR) were calculated for each scenario. The simulation results of the reliability assessment are summarized in Table 3. Because C R I ( d ; ω ) is a monotone aggregation of normalized LOLP/EENS and 1−SSR as in Equation (4), any decrease in LOLP/EENS or increase in SSR directly yields a lower CRI and hence a better design rank.
As shown in Table 3, the electrical metrics improve with added DERs: both LOLPe and EENSe drop, with the lowest values in Scenario 7. Thermal reliability improves markedly in Scenarios 6 and 7, where expanded CHP and HESS drive LOLPt ≈ 0. Consistent with these trends, SSR rises sharply in Scenarios 5 and 7, and these two cases deliver the lowest and second-lowest CRI, respectively (lower is better). In particular, Scenario 6 shows that reinforcing thermal resources at the node where heat loads concentrate can drive LOLPt practically to zero; when that reinforcement is paired with additional electrical DERs as in Scenario 7, SSR also increases, which explains why Scenario 7 attains the minimum CRI in Table 3 (while Scenario 5 reaches a comparably low CRI via SSR gains).
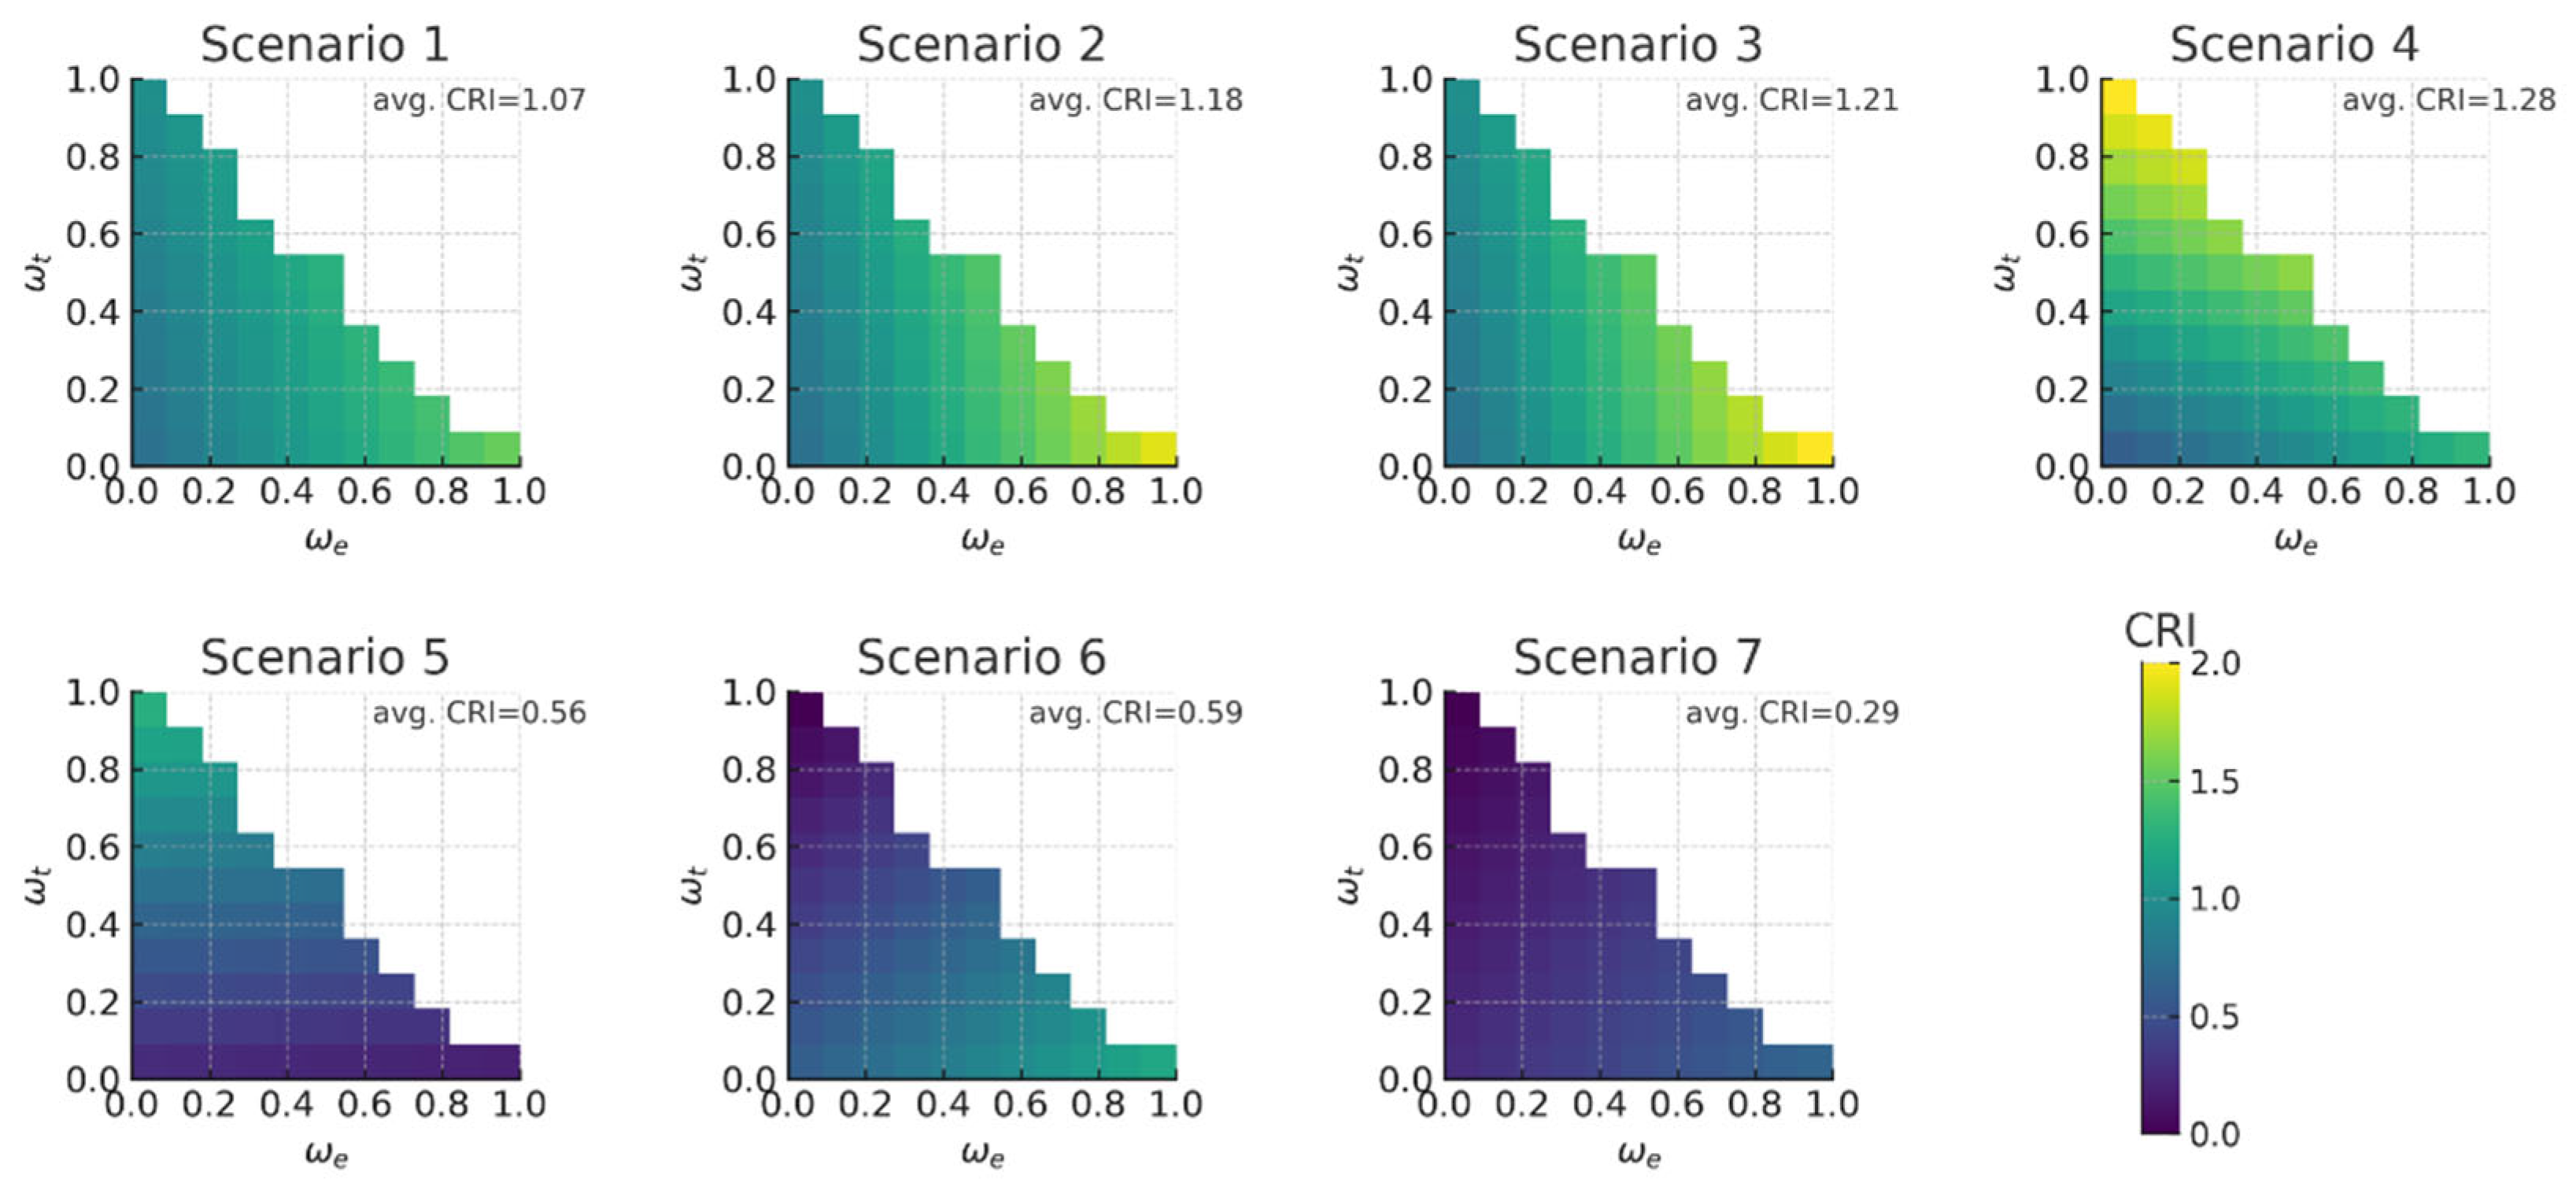
Table 4 summarizes the CRI values, and Figure 5 illustrates them based on variations in weighting factors for sensitivity analysis.
As shown in Table 4 and Figure 5, CRI generally decreases with capacity expansion (notably in Scenarios 5 and 7), while intermediate scenarios exhibit trade-offs across weight sets. This indicates that increasing DER capacities and positioning them strategically can enhance overall reliability, with greater deployment typically associated with lower CRI. Overall, this analysis underscores the critical importance of strategically sizing and siting DERs to improve overall system performance. Notably, scenarios involving DER installations at Node 17 consistently achieved the best reliability outcomes, emphasizing the advantage of placing DERs near critical thermal loads.
Sensitivity analysis of CRI further revealed that varying the weighting factors ω e , ω t and ω s significantly influences the assessment outcomes, highlighting the importance of carefully determining these factors based on operational priorities and system objectives.

4. Conclusions

This paper proposes a reliability-driven optimal-design method for small IESs. The framework combines probabilistic reliability modeling with scenario-based sequential simulations and introduces a CRI that aggregates electrical and thermal metrics (LOLP, EENS) together with the SSR using normalized weights. The intent is not to propose a new theory of reliability, but to provide a concise and reproducible way to compare design options under different planning priorities.
Applied to an IES (D-campus microgrid), the framework delivered clear, quantitative insights into how DER siting and sizing affect system performance. Across the tested scenarios, increasing DER capacity and siting resources near major thermal loads, particularly at Node 17, reduced electrical risk (LOLPe, EENSe) and increased SSR, which was reflected by lower CRI values. Sensitivity analysis showed that these trends were robust over a reasonable range of weighting factors.
Taken together, the contributions are threefold yet complementary: (i) a compact CRI that consolidates electrical/thermal LOLP and EENS with SSR into a single, weight-normalized score to make design trade-offs explicit for decision-makers; (ii) a reproducible, campus-scale workflow for uncertainty-aware evaluation of cross-domain reliability and self-sufficiency; and (iii) the D-campus application that translates the method into concrete DER siting and sizing guidance. As a package, these elements provide a practical template for reliability-driven IES planning.
This study has several limitations. The case is a single campus with a finite set of scenarios; gas is represented as a supply interface rather than a fully modeled reliability domain; and failure/repair parameters and normalization bounds introduce uncertainty. Future work will extend the framework to additional sites and operating conditions, integrate economic and environmental objectives, incorporate fuller treatment of gas-side reliability, and explore dynamic and real-time applications. A natural extension of this work is to couple the reliability-driven design loop with economic and emission objectives so that campus operators can trade off adequacy, self-sufficiency, and cost within the same multi-scenario framework.

Author Contributions

Conceptualization, D.-M.K.; methodology, D.-M.K. and I.-S.B.; software, D.-M.K., S.B. and I.-S.B.; validation, J.-H.R. and W.-C.S.; formal analysis, J.-H.R. and W.-C.S.; investigation, J.-H.R. and D.-M.K.; resources, D.-M.K. and S.B.; data curation, D.-M.K. and S.B.; writing—original draft preparation, D.-M.K.; writing—review and editing, S.B.; visualization, D.-M.K.; supervision, I.-S.B. and W.-C.S.; project administration, I.-S.B. and W.-C.S.; funding acquisition, I.-S.B. and S.B. All authors have read and agreed to the published version of the manuscript.

Funding

This work was supported in part by 2025 Research Grant from Kangwon National University, and in part by the National Research Foundation of Korea (NRF) grant funded by the Korea government (MSIT) (No. RS-2023-00253201).

Data Availability Statement

The original contributions presented in this study are included in the article. Further inquiries can be directed to the corresponding authors.

Acknowledgments

The authors express their sincere gratitude to Eun-Tae Son for generously sharing thesis datasets, and for technical suggestions that improved the rigor and clarity of this work. We also appreciate his assistance in providing additional references and selected data excerpts that facilitated cross-verification.

Conflicts of Interest

The authors declare no conflicts of interest.

Abbreviations

The following abbreviations are used in this manuscript:
IES(s)Integrated Energy System(s)
LOLPLoss of Load Probability
EENSExpected Energy Not Supplied
SSRSelf-Sufficiency Rate
CRIComposite Reliability Index
PVPhotovoltaic
CHPCombined Heat and Power
BESSBattery Energy Storage System
HESS/TESHeat (Thermal) Energy Storage (system)
EMSEnergy Management System
MCMonte Carlo (simulation)
DERDistributed Energy Resources
FCFuel Cell
LNGLiquefied Natural Gas
TOUTime-of-Use (tariff)
p.u.per unit
DASDay-Ahead Scheduling
RTSReal-Time Scheduling

Appendix A. EMS Operating Modes and Scheduling Logic for the D-Campus IES

Appendix A.1. Tariff Scheme

The EMS for the D-campus IES assumes time-of-use (TOU) energy and demand charges for electricity, and a single energy charge for gas, as shown in Table A1. Under this scheme, the design and operation aim to achieve both peak shaving and energy cost reduction.
Table A1. Scheme of energy tariffs applied to the D-campus IES.
Demand ChargeEnergy Charge
LNGNo chargeSingle [$/MJ]
ElectricitySingle [$/kW]TOU [$/kWh]

Appendix A.2. EMS Operating Modes

The EMS for the D-campus IES defines three modes: Day-Ahead Scheduling (DAS), Real-Time Scheduling (RTS), and Manual. DAS determines the target hourly energy of DERs and storage. RTS updates set-points using measured data and tariffs while respecting DAS targets. Manual is reserved for emergencies, tests, or maintenance.

Appendix A.3. Scheduled-Mode Flow in Pseudocode

The working procedure of the scheduled-mode for EMS can be found as follows.
Algorithm A1. Peak-Cut Scheduling
begin Peak-Cut
    for   each   hour   t do
    determine current net power, heat demand, and device states
    if net power is greater than peak target then
      dispatch combined heat and power within limits to reduce net power
      dispatch fuel cell within limits to reduce net power
      compute remaining excess over peak target after these dispatches
      set battery discharge to the minimum of the remaining excess and the available battery capability
    else
      set battery discharge to zero and keep generators at feasible baseline
    end if

    compute heat produced by combined heat and power and fuel cell
    if produced heat is greater than heat demand then
      charge thermal storage within its remaining capacity
      set boiler heat to zero
    else if produced heat plus available thermal storage discharge is less than heat demand then
      discharge thermal storage within limits
      supply the remaining heat with the gas boiler
    else
      discharge thermal storage only as needed and set boiler heat to zero
    end if

    compute residual electric demand and set grid import accordingly
    update battery state of charge and thermal storage state
  end for
end Peak-Cut
Algorithm A2. Energy-Conservation Scheduling
begin Energy-Conservation
  identify the set of peak price hours from the time-of-use tariff
   for   each   hour   t  do
     if   t belongs to the set of peak price hours then
      operate combined heat and power in the efficiency region within limits
      operate fuel cell in the efficiency region within limits
      discharge battery within power and energy limits
      discharge thermal storage as available to reduce auxiliary electric heating
      set battery charge and thermal storage charge to zero
    else
      keep generators at feasible baseline within limits
      if price is low or on-site surplus exists then
        charge battery within limits
      else
        set battery charge to zero
      end if
      store surplus cogenerated heat by charging thermal storage within limits
      set thermal storage discharge to zero
    end if

    compute heat from generators and thermal storage
    set boiler heat to the remaining unmet heat demand, not below zero
    compute residual electric demand and set grid import accordingly
    update battery state of charge and thermal storage state
  end for
end Energy-Conservation
Algorithm A3. Integration of Peak-Cut and Energy-Conservation
begin Integration
   for   each   hour   t  do
     combine generator outputs from Peak-Cut and Energy-Conservation to satisfy both objectives
     combine battery actions to respect power and energy limits and to meet the stricter requirement
     combine thermal storage actions to satisfy heat balance with minimum boiler use
     recompute grid import and boiler heat to satisfy final electric and thermal balances
     enforce all operational constraints including ramp limits and storage bounds
  end for
end Integration

Appendix B. Monte Carlo Procedure and Reliability Metrics

Note on definitions vs. estimators. Equations (1)–(3) in the main text provide the probability-based definitions of the indices. Appendix B implements these definitions for simulation: Equations (A1)–(A3) yield per-scenario indicators, and Equations (A4)–(A6) average them across S runs to produce the sequential MC estimators used in the results. This completes the step-by-step link from stochastic inputs to scenario indicators and, finally, to MC estimators used by the design objective in Equation (5).

Appendix B.1. Monte Carlo Procedure

This appendix details the sequential MC procedure used in Section 2.1.2. Uncertainty in renewable generation, loads, and component availability is represented by repeated sampling. For each run s = 1 , , S , an annual scenario is created by sampling hourly renewable profiles, demand profiles, and component up/down states from the prescribed statistical models. The system is then simulated hour by hour over a one-year horizon. At each hour t , a feasible dispatch is computed that respects network, generator, and storage constraints. The sequential loop captures temporal variability, state-of-charge dynamics, and explicit responses to failures and repairs. Scenario-level reliability metrics are computed and then aggregated across the S runs to form MC estimators.

Appendix B.2. Notation

Let the horizon have H hourly steps with resolution t . For carrier c e , h (electricity or heat) and scenario s :
  • Demand: D c , s t ;
  • Available on-site supply subject to limits: A c , s t ;
  • Imports subject to limits: I m p c , s t ;
  • Unmet demand (shortage): D e f c , s t = max 0 , D c , s t A c , s t I m p c , s t .

Appendix B.3. Scenario-Level Metrics

L O L P c , s = 1 H t = 1 H 1 { D e f c , s t > 0 }
E E N S c , s = t = 1 H D e f c , s t Δ t
S S R c , s = t = 1 H A c , s t Δ t t = 1 H D c , s t Δ t

Appendix B.4. Monte Carlo Estimators (Final Indices)

L O L P c = 1 S s = 1 S L O L P c , s
E E N S c = 1 S s = 1 S E E N S c , s
S S R c = s = 1 S t = 1 H A c , s t Δ t s = 1 S t = 1 H D c , s t Δ t
where 1 { } denotes the indicator function. The subscripts c = e and c = h yield the electric and thermal indices used in the CRI. In this study, SSR is used as a single system-level self-sufficiency index as defined in (3); accordingly, the CRI in (4) uses S S R d without a carrier subscript, while L O L P c d and E E N S c d remain carrier-specific, i.e., c e , h .

Appendix B.5. Consistency with Main-Text Equations

The probability-based definitions in the main text are recovered by viewing each hour ( s , t ) of the sequential MC simulation as a sampled state with empirical probability 1 / ( S · H ) and duration t . Aggregating over all ( s , t ) yields the scenario averages in Equations (A1)–(A3) and the MC estimators in Equations (A4)–(A6).

References

  1. Lei, Y.; Wang, J.; Wan, C.; Chen, C.; Song, Y. A new reliability assessment approach for integrated energy systems: Using hierarchical decoupling optimization framework and impact-increment based state enumeration method. Appl. Energy 2018, 210, 1237–1250. [Google Scholar] [CrossRef]
  2. Chen, J.; Yang, Y.; Bie, Z.; Lin, Y.; Li, Z.; Li, G. Fast analytical method for reliability evaluation of electricity-gas integrated energy system considering dispatch strategies. Appl. Energy 2019, 242, 260–272. [Google Scholar] [CrossRef]
  3. Fu, X.; Bie, Z.; Jiang, Q.; Zhang, C.; Song, Y. Estimating the failure probability in an integrated energy system considering correlations among failure patterns. Energy 2019, 178, 656–666. [Google Scholar] [CrossRef]
  4. Meng, Z.; Wang, Y.; Sun, H.; Wang, Z. Reliability evaluation of electricity-gas-heat multi-energy consumption based on user experience. Int. J. Electr. Power Energy Syst. 2021, 130, 106926. [Google Scholar] [CrossRef]
  5. Cao, M.; Tang, Y.; Xue, Y.; Wang, J. Reliability tracing of the integrated energy system using the improved Shapley value. Energy 2022, 260, 124997. [Google Scholar] [CrossRef]
  6. Wang, S.; Zhai, J.; Hui, H.; Ding, Y.; Song, Y. Operational reliability of integrated energy systems considering gas flow dynamics and demand-side flexibilities. IEEE Trans. Ind. Inform. 2024, 20, 1360–1373. [Google Scholar] [CrossRef]
  7. Xie, T.; Ma, K.; Zhang, G.; Zhang, K.; Li, H. Optimal scheduling of multi-regional energy system considering demand response union and shared energy storage. Energy Strategy Rev. 2024, 53, 101413. [Google Scholar] [CrossRef]
  8. Wang, B.; Wang, X.; Wang, Z.; Wei, C.; Zhang, X.-P.; Zhou, M.; Gao, J.; Han, Z. A four-stage fast reliability assessment framework for renewables-dominated strong power systems with large-scale energy storage by temporal decoupling and contingencies filtering. Appl. Energy 2024, 362, 123035. [Google Scholar] [CrossRef]
  9. Li, M.; Li, M.; Wu, Q.; Xu, X.; Shen, J. Cascading failure simulation and analysis method in integrated electric and gas system based on energy circuit. Electr. Power Syst. Res. 2024, 235, 110844. [Google Scholar] [CrossRef]
  10. Wang, S.; Hui, H.; Ding, Y.; Song, Y. Long-term reliability evaluation of integrated electricity and gas systems considering distributed hydrogen injections. Appl. Energy 2024, 356, 122374. [Google Scholar] [CrossRef]
  11. Niu, L.; Zhao, Z.; Tan, J.; Zhao, Y.; Zhang, F.; Xiao, N.; He, Y.; Xie, S.; Jing, R.; Lin, J.; et al. A dynamic reliability assessment framework for integrated energy systems: A new methodology to address cascading failures. Adv. Appl. Energy 2025, 17, 100203. [Google Scholar] [CrossRef]
  12. Son, E.-T.; Kim, D.-M.; Lee, K.-S.; Kim, M.-S.; Hwang, S.-W. A microgrid model for the integrated operation of heat and electricity. In Proceedings of the CIRED Workshop, Ljubljana, Slovenia, 7–8 June 2018. [Google Scholar]
  13. Billinton, R.; Allan, R.N. Reliability Evaluation of Power Systems, 2nd ed.; Plenum Press: New York, NY, USA, 1996; pp. 68–70. [Google Scholar] [CrossRef]
  14. Nishimura, A.; Kitagawa, S.; Hirota, M.; Hu, E. Assessment on energy self-sufficiency rate for building integrated photovoltaics and fuel cell system in Japan. Smart Grid Renew. Energy 2017, 8, 195–211. [Google Scholar] [CrossRef]
  15. Ribeiro, P.F.; da Silva, M.L.P.; Carneiro, O.; de Almeida, A.T. A new composite index of reliability of supply in industrial systems with distributed generation. Int. J. Electr. Power Energy Syst. 2012, 43, 109–119. [Google Scholar] [CrossRef]
  16. Son, E.-T.; Bae, I.-S.; Kim, S.-Y.; Kim, D.-M. Resilience-Oriented Framework for Microgrid Planning in Distribution Systems. Energy 2022, 15, 2145. [Google Scholar] [CrossRef]
  17. Son, E.-T. Resilience-Oriented Distribution System Planning Under the Proliferation of Renewable Energy. Ph.D. Thesis, Dongshin University, Naju, Republic of Korea, January 2022. [Google Scholar]
  18. Allan, R.N.; Billinton, R.; Sjarief, I.; Goel, L.; So, K.S. A Reliability Test System for Educational Purposes—Basic Distribution System Data and Results. IEEE Trans. Power Syst. 1991, 6, 813–820. [Google Scholar] [CrossRef]
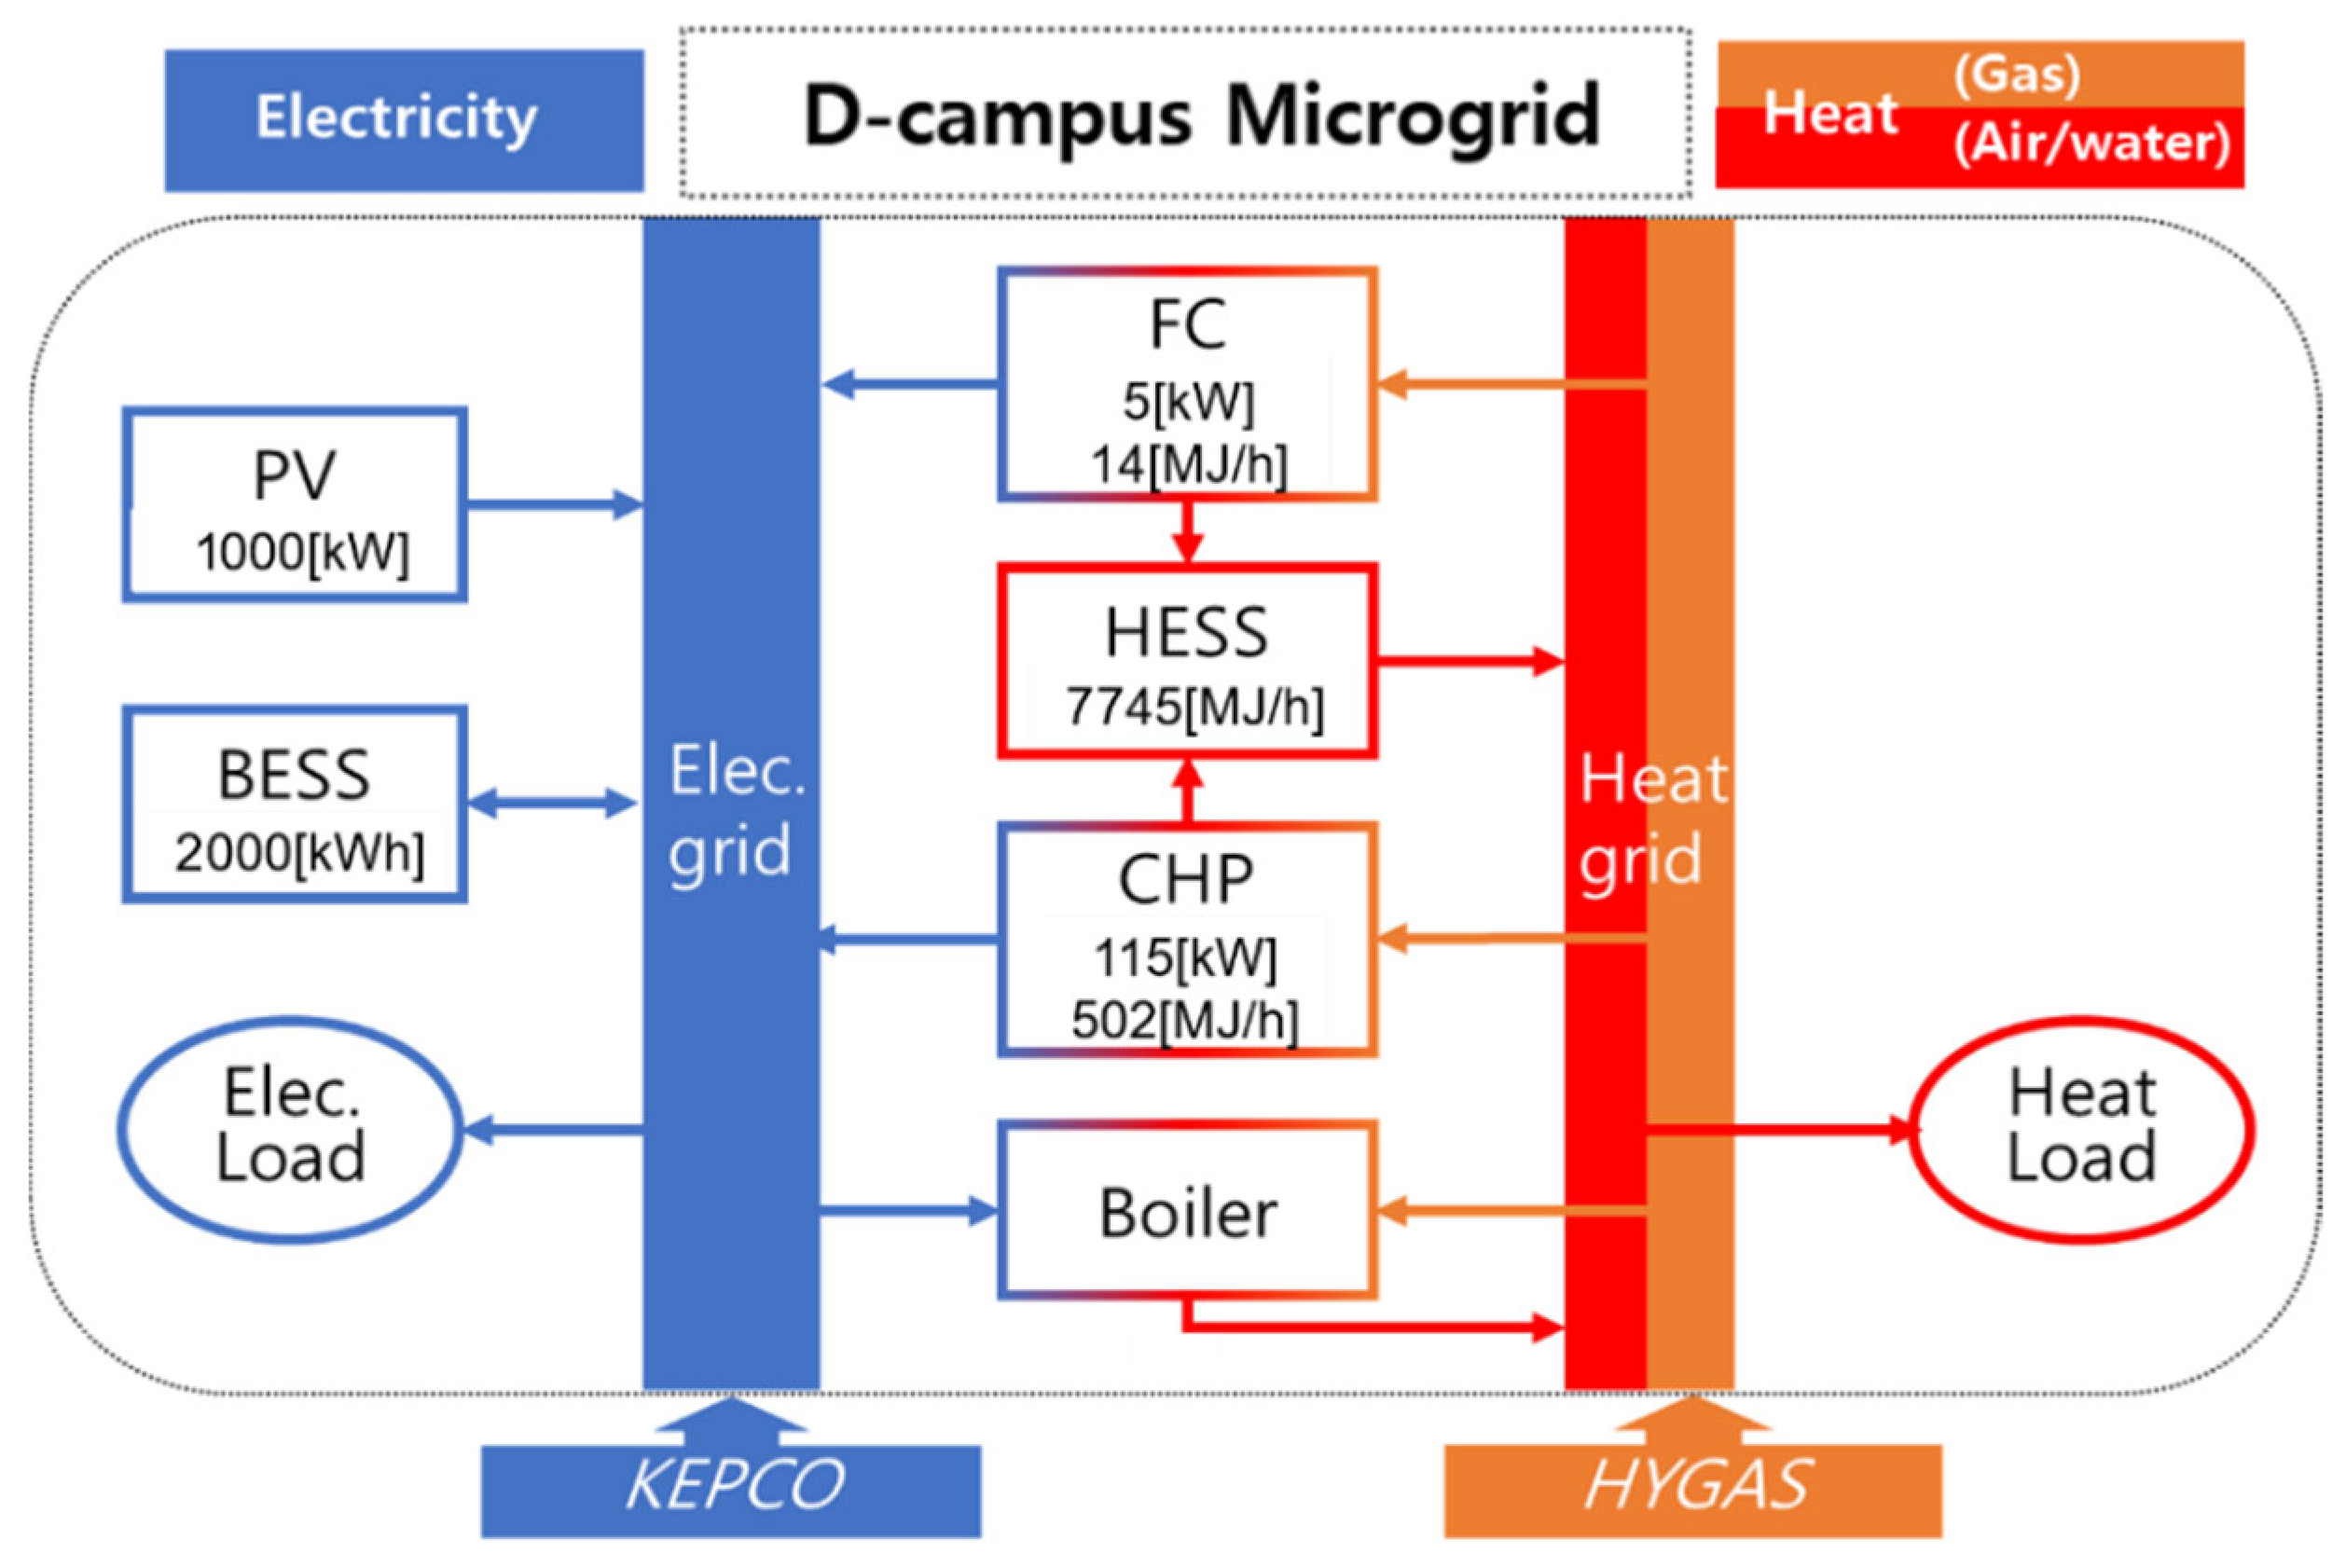
Figure 1. Configuration of the D-campus microgrid as a small-scale Integrated Energy System (IES).
Mathematics 13 03734 g001
Figure 2. Overview of EMS interactions in the D-campus IES (details in Appendix A).
Mathematics 13 03734 g002
Figure 3. Topology of the electric power grid at the D-campus.
Mathematics 13 03734 g003
Figure 4. Nodal peak demand in the D-campus power grid.
Mathematics 13 03734 g004
Figure 5. Sensitivity of CRI to weighting factors ( ω e , ω t , ω s = 1 ω e ω t ) by scenario.
Mathematics 13 03734 g005
Table 3. Typical reliability metrics calculated for each simulation scenario.
Scenario L O L P e
L O L P t
[%]
E E N S e
E E N S t
[MWh/year]
SSR
[p.u.]
CRI
( Assuming   ω e = 0.4 ,   ω t = 0.3 ,   ω s = 0.3 )
10.194
9.258
91.769
0.000
0.2521.138
20.240
9.247
114.543
0.000
0.2521.287
30.263
9.258
114.988
0.000
0.2521.324
40.183
9.281
70.042
2.020
0.3931.304
50.034
9.258
6.194
0.527
0.7480.527
60.183
0.023
57.752
0.000
0.3930.662
70.137
0.000
14.861
0.000
0.7450.337
Table 4. Representative results of CRI under the selected weighting factor combinations.
ScenarioCRI
ω e = 0.2
ω t = 0.4
ω s = 0.4
ω e = 0.3
ω t = 0.4
ω s = 0.3
ω e = 0.4
ω t = 0.3
ω s = 0.3
ω e = 0.5
ω t = 0.3
ω s = 0.2
ω e = 0.6
ω t = 0.2
ω s = 0.2
11.0061.0851.1381.2171.271
21.0791.1961.2871.4031.494
31.0981.2231.3241.4491.549
41.3041.3741.3041.3741.304
50.6410.6340.5270.5200.413
60.4830.5420.6620.7210.841
70.2320.2720.3370.3770.442
Disclaimer/Publisher’s Note: The statements, opinions and data contained in all publications are solely those of the individual author(s) and contributor(s) and not of MDPI and/or the editor(s). MDPI and/or the editor(s) disclaim responsibility for any injury to people or property resulting from any ideas, methods, instructions or products referred to in the content.