Article

Investigation of a Biochemical Model with Recycling in Case of Negative Cooperativity

by
Svetoslav G. Nikolov
1,2,3,4,*,
Vassil M. Vassilev
1 and
Momchil I. Nenov
1
1
Institute of Mechanics, Bulgarian Academy of Sciences, Acad. G. Bonchev Str., Bl. 4, 1113 Sofia, Bulgaria
2
Department of Mechanics, University of Transport, Geo Milev Str., 158, 1574 Sofia, Bulgaria
3
Department of Systems Biology and Bioinformatics, University of Rostock, 18051 Rostock, Germany
4
Laboratory of Systems Tumor Immunology, Department of Dermatology, University Hospital Erlangen, 91052 Erlangen, Germany
*
Author to whom correspondence should be addressed.
Mathematics 2025, 13(2), 260; https://doi.org/10.3390/math13020260
Submission received: 10 December 2024 / Revised: 7 January 2025 / Accepted: 11 January 2025 / Published: 14 January 2025

Abstract

:
The objective of this paper is to find new dynamic perspectives in a well-known two dimensional nonlinear system which is a modification of the phosphofructo kinase model by incorporating recycling of the product, p , into the substrate, s . Specifically, we investigate the affect of the negative cooperativity on the number of equilibria and their stability. Moreover, in the parameter space, we analyze analytically and numerically the number of periodic oscillations (solutions) and their stability using Lyapunov coefficients (in other words, quantities and focus values). Thus, we obtain that three different dynamical conditions (regimes) take place: (1) structurally unstable, (2) the existence of an unstable limit cycle with an external stable limit cycle, and (3) the existence of a stable limit cycle with an external unstable limit cycle. Moreover, for a zero rate of product synthesis (due to e.g., defective enzyme), we obtain that the modified system has a first integral.

1. Introduction

Basically, all phenomena (natural and those in techniques) are nonlinear from the outset. The nonlinearity is their most important fundamental property and is inherent to open biological systems [1,2,3,4,5,6,7]. Usually, the nonlinear problems are presented with systems from nonlinear differential equations (NDEs) in which the nonlinear results are investigated using several tools of nonlinear analysis [8,9,10]. There are two major approaches in the modern development of nonlinear analysis: analytical and numerical. Both are used for finding periodic/unperiodic and transient (bifurcation) solutions of NDEs. Moreover, if a system (model) is essentially nonlinear and high-dimensional, its study can be performed by numerical simulations based on the methods of the oscillation and bifurcation theories [11,12].
It is well-known that in living organisms, at the molecular level, gene switching behavior, cooperative dynamics, and the synchronization of biological oscillators in multicellular systems are nonlinear processes with various biological complexities. Hence, periodic (sustained) oscillations correspond to various biological rhythmic phenomena with different periods (ranging from a few seconds to years) [13]. On the other hand, the multistability corresponds to the capacity of cellular systems to achieve multiple distinct stable steady states in response to a set of external stimuli [14]. With the help of mathematical models, a formalization of our knowledge of living system dynamics and the kinetics of major metabolic processes exists.
In many physical and biological applications, the most common differential equations used as mathematical models are second-order differential equations. The investigation of such models is characterized by a combination of strong analytical methods, qualitative theory, and numerical experiments. The first step in this study is stability analysis [5,15,16]. There are general (indirect (linearization) and direct) methods by Lyapunov that can be used to determine the stability of its rest points and periodic orbits.
Bifurcation theory [12,15,17,18,19,20,21,22,23] provides mathematical tools that can be used to investigate the changes in phase space by assigning various parameter values to a critical parameter involved in a given system. There are threshold (bifurcation) values of the parameters which initiate the dynamical switches between qualitative different regimes. In practice, the models of living systems are multi-dimensional with complex behavior [16,24,25,26,27,28]. Consequently, many basic nonlinear dynamical problems of living systems, such periodic oscillations (limit cycles), quasi-periodic oscillations, bistability, and feedback regulations, can be modeled and complete their understanding by two-dimensional dynamical systems and a thorough knowledge of basic local and global bifurcations [13,29,30]. In the two-dimensional case, there are four sub-types of all principal bifurcations of limit cycles (the appearance of a limit cycle) from: (i) a simple weak focus; (ii) a simple semistable limit cycle; (iii) a separatrix loop to a simple saddle node; and (iv) a separatrix loop to a saddle when the divergence is non-zero.
The theoretical study of local bifurcations involving observable practical processes such as transition over the stability boundaries of equilibrium states and periodic orbits (small limit cycles) has a long history. One can notice that the transition from a stationary solution to small amplitude oscillations corresponds to Andronov–Hopf bifurcation [31,32,33,34,35], which can be supercritical (a soft loss of stability) or subcritical (a hard loss of stability) [28] (Section 3). Notice that in a subcritical case, the phenomenon of hard excitation takes place, i.e., both a stable limit cycle (sustained oscillations with a large amplitude) with a stable steady state coexist [13,36]. The classification of stability boundaries as either safe/dangerous depends upon the sign of Lyapunov quantities (also called Lyapunov values (coefficients) or focus values) [33,37,38]. Furthermore, the (sequential) number of the last non-zero Lyapunov coefficient determines the number of possible limit cycles (stable/unstable) [38,39,40]. Interestingly, the general forms of the first and second Lyapunov’s coefficients (quantities) for two-dimensional systems were calculated in the 1940s–1950s by Bautin [38], and much later, the general formulas for the calculation of Lyapunov’s third, fourth, and fifth coefficients (quantities) were obtained using modern software tools with the aid of symbolic computation [39,41,42,43].
Albert Goldbeter and his collaborators are considered as pioneers for providing a detailed understanding and modeling of the basic dissipative biology underlying oscillatory (rhythmically (both regular or not)) solutions. Concretely, they have studied the intricacies of glycolysis, the aggregation of slime moulds, the generation of calcium waves, the cell cycle oscillator, and circadian rhythms. The dynamic behavior (conditions in which oscillations arise) of a two-dimensional allosteric enzyme for glycolytic oscillations has been studied by Goldbeter and coauthors in many works [13,44,45,46,47,48,49]. They show that depending on the values of the parameters and cooperativity involved in this model, sustained oscillations can occur. Moreover, when the degree of cooperativity of the regulated enzyme diminishes down to unity, through cooperativity, the occurrence of oscillatory behavior is favored [50,51,52]. In all of these works, the existence of periodic (rhythmical and birhythmical) oscillations in this model were indicated by the presence of Andronov–Hopf bifurcations.
The deviation in the formation of enzyme/ligand complexes from Michaelis–Menten kinetics is assumed to occur due to conformational changes in a multimeric enzyme molecule, changing its affinity for the ligand. This phenomenon was termed “cooperativity” and can be positive or negative depending on whether the affinity grows or diminishes with each subsequent bound molecule of the ligand. Although negative cooperativity is attested to almost as often as positive [53,54,55,56,57], its physiological significance is less well understood. In their paper [53], Koshland and Hamadani suggested a corellation between negative cooperativity exhibited by an enzyme and being a branch point in a signaling network. Later, Bush et al. [58] proposed several scenarios where, based on mathematical modeling, specific values of the Hill coefficient g are accrued with a fitness score. According to their results, the type of interaction where a Hill coefficient of g < 1 would be advantageous features several branches and intermediate products.
On the other hand, Ha and Ferrell [59] explore models of a receptor/ligand system where the quantity of the ligand is fixed and found that negative cooperativity leads to sharp thresholds and the biphasic behavior of the concentration of the fully saturated complex as a function of the receptor concentration. They suggest that such behavior might lead to bi-stability and oscillations.
We have based the present model on that of [13,47,48,60] in which the dimensionless concentration of the substrate, s , and the dimensionless concentration of the product, p , are described by the following system of nonlinear ODEs:
s ˙ = d s d t = v + γ   p g K g + p g σ s 1 + s 1 + p 2 α + 1 + s 2 1 + p 2 , p ˙ = d p d t = k s p β γ   p g K g + p g + β σ s 1 + s 1 + p 2 α + 1 + s 2 1 + p 2   ,
where α > 0 is the allosteric constant of the enzyme, v is the normalized substrate injection rate, K is a constant equal to the product concentration for which the recycling rate reaches its half-maximum value, g is the degree of cooperativity (Hill coefficient), γ denotes the maximum rate of recycling, divided by the Michaelis constant of the substrate for the autocatalytically regulated allosteric enzyme, β = K R K p (where K R and K P are the Michaelis constant for the substrate, s , and the dissociation constant for the binding of the product, p , to the regulatory site of the enzyme), σ is the maximum rate of the enzyme reaction, and k s is the rate constant of the product degradation by a first-order reaction. According to [13,56], the system (1) is a modification of the phosphofructokinase model by incorporating the recycling of product into the substrate as the number of variables do not increase. The model (1) is illustrated in Figure 1.
As was remarked above, we focus in this paper on the special case of a negative cooperativity (a Hill coefficient of less than unity) for the system (1), i.e., g = 0 . Note that, according to [61,62,63], the extended Monod–Wyman–Changeux (MWC) model can account for negative cooperativity.
The purposes of this paper are (1) to elucidate how the dynamics of a two-dimensional nonlinear biochemical model with recycling is affected by the degree of cooperative activation (in our case, a negative one) associated with a regulated enzyme (let us remark that this essential effect of the negative cooperativity is not investigated currently in the scientific literature); and (2) to find new dynamic properties of this biochemical model by using the Poincaré–Andronov–Hopf theory, especially Lyapunov coefficients.
This paper is organized as follows. In Section 2, we introduce our basic analytical results related to the Poincaré–Andronov–Hopf theory for the system (2), i.e., when g = 0 (negative cooperativity). In Section 3, we illustrate numerically the influence of different system’s parameters on the dynamics of the model (2). Our conclusions are given in Section 4. Finally, in Appendix A, Appendix B, Appendix C and Appendix D, some additional analytical and numerical results are shown.

2. Analysis for g = 0—Negative Cooperativity

In this case, the system (1) has the form
s ˙ = v + γ 2 σ s 1 + s 1 + p 2 α + 1 + s 2 1 + p 2 , p ˙ = k s p β γ 2 + β σ s 1 + s 1 + p 2 α + 1 + s 2 1 + p 2 .
The Michaelis–Menten equation defines that the maximum rate of product synthesis σ depends on the total enzyme concentration [ E ] and the rate of product, p, and synthesis k , i.e., σ = k . E [64]. When σ = 0 , then we have k = 0 . In our case, E = 0 is not possible because we preserve recycling. This corresponds to a defective enzyme. Thus, for (2), we have
s ˙ = d s d t = ρ 1   , p ˙ = d p d t = k s p ρ 2   ,
where ρ 1 = v + γ 2 and ρ 2 = β γ 2 . It is easy to see that the differential equation
d s d p = ρ 1 k s p + ρ 2 ,   k s p + ρ 2 0
is separable, with solutions satisfying
s = ρ 3 ln ρ 4 + p + C ,
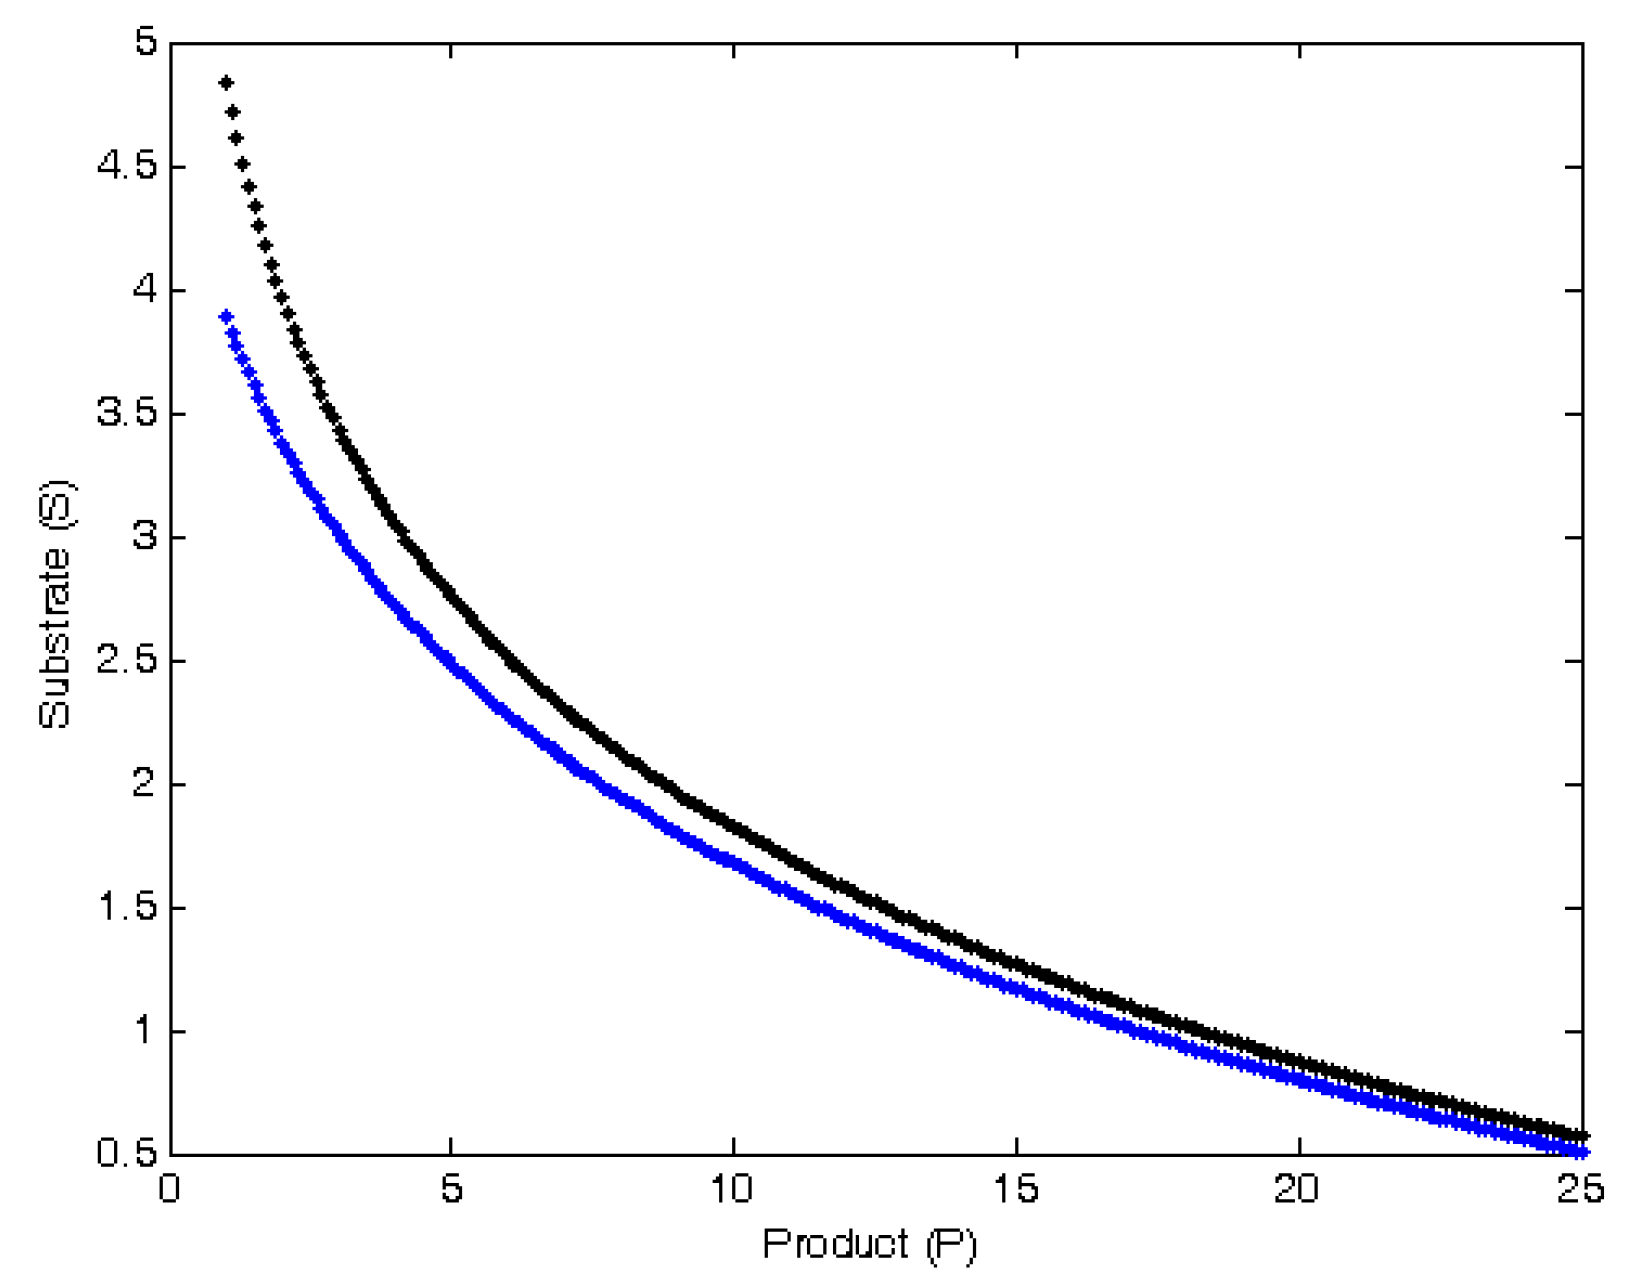
where ρ 3 = γ + 2 v 2 k s , ρ 4 = β γ 2 k s , and C is a real constant. The first integral (5) on R 2 provides the shape of the trajectories. The curves of (5) are shown in Appendix C for a specific choice of the parameters γ ,   k s ,   β ,   v , and C .
The equilibrium (steady state) points of the system (2) can be found by equating the right-hand side of the differential Equation (2) to zero, i.e.,
2 v α + 1 + s 2 1 + p 2 + γ α + 1 + s 2 1 + p 2 2 σ s 1 + s 1 + p 2 = 0 , 2 β σ s 1 + s 1 + p 2 2 k s p α + 1 + s 2 1 + p 2 β γ α + 1 + s 2 1 + p 2 = 0   .
On the other hand, (6) can be rewritten in the form
2 v ϕ + γ ϕ 2 σ ξ = 0 , 2 β σ ξ 2 k s p ϕ β γ ϕ = 0   .
In (7), ϕ = α + 1 + s 2 1 + p 2 and ξ = s 1 + s 1 + p 2 . Hence, the equilibria of (2) are
s ¯ 1 , 2 = 0 ,   p ¯ 1 , 2 = 1 ± α
s ¯ 3 , 4 = k s + β v 2 2 v σ + γ ± D 0 k s + β v 2 2 v 2 σ + γ ,   p ¯ 3 , 4 = β v k s
where
D 0 = k s + β v 2 β v σ 2 2 k s + v β + k s 2 α 2 v + γ 2 v 2 σ + γ σ 2
From physiological (biological) point of view, steady states (8) and (9) must be real positive/zero. Moreover, for α > 0 [65,66], only (9) is a biologically feasible steady state of (2) if, and only if,
D 0 0 , 2 v 2 σ + γ > 0 , k s + β v 2 2 v σ + γ ± D 0 < 0 ,   and   D 0 0 , 2 v 2 σ + γ < 0 , k s + β v 2 2 v σ + γ ± D 0 > 0 .
These results are summarized in the following proposition.
Proposition 1.
Assume  α , β ,   v ,   σ ,   γ , and k s are positive constants. Then, system (2) has two steady states when the two conditions in (11) are valid and has only one steady state when the first/second condition in (11) is valid, otherwise no equilibrium point exists.
In order to apply the Routh–Hurwitz criteria for the stability of (9), we use the following small perturbation (local coordinates) in a neighborhood of the steady state (origin) of the system (2): s = s ¯ + x 1 ,   p = p ¯ + x 2 . To determine the type of steady state, we must accomplish some transformations, i.e., the function 1 α + 1 + s ¯ + x 1 2 1 + p ¯ + x 2 2 = 1 ε ˜ + θ ˜ in (2) can be written in MacLaurin series as
1 ε ˜ + θ ˜ = 1 ε ˜ 1 + θ ˜ ε ˜ = 1 ε ˜ 1 θ ˜ ε ˜ + θ ˜ ε ˜ 2 θ ˜ ε ˜ 3 + .
Here,
ε ˜ = α + 1 + s ¯ 2 1 + p ¯ 2 , θ ˜ = 2 1 + s ¯ 1 + p ¯ 2 x 1 + 2 1 + s ¯ 2 1 + p ¯ x 2 + 1 + p ¯ 2 x 1 2 + 1 + s ¯ 2 x 2 2 +       + 4 1 + s ¯ 1 + p ¯ x 1 x 2 + 2 1 + s ¯ x 1 x 2 2 + 2 1 + p ¯ x 1 2 x 2 + x 1 2 x 2 2   .
If we take only the linear term from (12), i.e., 1 ε ˜ 1 θ ˜ ε ˜ , and after, substitute it into (2), it takes the form
x ˙ 1 = c 1 x 1 + c 2 x 2 + c 3 x 1 2 + c 4 x 2 2 + c 5 x 1 x 2 + c 6 x 1 3 + c 7 x 2 3 + + c 24 x 1 4 x 2 4 , x ˙ 2 = c 25 x 1 + c 26 x 2 + c 27 x 1 2 + c 28 x 2 2 + c 29 x 1 x 2 + c 30 x 1 3 + c 31 x 2 3 + + c 48 x 1 4 x 2 4   .
Note that the full form of (14) and the coefficients from c 1 to c 48 are given in Appendix A. It is seen that the system (14) (expanded up to eight orders) is represented in a canonical form. Then, the characteristic equation of the linearized system has the form χ 2 + R χ + q = 0 , where R = c 1 + c 26 is the trace and q = c 1 c 26 c 2 c 25 is the determinant of the linearized flux. Now, it can be seen that the equilibria (9) are asymptotically stable when the Routh–Hurwitz conditions for stability are valid [38,67,68], i.e.,
R = c 1 + c 26 > 0 , q = c 1 c 26 c 2 c 25 > 0 .
Definition 1.
System (2) is stable if for the equilibrium state (9) where RH conditions for stability (15) exist.
So, in accordance with RH conditions (15), we are in position to obtain the stability of any equilibrium point (9). Note that the asymptotic stability domain given by the Routh–Hurwitz criterion (15) has two boundaries, R = 0 and q = 0 . The first one is for Andronov–Hopf bifurcation (where two pure imaginary eigenvalues occur). In this case, the transition type from stability to instability (or vice versa) in the reversible/irreversible (soft/hard stability loss) domain depends on the value (sign) of the first Lyapunov coefficient L 1 λ 0 . According to [38], for system (14), L 1 λ 0 has the form
L 1 λ 0 = π 4 c 2 q q c 1 c 25 c 5 2 + c 5 c 28 + c 4 c 29 + c 1 c 2 c 29 2 + c 3 c 29 + c 5 c 27 +             + c 4 c 25 2 c 5 + 2 c 28 2 c 1 c 25 c 28 2 c 3 c 4 2 c 1 c 2 c 3 2 c 27 c 28             c 27 c 2 2 2 c 3 + c 29 + c 2 c 25 2 c 1 2 c 28 c 29 c 3 c 5             c 1 2 + c 2 c 25 3 c 25 c 31 c 2 c 6 + 2 c 1 c 8 + c 33 + c 9 c 25 c 2 c 32   ,
where λ 0 is defined as a value of c 1 c 6 ,   c 8 , c 9 ,   c 25 ,   c 27 c 29 ,   c 31 ,   c 32 , and c 33 for which the relation R = 0 takes place. Notice that for the calculation of L 1 , the coefficients up to the power three (see (14)) are included. On the other hand, according to [17,18,33,38,39,40,69], if L 1 = 0 , then L 2 (the second one) must be calculated as the sign of L 2 which determines the stability/instability of the external limit cycle. The external cycle is unstable when L 2 > 0 , and respectively stable when L 2 < 0 . Here, we shall not discuss L 2 and only remark that details for its calculation and role under the dynamics of a two-dimensional system can be found in [17,33,38,39,40]. Of course this list of references is not complete, but should provide an entry into the literature. It is remarkable that L 2 depends on expansion coefficients of the right-hand sides of the equations of system (14), including the terms up to the fifth order (see for details [38] (p. 37), or Appendix A in [40]), i.e.,
a 40 = c 10 ,   a 31 = c 14 ,   a 22 = c 13 ,   a 13 = c 12 ,   a 04 = c 11 ,   a 41 = c 20 ,   a 32 = c 17 , a 14 = c 15 ,   a 23 = c 16 ,   b 40 = c 34 ,   b 31 = c 38 ,   b 22 = c 37 ,   b 13 = c 36 ,   b 04 = c 35 , b 41 = c 44 ,   b 32 = c 41 ,   b 23 = c 40 ,   b 14 = c 39 ,   a 50 = a 05 = b 05 = 0 .
In the next section, with the help of the presented analytical results for Lyapunov values L 1 and L 2 , we illustrate numerically the influence of different system’s parameters on the dynamics of the model (2).

3. Numerical Analysis

Based on the theoretical analysis and results carried out in Section 2, we are going to perform a numerical investigation of the bifurcation behavior of system (2), which occurs at the following biologically reasonable parameters [13] (and references therein):
σ = 10 3 ;   10 4   s 1 ,   α   =   7.5 × 10 6 ,   K = 1 ,   β = 1 ;   10 , v 0.24 ,   5   s 1 ,   γ 0.01 ,   1   s 1 ,   k s 0.1 ,   4   s 1 .
It must be recognized that the parameter space for model (2) is large, and intuitive explorations are capable of describing the dynamical (bifurcation) behavior in only tiny subsets thereof. There are segments of the parameter space for which the model shows negative solutions—see Appendix B. These segments are simply omitted. To perform our numerical simulations of (2), we use MATLAB (The MathWorks, Inc., Natick, MA, USA)—ODE23 solver (which is based on an explicit Runge–Kutta (2,3) formula, the Dormand–Prince pair) for two different fixed initial conditions: when β = 1 , s 0 ( 1 ) t = 2 ,   p 0 ( 1 ) t = 1 and when β = 10 , s 0 2 t = 1 ,   p 0 2 t = 2 .
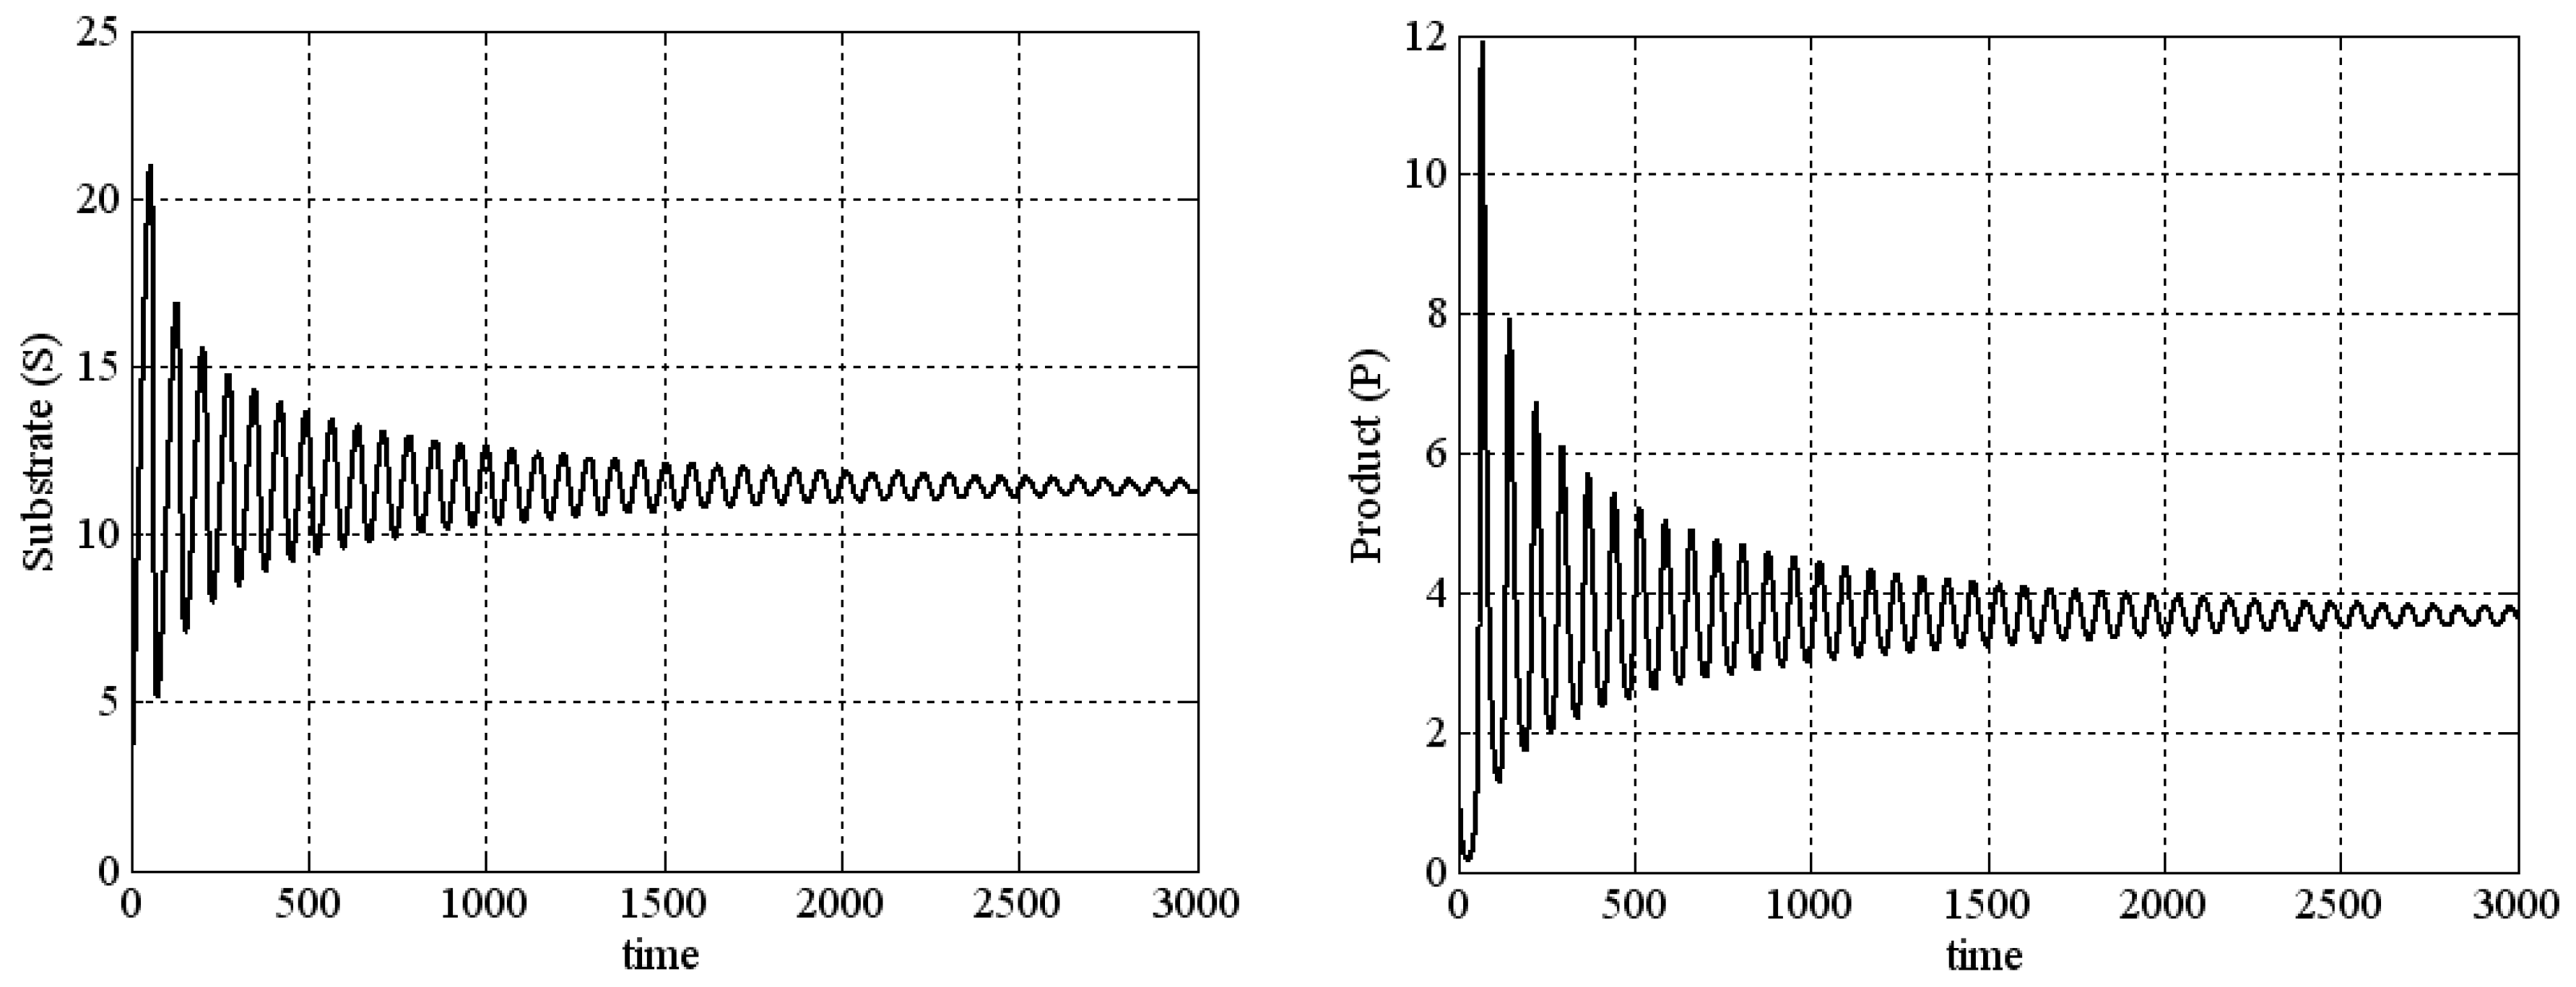
We observe (see (6)) that for the parameter values given in (18), there exists a unique equilibrium point E ¯ s ¯ ,   p ¯ . A positive steady state is locally asymptotically stable for v = 0.4 ,   σ = 10 3 ,   γ = 0.025 ,   α = 7.5 × 10 6 ,   k s = 0.109 ,   β = 1 , and K = 1 , since the Routh–Hurwitz conditions for stability (15) are valid, i.e., the eigenvalues of the characteristic equation at E ¯ have negative real parts. In this situation, the simulation of the model (2) produces stable dynamics, which is presented in Figure 2.
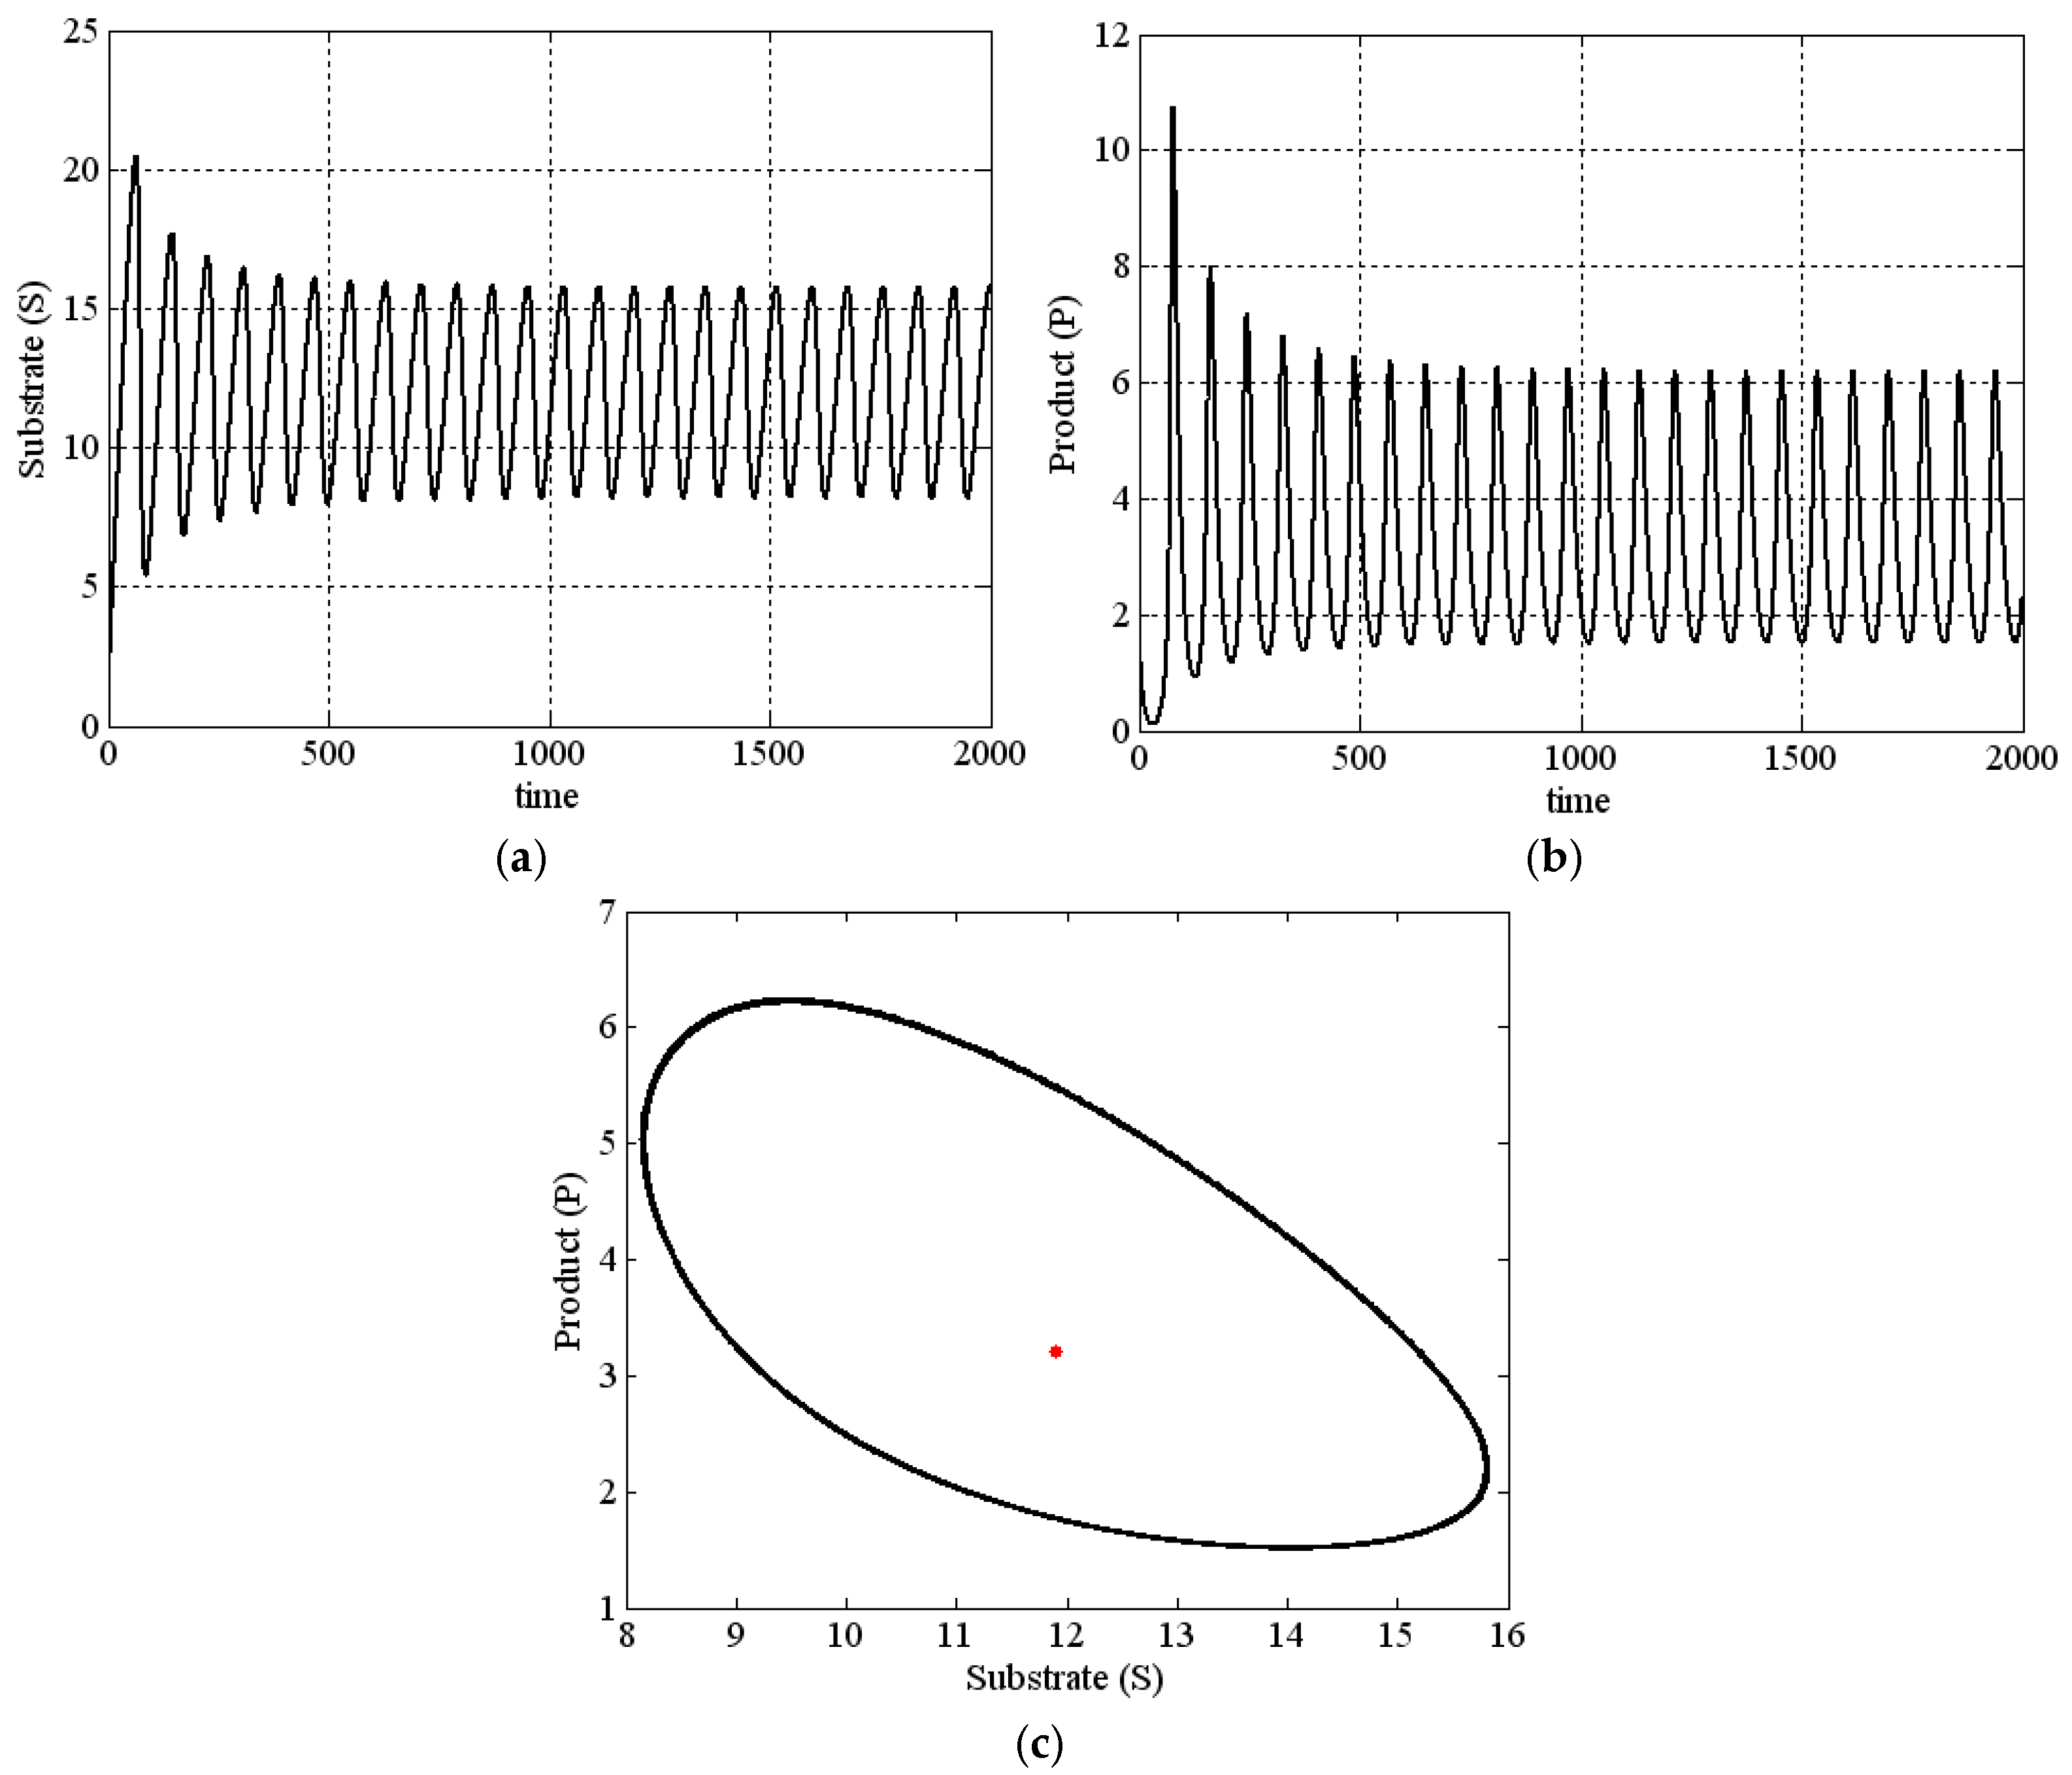
In Figure 3, the limit cycle (sustained oscillations from a biological point of view) and phase portrait for the system (2) are shown, corresponding to the fixed σ = 10 3 ,   α = 7.5 × 10 6 ,   k s = 0.109 ,   β = 1 ,   K = 1 , and γ = 0.025 , and different choice of v in order to preserve the relationships between v and the proper corresponding critical value where R = 0 takes place—see Figure 4a. Indeed, here v = 0.4 and using (9)–(11), it is easy to check that for these parameter values, there exists an equilibrium (fixed) point of system (2) in the neighborhood of the limit cycle which is only one, i.e., E ¯ s ¯ = 11.9 ,   p ¯ = 3.21 —see Figure 3c (red point).
As mentioned already, the transition phase (type) from the stability to instability (or vice versa) domain, which is reversible/irreversible (soft/hard stability loss), strongly depends on the value (sign) of first Lyapunov coefficient L 1 λ 0 . Values of L 1 can be calculated using formula (16) for σ = 10 3 ,   α = 7.5 × 10 6 ,   k s = 0.109 ,   β = 1 ,   K = 1 , v 0.25 ,   0.5 , and γ 0.01 ,   0.035 . Note that L 1 should be matched at R = 0 . Hence, we obtain that L 1 is equal to zero—not shown here—and thus, the second Lyapunov coefficient ( L 2 ) must be calculated. Note that formula (A3) in [40], for (17), is used. By inserting the above values for σ ,   α ,   k s ,   β ,   K ,   v , and γ in (17), we obtain that L 2 is also equal to zero. Therefore, we conclude that in this case, the system (2) is structurally unstable [17,37,70,71,72]. Indeed, it follows from the Andronov–Pontryagin theorem (see Theorem 2.5 in [37], p. 72) that a two-dimensional rough (structurally stable) system possesses only a finite number of rough equilibrium states (nodes, foci, and saddles) and rough limit cycles (periodic orbits). In our case, the last one is not valid.
Let us now study the behavior of the system (2) when the normalized substrate injection rate constant v and the rate constant of the product degradation by a first-order reaction k s are ten times larger than the previous cases shown in Figure 2 and Figure 3. Note that the first equation into (2) allows us to highlight the role of v in the system (2) dynamics. In Figure 5, we give a solution of (2) with the parameters v = 4 ,   σ = 10 3 ,   γ = 0.012 ,   α = 7.5 × 10 6 , k s = 2.78 ,   β = 1 , and K = 1 . As a consequence of the Routh–Hurwitz criteria (15), for these parameter values, the equilibrium E ¯ s ¯ = 70.72 ,   p ¯ = 1.44 is an unstable focus, R = 0.42 . On the other hand, far from E ¯ , an external stable limit cycle occurs (see Figure 5c). Notice that, now for R = 0 , we have L 1 = 0 and L 2 < 0 (not shown here). Therefore, according to the theory in [18,33,38], we have a soft stability loss for the external limit cycle as one of the principal situations shown in Figure A3 and Figure A4 (see [40]) is valid.
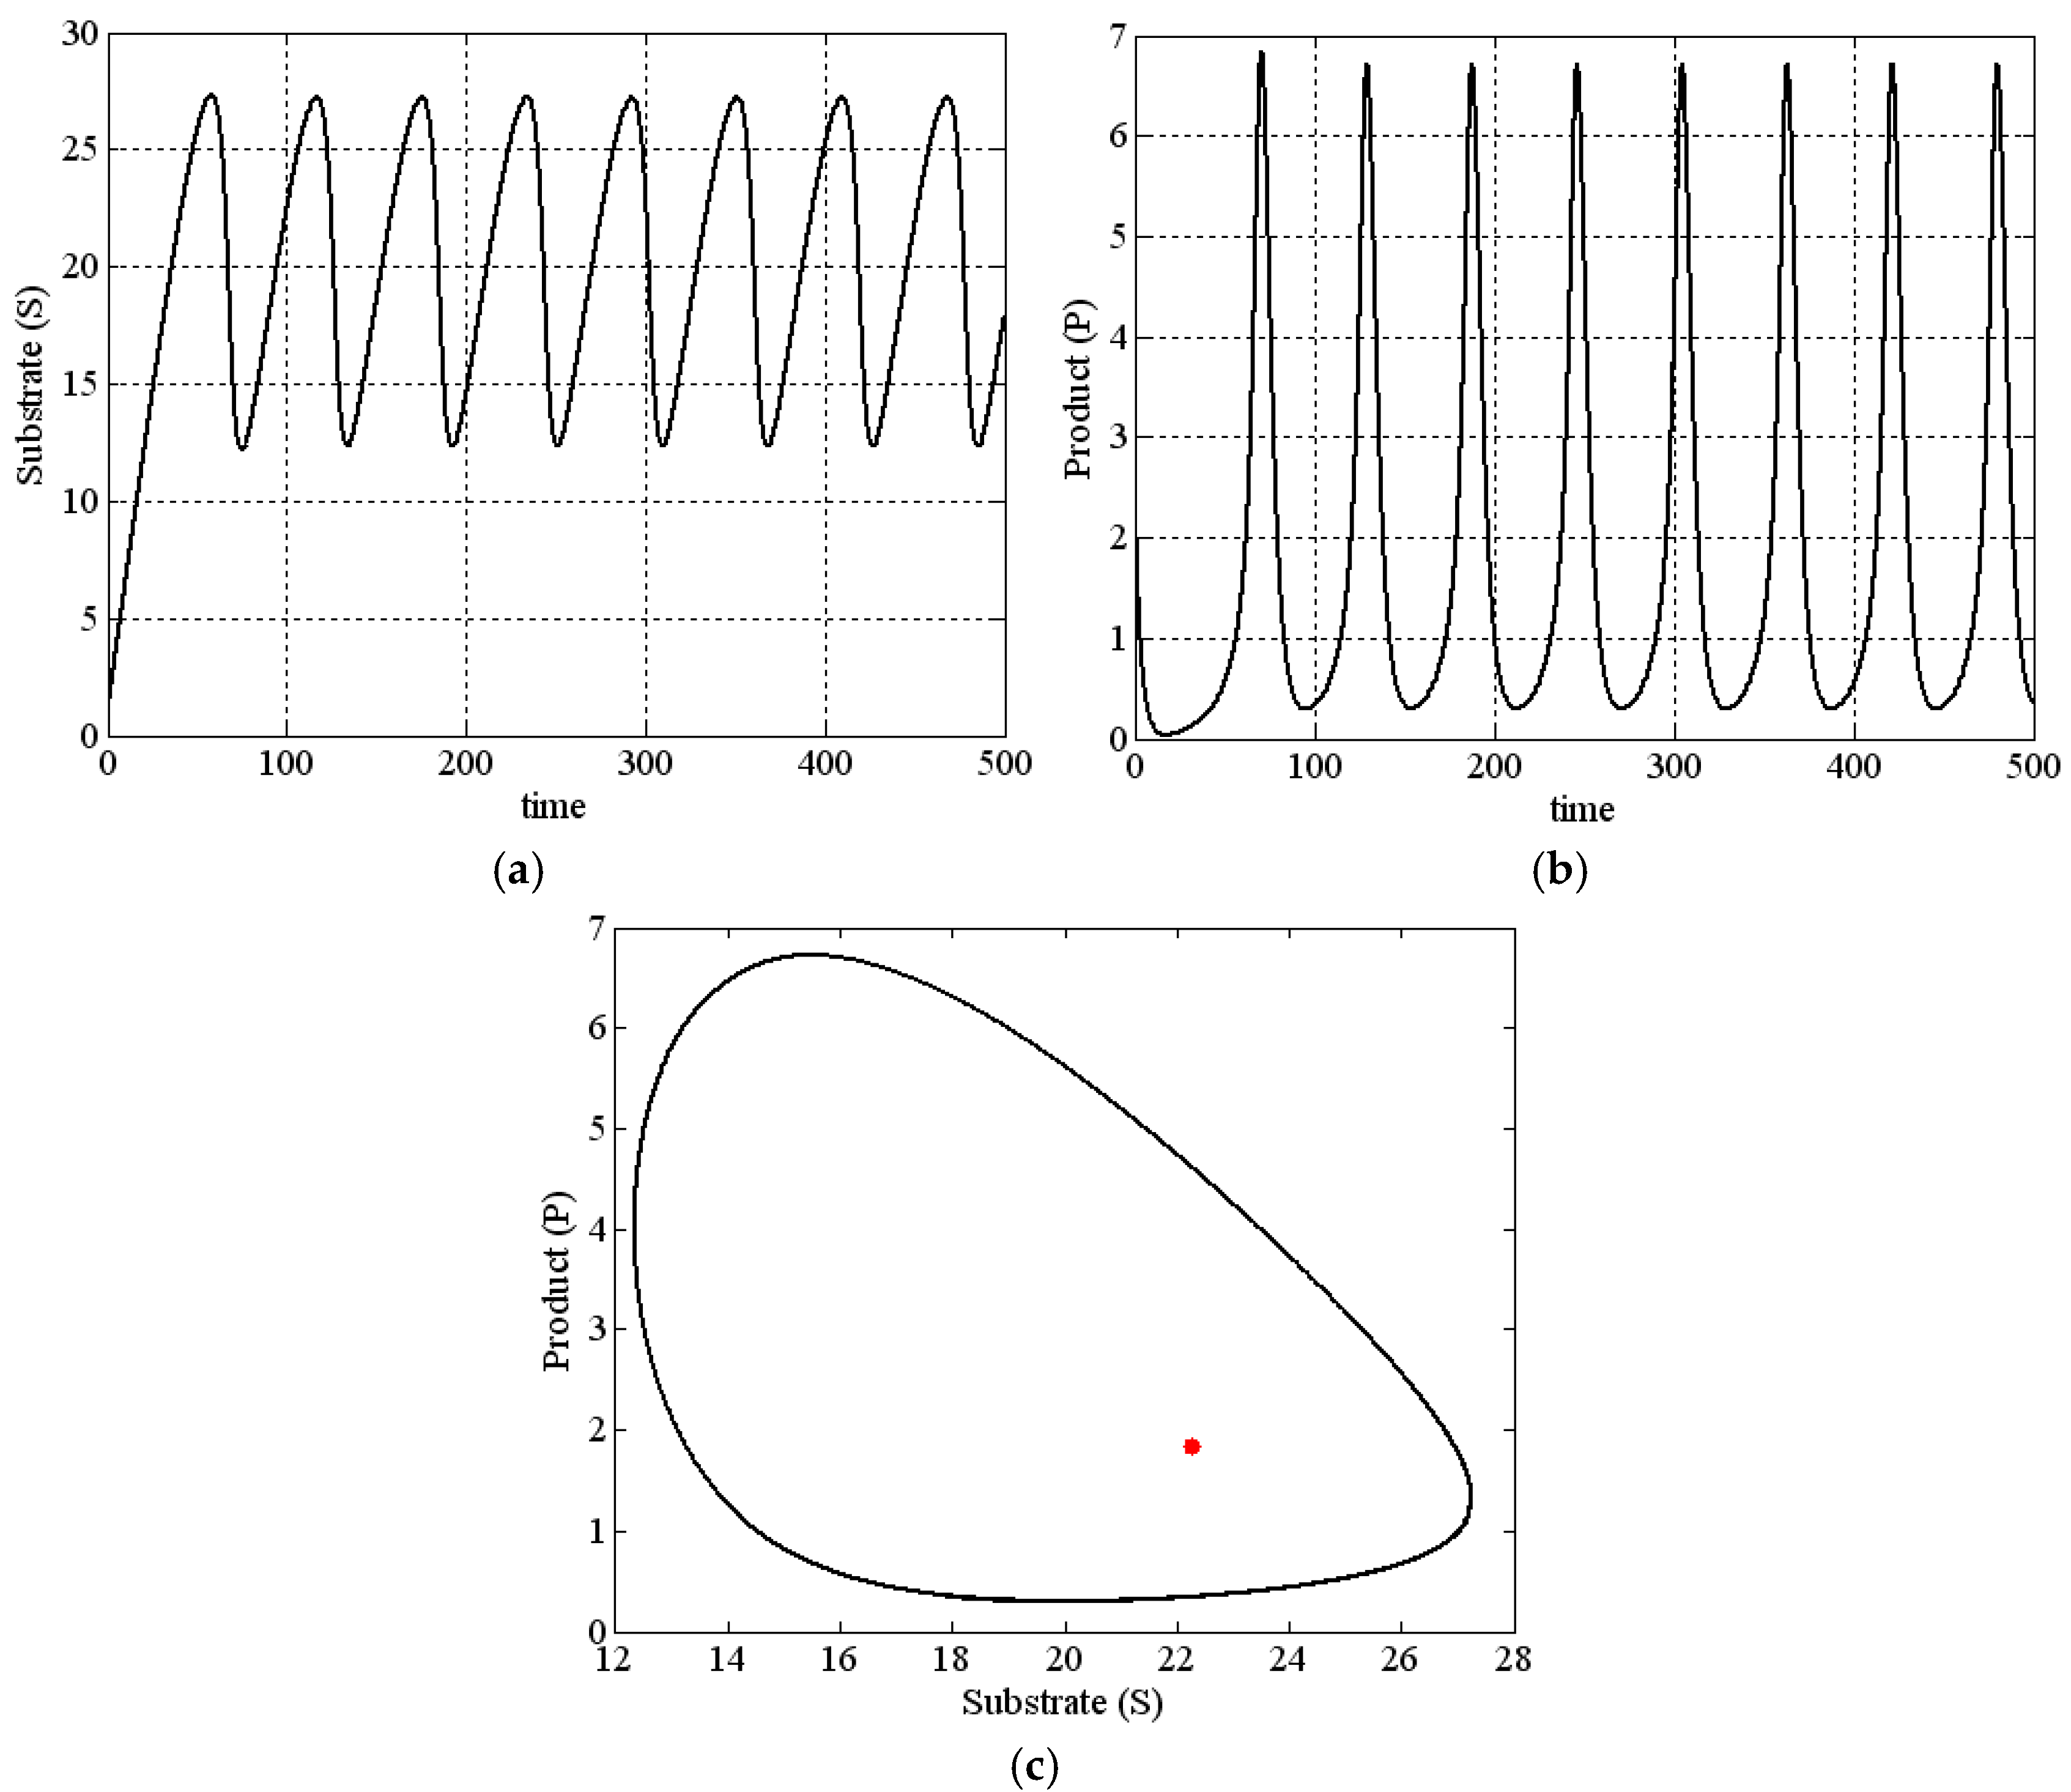
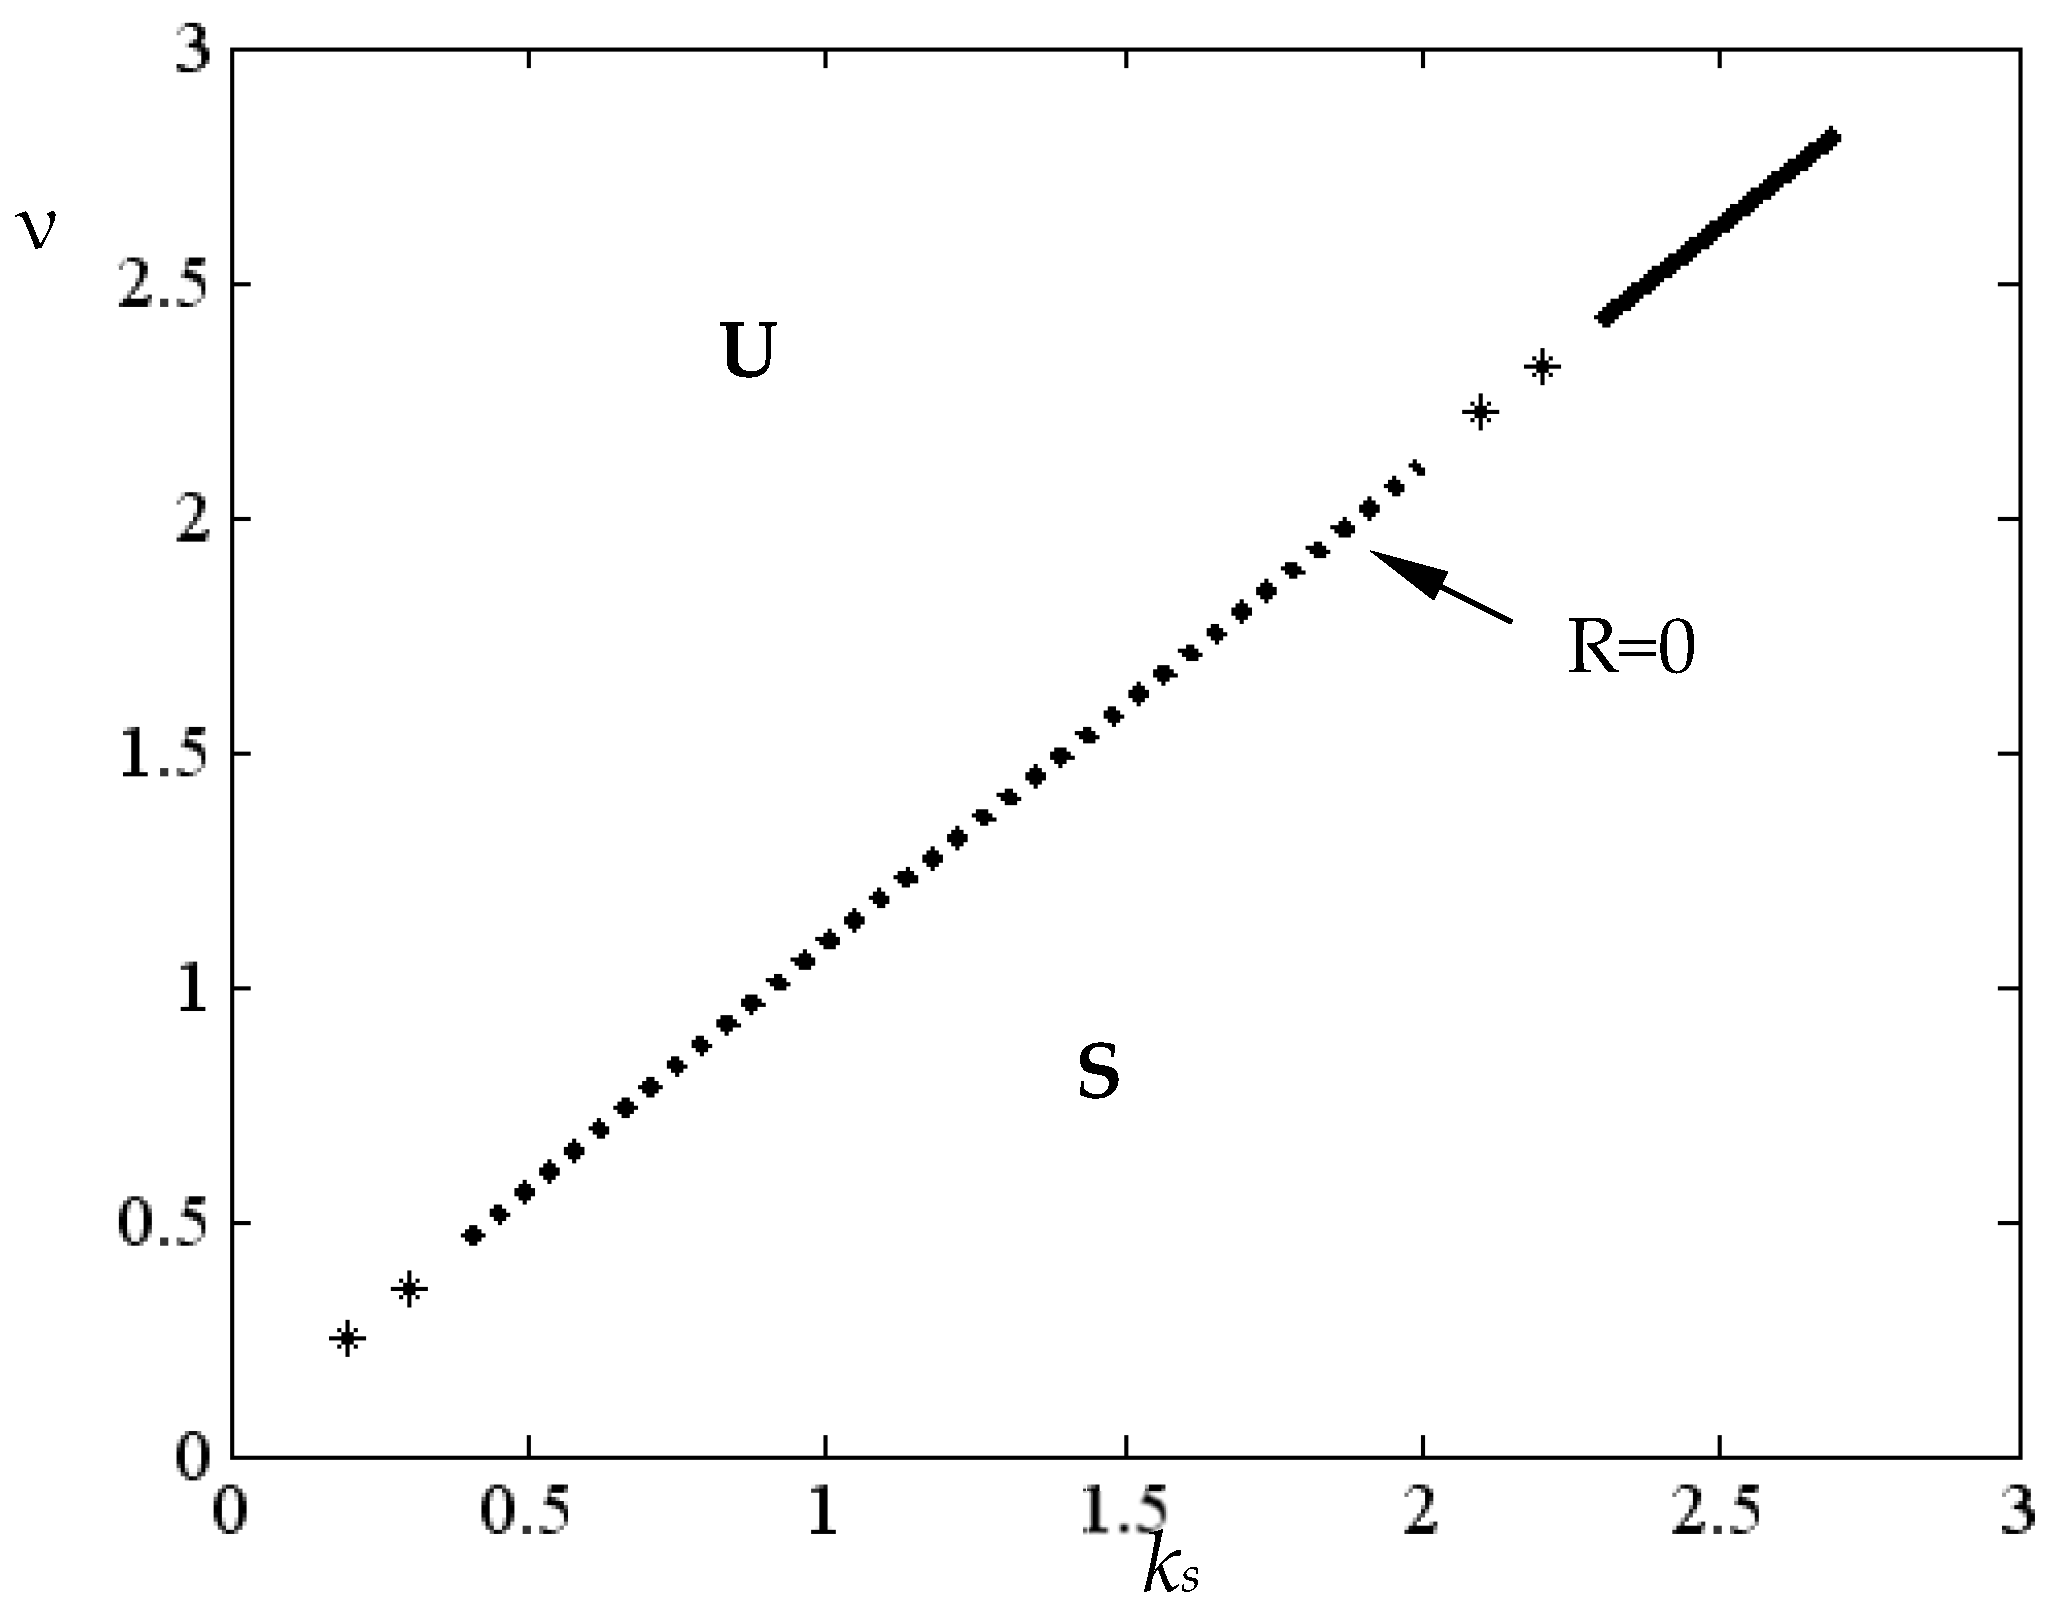
For v 0.248 ,   2.82 , k s 0.2 ,   2.7 , γ = 0.01 , α = 7.5 × 10 6 , β = 1 , σ = 10 3 , and K = 1 , the examination of system (2) shows that a soft/hard stability loss takes place—see Table 1 and Figure 6. In fact, for v 0.24 ,   0.41 and k s 0.2 ,   0.35 , the system is structurally unstable, i.e., R = L 1 = L 2 = 0 . In Figure A4, the hard stability loss situation (the external limit cycle is unstable) is shown.
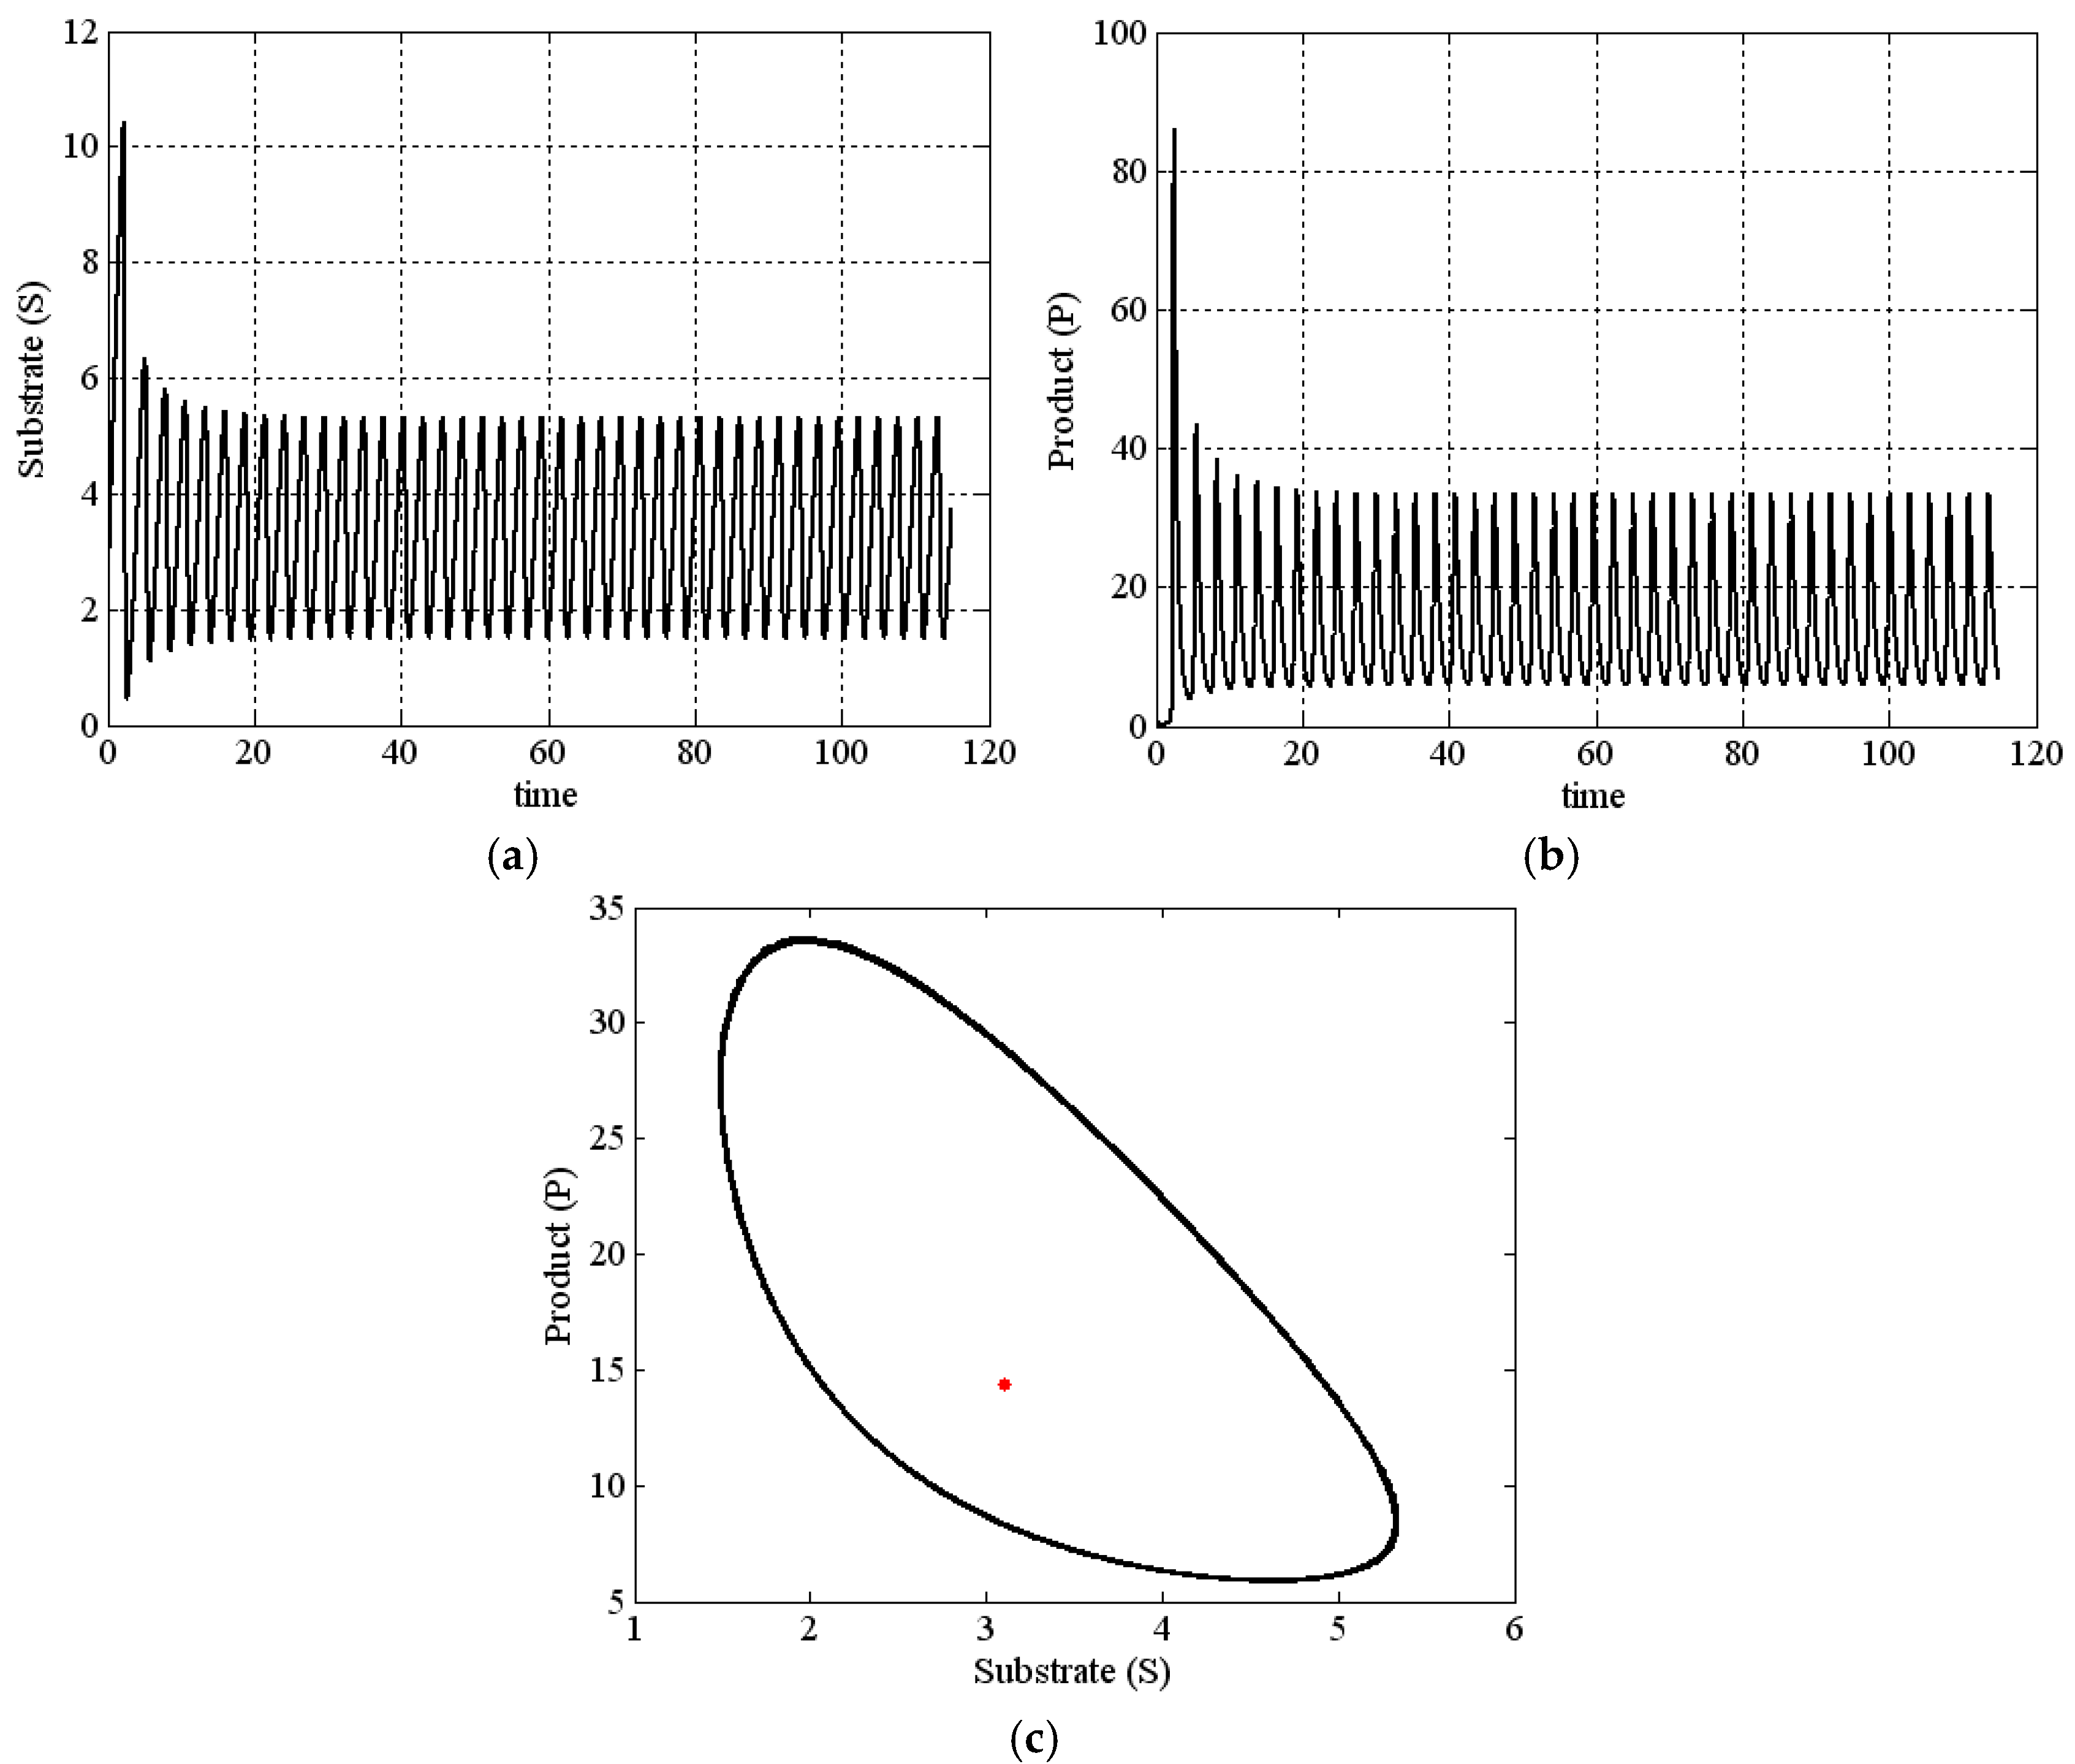
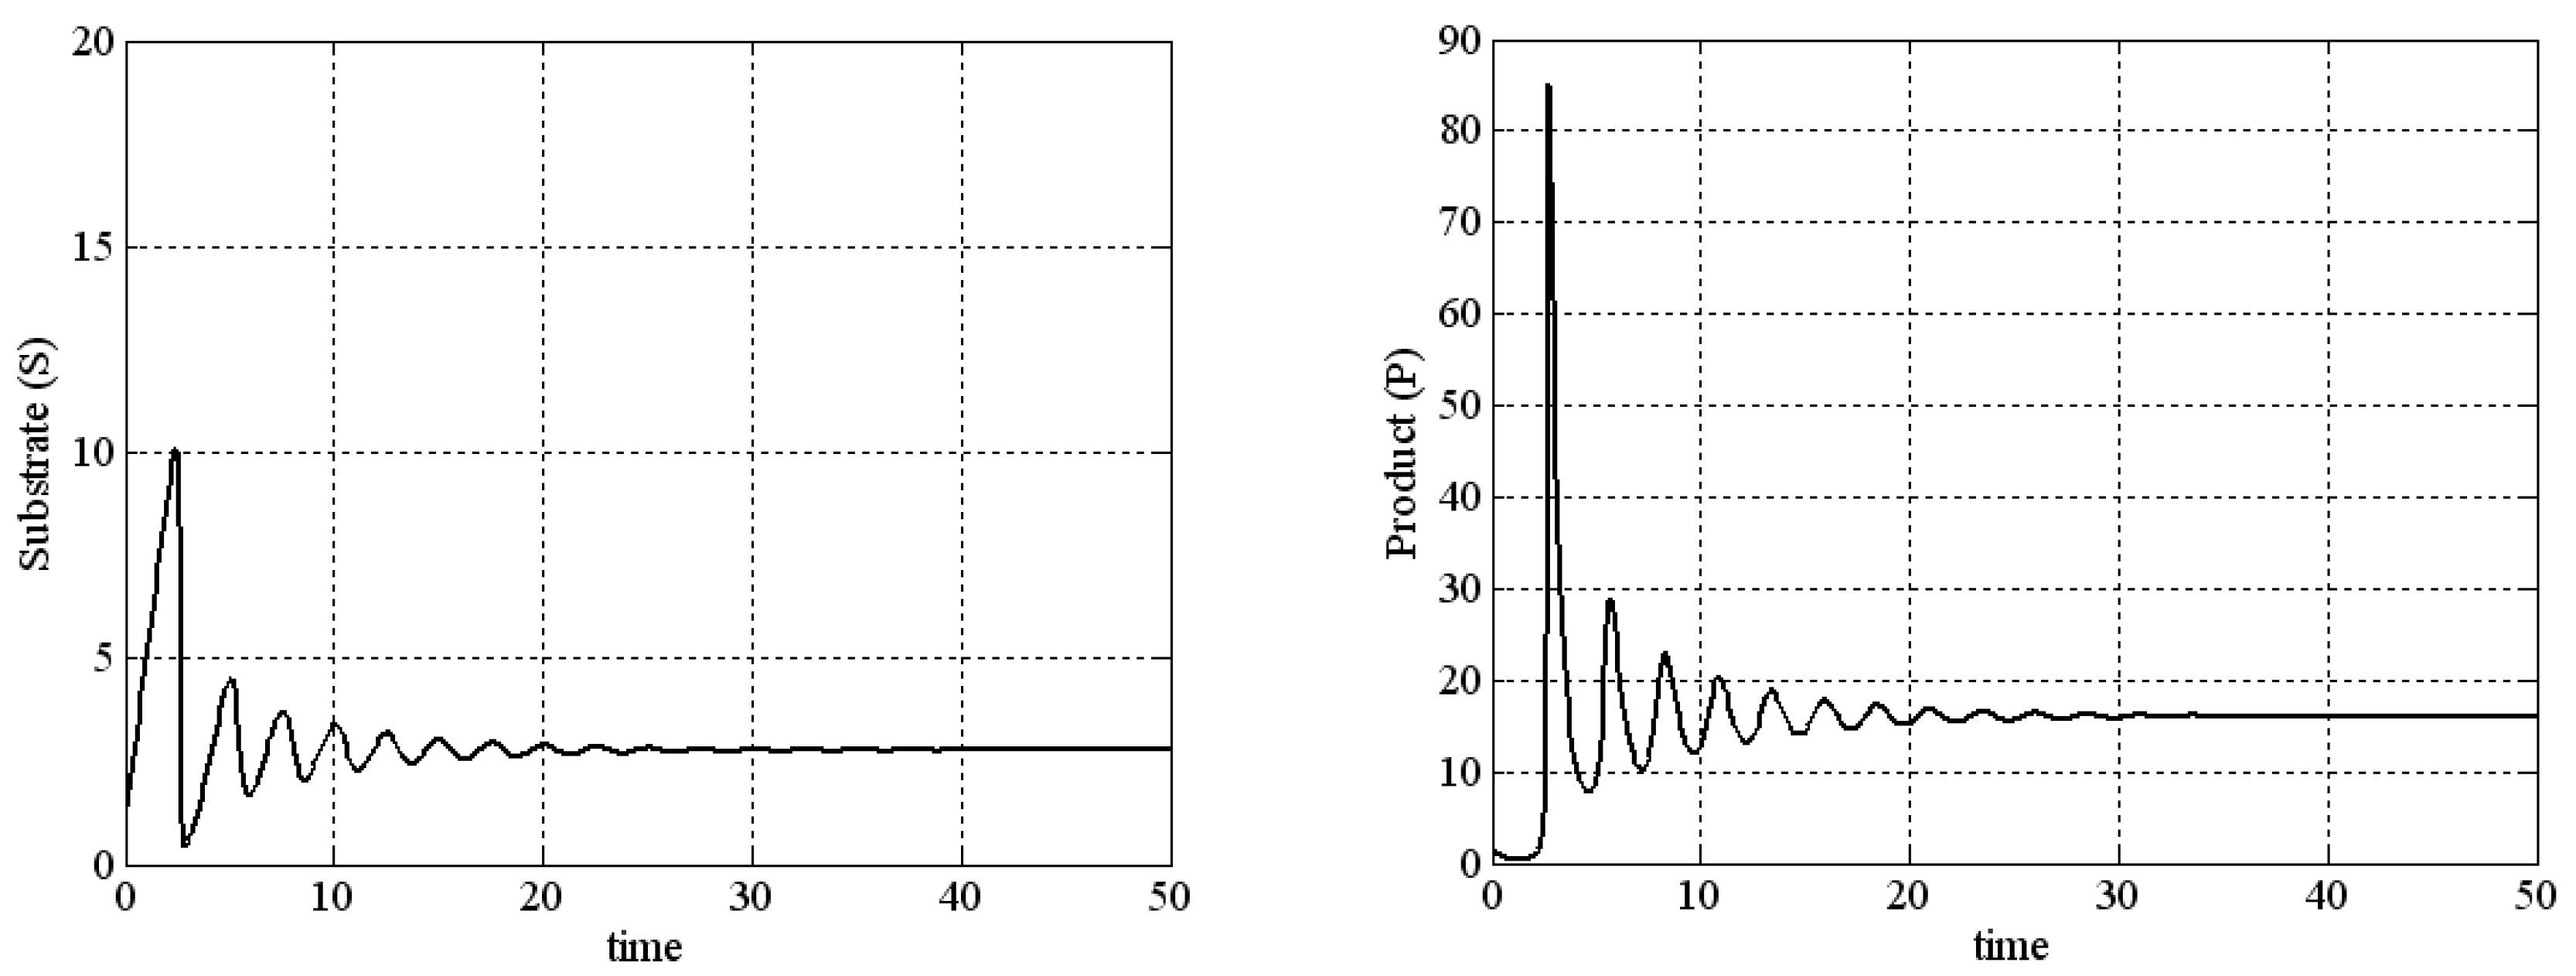
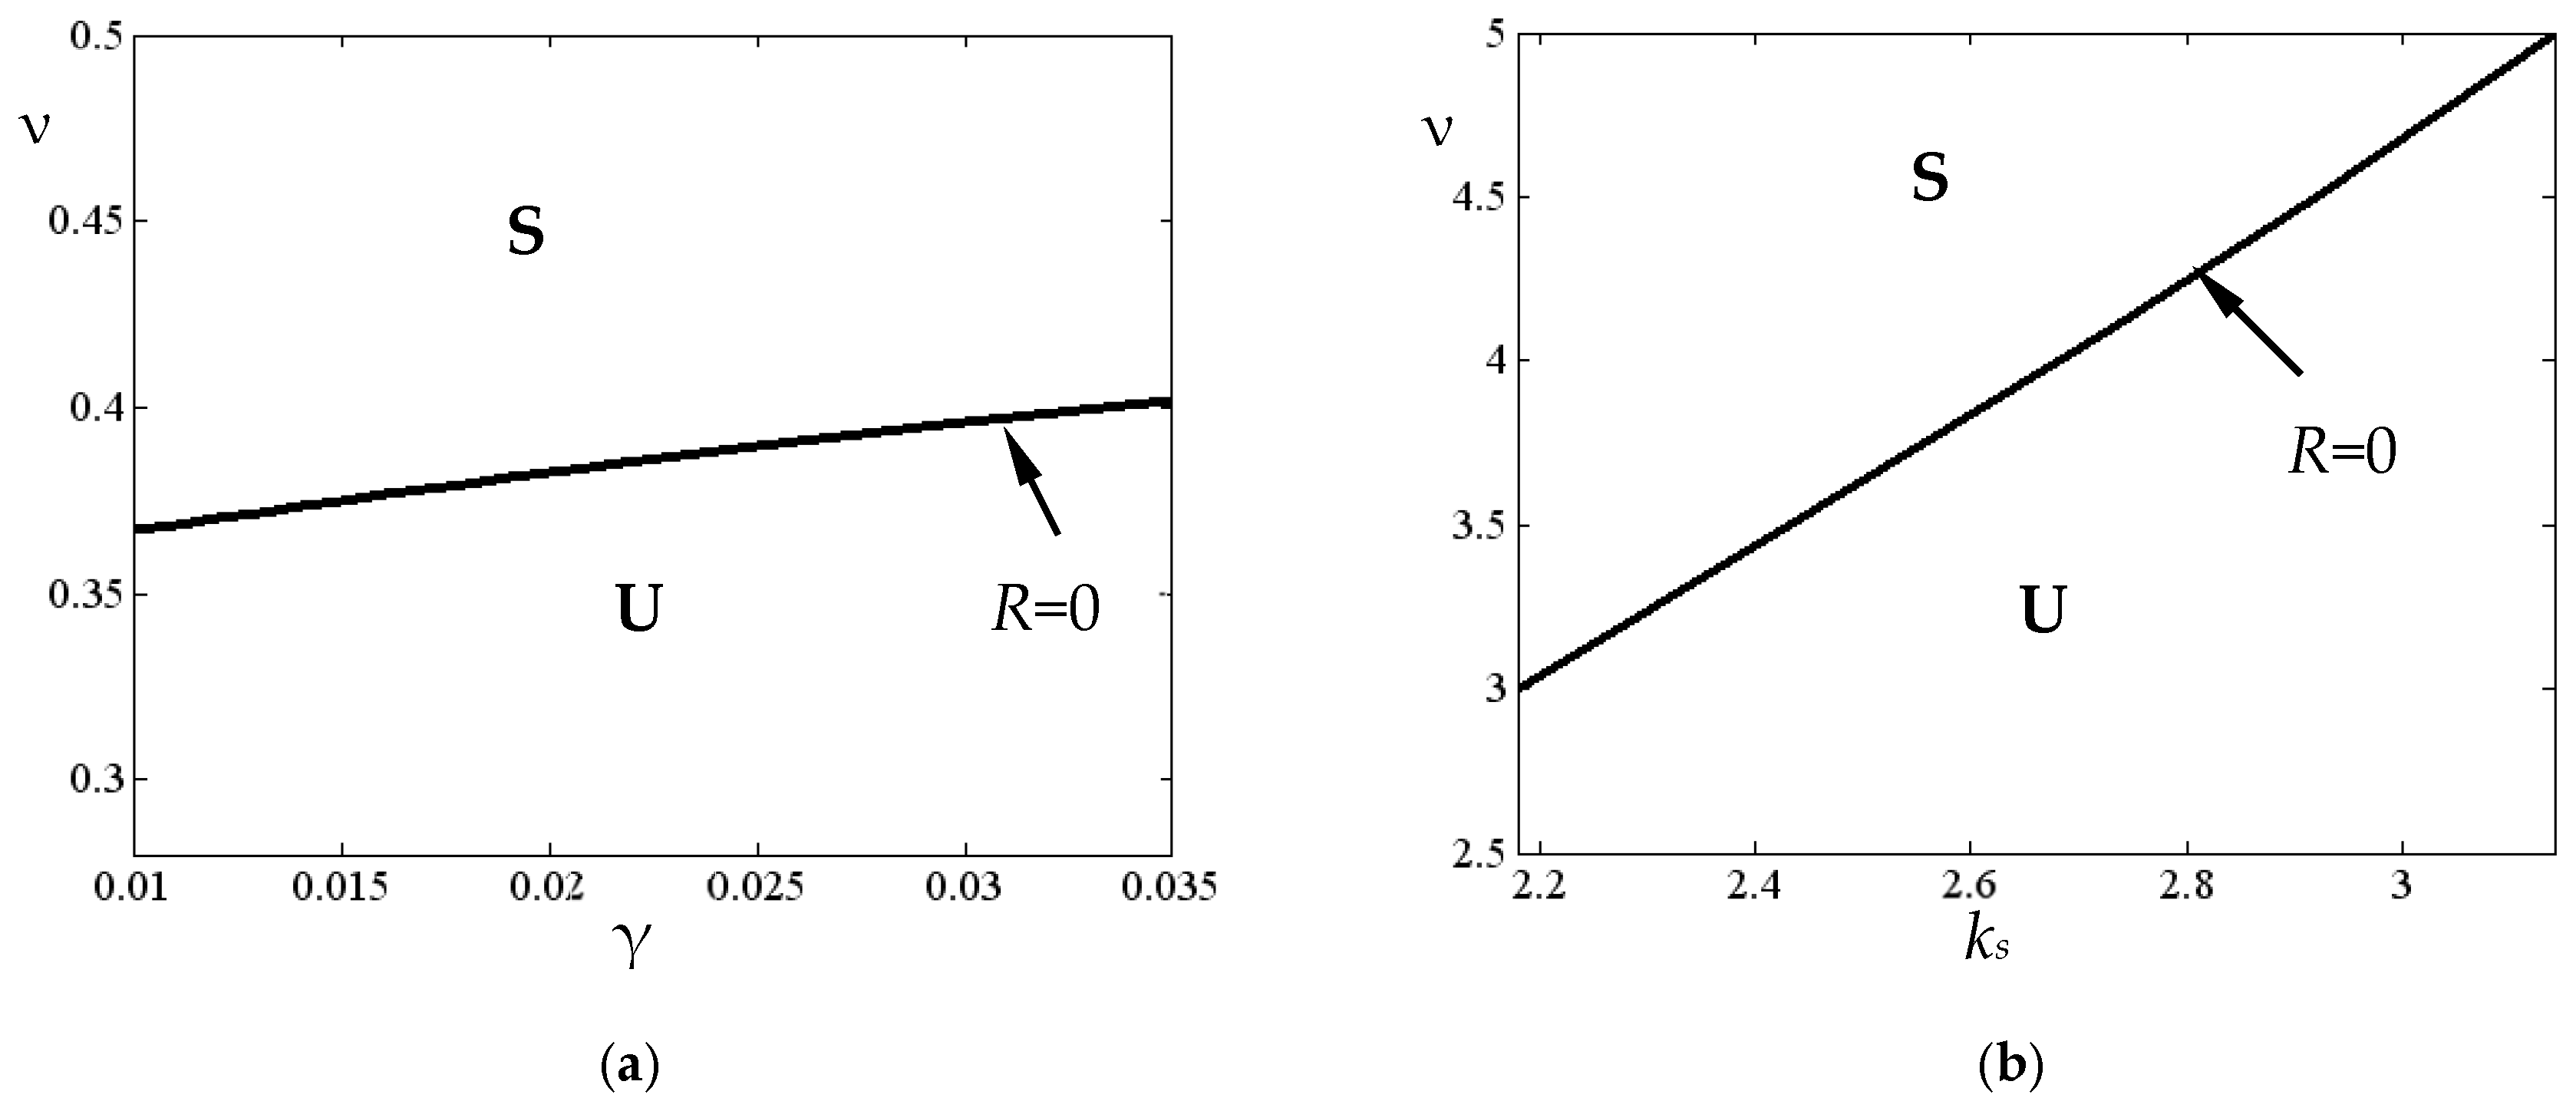
In Figure 4, Figure 7 and Figure 8b, we investigate the dynamic behavior of system (2) when k s 2.18 ,   3.14 , v 2.5 ,   5 , σ = 10 4 ,   γ = 0.012 ,   α = 7.5 × 10 6 ,   β = 10 , and K = 1 . It is seen that for v = 4 and k s = 2.5 , the system is in the stable zone (see Figure 8b), R = 0.2943 , and a stable solution takes place (see Figure 6). By changing the rate constant of the product degradation k s , i.e., k s = 2.78 , the system (2) has period-one (a stable limit cycle) oscillations, which are shown in Figure 7. Note that, in this case, the system (2) is located in the unstable zone—see Figure 8b. Moreover, because, for R = 0 , the first Lyapunov coefficient L 1 is zero and the second one L 2 is negative, we conclude that the boundary of stability is “safe” and the external limit cycle is stable. The exact values for L 2 are included in Table 2.
As we can see in Table 2, the value of the second Lyapunov coefficient on the boundary of stability for Andronov–Hopf bifurcation is negative in all the computed bifurcation points, which means that a “soft” (reversible) stability loss takes place. It is important to note that for k s 2.18 ,   3.14 , v 2.5 ,   5 , the system (2) has two limit cycles—an unstable and external stable cycle.
Biologically, the results in Figure 8 show that the stability of the system essentially depends on the ratio between the volume of substrate input v vs. the maximum rate of recycling γ (left panel) and the volume of substrate input v vs. the rate of product loss k s (right panel). For example, high values of k s and low values of v destabilize the system, i.e., the system is in the unstable zone ( U ). Note that the parameter β = 1 represents the equal affinity of the enzyme to both the substrate and product, and β = 10 represents a ten times higher affinity of the enzyme to the substrate.

4. Conclusions

In this paper, we studied the dynamical behavior of a two-dimensional nonlinear ODE system (2) which is a modification of the phosphofructo kinase model by incorporating the recycling of the product, p , into the substrate, s . The model was originally developed and mainly numerically investigated by Goldbeter and coauthors in [13,47,49,60]. Subsequently, various rigorous existence and stability results of different dynamical states were obtained in a series of papers [45,49,50,51,52]. These results are derived, however, when the cooperativity (Hill coefficient) g is equal or greater than one. Here, we expanded the parameter regime and allowed the cooperativity g to be zero, i.e., g = 0 . The physiological function of negative cooperativity is to reduce the sensitivity of a system to changes in the substrate concentration [53,58,59,73]. Moreover, in contrast to most previous studies, we analyze the stability/instability of periodic oscillations (limit cycles) instead of local (near-equilibrium) states. In examining the modified model (2), we discovered regions in the parameter space that supported different kinds of oscillatory behaviors. Moreover, for σ = 0 (defective enzyme), we obtained that the system (2) has a first integral.
For the case of negative cooperativity (see system (2)), we showed how near-equilibrium (un)stable limit cycles emerge through Andronov–Hopf bifurcation (AHB) by varying the parameters v , γ ,   σ ,   β , and k s . In particular, we used Lyapunov coefficients (quantities) to show how the boundary of stability ( R = 0 ) for AHB is safe/dangerous. In case of local bifurcations, a catastrophic bifurcation occurs at a dangerous boundary, while a subtle bifurcation occurs at a safe boundary. Interestingly, the system (2) has three different conditions depending on the values of v ,   γ , β , σ , and k s :
(1)
When v and k s are smaller than 0.5 , β = 1 , σ = 10 3 , and γ < 0.02 , it is structurally unstable, i.e., L 1 = L 2 = 0 ;
(2)
For v 3 ,   5 , k s 2.18 ,   3.14 , β = 10 , and σ = 10 4 , it has an unstable limit cycle ( L 1 = 0 ) and an external stable limit cycle ( L 2 < 0 ). Note that the same behavior (when L 1 = 0 and L 2 < 0 ) occurs for v and k s which are larger than 2.3, β = 1 , σ = 10 3 , and γ = 0.01 . Here, the boundary of stability is safe;
(3)
When v 0.5 ,   2.4 , k s 0.5 ,   2.2 , β = 1 , γ = 0.01 , and σ = 10 3 , it has an external unstable limit cycle ( L 2 > 0 ), as the boundary of stability is dangerous.
On the whole, it is important to note that the system (2) has only one equilibrium, which is calculated by Equation (9). Also, the interval for v 0.25 ,   1.8 , when γ 0.05 ,   0.1 , k s 0.3 ,   0.35 , β = 1 , and σ = 10 3 , is omitted in our numerical simulations because it results in negative solutions for (2). Hence, this is the reason why the detailed numerical study of system (2) in the adjoint parameter’s intervals is an important future task.

Author Contributions

The initial idea for investigation comes from S.G.N. The model was computed and simulated by S.G.N. and V.M.V. The qualitative analysis was performed by S.G.N. The biological interpretation was performed by M.I.N. The manuscript was drafted by all coauthors. All authors have read and agreed to the published version of the manuscript.

Funding

This research was funded by Bulgarian National Science Fund grant number КП-06-H 57/18.

Data Availability Statement

The original contributions presented in this study are included in the article. Further inquiries can be directed to the corresponding author.

Acknowledgments

Author Svetoslav G. Nikolov wishes to acknowledge support for this work in the Bulgarian National Science Fund, grant КП-06-H 57/18.

Conflicts of Interest

The authors declare no conflicts of interests.

Appendix A

In the local coordinates s = s ¯ + x 1 ,   p = p ¯ + x 2 , the system (2) has the form
x ˙ 1 = c 1 x 1 + c 2 x 2 + c 3 x 1 2 + c 4 x 2 2 + c 5 x 1 x 2 + c 6 x 1 3 + c 7 x 2 3 + c 8 x 1 2 x 2 + c 9 x 1 x 2 2 + + c 10 x 1 4 + + c 11 x 2 4 + c 12 x 1 x 2 3 + c 13 x 1 2 x 2 2 + c 14 x 1 3 x 2 + c 15 x 1 x 2 4 + c 16 x 1 2 x 2 3 + c 17 x 1 3 x 2 2 + + c 18 x 1 3 x 2 3 + c 19 x 1 2 x 2 4 + c 20 x 1 4 x 2 + c 21 x 1 3 x 2 4 + c 22 x 1 4 x 2 2 + c 23 x 1 4 x 2 3 + c 24 x 1 4 x 2 4 , x ˙ 2 = c 25 x 1 + c 26 x 2 + c 27 x 1 2 + c 28 x 2 2 + c 29 x 1 x 2 + c 30 x 1 3 + c 31 x 2 3 + c 32 x 1 2 x 2 + c 33 x 1 x 2 2 + + c 34 x 1 4 + c 35 x 2 4 + c 36 x 1 x 2 3 + c 37 x 1 2 x 2 2 + c 38 x 1 3 x 2 + c 39 x 1 x 2 4 + c 40 x 1 2 x 2 3 + c 41 x 1 3 x 2 2 + + c 42 x 1 3 x 2 3 + c 43 x 1 2 x 2 4 + c 44 x 1 4 x 2 + c 45 x 1 3 x 2 4 + c 46 x 1 4 x 3 2 + c 47 x 1 4 x 2 3 + c 48 x 1 4 x 2 4 ,
where
c 1 = σ ψ 2 ε ˜ η 2 ψ s ¯ ψ + 2 s ¯ + η ψ ε ˜ 2 s ¯ 1 ,   c 2 = 2 s ¯ σ η ψ ε ˜ 2 η 2 ψ 2 ε ˜ 1 , c 3 = σ ψ 2 ε ˜ η ψ 2 s ¯ + s ¯ ψ + η ψ + 2 η ε ˜ 1 ,   c 4 = s ¯ σ η ε ˜ 6 η 2 ψ 2 ε ˜ 1 , c 5 = 2 σ ψ ε ˜ 2 η 2 ψ η ψ + 2 s ¯ ψ + s ¯ ε ˜ 2 s ¯ 1 ,   c 6 = σ ψ 3 ε ˜ 2 2 η + η ψ + s ¯ ψ , c 7 = 4 s ¯ σ η 3 ψ ε ˜ 2 ,   c 8 = 2 σ ψ ε ˜ 2 η ψ 2 η ψ + 2 s ¯ + 1 + 2 s ¯ ψ ε ˜ 1 , c 9 = σ ε ˜ 2 η 2 ψ 3 η ψ + s ¯ + 8 s ¯ ψ ε ˜ 2 s ¯ 1 ,   c 10 = σ ψ 4 ε ˜ 2 ,   c 11 = s ¯ σ η 3 ε ˜ 2 , c 12 = 4 σ η 2 ψ 4 s ¯ + 1 ε ˜ 2 ,   c 13 = σ ε ˜ 2 η ψ 8 η ψ + 2 s ¯ + 1 + 8 s ¯ ψ ε ˜ 1 , c 14 0 = 4 σ ψ 2 ε ˜ 0 2 η + 2 η ψ + s ¯ ψ ,   c 15 0 = σ η 2 ε ˜ 0 2 4 s ¯ + 1 ,   c 16 0 = 12 η ψ ε ˜ 0 2 2 s ¯ + 1 , c 17 0 = 2 σ ψ ε ˜ 0 2 η + 8 η ψ + 3 s ¯ ψ ,   c 18 0 = 4 σ ψ ε ˜ 0 2 4 s ¯ + 3 ,   c 19 0 = 3 σ η ε ˜ 0 2 2 s ¯ + 1 , c 20 = 4 σ ψ 3 ε ˜ 2 ,   c 21 = σ ε ˜ 2 4 s ¯ + 3 ,   c 22 = 6 σ ψ 2 ε ˜ 2 ,   c 23 = 4 σ ψ ε ˜ 2 ,   c 24 = σ ε ˜ 2 , c 25 = β σ ψ 2 ε ˜ η 2 ψ s ¯ ψ + 2 s ¯ + η ψ ε ˜ + 2 s ¯ + 1 ,   c 26 = 2 s ¯ β σ η ψ ε ˜ 2 η 2 ψ 2 ε ˜ + 1 k s , c 27 = β σ ψ 2 ε ˜ η ψ 4 s ¯ + 2 + s ¯ ψ + η ψ ε ˜ + 1 ,   c 28 = s ¯ β σ η ε ˜ 6 η 2 ψ 2 ε ˜ + 1 , c 29 = 2 β σ ψ ε ˜ 2 η 2 ψ s ¯ + η ψ + 2 s ¯ ψ ε ˜ + 2 s ¯ + 1 ,   c 30 = β σ ψ 3 ε ˜ 2 2 η + η ψ + s ¯ ψ , c 31 = 4 s ¯ β σ η 3 ψ ε ˜ 2 ,   c 32 = 2 β σ ψ ε ˜ 2 η ψ 2 η ψ + 2 s ¯ ψ + 2 s ¯ + 1 ε ˜ + 1 , c 33 = β σ ε ˜ 2 η 2 ψ 3 η ψ + s ¯ + 8 s ¯ ψ ε ˜ + 2 s ¯ + 1 ,   c 34 = β σ ψ 4 ε ˜ 2 ,   c 35 = s ¯ β σ η 3 ε ˜ 2 , c 36 = 4 β σ η 2 ψ 4 s ¯ + 1 ε ˜ 2 ,   c 37 = β σ ε ˜ 2 η ψ 8 η ψ + 2 s ¯ + 1 + 8 s ¯ ψ ε ˜ + 1 , c 38 = 4 β σ ψ 2 ε ˜ 2 η + 2 η ψ + s ¯ ψ ,   c 39 = β σ η 2 ε ˜ 2 4 s ¯ + 1 ,   c 40 = 12 β σ η ψ ε ˜ 2 2 s ¯ + 1 , c 41 = 2 β σ ψ ε ˜ 2 η + 8 η ψ + 3 s ¯ ψ ,   c 42 = 4 β σ ψ ε ˜ 2 4 s ¯ + 3 ,   c 43 = 3 β σ η ε ˜ 2 2 s ¯ + 1 , c 44 = 4 β σ ψ 3 ε ˜ 2 ,   c 45 = β σ ε ˜ 2 4 s ¯ + 3 ,   c 46 = 6 β σ ψ 2 ε ˜ 2 ,   c 47 = 4 β σ ψ ε ˜ 2 ,   c 48 = β σ ε ˜ 2 .
Here ε ˜ = α + 1 + s ¯ 2 1 + p ¯ 2 = α + η 2 ψ 2 ,   η = 1 + s ¯ ,   ψ = 1 + p ¯ .

Appendix B

From a mathematical point of view, all analytical and numerical solutions of system (2) are correct and exist for (18), i.e.,
σ = 10 3 ; 10 4 s 1 ,   α = 7.5 × 10 6 ,   K = 1 ,   β = 1 ; 10 , v 0.25 ,   5   s 1 ,   γ 0.01 ,   1   s 1 ,   k s 0.1 ,   4   s 1 .
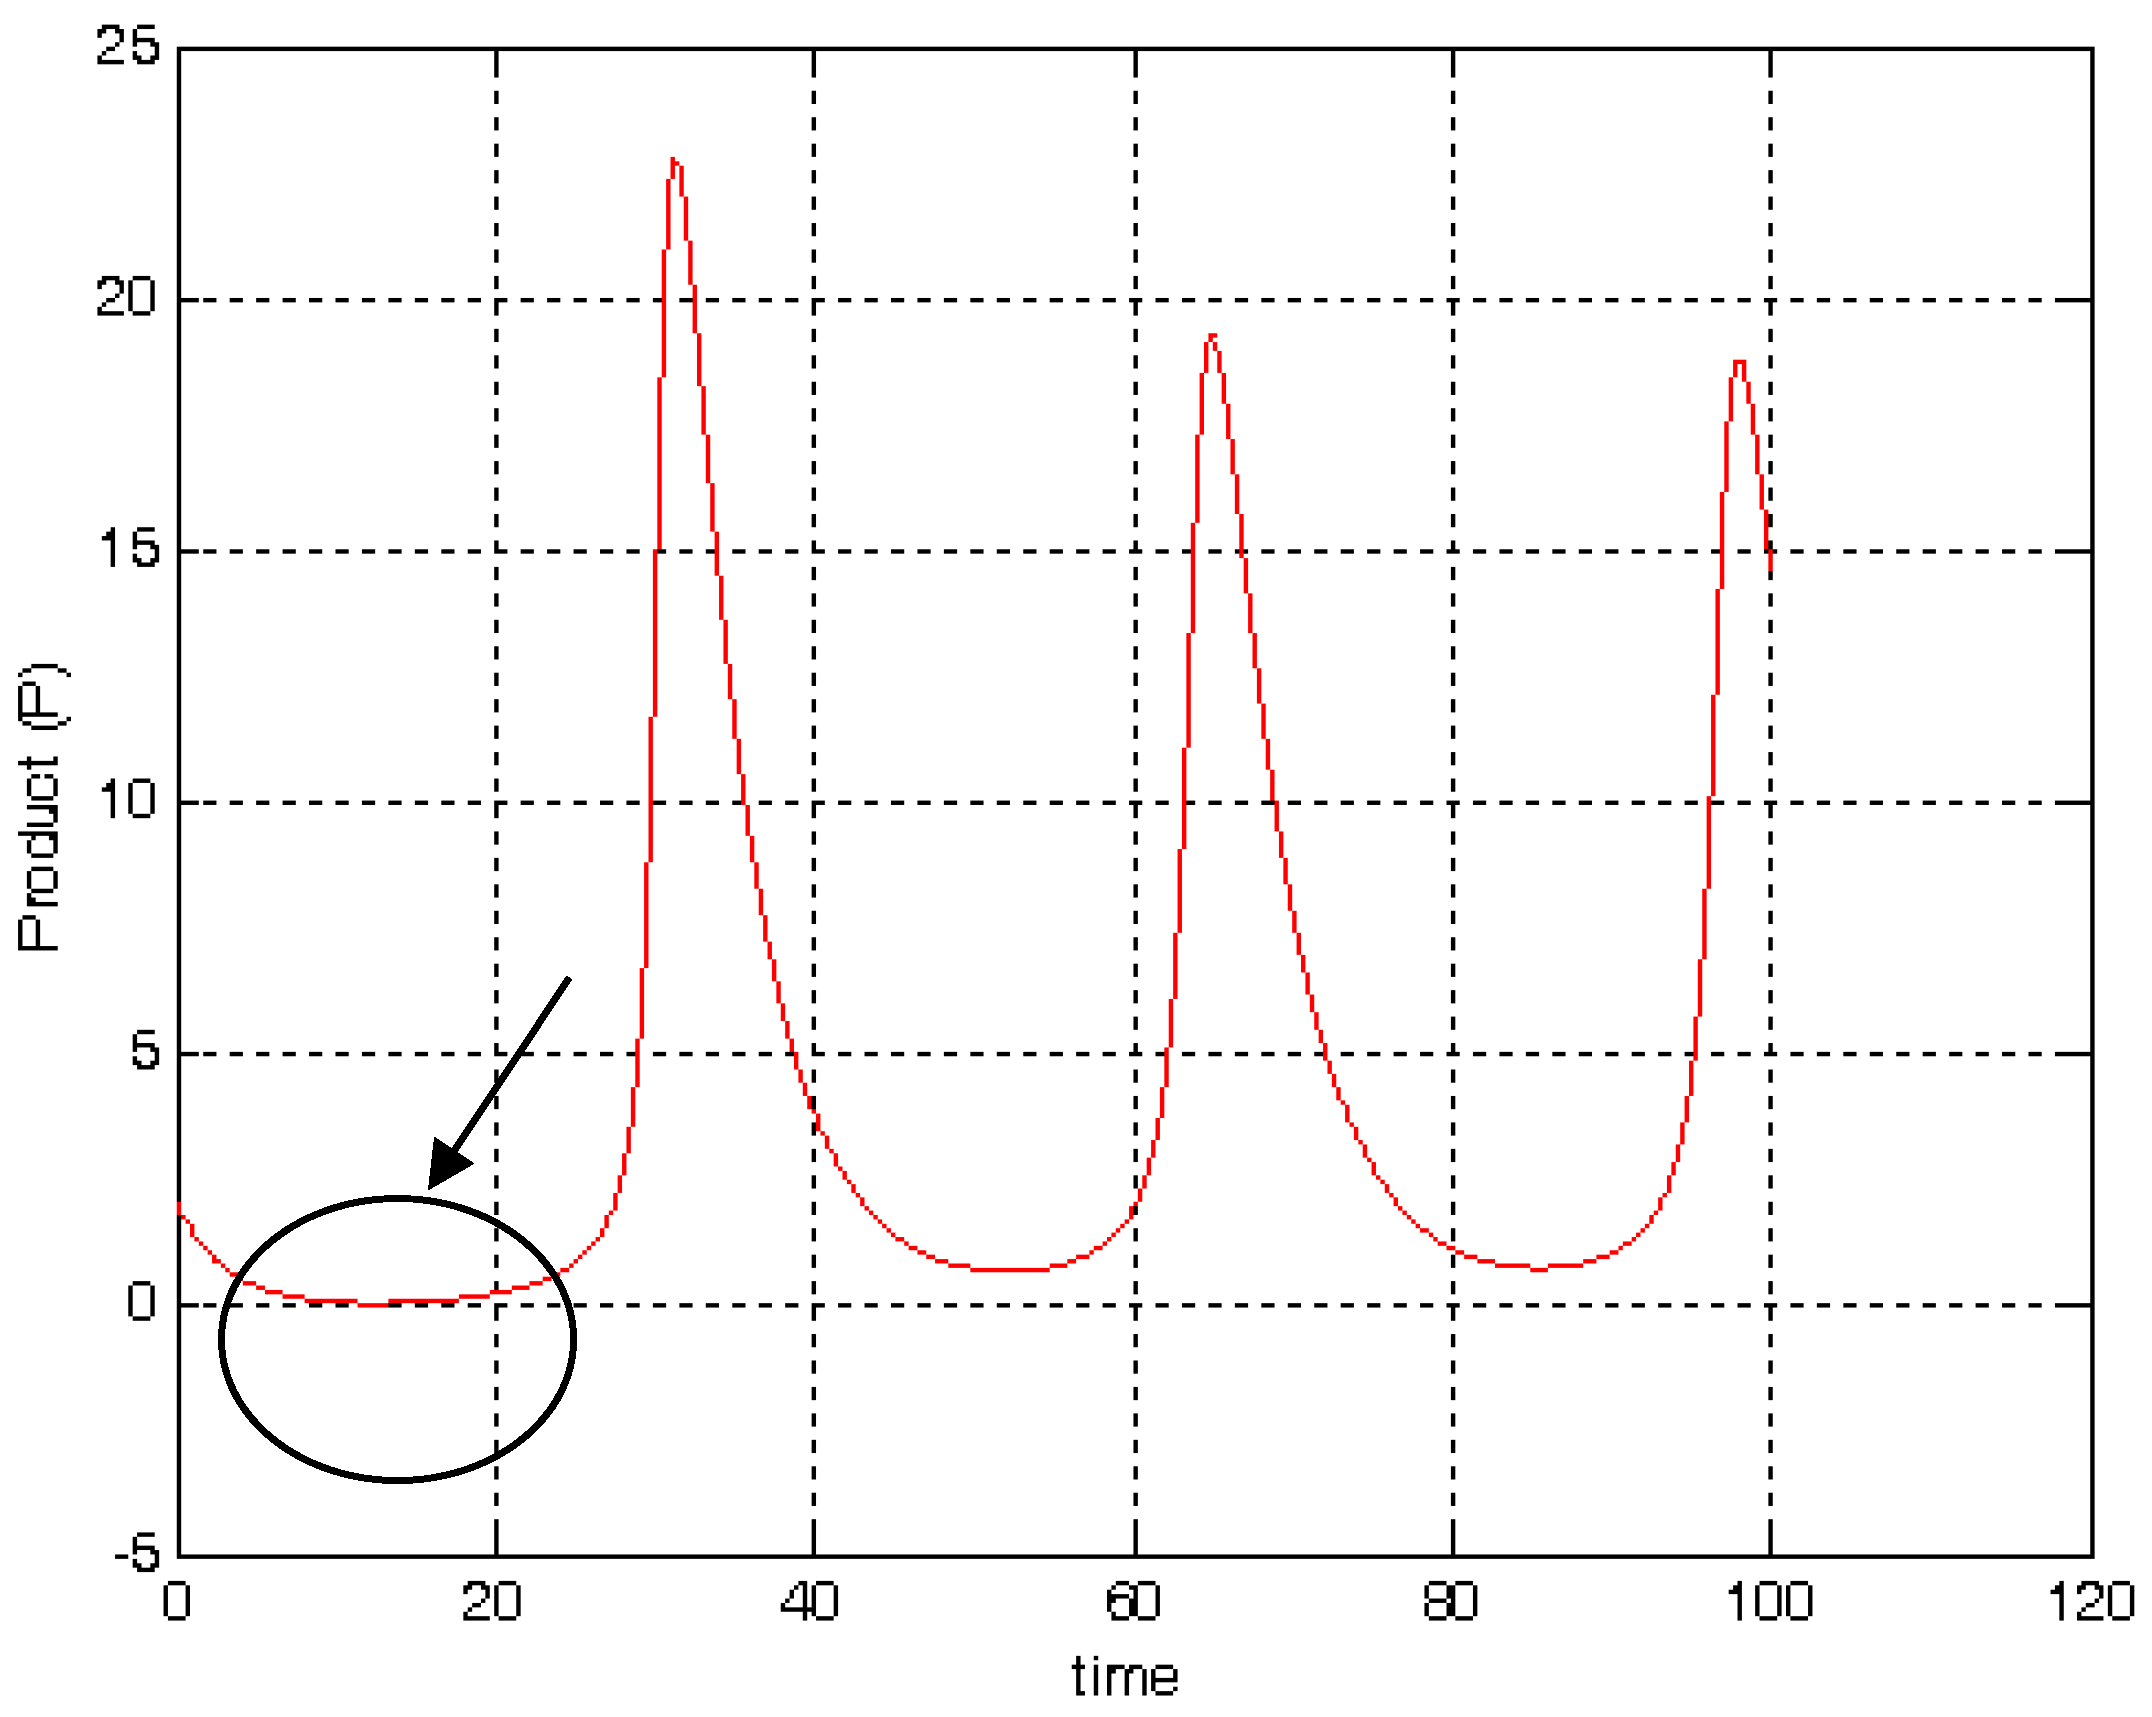
On the other hand, from a biological point view, all solutions of (2) must be positive or zero. Thus, after numerical calculations (see Figure A1 and Figure A2 below), we obtain that the product (p) has negative solutions (see the circles) when:
(i)
γ = 0.05 ,     σ = 10 3 ,     α = 7.5 × 10 6 ,     k s = 0.3 ,   K = 1 ,   β = 1 , and v 0.25 ,   0.82 ;
(ii)
γ = 0.1 ,     σ = 10 3 ,     α = 7.5 × 10 6 ,     k s = 0.3 ,   K = 1 ,   β = 1 , and v 0.25 ,   1.45 ;
(iii)
γ = 0.1 ,     σ = 10 3 ,     α = 7.5 × 10 6 ,     k s = 0.35 ,   K = 1 ,   β = 1 , and v 0.25 ,   1.8 .
Therefore, the interval for v 0.25 ,   1.8 , when γ 0.05 ,   0.1 and k s 0.3 ,   0.35 , is omitted in our numerical simulations and conclusions.
Figure A1. Solution of system (2) for product (p) when: v = 0.8 ,   γ = 0.05 ,   σ = 10 3 ,   α = 7.5 × 10 6 ,   k s = 0.3 , K = 1 , β = 1 . In the circle we have negative solution.
Mathematics 13 00260 g0a1
Figure A2. Solution of system (2) for product (p) when: v = 1.4 ,   γ = 0.1 ,   σ = 10 3 ,   α = 7.5 × 10 6 ,   k s = 0.3 , K = 1 , β = 1 . In the circle we have negative solution.
Mathematics 13 00260 g0a2

Appendix C

Figure A3. Plot substrate (s) versus product (p) when: v = 5 ,   γ = 1 ,   k s = 4 ,   C = 5 , β = 1 (black color line) and β = 10 (blue color line).
Mathematics 13 00260 g0a3

Appendix D

Figure A4. Period-one (stable interior limit cycle) oscillations of system (2) (a,b) and phase portrait (c) when: v = 0.55 ,   σ = 10 3 ,   γ = 0.01 ,   α = 7.5 × 10 6 ,   k s = 0.3 ,   β = 1 ,   K = 1 , and g = 0 . Here, R = −0.044. Notation: red point is equilibrium state E ¯ s ¯ = 22.28 ,   p ¯ = 1.83 .
Mathematics 13 00260 g0a4

References

  1. Prigogine, I. The End of Certainty. Time, Chaos and the New Laws of Nature; The Free Press: New York, NY, USA, 1997. [Google Scholar]
  2. Rubin, A.; Riznichenko, G. Mathematical Biophysics; Springer: New York, NY, USA, 2014. [Google Scholar]
  3. Shao, P.; Shateyi, S. Stability analysis of SEIRS epidemic model with nonlinear incidence rate function. Mathematics 2021, 9, 2644. [Google Scholar] [CrossRef]
  4. Blanchini, F.; Giordano, G. Polyhedral Lyapunov functions structurally ensure global asymptotic stability of dynamical networks if the Jacobian is non-singular. Automatica 2017, 86, 183–191. [Google Scholar] [CrossRef]
  5. Nikolov, S.; Lai, X.; Liebal, U.; Wolkenhauer, O.; Vera, J. Integration of sensitivity and bifurcation analysis to detect critical biochemical processes in cell signalling pathway. Int. J. Syst. Sci. 2010, 41, 81–105. [Google Scholar] [CrossRef]
  6. Jan, A.; Shah, R.; Ahmad, H.; Bilal, H.; Almohsen, B. Dynamic behavior of enzyme kinetics cooperative chemical reactions. AIP Adv. 2024, 14, 035139. [Google Scholar] [CrossRef]
  7. Nikolov, S. Modelling and analysis of miRNA regulation. BIOMATH 2014, 3, 1407231. [Google Scholar] [CrossRef]
  8. Arnold, V.; Kozlov, V.; Neishtadt, A. Mathematical Aspects of Classical and Celestial Mechanics, 3rd ed.; Springer: Berlin/Heidelberg, Germany, 2006. [Google Scholar]
  9. Landa, P. Regular and Chaotic Oscillations; Springer: Berlin/Heidelberg, Germany, 2001. [Google Scholar]
  10. Broer, H.; Takens, F. Dynamical Systems and Chaos; Springer: New York, NY, USA, 2011. [Google Scholar]
  11. Nayfeh, A.; Mook, D. Nonlinear Oscillations; John Wiley & Sons Inc.: New York, NY, USA, 1995. [Google Scholar]
  12. Guckenheimer, J.; Holmes, P. Nonlinear Oscillations, Dynamical Systems, and Bifurcations of Vector Fields; Springer: New York, NY, USA, 2002. [Google Scholar]
  13. Goldbeter, A. Biochemical Oscillations and Cellular Rhythms. The Molecular Bases of Periodic and Chaotic Behaviour; Cambridge University Press: Cambridge, UK, 1996. [Google Scholar]
  14. Chen, L.; Wang, R.; Li, C.; Kazuyki, A. Modeling Biomolecular Networks in Cells, Structures and Dynamics; Springer: London, UK, 2010. [Google Scholar]
  15. Dumortier, F.; Llibre, J.; Artés, J.C. Qualitative Theory of Planar Differential Systems; Springer: New York, NY, USA, 2006. [Google Scholar]
  16. Nguyen, L.; Kholodenko, B. Feedback regulation in cell signalling: Lessons for cancer therapeutics. Semin. Cell Dev. Biol. 2016, 50, 85–94. [Google Scholar] [CrossRef]
  17. Shilnikov, L.; Shilnikov, A.; Turaev, D.; Chua, L. Methods of Qualitative Theory in Nonlinear Dynamics; Part II; World Scientific: London, UK, 2001. [Google Scholar]
  18. Andronov, A.; Witt, A.; Chaikin, S. Theory of Oscillations; Addison-Wesley: Reading, MA, USA, 1966. [Google Scholar]
  19. Wu, Y.; Zhang, M.; Mao, J. Bifurcation of limit cycles at a nilpotent critical point in a septic Lyapunov system. J. Appl. Anal. Comput. 2020, 10, 2575–2591. [Google Scholar] [CrossRef]
  20. Cao, D.; Zhang, W. Global bifurcations and chaotic dynamics for a string-beam coupled system. Chaos Solitons Fractals 2008, 37, 858–875. [Google Scholar] [CrossRef]
  21. Xing, R.; Xiao, M.; Zhang, Y.; Qiu, J. Stability and Hopf bifurcation analysis of an (n+m)-neuron double-ring neural network model with multiple time delay. J. Syst. Sci. Complex. 2022, 35, 159–178. [Google Scholar] [CrossRef]
  22. Nikolov, S. Stability and Andronov-Hopf bifurcation of a system with three time delays. J. Math. 2013, 2013, 347071. [Google Scholar] [CrossRef]
  23. Nikolov, S.; Santos, G.; Wolkenhauer, O.; Vera, J. Model-based phenotypic signatures governing the dynamics of the stem and semi-differentiated cell populations in dysplastic colonic crypts. Bull. Math. Biol. 2018, 80, 360–384. [Google Scholar] [CrossRef] [PubMed]
  24. Seydel, R. Practical Bifurcation and Stability Analysis, 3rd ed.; Springer: New York, NY, USA, 2010. [Google Scholar]
  25. Zhdanov, V. Periodic perturbation of genetic oscillations. Chaos Solitons Fractals 2012, 45, 577–587. [Google Scholar] [CrossRef]
  26. Nikolov, S.; Wolkenhauer, O.; Vera, J. Tumors as chaotic attractors. Mol. BioSyst. 2014, 10, 172–179. [Google Scholar] [CrossRef] [PubMed]
  27. Nikolov, S.; Dimitrov, A.; Vera, J. Hierarchical levels of biological systems and their integration as a principal cause for tumour occurrence. Nonlinear Dyn. Psychol. Life Sci. 2019, 23, 315–329. [Google Scholar]
  28. Vera, J.; Lischer, C.; Nenov, M.; Nikolov, S.; Lai, X.; Eberhardt, M. Mathematical modelling in biomedicine: A primer for the curious and the skeptic. Int. J. Mol. Sci. 2021, 22, 547. [Google Scholar] [CrossRef]
  29. Ahrends, R.; Ota, A.; Kovary, K.; Kudo, T.; Ouk Park, B.; Teruel, M. Controlling low rates of cell differentiation through noise and ultrahigh feedback. Science 2014, 344, 1384–1389. [Google Scholar] [CrossRef]
  30. Nikolov, S.; Wolkenhauer, O.; Vera, J.; Nenov, M. The role of cooperativity in a p53-miR34 dynamical mathematical model. J. Theor. Biol. 2020, 495, 110252. [Google Scholar] [CrossRef]
  31. Poincaré, H. Les Méthodes Nouvelles de la Mécanique Céleste; Gauthier-Villars: Paris, France, 1892; Tome I. (In French) [Google Scholar]
  32. Hopf, E. Abzweigung Einer Periodischen Lösung von Einer Stationären Lösung Eines Differential Systems. Ber. Math.-Phys. Kl Sächs. Akad. Wiss. Leipz. 1942, 94, 1–22. (In German) [Google Scholar]
  33. Andronov, A.; Leontovich, E.; Gordon, I.; Maier, A. Theory of Bifurcations of Dynamic Systems on a Plane; Israel Program for Scientific Translations: Jerusalem, Israel, 1971. [Google Scholar]
  34. Marsden, J.; McCracken, M. The Hopf Bifurcation and Its Applications; Springer: New York, NY, USA, 1976. [Google Scholar]
  35. Hassard, B.; Kazarinoff, N.; Wan, Y.-H. Theory and Applications of Hopf Bifurcation; London Mathematical Society Lecture Note Series; Cambridge University Press: New York, NY, USA, 1981; Volume 41. [Google Scholar]
  36. Minorsky, N. Nonlinear Oscillations; Van Nostrand: Princeton, NJ, USA, 1962. [Google Scholar]
  37. Kuznetsov, Y. Elements of Bifurcation Theory, 3rd ed.; Applied Mathematical Sciences; Springer: New York, NY, USA, 2004. [Google Scholar]
  38. Bautin, N. Behaviour of Dynamical Systems Near the Boundary of Stability; Nauka: Moscow, Russia, 1984. (In Russian) [Google Scholar]
  39. Leonov, G.; Kuznetsova, O. Lyapunov quantities and limit cycles of two-dimensional dynamical systems. Analytical methods and symbolic computation. Regul. Chaotic Dyn. 2010, 15, 354–377. [Google Scholar] [CrossRef]
  40. Nikolov, S.; Vassilev, V. Assessing the non-linear dynamics of a Hopf-Langford type system. Mathematics 2021, 9, 2340. [Google Scholar] [CrossRef]
  41. Artés, J.; Llibre, J.; Schlomiuk, D. The Geometry of quadratic differential systems with a weak focus of second order. Int. J. Bifurc. Chaos Appl. Sci. Engrg. 2006, 16, 3127–3194. [Google Scholar] [CrossRef]
  42. Leonov, G.; Kuznetsov, N.; Kudryashova, E. Cycles of two-dimensional systems: Computer calculations, proofs, and experiments. Vestn. St. Petersburg Univ. Math. 2008, 41, 216–250. [Google Scholar] [CrossRef]
  43. Llibre, J.; Novaes, D.; Teixeira, M. Maximum number of limit cycles for certain piecewise linear dynamical systems. Nonlinear Dyn. 2015, 82, 1159–1175. [Google Scholar] [CrossRef]
  44. Goldbeter, A. Computational approaches to cellular rhythms. Nature 2002, 420, 238–245. [Google Scholar] [CrossRef]
  45. Goldbeter, A. Dissipative structures in biological systems: Bistability, oscillations, spatial patterns and waves. Philos. Trans. R. Soc. Math. Phys. Eng. Sci. 2018, 376, 20170376. [Google Scholar] [CrossRef]
  46. Tyson, J.; Novak, B. A dynamical paradigm for molecular cell biology. Trends Cell Biol. 2020, 30, 504–515. [Google Scholar] [CrossRef]
  47. Goldbeter, A.; Lefever, R. Dissipative structures for an allosteric model: Application to glycolytic oscillations. Biophys. J. 1972, 12, 1302–1315. [Google Scholar] [CrossRef]
  48. Goldbeter, A.; Nicolis, G. An allosteric enzyme model with positive feedback applied to glycolytic oscillations. Prog. Theor. Biol. 1976, 4, 65–160. [Google Scholar]
  49. Goldbeter, A.; Dupont, G. Allosteric regulation, cooperativity, and biochemical oscillations. Biophys. Chem. 1990, 37, 341–353. [Google Scholar] [CrossRef]
  50. Decroly, O.; Goldbeter, A. Birhythmicity, chaos, and other patterns of temporal self-organization in a multiply regulated biochemical system. Proc. Natl. Acad. Sci. USA 1982, 79, 6917–6921. [Google Scholar] [CrossRef]
  51. Segel, L.; Goldbeter, A. Scaling in biochemical kinetics: Dissection of a relaxation oscillator. J. Math. Biol. 1994, 32, 147–160. [Google Scholar] [CrossRef]
  52. Goldbeter, A. Oscillatory enzyme reactions and Michaelis-Menten kinetics. FEBS Lett. 2013, 587, 2778–2784. [Google Scholar] [CrossRef] [PubMed]
  53. Koshland, D.; Hamadani, K. Proteomics and models for enzyme cooperativity. J. Biol. Chem. 2002, 277, 46841–46844. [Google Scholar] [CrossRef] [PubMed]
  54. Seydoux, F.; Malhotra, O.; Bernhard, S.; Stark, G. Half-site reactivity. CRC Crit. Rev. Biochem. 1974, 2, 227–257. [Google Scholar] [CrossRef]
  55. Levitzki, A.; Koshland Jr, D. The role of negative cooperativity and half-of-the-sites reactivity in enzyme regulation. In Current Topics in Cellular Regulation; Academic Press: Cambridge, MA, USA, 1976; Volume 10, pp. 1–40. [Google Scholar]
  56. Koshland, D.E., Jr. The structural basis of negative cooperativity: Receptors and enzymes. Curr. Opin. Struct. Biol. 1996, 6, 757–761. [Google Scholar] [CrossRef]
  57. Seifert, F.; Golbik, R.; Brauer, J.; Lilie, J.; Schröder-Tittmann, K.; Hinze, E.; Korotchkina, L.; Patel, M.S.; Tittmann, K. Direct kinetic evidence for half-of-the-sites reactivity in the E1 component of the human pyruvate dehydrogenase multienzyme complex through alternating sites cofactor activation. Biochemistry 2006, 45, 12775–12785. [Google Scholar] [CrossRef]
  58. Bush, E.C.; Clark, A.E.; DeBoever, C.M.; Haynes, L.E.; Hussain, S.; Ma, S.; McDermott, M.M.; Novak, A.M.; Wentworth, J.S. Modeling the role of negative cooperativity in metabolic regulation and homeostasis. PLoS ONE 2012, 7, e48920. [Google Scholar] [CrossRef]
  59. Ha, S.; Ferrell Jr., J. Thresholds and ultrasensitivity from negative cooperativity. Science 2016, 352, 990–993. [Google Scholar] [CrossRef]
  60. Morán, F.; Goldbeter, A. Onset of birhthmicity in a regulated biochemical system. Biophys. Chem. 1984, 20, 149–156. [Google Scholar] [CrossRef]
  61. Cui, Q.; Karplus, M. Allostery and cooperativity revisited. Protein Sci. 2008, 17, 1295–1307. [Google Scholar] [CrossRef]
  62. Kister, J.; Poyart, C.; Edestein, S. Oxygen-organophosphate linkage in hemoglobin A. The double-hump effect. Biophys. J. 1987, 52, 527–535. [Google Scholar] [CrossRef] [PubMed]
  63. Moltagh, H.; Wrabi, J.; Li, J.; Hilser, V. The ensemble nature of allostery. Nature 2014, 508, 331–339. [Google Scholar]
  64. Connors, K. Chemical Kinetics. The Study of Reaction Rates in Solution; VCH Publishers, Inc.: New York, NY, USA, 1990. [Google Scholar]
  65. Monod, J.; Wyman, J.; Changeux, J. On the nature of allosteric transitions: A plausible model. J. Mol. Biol. 1965, 12, 88–118. [Google Scholar] [CrossRef] [PubMed]
  66. Semenov, S.N.; Kraft, L.J.; Ainla, A.; Zhao, M.; Baghbanzadeh, M.; Campbell, V.E.; Kang, K.; Fox, J.M.; Whitesides, G.M. Autocatalytic, bistable, oscillatory networks of biologically relevant organic reactions. Nature 2016, 537, 656–660. [Google Scholar] [CrossRef]
  67. Parks, P.; Hahn, V. Stability Theory; Prentice Hall: New York, NY, USA, 1993. [Google Scholar]
  68. Lancaster, P. Theory of Matrices with Applications; Academic Press: Orlando, FL, USA, 1985. [Google Scholar]
  69. Bautin, N.; Leontovich, E. Methods and Approaches for Investigation of Two Dimensional Dynamical Systems; Nauka: Moscow, Russia, 1976. (In Russian) [Google Scholar]
  70. Andronov, A.; Pontryagin, L. Systems grossieres. Dokladi Academii Nauk USSR 1937, 14, 247–251. [Google Scholar]
  71. Leontovich, E.; Mayer, A. On trajectories which definite the qualitative separation of sphere of trajectories. Dokladi Academii Nauk USSR 1937, 14, 251–254. [Google Scholar]
  72. Nikolov, S.; Yankulova, E.; Wolkenhauer, O.; Petrov, V. Principal difference between stability and structural stability (robustness) as used in systems biology. Nonlinear Dyn. Psychol. Life Sci. 2007, 11, 413–433. [Google Scholar]
  73. Olsman, N.; Goentoro, L. Allosteric proteins as logarithmic sensors. Proc. Natl. Acad. Sci. USA 2016, 113, E4423–E4430. [Google Scholar] [CrossRef]
Figure 1. Scheme of a model of enzyme (E) reaction with positive feedback and recycling of product (p) into substrate (s). (Adapted from [13]). See the text for details as well as the notation.
Mathematics 13 00260 g001
Figure 2. Stable solution of system (2) when: v = 0.4 ,   σ = 10 3 ,   γ = 0.025 ,   α = 7.5 × 10 6 ,   k s = 0.109 ,   β = 1 ,   K = 1 , and g = 0 . Here, R = 0.014.
Mathematics 13 00260 g002
Figure 3. Sustained oscillations (a,b) and phase portrait (c) of system (2) when: v = 0.35 ,   σ = 10 3 ,   γ = 0.025 ,   α = 7.5 × 10 6 , k s = 0.109 ,   β = 1 ,   K = 1 , and g = 0 . Here, R = −0.0047. Notation: red point is equilibrium state E ¯ s ¯ = 11.9 ,   p ¯ = 3.21 .
Mathematics 13 00260 g003
Figure 4. Period-one (stable limit cycle) oscillations of system (2) (a,b) and phase portrait (c) when: v = 4 ,   σ = 10 4 ,   γ = 0.012 ,   α = 7.5 × 10 6 , k s = 2.78 ,   β = 10 ,   K = 1 , and g = 0 . Here, R = −0.1625. Notation: red point is equilibrium state E ¯ s ¯ = 3.1 ,   p ¯ = 14.39 .
Mathematics 13 00260 g004
Figure 5. Sustained oscillations of system (2) (a) and (b) and phase portrait (c) of system (2) when: v = 4 ,   σ = 10 3 ,   γ = 0.012 ,   α = 7.5 × 10 6 , k s = 2.78 ,   β = 1 ,   K = 1 , and g = 0 . Here, R = −0.42. Notation: red point is equilibrium state E ¯ s ¯ = 70.72 ,   p ¯ = 1.44 .
Mathematics 13 00260 g005
Figure 6. Bifurcation diagram in k s ,   v direction, when γ = 0.01 ,   σ = 10 3 ,   α = 7.5 × 10 6 ,   β = 1 ,   K = 1 , and L 1 = 0 . Notations: R = 0 —boundary of stability for Andronov–Hopf bifurcation; S—stable zone; U—unstable zone; solid line—boundary of stability is “safe” ( L 2 < 0 ) and the external limit cycle is stable; dashed line—boundary of stability is “dangerous” ( L 2 > 0 ) and the external limit cycle is unstable; stars—the second Lyapunov coefficient L 2 is zero.
Mathematics 13 00260 g006
Figure 7. Stable solution of system (2) when: v = 4 ,   σ = 10 4 ,   γ = 0.012 ,   α = 7.5 × 10 6 ,   k s = 2.5 , β = 10 ,   K = 1 , and g = 0 . Here, R = 0.2943.
Mathematics 13 00260 g007
Figure 8. Bifurcation diagrams: (a) in γ ,   ν directions, when σ = 10 3 ,   α = 7.5 × 10 6 ,   k s = 0.109 ,   β = 1 ,   K = 1 , and g = 0 ; (b) in k s ,   v directions, when γ = 0.012 ,   σ = 10 4 ,   α = 7.5 × 10 6 ,   β = 10 ,   K = 1 . Notations: R = 0 —boundary of stability for Andronov–Hopf bifurcation; S—stable zone; U—unstable zone.
Mathematics 13 00260 g008
Table 1. Results for bifurcation values (i.e., for R = 0 ) of the parameters v ,   k s , and second Lyapunov coefficient L 2 , when first Lyapunov coefficient L 1 is equal to zero (. ×   10 9 ) and γ = 0.01 ,   σ = 10 3 ,   α = 7.5 × 10 6 ,   β = 1 ,   K = 1 .
v   [ s 1 ] k s   [ s 1 ] L 2   . × 10 3
0.2480.20
0.3560.30
0.460.40.13
0.6750.60.31
0.8830.80.55
1.0904810.8
1.19381.10.93
1.29691.21
1.603981.51.2
2.113520.33
2.41682.3−1.3
2.6182.5−3.1
2.81892.7−5.6
Table 2. Results for bifurcation values (i.e., for R = 0 ) of the parameters v ,   k s and second Lyapunov coefficient L 2 when first Lyapunov coefficient L 1 is equal to zero (. ×   10 9 ) and γ = 0.012 ,   σ = 10 4 ,   α = 7.5 × 10 6 ,   β = 10 ,   K = 1 .
v   s 1 k s   s 1 L 2
32.1763−6.31
3.52.43109−8.71
4.02.676−11.51
4.12.72419−12.12
4.52.9131−14.71
53.143−18.31
Disclaimer/Publisher’s Note: The statements, opinions and data contained in all publications are solely those of the individual author(s) and contributor(s) and not of MDPI and/or the editor(s). MDPI and/or the editor(s) disclaim responsibility for any injury to people or property resulting from any ideas, methods, instructions or products referred to in the content.