Article

Analytical Solution for Steady-State Seepage Field of Foundation Pit During Water Curtain Leakage

School of Civil Engineering, Central South University, Changsha 410075, China
*
Author to whom correspondence should be addressed.
Mathematics 2025, 13(2), 203; https://doi.org/10.3390/math13020203
Submission received: 19 December 2024 / Revised: 8 January 2025 / Accepted: 8 January 2025 / Published: 9 January 2025

Abstract

:
In recent years, with the increasing difficulty of foundation pit projects, the frequency of leakage accidents has also increased. In order to ensure that the excavation of foundation pits is carried out smoothly, water-stop curtains are generally used to protect the foundation pit. Once leakage occurs in the water-stop curtain, it will inevitably delay the schedule, cause significant harm, and even jeopardize life. Therefore, this paper analyses and investigates the two-steady-state seepage field of the foundation pit when the permeable anisotropic soil layer suspends the leakage of the water curtain. To calculate head distribution solutions, the soil layer surrounding the curtain was divided into five regular regions, and the superposition method and method of separating variables were used. These results were then combined with the continuity conditions between the regions to obtain the explicit analytical solutions of the seepage flow field around the pit. Calculations were compared using finite element software and other references, and the results were in good agreement, verifying the correctness of the analytical solution. Parameter analysis showed that the location and width of vertical leakage cracks have limited influence on the head distribution of the foundation pit and water pressure around the water curtain, but significant influence on the seepage flow at the leakage location.

1. Introduction

As the depth of pit excavations has increased in recent years [1,2,3], the complexity and risks associated with the work have also grown [4], leading to a higher frequency of pit leakage incidents. According to statistics, about 54 per cent of pit leakage accidents are caused by ineffective precipitation, and about 31 percent of pit leakage accidents are caused by cracked joints [5]. Pujades et al. [6,7] proposes that when the pit is descended, the water-stop curtain changes the natural groundwater seepage field to stop the water flow. Therefore, to ensure the smooth excavation of the foundation pit, rotary piles, mixing pile walls, diaphragm walls, etc., are generally used as water-stopping curtains [8]. Once the leakage of a water-stop curtain occurs, this will inevitably delay the construction period and cause major hazards such as surface settlement, ground collapse, building tilt, pipeline rupture, and so on [9,10,11], endangering lives [12,13,14]. Therefore, it is important to study the seepage field of the pit during the leakage of the water curtain.
Because the leakage of the water curtain will make the groundwater level inside and outside the pit show discontinuous changes, the existing related research mostly adopts a numerical method. The numerical methods mainly include a two-step calculation method, a partially coupled method, and a fully coupled method. Among them, the two-step calculation method is used to calculate the change in groundwater head according to the seepage model, and then calculate the soil deformation according to the groundwater head [15]. The partially coupled method couples the groundwater model with the subsidence model using some parameters. The fully coupled method, on the other hand, is developed on the basis of Biot consolidation theory [16]. Gambolati et al. [17] used this method to analyse the soil settlement in Italy. Vilarrasa et al. [18] used the finite element method to establish a model with which to analyse the relationship between the depth of water level drop and time at different degrees of seepage of the water-stop curtain, but its disadvantage was that it was only applicable to cases where the water-stop curtain completely isolated the aquifer. Wu et al. [19] developed a three-dimensional fluid–solid-coupled finite element model to analyse the effect of seepage from the diaphragm below the excavation surface. Xu et al. [20] used the numerical method to simulate the leakage of the water-stop curtain and used the “longitudinal translation concentration method” to analyse the leakage of the water-stop curtain. However, due to the different depth defects caused by the leakage of different flow fields, the simulation results of this method and the actual engineering were quite different. Qiu et al. [21] studied the surface settlement behind the wall, the lateral displacement of the pit-retaining wall, and the change in the internal force of the perimeter pile wall before and after the leakage of the water-stop curtain by setting up a finite element model, but it did not enable a quantitative expression of the leakage situation of the pit, and the location and size of the pit leakage were assumed. Guo et al. [22] used numerical simulation to investigate the leakage detection method of pit stop curtains based on the change in the water level outside the pit. Pang and Cui [23] used the finite element software ABAQUS (latest v. 2024) to study the relationship between the size and depth of different defects in the water-stop curtain and the distribution law of the seepage field on the outside of the curtain, which proved the feasibility of judging the existence and size of the defects and their location based on the change in the flow velocity, but did not give any specific discriminating indexes and guidelines. Taylor and Huyakorn [24] formulated and solved a system of transient three-dimensional groundwater non-linear equations by using the finite element method and Galerkin’s weighted residual technique, and analysed the steady-state concentration and hydraulic head distribution during pit leakage. Wu et al. [25] carried out a numerical study on the leakage behaviour of impermeable walls, induced by precipitation in the gravel strata of a deep foundation pit, and analysed the leakage of impermeable walls in gravel. Zeng et al. [26] used the finite element software ABAQUS to establish a three-dimensional finite element model to study the force and deformation characteristics of the neighbouring group of piles under different pumping conditions and the load transfer law. Xue et al. [27] used the finite element software ABAQUS to establish a model with which to study the influence of the barrier effect of the neighbouring underground structure on the deformation of the pit triggered by pit pumping and precipitation. However, due to the lack of optimisation theory, there is still room for the optimisation of precipitation design. Zeng et al. [28] carried out a three-dimensional numerical analysis of the blocking effect of the underground structure immediately outside the pit on soil movement and studied the influence of the different burial depths of the adjacent underground structure on the deformation of the pit, triggered by pre-excavation dewatering. However, due to the lack of optimisation theoretical guidance, the dewatering design still had room for optimization. The studies mentioned above rely on numerical methods, specifically finite element analysis. This method is commonly used to solve seepage issues in pits, but it has some drawbacks. The pre-processing and modelling stages can be time-consuming, and any changes in dimensional parameters require the mesh to be updated. Additionally, engineers may find it challenging to solve problems directly using numerical analysis in the field. Alternatively, the analytical method used in this paper offers several advantages. It eliminates the need for complicated modelling, is more efficient, and allows for the direct expression of influencing factors through function expressions.
There have been limited studies analysing how water curtains affect seepage fields. Wu et al. [29] conducted analytical computational studies on this topic. Yu et al. [30] analysed the effects of uniform and local leakage from a water-stop curtain during water pumping in a long pit. They provided a two-dimensional analytical solution for the problem after pumping reached stability. However, this solution only applies to situations where the water-stop curtain completely isolates the aquifer. Yu et al. [30] analysed and studied the two-dimensional steady-state seepage field of foundation in permeable isotropic soils, considering the thickness of the retaining wall, and verified the comparison using PLAXIS(2D 2021) software. However, this study did not consider water curtain seepage.
In this paper, a display-analysed solution for solving the leakage problem of suspended curtains in permeable anisotropic soils is presented. The solution analyses the entire seepage field and calculates the water pressure at any given point. This provides researchers with a convenient tool with which to study the seepage law of groundwater, in comparison to other analytical methods mentioned earlier. In this research paper, we divided the seepage field near the pit into five different regions. By using the separation of variables and superposition methods, we were able to obtain an analytical solution for the two-dimensional steady-state seepage in the pit. This was performed while the water curtain leakage was suspended from the permeable anisotropic soil layer. We then compared our analytical solution to results obtained from finite element software and other references to ensure accuracy. Lastly, we analysed the impact of the vertical leakage crack’s width and location on the head distribution around the pit, water pressure on the curtain, and seepage flow at the leakage.

2. Two-Dimensional Steady-State Seepage Modelling of Pits During Water Curtain Leakage

When the length of the pit is much larger than the width, the cross-sectional seepage field perpendicular to the length can be equated to a two-dimensional seepage [31]. Based on the symmetry of pit seepage, half of the cross-section was used for the study [32], as shown in Figure 1.
If we assume that the soil layer above the impermeable layer is uniform, the seepage of the soil is not equal in all directions, the stop curtain is waterproof, and the left side of the curtain is infinite and continuously replenished with water, we can approximate the boundary “EF” as an impermeable boundary [32]. Additionally, due to the symmetry of the pit, the right boundary of the model “GH” can also be considered impermeable. The top water level in the left region of the model is h1, and the water level at the bottom of the pit to the right of the stop curtain is h2. The water level at the leak is h3, and the width of the region to the left of the stop curtain is b. The pit half-width is c, and the width of the leakage crack is d2. The distance from the bottom of the stop curtain to the top of the impermeable layer is a.
In analysing and solving the seepage field around the pit, the separation of variables method cannot be used due to leaks and inconsistencies in the water curtain’s upper and lower boundary conditions. Instead, the sub-region method [32] is utilized. This method involves dividing the region into multiple regions, as illustrated in Figure 1. The water-stop curtain is represented by AD, while BC signifies the leak, and DO is the permeable boundary. Since the stop curtain and the portion of ADO below are not continuous, the region on the left side of the model is divided into two regions with continuous boundary conditions, namely, region ③ and region ④. Similarly, the region on the right side of the water-stop curtain is divided into region ④ and region ⑤. Due to the seepage in the water-stop curtain, the region on the left side of the model is further partitioned into three regions, namely, ①, ②, and ③.
Assuming that seepage in the soil around the pit complies with Darcy’s law, the seepage in the five zones satisfies the equation:
k h 2 H i x 2 + k v 2 H i z 2 = 0 ; i = 1 , 2 , 3 , 4 , 5
The total head of region ①, region ②, region ③, region ④, and region ⑤ is expressed as H1, H2, H3, H4, and H5, respectively. kv is the vertical hydraulic conductivity and kh is the horizontal hydraulic conductivity.
Based on the continuity conditions between the zones and the boundary conditions of the pit, the following boundary conditions can be derived for each zone:
Boundary conditions in region ①: upper boundary (z = h1), H1 = h1; left boundary (x = −b), H 1 / x = 0 ; right boundary (x = 0), H 1 / x = 0 .
Boundary conditions in region ②: left boundary (x = −b), H 2 / x = 0 ; right boundary (x = 0), H 3 = a + d 1 + d 2 / 2 .
Boundary conditions in region ③: left boundary (x = −b), H 3 / x = 0 ; right boundary (x = 0), H 3 / x = 0 .
Boundary conditions in region ④: lower boundary (z = 0), H 4 / z = 0 ; left boundary (x = −b), H 4 / x = 0 ; right boundary (x = c), H 4 / x = 0 .
Boundary conditions in region ⑤: upper boundary (z = h2), H5 = h2; right boundary (x = c), H 5 / x = 0 ; left boundary (x = 0), H 5 / x = 0 .
The continuity conditions for region ① and region ② are as follows:
H 1 | z = a + d 1 + d 2 = H 2 | z = a + d 1 + d 2 , b x < 0 H 1 z | z = a + d 1 + d 2 = H 2 z | z = a + d 1 + d 2 , b x < 0
The continuity conditions for region ② and region ③ are as follows:
H 2 | z = a + d 1 = H 3 | z = a + d 1 , b x < 0 H 2 z | z = a + d 1 = H 3 z | z = a + d 1 , b x < 0
The continuity conditions for region ④ and region ③ are as follows:
H 4 | z = a = H 3 | z = a , b x < 0 H 4 z | z = a = H 3 z | z = a , b x < 0
The continuity conditions for region ④ and region ⑤ are as follows:
H 4 | z = a = H 5 | z = a , 0 x < c H 4 z | z = a = H 5 z | z = a , 0 x < c

3. Model Solution

3.1. Separation of Variables Method for Solving the Seepage Field

Equation (1) can be collated as follows:
2 H i x 2 + α 2 H i z 2 = 0 ; i = 1 , 2 , 3 , 4 , 5
In the formula, α = kv/kh.
The seepage control Equation (6) in the x y coordinate system is transformed into the seepage control Equation (7) in the u v coordinates by the coordinate transformation u = x v = z / α , which facilitates the application of the separated variable method for following solution:
2 H i u 2 + 2 H i v 2 = 0 ; i = 1 , 2 , 3 , 4 , 5
Based on the boundary conditions of each region after the coordinate transformation, the total head of region ①, region ②, region ③, region ④, and region ⑤ can be written in the form of a level sum by using the method of separating variables and the superposition method.
The left and right boundaries of region ① are impermeable, i.e., H 1 / x = 0 , using the superposition method the boundary conditions of region ① can be written as follows:
Φ 1 = Φ 1 1 + Φ 1 2
Φ 1 1 indicates that the head at the upper boundary of region ① is h1, the lower boundary is impervious, and the left and right boundaries are also impervious; Φ 1 2 indicates that the head at the upper boundary of region ① is 0, and that the left and right boundaries are impervious boundaries.
For the boundary condition, the head expression can be solved using the separated variable method:
H 1 1 ( u , v ) = h 1
For the boundary condition, the head expression can be solved using the separated variable method:
H 1 2 ( u , v ) = A 10 ( v h 1 α ) + n = 1 A n sinh k n ( v h 1 α ) cos k n u
Then, according to the superposition method, the total head solution of region ① can be expressed as the sum of Equations (9) and (10):
H 1 ( u , v ) = h 1 + A 10 ( v h 1 α ) + n = 1 A n sinh k n ( v h 1 α ) cos k n u
where A10 and An are the parameters to be solved in the head solution, kn = /b, n = 1, 2, 3….
The left boundary of region ② is the impermeable boundary, i.e., H 2 / x = 0 , the superposition method is used to write the boundary conditions of region ② as follows:
Φ 2 = Φ 2 1 + Φ 2 2 + Φ 2 3
Φ 2 1 denotes region ②. The left boundary is the impermeable boundary, the upper boundary is an impervious boundary, and the right boundary head is 0; Φ 2 2 denotes the region ②. The left boundary is the impermeable boundary, and the right boundary head is 0. The lower boundary is impermeable; Φ 2 3 indicates that the head at the right boundary of region ② is constant. It is impermeable at the left border and the upper and lower borders.
For the boundary condition Φ 2 1 , established by the separated variable method, the head expression can be written as follows:
H 2 1 ( u , v ) = s = 1 B 1 s cosh k s ( v a + d 1 + d 2 α )
For the boundary condition Φ 2 2 , established by the separated variable method, the head expression can be written as follows:
H 2 2 ( u , v ) = s = 1 B 2 s cosh k s ( v a + d 1 α ) sin k s x
For the boundary condition Φ 2 3 , established by the separated variable method, the head expression can be written as follows:
H 2 3 ( u , v ) = a + d 1 + d 2 2
Then, the total head solution for region ② can be obtained via the superposition method by adding Equations (13)–(15) and integrating the constant term as follows:
H 2 ( u , v ) = s = 1 [ B 1 s cosh k s ( v a + d 1 + d 2 α ) + B 2 s cosh k s ( v a + d 1 α ) ] sin k s u + a + d 1 + d 2 2
where B1s and B2s are the parameters to be found in the head solution, ks = (2s−1)π/2b, s = 1, 2, 3….
Similarly, the total head solution for region ③, region ④, and region ⑤ is expressed as follows:
H 3 ( u , v ) = C 10 v + C 20 + n = 1 [ C 1 n sinh k n ( v a α ) + C 2 n cosh k n ( v a + d 1 α ) ] cos k n u
where C10, C20, C1n, and C2n are the parameters to be found in the head solution, kn = nπ/b, n = 1, 2, 3….
H 4 ( u , v ) = D 10 + i = 1 D i cosh k i v cos k i ( u + b )
where D10 and Di are the parameters to be solved in the head solution, ki = iπ/(b + c), i = 1, 2, 3….
H 5 ( u , v ) = h 2 + E 10 ( v h 2 α ) + m = 1 E m sinh k m ( v h 2 α ) cos k m u
where E10 and Em are the parameters to be solved in the head solution, km = /c, m = 1, 2, 3….
Working according to the continuous conditions of region ① and region ②, Equation (2) can be obtained as follows:
d 2 2 + d 3 d 3 α A 10 n = 1 A n sinh k n d 3 α cos k n u = s = 1 ( B 1 s + B 2 s cosh k s d 2 α ) sin k s u
A 10 + n = 1 A n k n cosh k n d 3 α cos k n u = s = 1 B 2 s k s sinh k s d 2 α sin k s u
The following can be obtained according to the continuous-condition Equation (3) for region ② and region ③:
s = 1 ( B 1 s cosh k s d 2 α + B 2 s ) sin k s u + a + d 1 + d 2 2 = C 10 ( a + d 1 α ) + C 20 + n = 1 ( C 1 n sinh k n d 1 α + C 2 n ) cos k n u
s = 1 B 1 s k s sinh k s d 2 α sin k s u = C 10 + n = 1 C 1 n k n cosh k n d 1 α cos k n u
The following can be obtained from the continuous-condition Equation (4) for regions ③ and ④:
D 10 + i = 1 D i cosh k i a α cos k i ( u + b ) = C 10 a α + C 20 + n = 1 C 2 n cosh k n d 1 α cos k n u
i = 1 D i k i sinh k i a α cos k i ( u + b ) = C 10 + n = 1 ( C 1 n k n C 2 n k n sinh k n d 1 α ) cos k n u
According to the continuous-condition Equation (5) for region ④ and region ⑤, we can obtain the following:
D 10 + i = 1 D i cosh k i a α cos k i ( u + b ) = h 2 + E 10 ( a h 2 α ) + m = 1 E m sinh k m ( a h 2 α ) cos k m u
i = 1 D i k i sinh k i a α cos k i ( u + b ) = E 10 + m = 1 E m k m cosh k m ( a h 2 α ) cos k m u
We can determine the constant terms A10, C10, C20, D10, and E10 from the properties of the Fourier series according to Equations (21), (22) and (24)–(26):
A 10 b = s = 1 B 2 s sinh k s d 2 α
C 10 b = i = 1 D i sinh k i a α sin k i b
C 20 + ( a + d 1 α ) C 10 a d 1 d 2 2 = 1 k s b s = 1 ( B 1 s cosh k s d 2 α + B 2 s )
D 10 ( c + b ) = C 10 a α b + C 20 b + h 2 α c + E 10 ( a h 2 α ) c
E 10 c = C 10 b
If we multiply each side of Equations (20)–(27) by sinksx, cosknx, cosknx, sinksx, coski(x + b), cosknx, coski(x + b), and coskmx, and each integrates separately in the interval [−b, 0], [−b, 0], [−b, 0], [−b, 0], [−b, 0], [−b, 0], [0, c / a ], and [0, c / a ], then the following emerges:
1 k s ( d 2 2 + d 3 ) + A 10 d 3 α 1 k s n = 1 A n sinh k n d 3 α k s k n 2 k s 2 b 2 ( B 1 s + B 2 s cosh k s d 2 α ) = 0                                             ( k n k s ) 1 k s ( d 2 2 + d 3 ) + A 10 d 3 α 1 k s + n = 1 A n sinh k n d 3 α ( sin k n b ) 2 2 k n b 2 ( B 1 s + B 2 s cosh k s d 2 α ) = 0                                             ( k n = k s )
A n k n cosh k n d 3 α b 2 s = 1 B 2 s k s sinh k s d 2 α k s k n 2 k s 2 = 0 ( k n k s ) A n k n cosh k n d 3 α b 2 + s = 1 B 2 s k s sinh k s d 2 α ( sin k n b ) 2 2 k n = 0 ( k n = k s )
s = 1 ( B 1 s cosh k s d 2 α + B 2 s ) k s k n 2 k s 2 ( C 1 n sinh k n d 1 α + C 2 n ) b 2 = 0                                                                                       ( k n k s ) s = 1 ( B 1 s cosh k s d 2 α + B 2 s ) ( sin k n b ) 2 k n + ( C 1 n sinh k n d 1 α + C 2 n ) b = 0                                                                                           ( k n = k s )
b 2 B 1 s k s   sinh k s d 2 α C 10 1 k s + n = 1 C 1 n k n cosh k n d 1 α k s k n 2 k s 2 = 0           ( k n k s ) b 2 B 1 s k s   sinh k s d 2 α C 10 1 k s n = 1 C 1 n k n cosh k n d 1 α ( sin k n b ) 2 2 k n = 0       ( k n = k s )
E 10 sin k i b k i ( a h 2 α ) + n = 1 C 2 n cosh k n d 1 α k i k i 2 k n 2 sin k i b h 2 sin k i b k i n = 1 E m sinh k m ( a h 2 α ) ( k i k i 2 k m 2 sin k i b ) b + c 2 D i cosh k i a α + 1 k i ( C 20 + C 10 a α ) sin k i b = 0           ( k i k n ) E 10 sin k i b k i ( a h 2 α ) + n = 1 C 2 n cosh k n d 1 α sin k n b + k n b cos k n b 2 k n h 2 sin k i b k i n = 1 E m sinh k m ( a h 2 α ) ( k i k i 2 k m 2 sin k i b ) b + c 2 D i cosh k i a α + 1 k i ( C 20 + C 10 a α ) sin k i b = 0           ( k i = k n )
i = 1 D i k i sinh k i a α sin k i b k i k i 2 k n 2 ( C 1 n k n C 2 n k n sinh k n d 1 α ) b 2 = 0                                           ( k i k n ) i = 1 D i k i sinh k i a α sin k n b + k n b cos k n b 2 k n ( C 1 n k n C 2 n k n sinh k n d 1 α ) b 2 = 0                                           ( k i = k n )
c 2 E m k m cosh k m ( a h 2 α ) + i = 1 D i ( k i 2 k i 2 k m 2 ) sinh k i a α sin k i b = 0 ( k i k m ) c 2 E m k m cosh k m ( a h 2 α ) i = 1 D i [ 2 k i c cos k i b + sin ( 2 k i c + k i b ) sin k i b ] sinh k i a α = 0                                                                  ( k i = k m )
To determine the parameters mentioned above, the formula requires an infinite number of steps. However, to find the unknown, only the first N terms of each level can be used, and the infinite steps must be truncated. By utilizing the software MATLAB(R2023a) and the coupling Formulas (28)–(39), the matrix can be solved to obtain values for A10, C10, C20, D10, E10, An, B1s, B2s, C1n, C2n, Di, and Em. This will allow for the distribution of the head inside and outside of the pit to be determined.
Equations (11) and (16)–(19) are obtained by coordinate transformation x = u z = v α to obtain the head expressions for the five regions:
H 1 ( u , v ) = h 1 + A 10 ( z h 1 α ) + n = 1 A n sinh k n ( z h 1 α ) cos k n x
H 2 ( u , v ) = s = 1 [ B 1 s cosh k s ( z a d 1 d 2 α ) + B 2 s cosh k s ( z a d 1 α ) ] sin k s x + a + d 1 + d 2 2
H 3 ( u , v ) = C 10 z α + C 20 + n = 1 [ C 1 n sinh k n ( z a α ) + C 2 n cosh k n ( z a d 1 α ) ] cos k n x
H 4 ( u , v ) = D 10 + i = 1 D i cosh k i z α cos k i ( x + b )
H 5 ( u , v ) = h 2 + E 10 ( z h 2 α ) + m = 1 E m sinh k m ( z h 2 α ) cos k m x

3.2. Seepage at Curtain Leaks

Using Darcy’s law, the seepage is expressed as follows:
Q = S v = S k i
The seepage flow per unit width at the water seepage location BC is as follows:
q = a + d 1 a + d 1 + d 2 k i d z
According to Equation (15), the hydraulic gradient I of the BC section at the leakage location can be obtained as follows:
i = s = 1 B 1 s k s cosh k s ( z a d 1 d 2 α ) cos k s x + B 2 s k s cosh k s ( z a d 1 α ) cos k s x
From Equation (40), the seepage flow per unit width at the location of the leakage is obtained as follows:
q = k s = 1 ( B 2 s sinh k s d 2 α + B 1 s sinh k s d 2 α ) cos k s x
where k is the hydraulic conductivity.

4. Analytical Solution Verification and Analysis

4.1. Comparative Validation of Pit Head Calculation Results

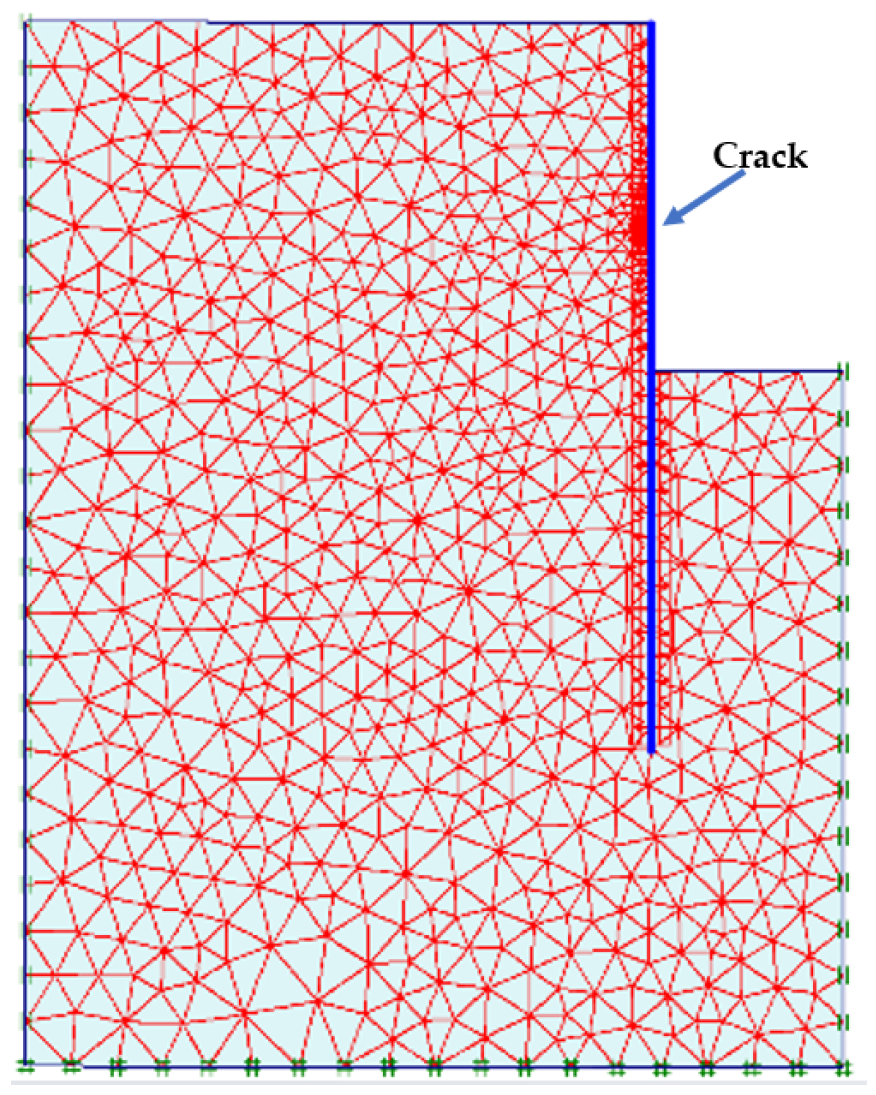
Table 1 displays the selected pit parameters and the comparison between the calculation results of the analytical solution in this paper and the finite element software PLAXIS. PLAXIS software is based on the finite element method (FEM) and is intended for 2-dimensional and 3-dimensional geotechnical analyses of the deformation and stability of soil structures, as well as groundwater flow. They are also used in geo-engineering applications such as excavation, foundations, embankments, and tunnels [33]. The smoothness requirement of the regional contact surface, the accuracy requirement, and the computational efficiency requirement are all taken into account when determining the number of infinite series expansions N. When N ≥ 100, the maximum error in the head of the seepage field is less than 0.95%, meeting the aforementioned requirements. Therefore, the comparative analysis in this paper adopts the calculation results when N = 100. The results can be calculated in seconds on a regular office computer. The PLAXIS model uses a two-dimensional planar model with impermeable boundaries on the right boundary of the model GH, the left boundary of the stop curtain EF, and the bottom of the model. The water level inside the pit is flush with the bottom of the pit, while the water level outside the pit is flush with the top of the stop curtain. The model is divided by a 15-node triangular cell mesh, with a gap left on the stop curtain to simulate the leakage. The mesh around the leakage region is locally encrypted, and the finite element mesh is divided into mesh diagrams as shown in Figure 2.
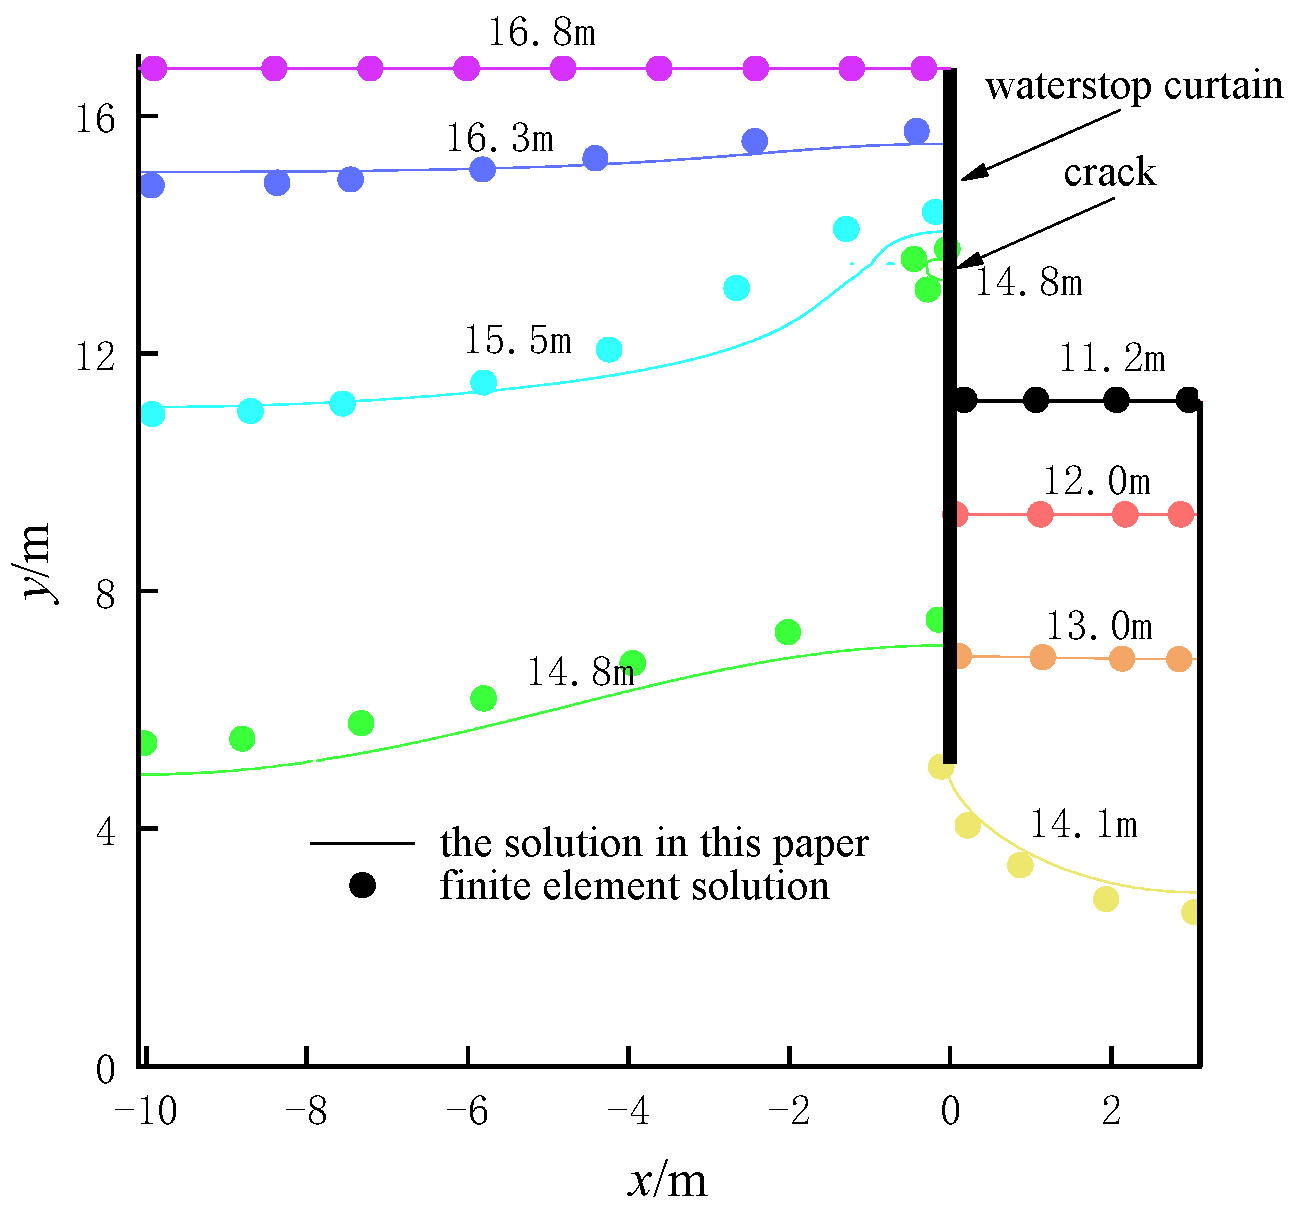
Figure 3 displays that the head calculation outcomes from this research and the finite element software calculations are identical, except for a minor error in the leakage location near the left side of the curtain, away from the baffle plate. Confirming the accuracy of this paper’s solution, the maximum error occurred at x = −1 m and z = 11 m. The head calculation result from this paper was 15.31 m, while the finite element calculation produced a result of 15.17 m, showing a difference of only 0.92 per cent.

4.2. Comparative Validation of Water Pressure Calculation Results

For simplicity, this paper only considers water pressure calculations for two-dimensional steady-state seepage.
According to Bernoulli’s equation, the total head consists of the pressure head, position head, and kinetic energy head. In the case of two-dimensional seepage, the kinetic head is zero, resulting in the following total head expression:
H = z + p ρ g
The expression for water pressure p in terms of head H is given as follows:
p = ρ g ( H z )
According to Equation (10), the head in the left region of the model (x = 0) is as follows:
H 1 ( 0 , z ) = h 1 + A 10 ( z h 1 α ) + n = 1 A n sinh k n ( z h 1 α )
Substituting Equation (51) into Equation (50) yields the water pressure distribution on the left side of the stop curtain (x = 0):
p | x = 0 = [ h 1 + A 10 ( z h 1 α ) + n = 1 A n sinh k n ( z h 1 α ) z ] ρ g
Similarly, the water pressure distribution on the right side of the stop curtain (x = 0) is given as follows:
p | x = 0 = [ h 2 + E 10 ( z h 2 α ) + m = 1 E m sinh k m ( z h 2 α ) z ] ρ g
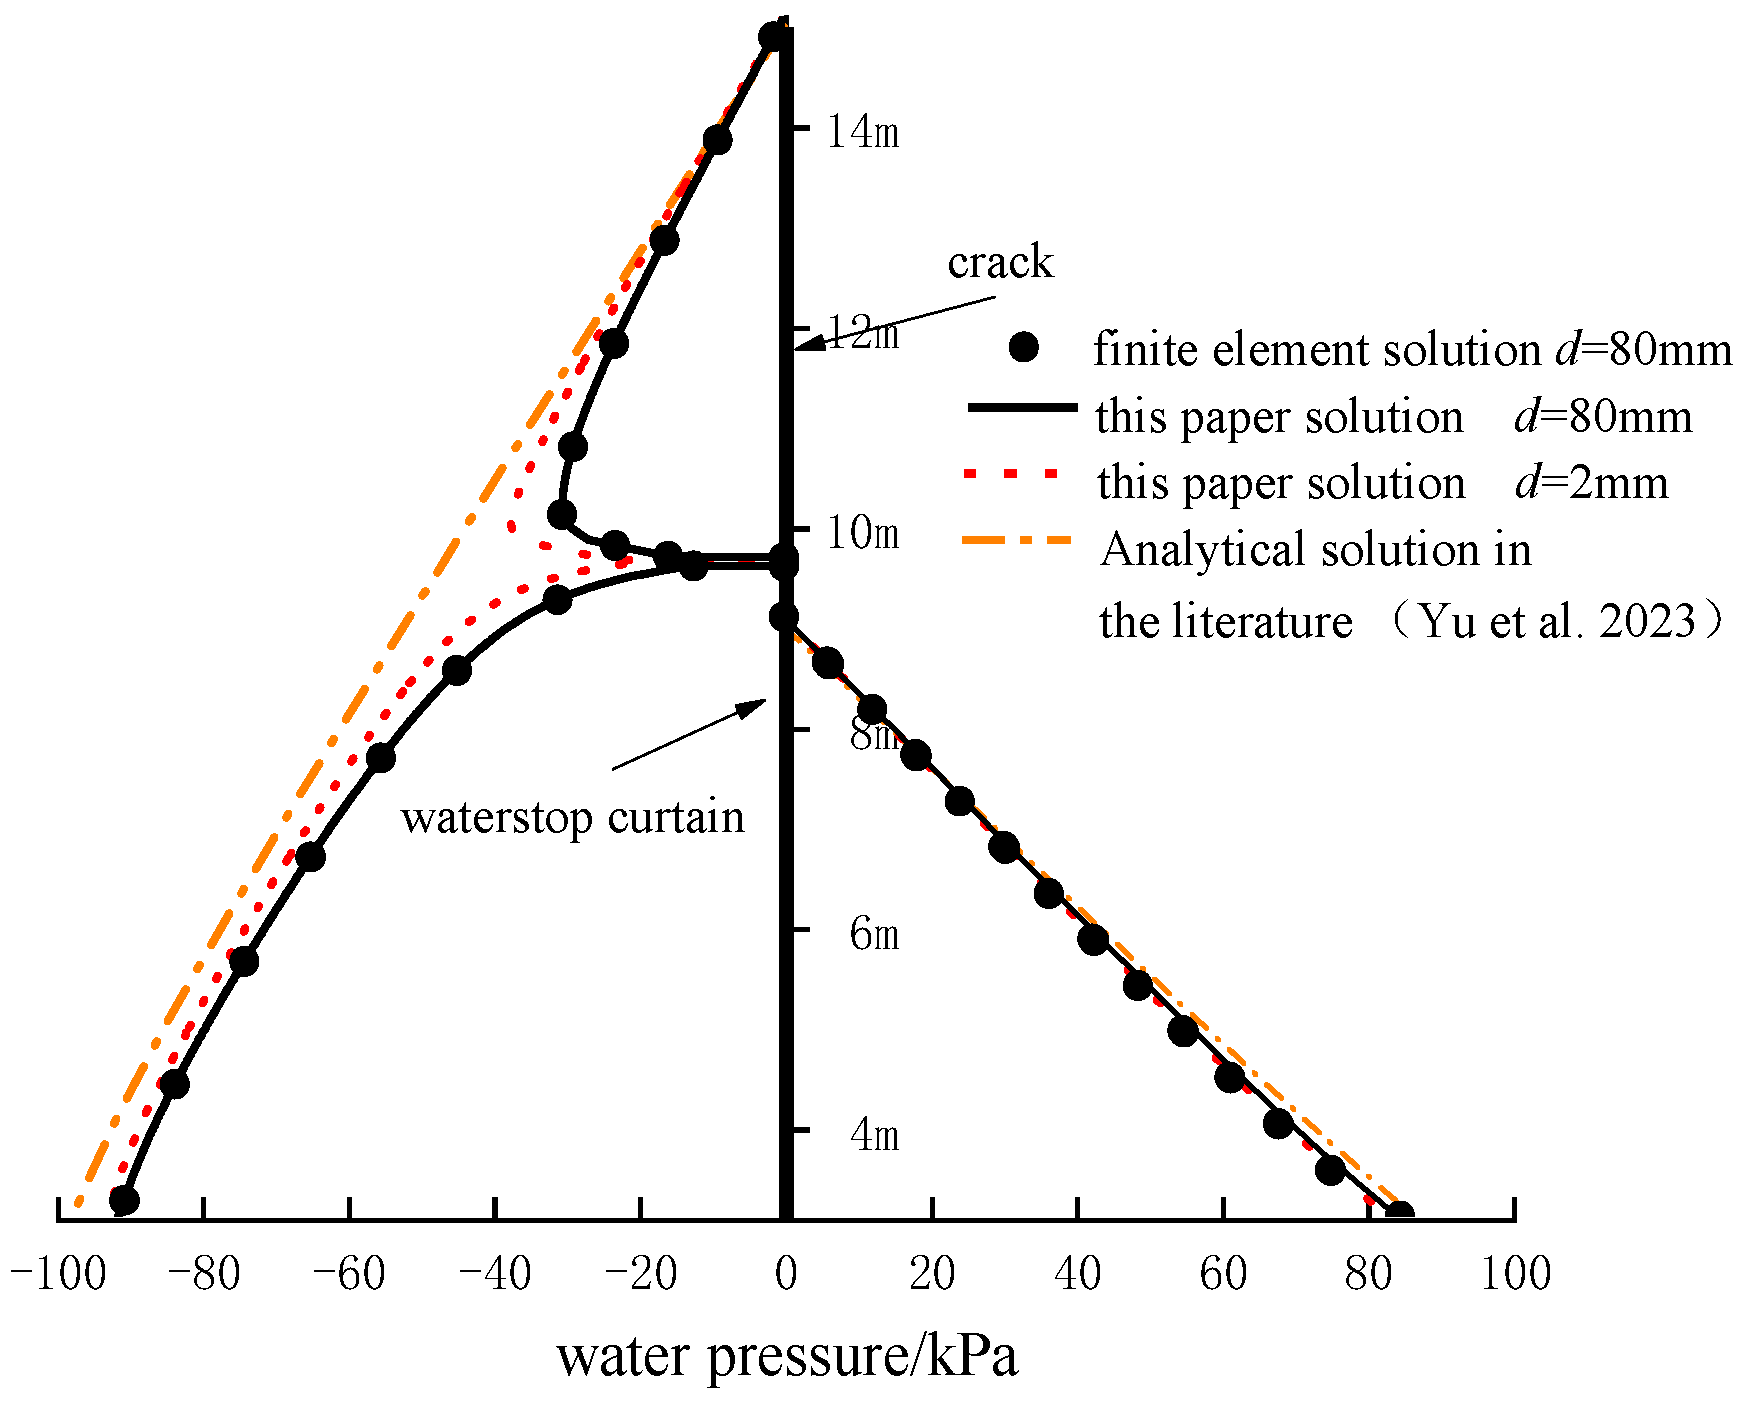
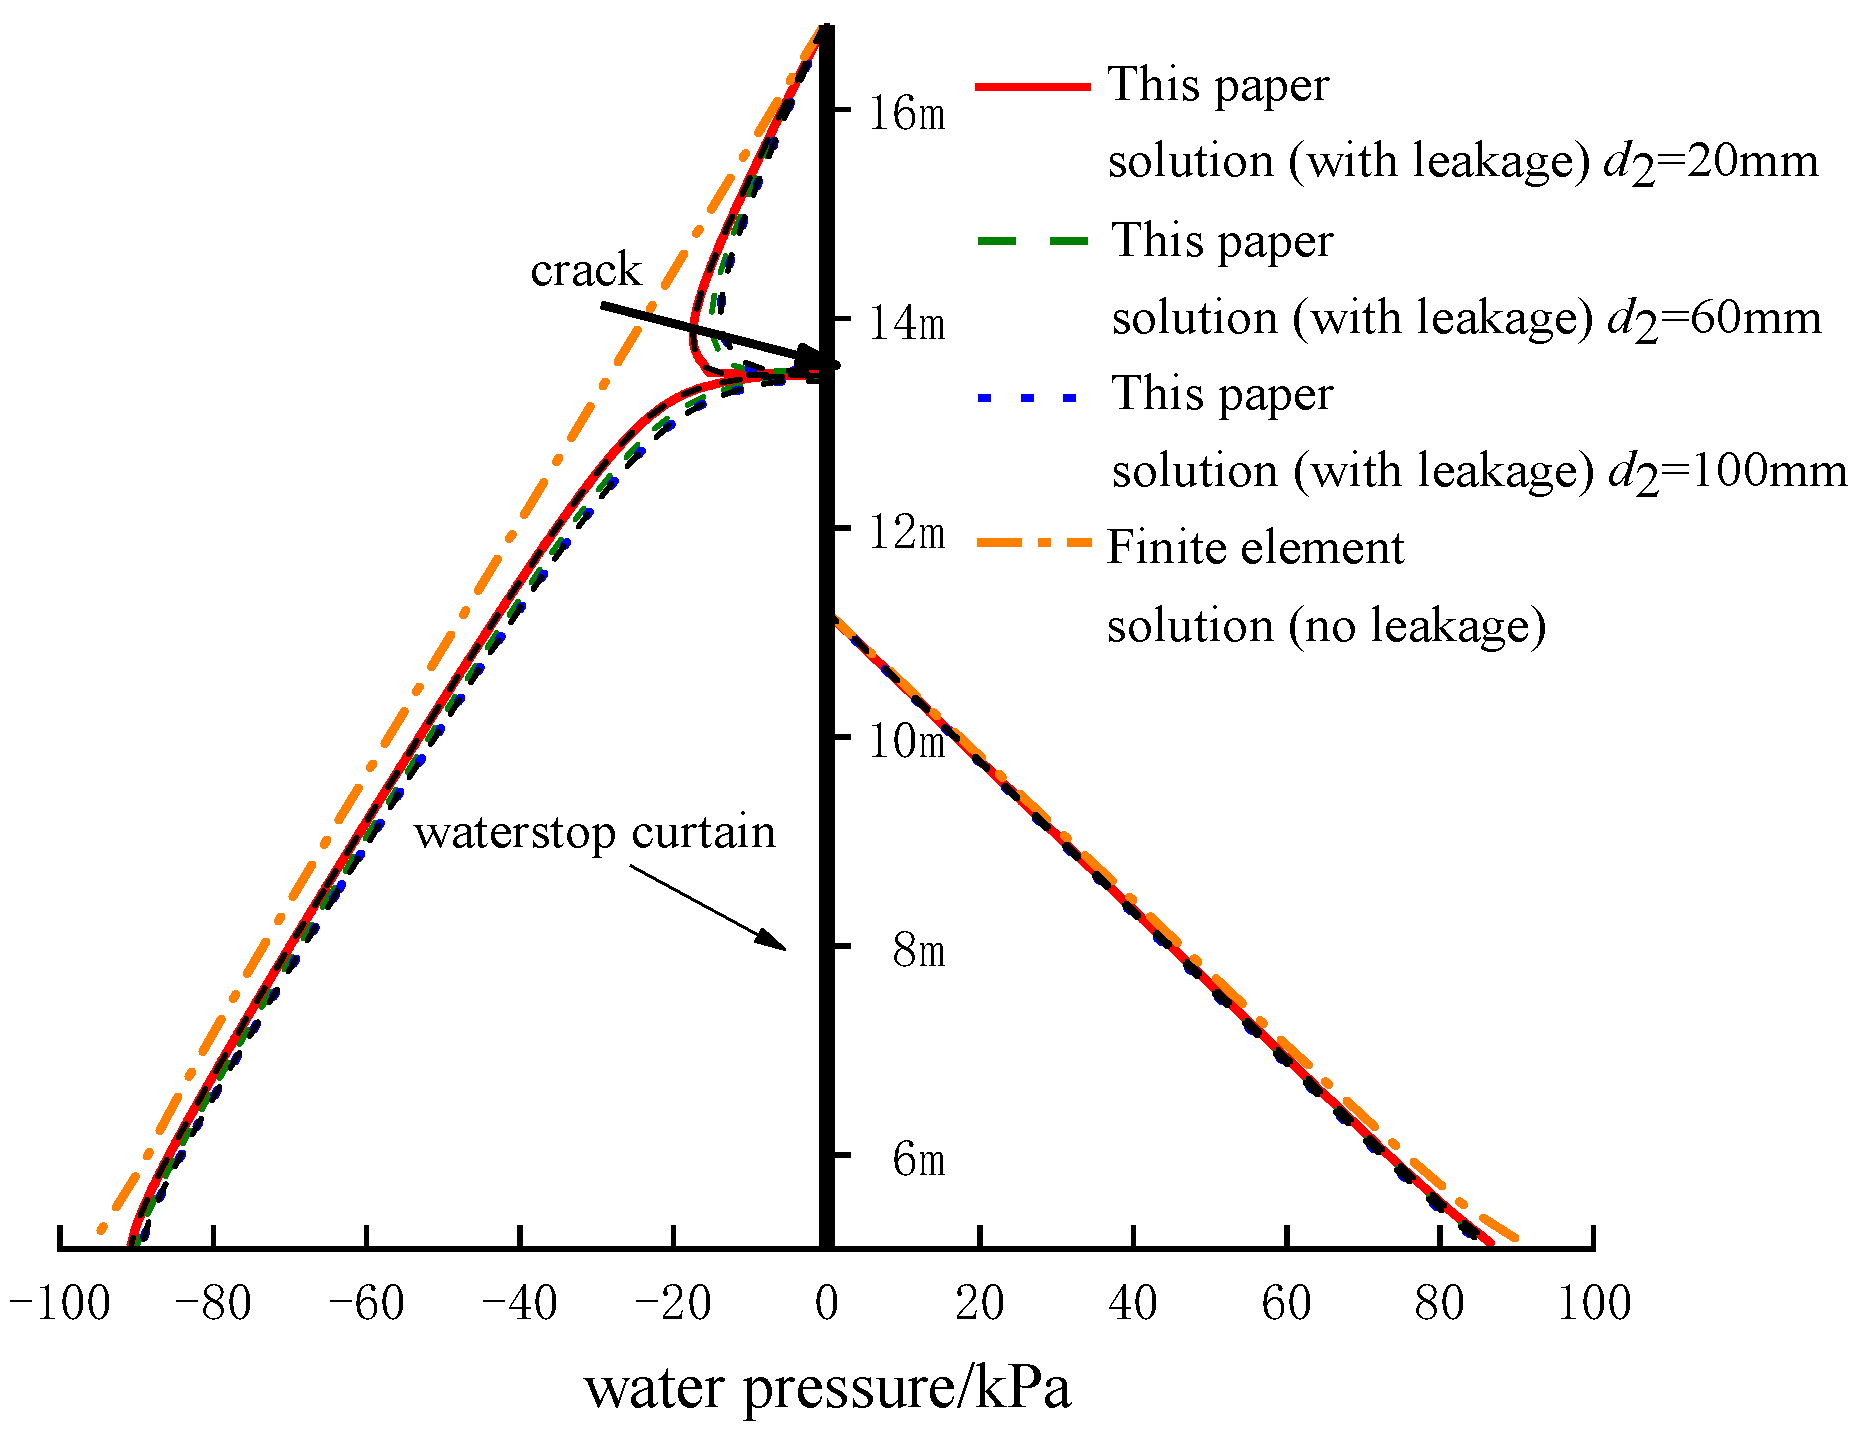
The pit parameters are taken according to the data in the literature [32]. When the width of the vertical seepage crack d2 is taken as 80 mm, the water pressure calculation results on the water-stopping curtain after the pit reaches steady-state seepage in this paper are compared with the water pressure calculation results of the finite element software and the results are shown in Figure 4.
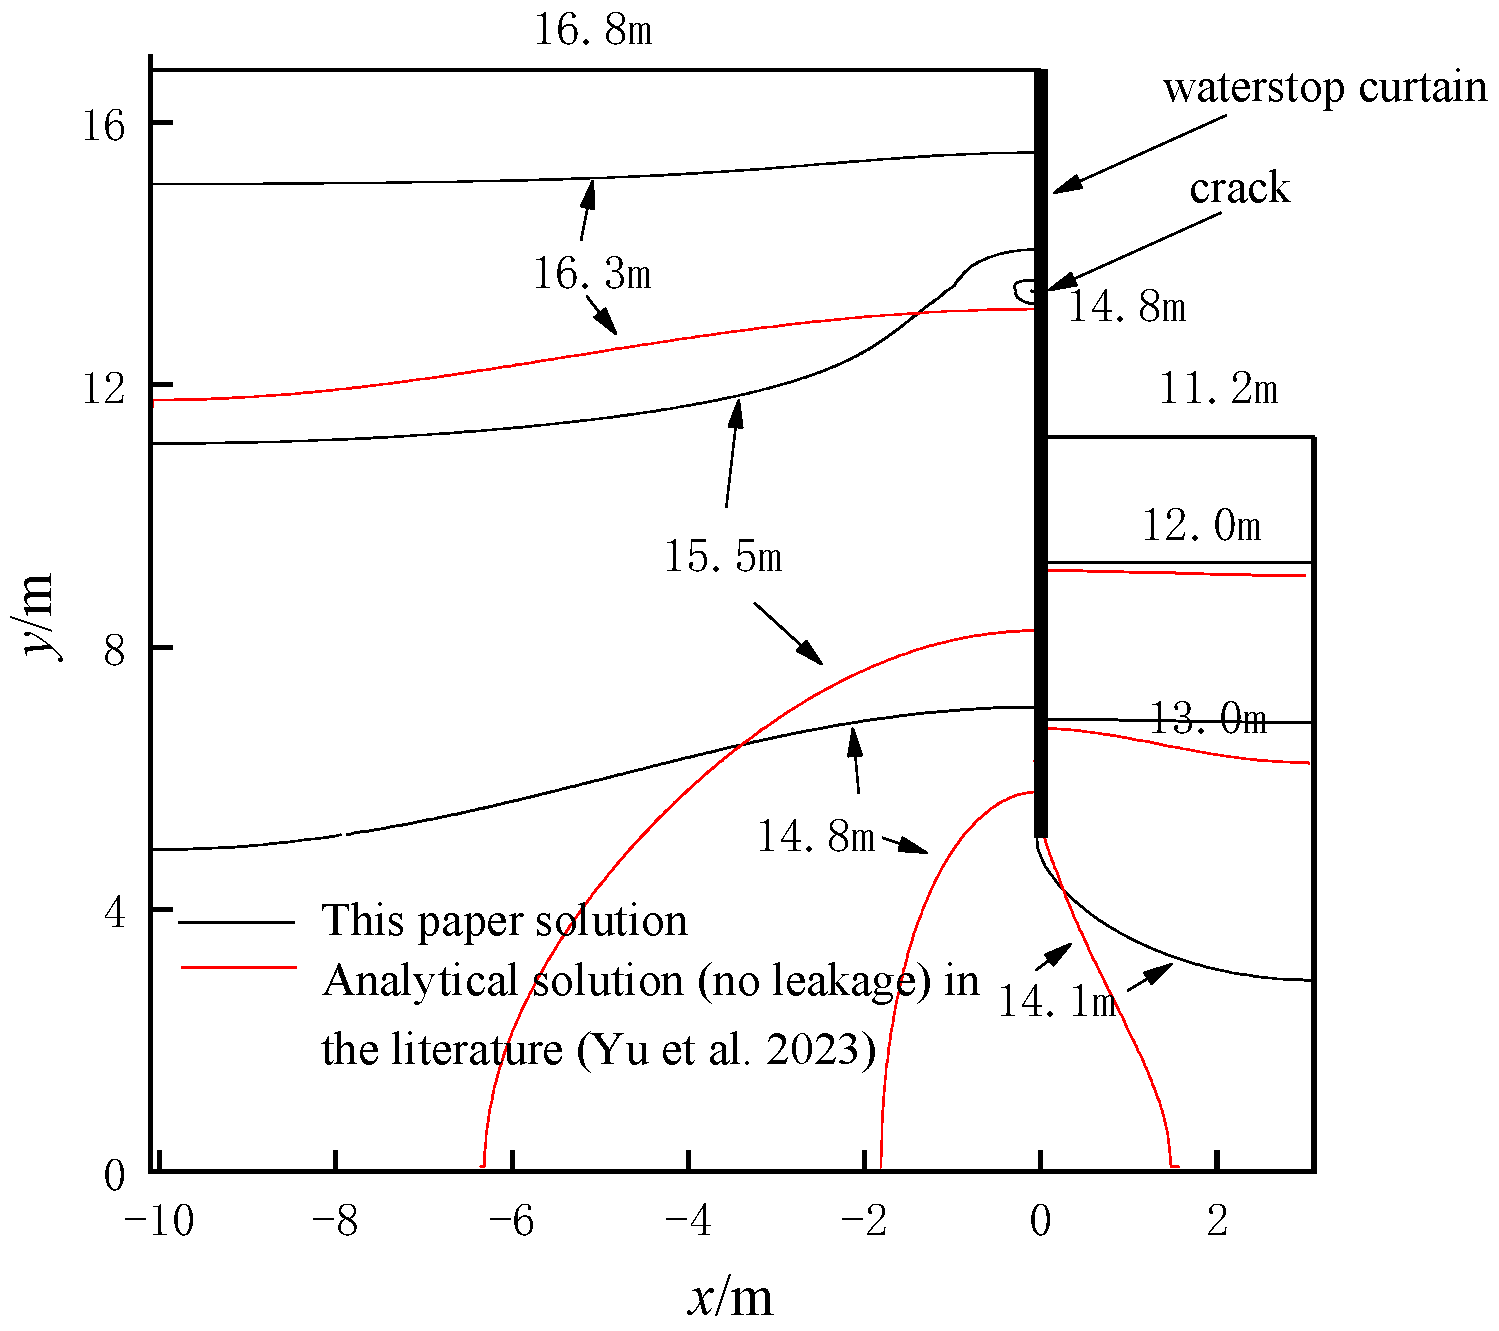
Figure 4 demonstrates that the water pressure outcomes obtained in this study align with those produced by the finite element software, confirming the accuracy of our solution. When the width of the vertical leakage crack (d2) is set to 2 mm, our analytical solution transforms into a steady-state seepage solution from the pit, assuming no leakage from the stopping curtain. We compared our degraded solution with the water pressure calculation results from an analytical solution published by Yu et al. [32]. We used the same calculation parameters as in their study and assumed a value of 9.8 kN/m3 for γw. Figure 4 displays the comparison results. Although the degraded analytical solution of this paper does not align with the water pressure calculation results of the analytical solution in the literature [32] near the leakage location, it matches well in other regions. This confirms the accuracy of the solution in this paper.

4.3. Comparative Validation of Seepage Flow Calculation Results at Stop Curtain Leaks

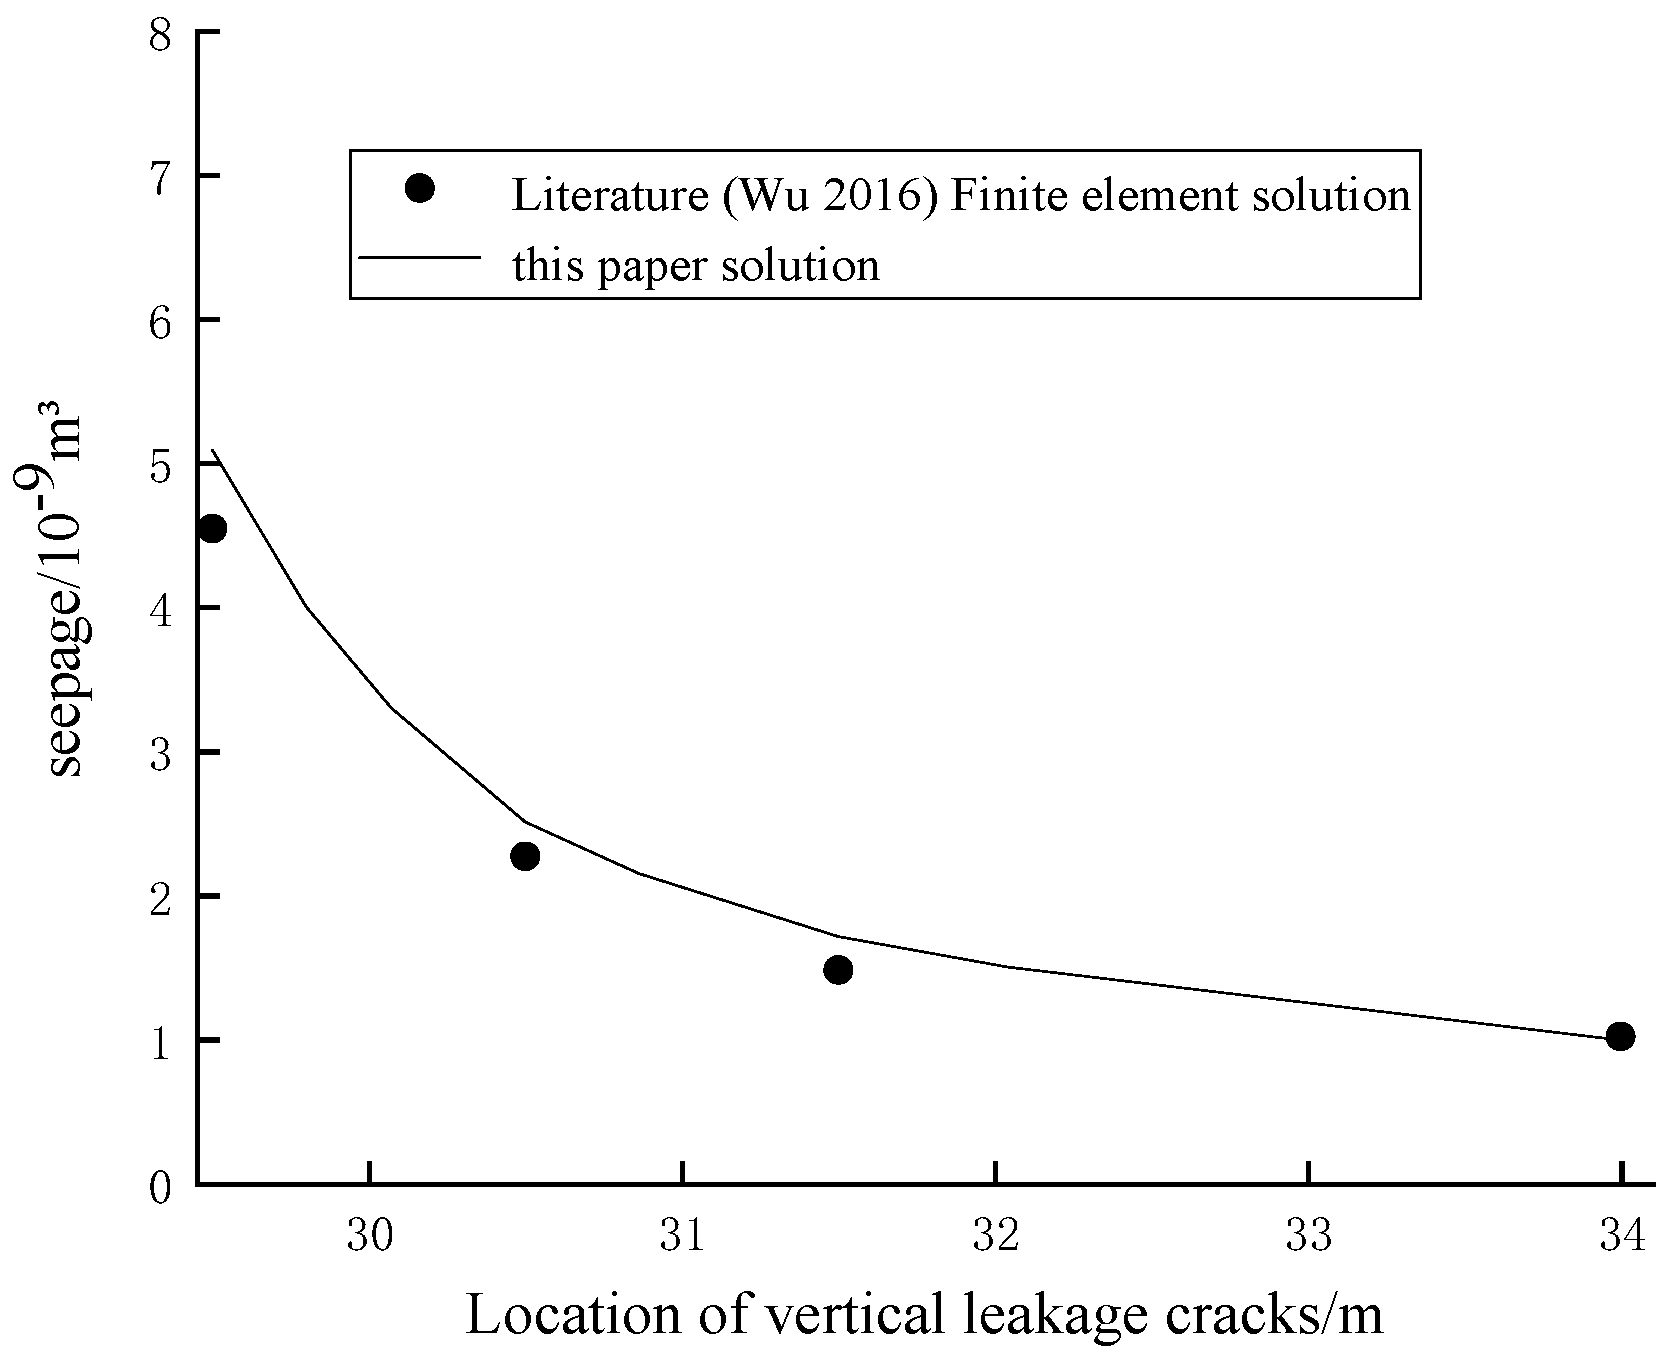
This study compares the seepage flow calculation results at the stop curtain leakage obtained in this paper with those obtained in the literature [29] using ABAQUS finite element software. The seepage region used in the comparison is 25 mm2, and other parameters are consistent with those used in the literature [29]. The comparison results are shown in Figure 5.
From Figure 5, it can be seen that the analytical solution of this paper and the results obtained in the literature [29] by using the finite element software ABAQUS are relatively close to each other, and the error is within the range of 9.4% to 13.6%.

5. Parametric Analysis

5.1. Pit Head Analysis

This paper calculates the head distribution of our solution around the pit using different parameters and compares these head calculations to the finite element head calculations that assume no leakage from the water-stop curtain. Table 1 shows the pit engineering parameters unless otherwise specified. The results are then analysed and compared.
(1)
The effect of change in d2 (vertical leakage crack width) on the head distribution around the pit.
Based on Figure 6, the head distribution around the pit was calculated for three different values of d2: 20 mm, 60 mm, and 100 mm. As the vertical seepage crack width increased, there was a slight decrease in the total head at the bottom and left region of the stop curtain. However, the total head at the right region of the stop curtain remained almost unchanged. Notably, the change in the total head at the left and bottom regions of the stop curtain was more significant for d2 values less than 60 mm than for d2 values greater than 60 mm. For instance, when d2 increased from 20 mm to 60 mm, the total head at x = −1 m and z = 11 m decreased from 15.71 m to 15.61 m, a decrease of 0.64%. Similarly, the total head at x = 0 m and z = 2.5 m decreased from 14.21 m to 14.17 m, a decrease of 0.28%. When d2 increased from 60 mm to 100 mm, the total head at x = −1 m and z = 11 m decreased from 15.61 m to 15.55 m, a decrease of 0.38%. Likewise, the total head at x = 0 m and z = 2.5 m decreased from 14.17 m to 14.14 m, a decrease of 0.21%. In summary, the vertical leakage crack width has a minor impact on the total head at the bottom and left side of the water-stop curtain, but it has almost no effect on the total head on the right side of the water-stop curtain.
(2)
The effect of changes in h3 (location of vertical leakage cracks) on the head distribution around the pit.
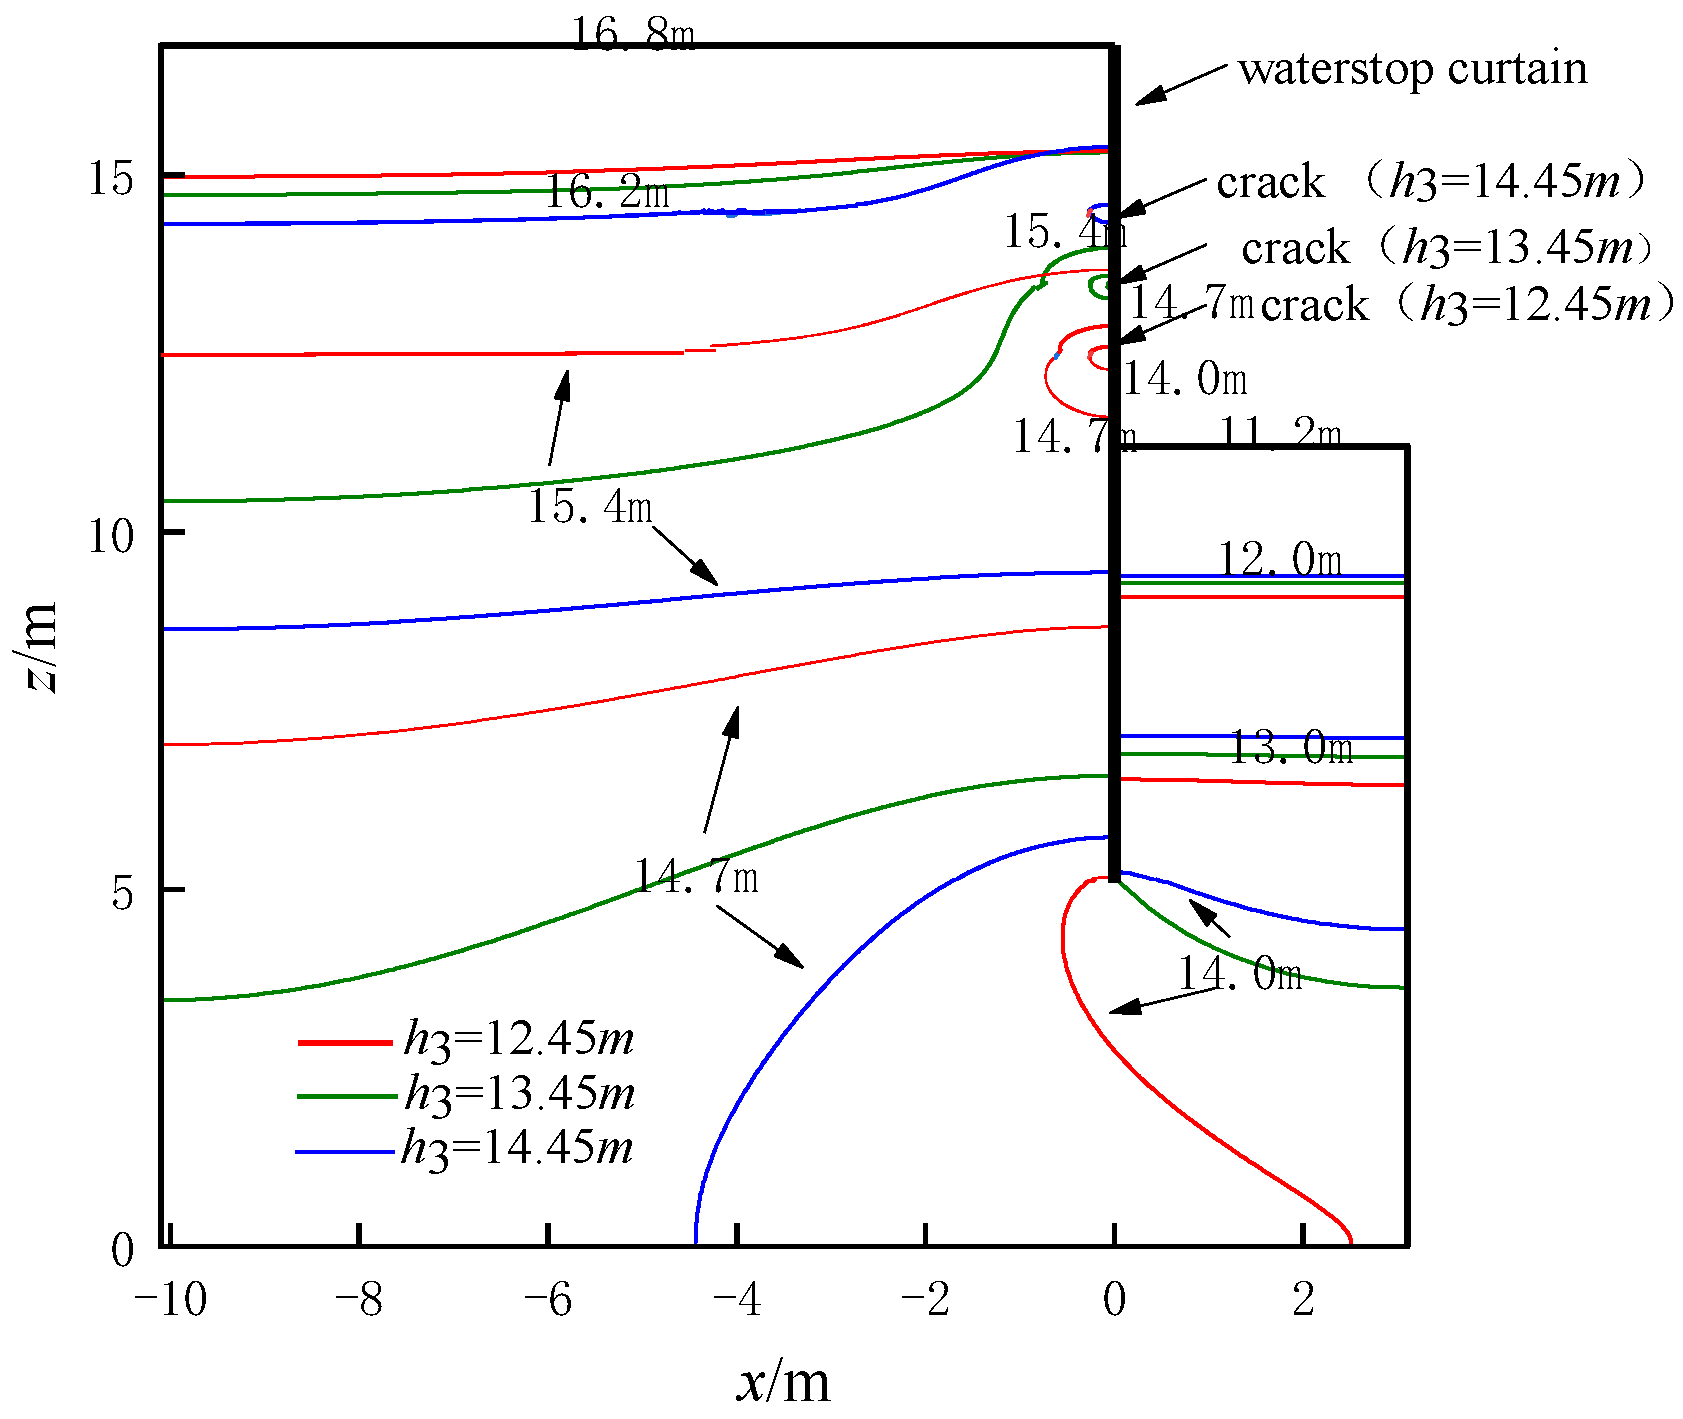
In Figure 7, the water head distribution around the pit was calculated for h3 values of 12.45 m, 13.45 m, and 14.45 m. The total head in the region to the right of the water-stopping curtain remained almost unchanged as the vertical leakage crack position rose. However, there was a slight increase in the total head at the bottom of the curtain and the region to the left of the curtain. Moving the vertical leakage crack position from 12.45 m to 14.45 m resulted in a 5.05% increase in the total head at x = −1 m and z = 11 m, which went from 14.86 m to 15.61 m; a 3.07% increase in the total head at x = 0 m and z = 2.5 m, which went from 14.01 m to 14.44 m; and a 1.53% increase in the total head at x = 2 m and z = 8 m, which went from 12.41 m to 12.60 m. Thus, the h3 location had little effect on the head of the right side of the curtain but had a minor effect on the left side and bottom of the curtain.
(3)
The solution in this paper is analysed in comparison with the finite element solution when there is no leakage in the water-stop curtains.
In this research paper, we compared the results of finite element head calculations from our solution with those of the stop curtain, assuming no leakage. Figure 8 displays the comparison. We found that the total head calculated using our solution was smaller on the left side of the stop curtain and larger on the right side. For example, at x = −1 m and z = 11 m, the total head increased from 15.31 m to 15.98 m, a 4.38% increase. On the other hand, at x = −2 m and z = 8 m, the total head decreased from 12.52 m to 12.38 m, a 1.12% decrease. We observed a small difference between the total head distribution line near the curtain and the total head distribution line without leakage. However, a significant difference was observed when moving away from the curtain.
(4)
The effect of changes in α (ratio of vertical to horizontal hydraulic conductivity) on the head distribution around the pit.
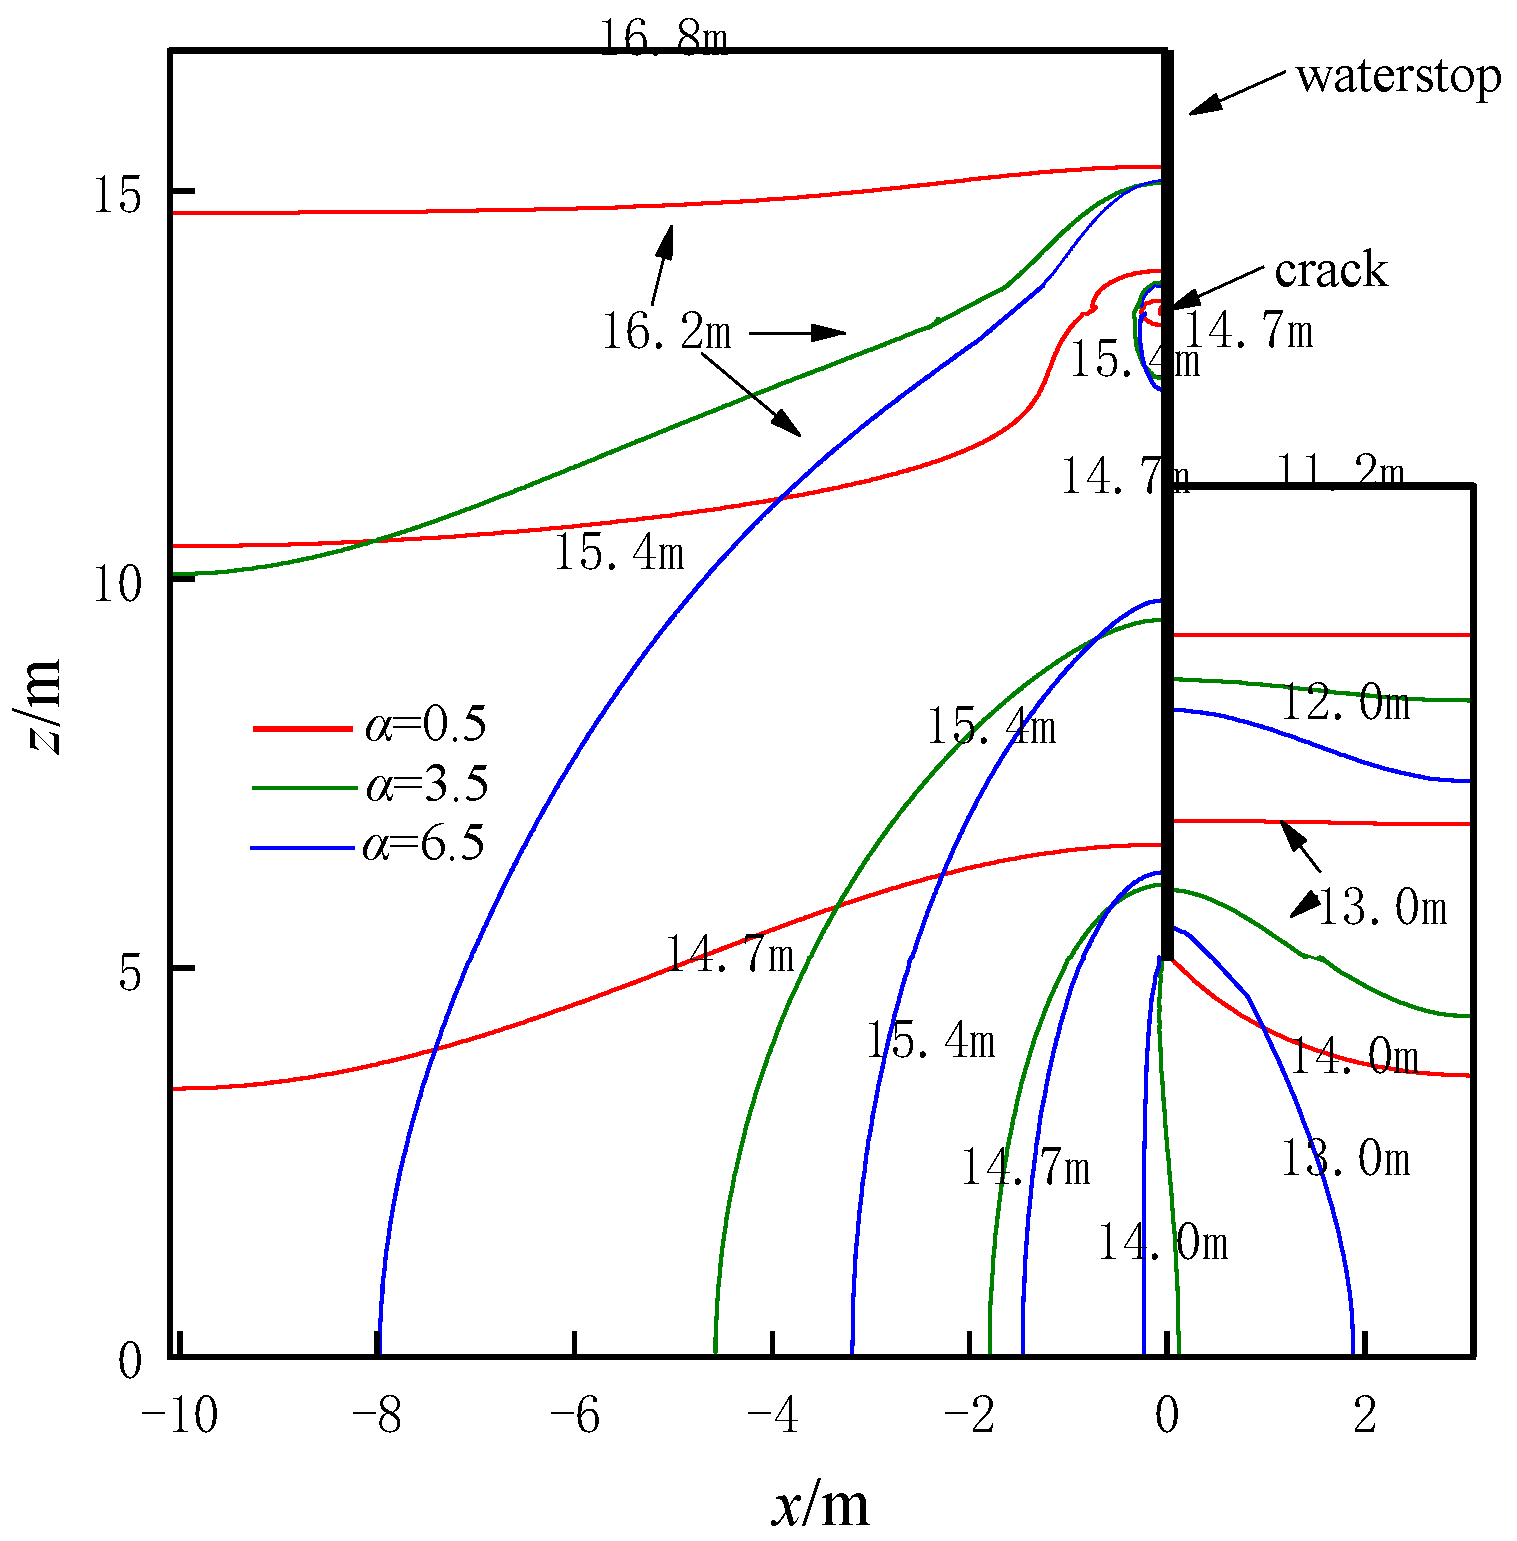
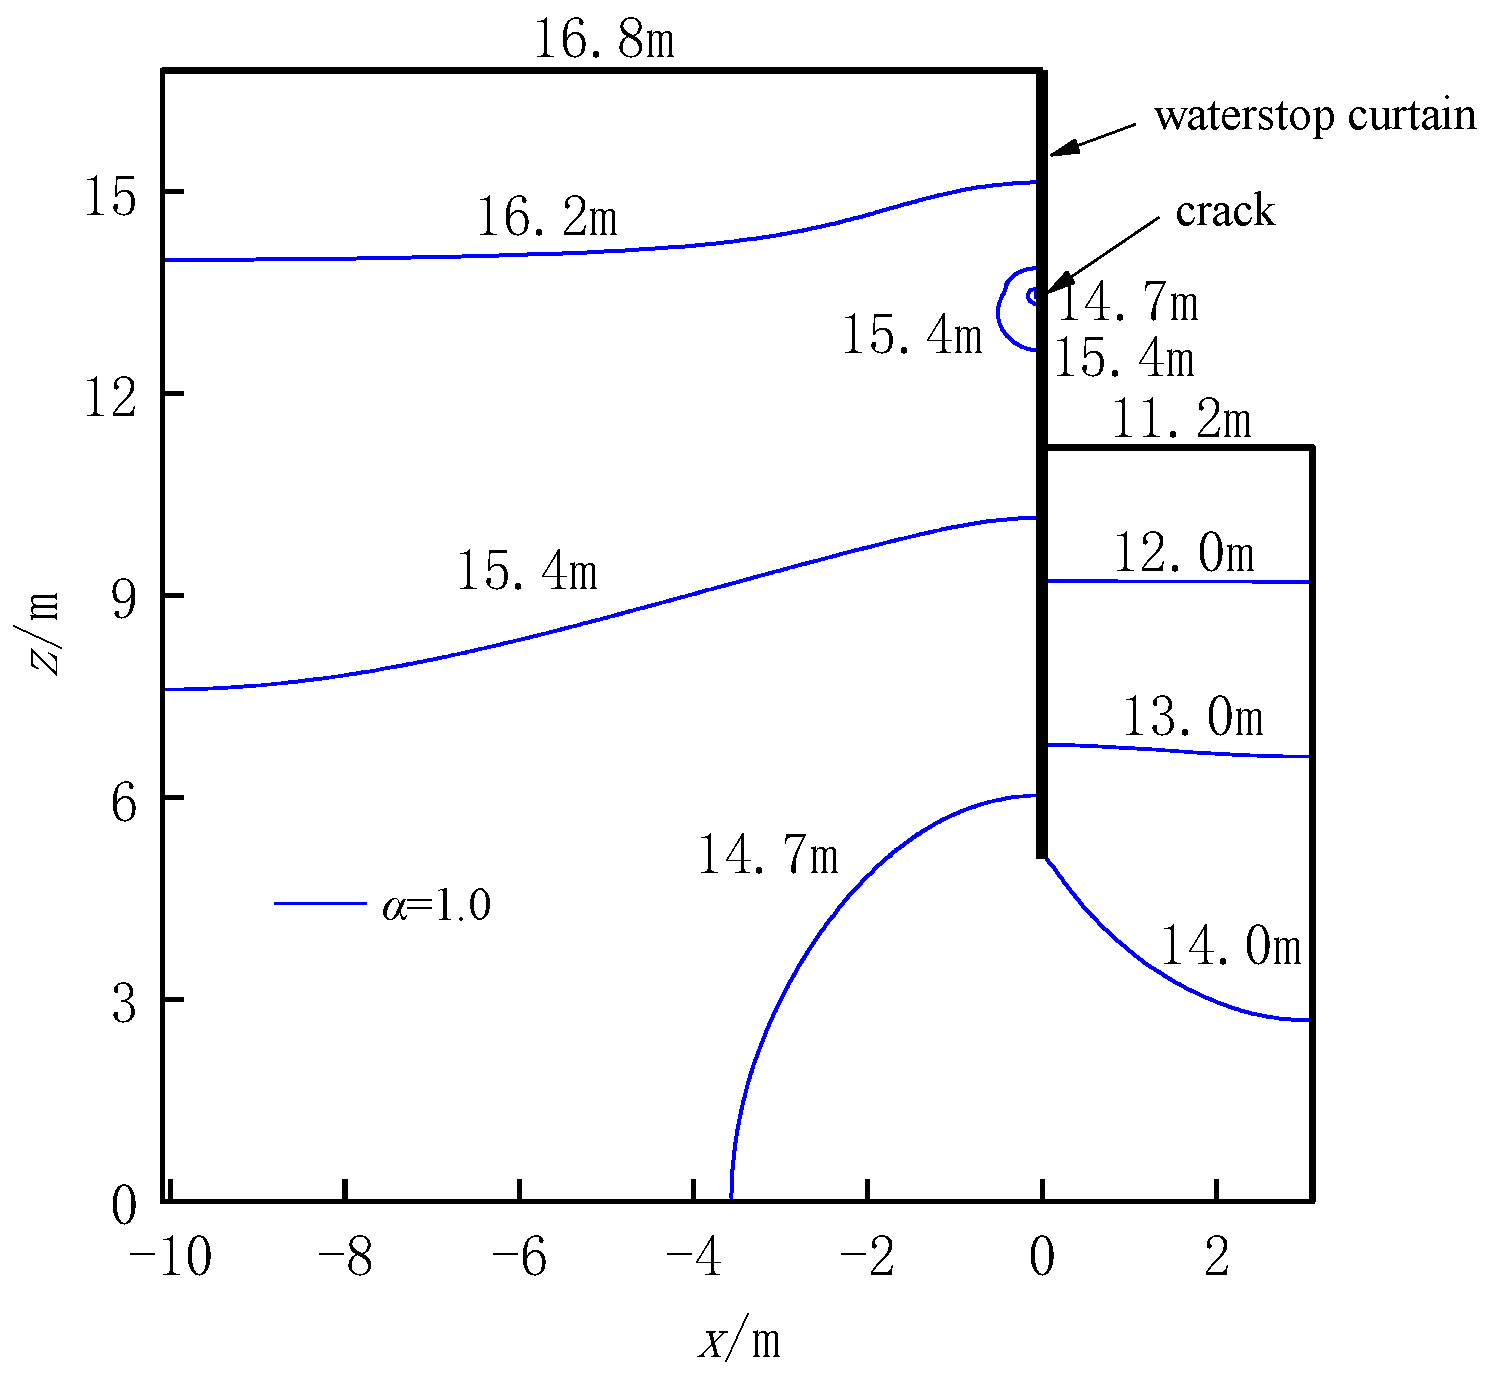
In Figure 9 and Figure 10, the head distributions around the pit were calculated for α values of 0.5, 3.5, and 6.5. When the ratio of vertical to horizontal hydraulic conductivity increases, the total head slightly increases on the left side of the stop curtain and slightly decreases on the right side. Additionally, the change in the total head of the pit is greater when α is smaller than 3.5 compared to when it is larger than 3.5. For example, when the ratio of vertical to horizontal hydraulic conductivity increases from 0.5 to 3.5, the total head at x = −2 m and z = 10 m increases from 15.23 m to 15.67 m, an increase of 2.89%. Similarly, the total head at x = −3 m and z = 4 m increases from 14.52 m to 15.20 m, an increase of 4.68%, while the total head at x = 2 m and z = 6 m decreases from 13.33 m to 12.66 m, a decrease of 5.03%. On the other hand, when the ratio of vertical to horizontal hydraulic conductivity increases from 3.5 to 6.5, the total head at x = −2 m and z = 10 m only increases by 0.70%, the total head at x = −3 m and z = 4 m increases by 1.71%, and the total head at x = 2 m and z = 6 m decreases by 2.68%. At x = −2 m and z = 10 m, the total head is 15.41 m at a = 1 (osmotic isotropy); 15.23 m at a = 0.5, which is 1.17% less compared to a = 1; and 15.67 m at a = 3.5, which is 1.69% more compared to a = 1. At x = −3 m, z = 4 m, the total head is 14.74 m at a = 1. At a = 0.5, it is 14.52 m, a decrease of 1.49% compared to a = 1. At a = 3.5, it is 15.20 m, an increase of 3.12% compared to a = 1. At x = 2 m, z = 6 m, and a = 1 (osmotically anisotropic), it is 13.21 m, and at a = 0.5 it is 13.33 m, an increase of 0.91% compared to a = 1. The total head at a = 3.5 is 12.66 m, which is 4.16% less than that of a = 1. Thus, the ratio of vertical and horizontal hydraulic conductivity α has a small influence on the distribution of total head on the left and right sides of the curtain, and when α is less than 3.5, the total head change is significantly larger compared to when α is greater than 3.5.

5.2. Water Pressure Analysis of Water Curtains

This paper compares and analyses the results of water pressure calculations using an analytical solution for the water-stop curtain around a pit during steady-state seepage when various engineering parameters are altered. The findings are then compared to finite element water pressure calculations for the water-stop curtain when there is no seepage. If there is no special explanation, the specific parameters of the selected example are b = 10 m, a = 5 m, h1 = 16.8 m, c = 3 m, h2 = 11.2 m, d2 = 80 mm, γw = 9.8 kN/m3, k = 1 × 10⁻⁹ m/s, and kh/kv = 0.5.
(1)
The effect of variation in d2 (vertical leakage crack width) on water pressure around pit stop curtains.
Figure 11 shows the variation in water pressure at different locations around the pit stop curtain with the change in the width of the vertical seepage crack. From the figure, it can be seen that the water pressure around the pit stop curtain decreases with the increase in the vertical leakage crack width when other conditions remain unchanged. As the width of vertical leakage crack d2 increases from 20 mm to 100 mm, the water pressure at z = 14 m on the left side of the water-stop curtain decreases from 16.90 kPa to 13.50 kPa, a decrease of 20.12%; the water pressure at z = 8 m decreases from 69.58 kPa to 67.76 kPa, a decrease of 2.62%; and the water pressure at z = 8 m on the right side of the water-stop curtain increases from 44.65 kPa to 67.76 kPa, an increase of 2.62%. Elsewhere, the pressure decreases from 44.65 kPa to 44.50 kPa, a reduction of 0.34%. In addition, the water pressure on the left side of the curtain without leakage is larger than that with leakage, and the water pressure on the right side of the curtain without leakage is slightly larger than that with leakage. Under the same parameters, the water pressure on the left side of the curtain without leakage at z = 14 m is 23.35 kPa, the water pressure at the width of the vertical leakage cracks is 14.75 kPa when the width of the vertical leakage cracks is 60 mm, and the water pressure of the curtain without leakage is 14.75 kPa. The water pressure when there was no leakage compared to the water pressure when there was leakage increased by 36.83%. The water pressure when there was no leakage on the right side of the curtain z= 8 m was 45.13 kPa, the water pressure when the width of the vertical leakage crack was 60 mm was 44.75 kPa, and the water pressure when there was no leakage in the water curtain compared to the water pressure when there was leakage increased by 0.84%. Therefore, the vertical leakage crack width has less influence on the water pressure around the water-stop curtain. When there is leakage, the water pressure on the left side of the water-stop curtain is smaller than the water pressure when there is no leakage. When there is leakage, the water pressure on the right side of the water-stop curtain is slightly smaller than the water pressure when there is no leakage.
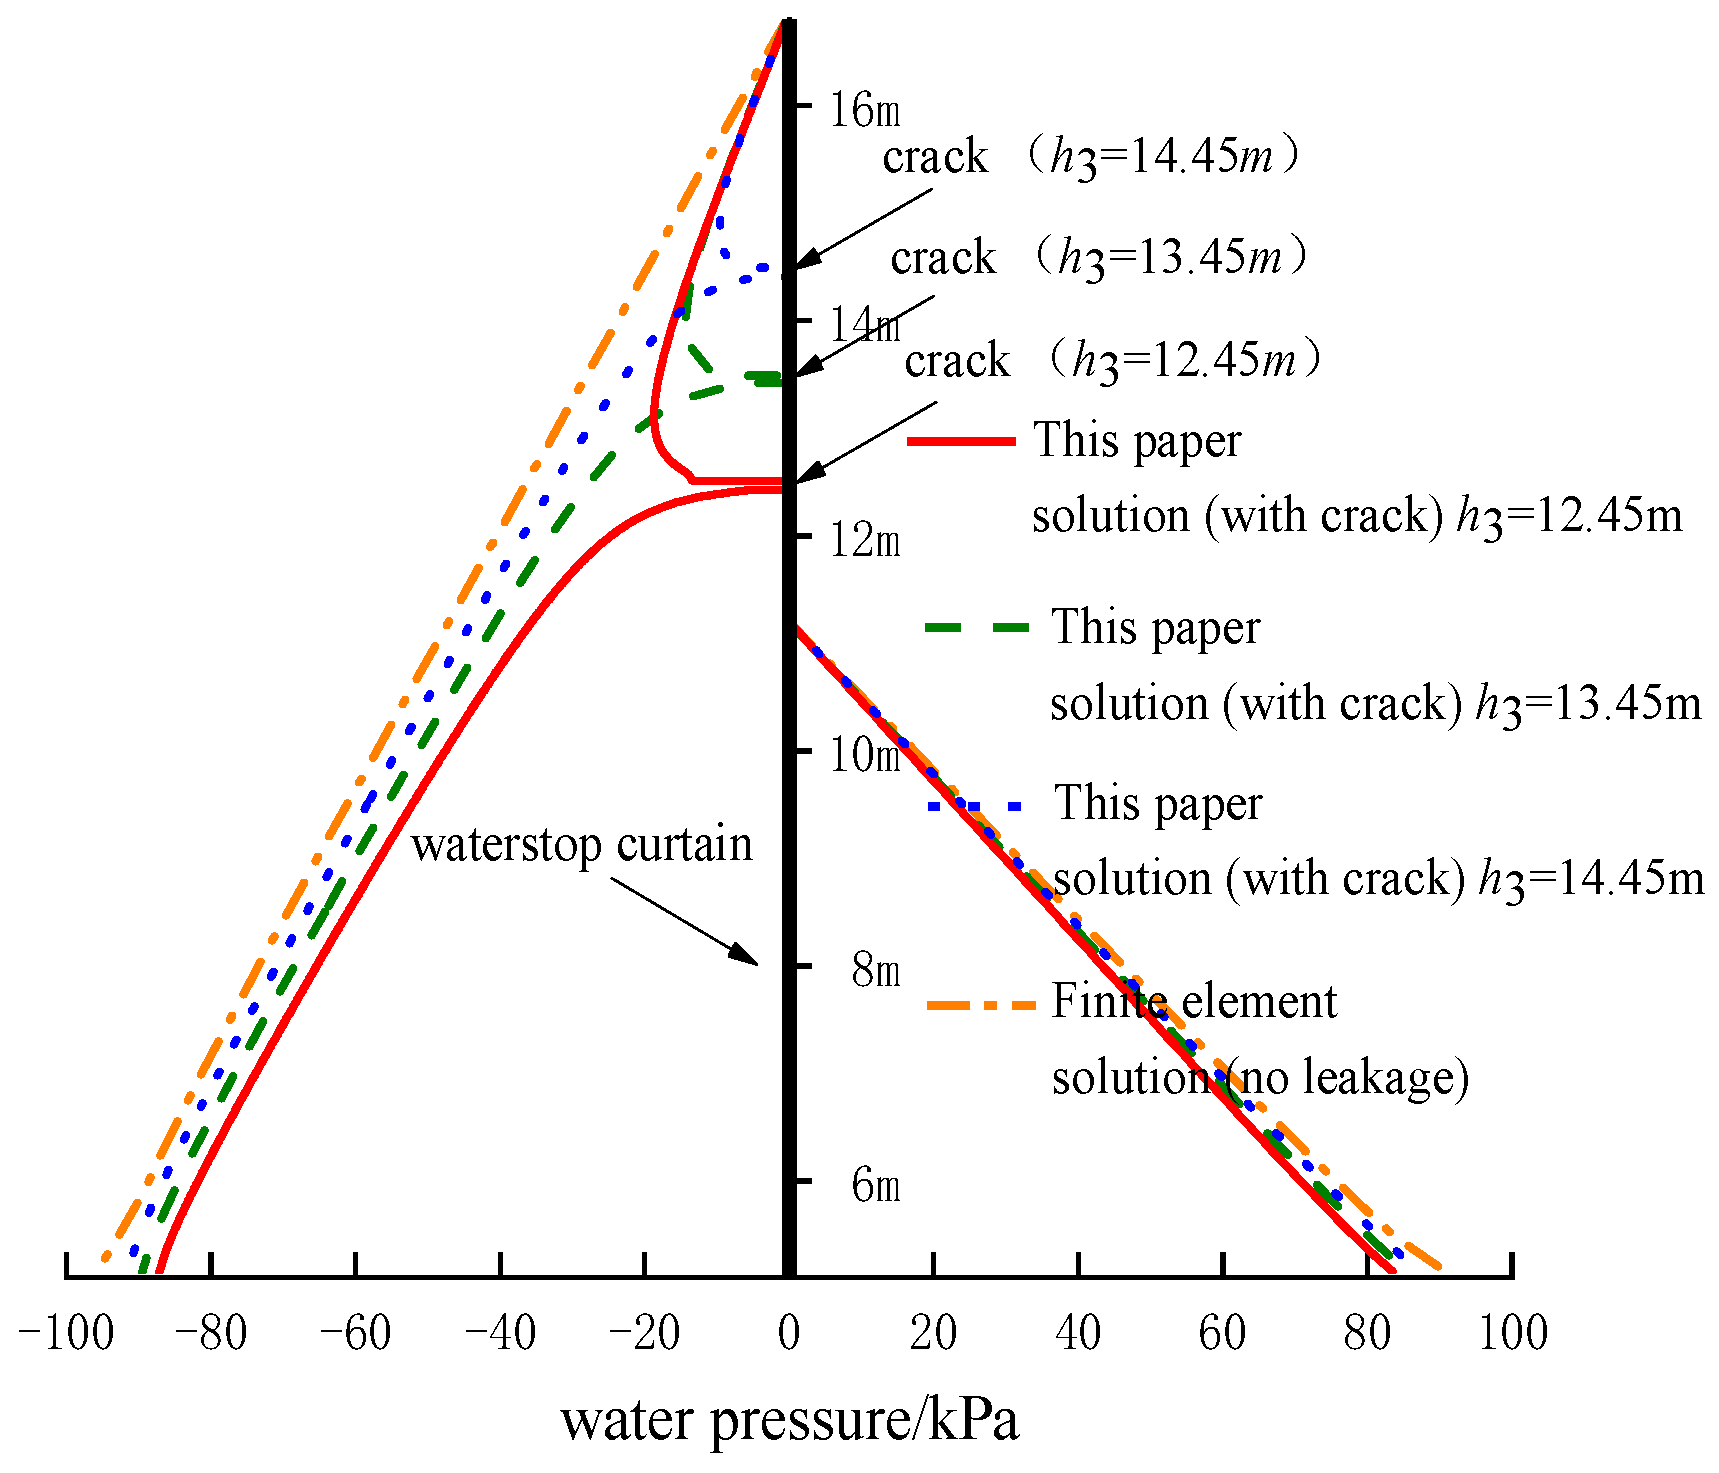
Based on the data in Figure 12, it is established that the water pressure around the pit stop curtain changes depending on the position of the vertical leakage crack. The figure shows that when the vertical seepage crack is above the left leakage position, the water pressure decreases, while it increases below that position. On the right side of the water-stop curtain, the water pressure slightly increases with an increase in the vertical seepage crack position. When the vertical leakage crack’s position increases from 12.45 m to 14.45 m, the water pressure at z = 14 m on the left side of the water-stop curtain decreases from 15.63 kPa to 15.97 kPa, an increase of 2.18%. However, the water pressure at z = 8 m increases from 64.95 kPa to 70.46 kPa, an increase of 8.48%, and at z = 8 m. it rises from 43.58 kPa to 45.44 kPa, an increase of 4.27%. Therefore, the location of vertical leakage cracks has a minimal influence on the water pressure inside and outside the pit.
(2)
The effect of change in α (ratio of vertical to horizontal hydraulic conductivity) on water pressure around the pit stop curtain.
In Figure 13, we can observe the changes in different locations surrounding the pit stop curtain as the ratio of vertical to horizontal hydraulic conductivity varies. The graph indicates that while other conditions remain constant, an increase in α leads to a gradual rise in water pressure on the outside of the pit and a gradual decrease on the inside. When α shifts from 0.5 to 1.5 m, the water pressure at z = 14 m on the outside of the pit climbs from 14.07 kPa to 15.23 kPa, marking an 8.24% increase. Similarly, the water pressure at z = 8 m increases from 68.07 kPa to 70.36 kPa (a 3.36% rise), while the pressure at z = 8 m on the inside of the pit drops from 44.11 kPa to 41.78 kPa (a 5.28% decrease). Thus, we can conclude that the ratio of vertical to horizontal hydraulic conductivity has a minimal impact on the water pressure at the inner and outer sides of the foundation pit.

5.3. Analysis of Seepage Flow at Stop Curtain Leaks

Based on the analytical solution, the seepage flow at the seepage of the pit stop curtain is calculated for different variations in engineering parameters. If there are no special instructions, the specific parameters of the selected calculations are b = 10 m, a = 5 m, h1 = 16.8 m, c = 3 m, h2 = 11.2 m, d2 = 80 mm, γw = 9.8 kN/m3, k = 1 × 10⁻⁹ m/s, and kh/kv = 0.5.
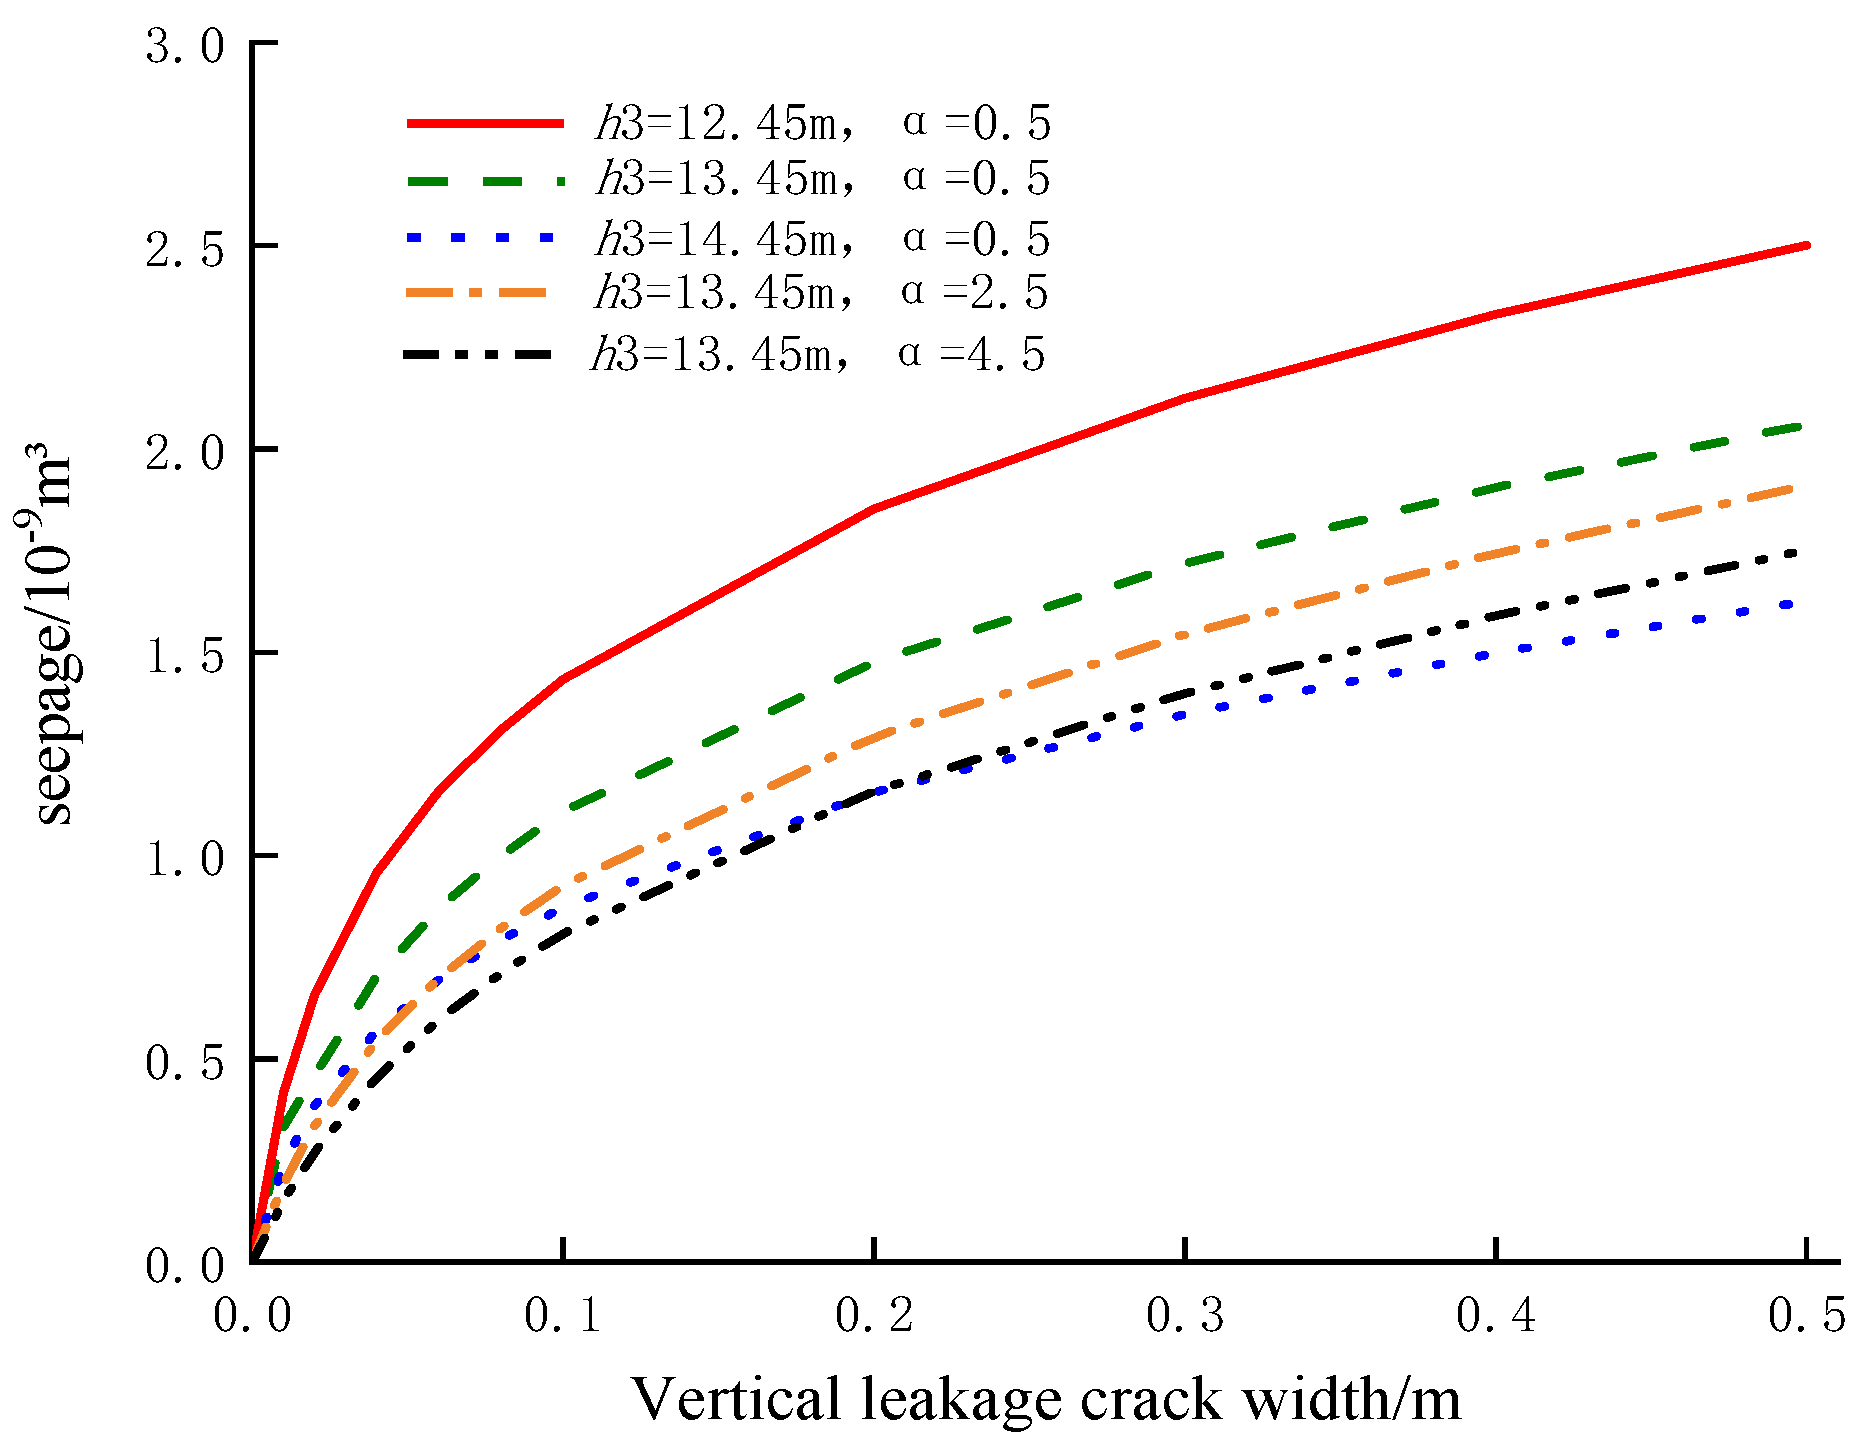
Figure 14 displays how the width and location of vertical leakage cracks affect the seepage flow at the pit stop curtain leakage. The figure shows that when the vertical seepage crack location is constant and other conditions remain the same, the seepage volume at the pit stop curtain leakage increases as the vertical seepage crack width (d2) increases. When d2 increases from 20 mm to 500 mm and the vertical seepage crack location (h3) is 12.45 m, and the ratio of the vertical to horizontal hydraulic conductivity (α) is 0.5, seepage at the stop curtain leakage increases by 278.79%, rising from 0.66 × 10⁻⁹ m3 to 2.50 × 10⁻⁹ m3. At h3 = 13.45 m, seepage at the water curtain leakage increases by 347.83%, rising from 0.46 × 10⁻⁹ m3 to 2.06 × 10⁻⁹ m3. At h3 = 14.45 m, seepage at the water curtain leakage increases by 328.95%, rising from 0.38 × 10⁻⁹ m3 to 1.63 × 10⁻⁹ m3. When d2 is less than 100 mm, changes in seepage volume at the water curtain leakage are significantly greater than when d2 is more than 100 mm. If the vertical leakage crack width and other conditions remain the same, the higher the vertical leakage crack position, the smaller the seepage at the water curtain leakage. For instance, at d2 = 100 mm and α = 0.5, as h3 increases from 12.45 m to 14.45 m, seepage at the water curtain leakage decreases by 39.16%, falling from 1.43 × 10⁻⁹ m3 to 0.87 × 10⁻⁹ m3. At d2 = 300 mm, as h3 increases from 12.45 m to 14.45 m, the seepage volume at the stop curtain leakage decreases by 36.62%, from 2.13 × 10⁻⁹ m3 to 1.35 × 10⁻⁹ m3. Therefore, d2 and h3 have a greater impact on seepage flow at the pit stop curtain leakage. When d2 and h3 are constant, a larger α results in smaller seepage at the water curtain leakage. For example, at h3 = 13.45 m and d2 = 80 mm, as α increases from 0.5 to 4.5, seepage at the water curtain leakage reduces by 29.00%, falling from 1.00 × 10⁻⁹ m3 to 0.71 × 10⁻⁹ m3. At d2 = 200 mm, as α increases from 0.5 to 4.5, the seepage volume at the water curtain leakage reduces by 21.62%, falling from 1.48 × 10⁻⁹ m3 to 1.16 × 10⁻⁹ m3. Hence, α has a significant impact on seepage volume at the stop curtain leakage.

6. Conclusions

This research paper focuses on studying the steady-state seepage field in a two-dimensional planar soil layer that is anisotropic. The field is divided into five regions, and the total head of each region is obtained by using the method of separating variables and the superposition method. The boundary and continuity conditions are used to derive an explicit solution for the two-dimensional steady-state seepage field in the anisotropic soil layer, assuming no leakage from the stop curtain. The analytical solution includes the total head, the water pressure, and the amount of seepage at the leakage of the stop curtain. The results obtained through the analytical solution match the results obtained through finite element software calculations, which confirms the accuracy of the analytical solution presented in this research paper.
(1)
The calculated results for head, water pressure on the stop curtain, and seepage flow at the stop curtain leakage obtained in this paper are consistent with those of the numerical software, thus verifying the correctness of the solution in this paper. The solution proposed in this paper is much better than the other existing solutions in terms of accuracy.
(2)
Compared with numerical methods, the analytical method used in this paper has many advantages: it eliminates the cumbersome modelling process, is more efficient, and has a function expression that can express the influencing factors more directly.
(3)
Working according to the analytical solution of this paper, the influence of the permeability coefficient, the location of seepage cracks, and the width of seepage cracks on the head around the pit, the water pressure on the stop curtain and seepage flow at the leakage of the stop curtain are analysed. The results of the analyses show the influence of some factors and some laws. These can be used in practice to improve the prediction of seepage from water-stop curtains and to reduce adverse effects.

Author Contributions

J.Y.: conceptualization, methodology, software, and supervision. D.L.: data curation, writing—original draft, writing—review and editing, validation, formal analysis, and software. W.Z.: writing—review and editing, investigation, and supervision. All authors have read and agreed to the published version of the manuscript.

Funding

This research was funded by the National Natural Science Foundation of China (Grant No. 52478427).

Data Availability Statement

The original contributions presented in this study are included in the article. Further inquiries can be directed to the corresponding author.

Conflicts of Interest

The authors declare no conflicts of interest.

References

  1. Wu, Y.X.; Shen, S.L.; Yuan, D.J. Characteristics of dewatering induced drawdown curve under blocking effect of retaining wall in the aquifer. J. Hydraul. Eng. 2016, 539, 554–566. [Google Scholar] [CrossRef]
  2. Wu, H.N.; Xu, Y.S.; Shen, S.L.; Chai, J.C. Long-term settlement behaviour of ground around shield tunnel due to leakage of water in the soft deposit of Shanghai. Front. Archit. Civ. Eng. China 2011, 5, 194–198. [Google Scholar] [CrossRef]
  3. Shen, S.L.; Wu, H.N.; Cui, Y.J.; Yin, Z.Y. Long-term settlement behaviour of metro tunnels in the soft deposits of Shanghai. Tunn. Undergr. Space Technol. 2014, 40, 309–323. [Google Scholar] [CrossRef]
  4. Zhang, J.; Ye, S. Risk identification of retaining structure leakage in foundation pits based on measured data. Chin. J. Geotech. Eng. 2008, 30 (Suppl. 1), 667–671. [Google Scholar]
  5. Xie, Z.F. Optimization and Comparison of Dewatering Method and Waterproof Curtain in Deep-Buried Foundation Pit; Shanghai Jiao Tong University: Shanghai, China, 2019. [Google Scholar]
  6. Pujades, E.; Carrera, J.; Vazquez-Sune, E.; Jurado, A.; Vilarrasa, V.; Mascuñano-Salvador, E. Hydraulic characterization of diaphragm walls for cut and cover tunnelling. Eng. Geol. 2012, 125, 1–10. [Google Scholar] [CrossRef]
  7. Pujades, E.; Orban, P.; Bodeux, S.; Archambeau, P.; Erpicum, S.; Dassargues, A. Underground pumped storage hydropower plants using open pit mines: How do groundwater exchanges influence the efficiency? Appl. Energy 2017, 190, 135–146. [Google Scholar] [CrossRef]
  8. Lu, Z.P. Study of security in subway excavation concerning the influence of the seepage in diaphragm wall. Chin. J. Undergr. Space Eng. 2010, 6, 400–405. [Google Scholar]
  9. Liu, X.-X.; Shen, S.-L.; Xu, Y.-S.; Yin, Z.-Y. Analytical approach for time-dependent groundwater inflow into shield tunnel face in confined aquifer. Int. J. Numer. Anal. Methods Geomech. 2018, 42, 655–673. [Google Scholar] [CrossRef]
  10. Conway, B.D. Land subsidence and earth fissures in south-central and southern Arizona, USA. Hydrogeol. J. 2016, 24, 649–655. [Google Scholar] [CrossRef]
  11. Wu, Y.X.; Lyu, H.M.; Han, J.; Shen, S.-L. Dewatering-induced building settlement around a deep excavation in soft deposit in Tianjin, China. J. Geotech. Geoenviron. Eng. 2019, 145, 05019003. [Google Scholar] [CrossRef]
  12. Shaqour, F.M.; Hasan, S.E. Groundwater control for construction purposes: A case study from Kuwait. Env. Geol. 2008, 53, 1603–1612. [Google Scholar] [CrossRef]
  13. Pacheco-Martínez, J.; Hernandez-Marín, M.; Burbey, T.J.; González-Cervantes, N.; Ortíz-Lozano, J.Á.; Zermeño-De-Leon, M.E.; Solís-Pinto, A. Land subsidence and ground failure associated to groundwater exploitation in the Aguascalientes Valley. México Eng. Geol. 2013, 164, 172–186. [Google Scholar] [CrossRef]
  14. Faunt, C.C.; Sneed, M.; Traum, J.; Brandt, J.T. Water availability and land subsidence in the Central Valley, California, USA. Hydrogeol. J. 2016, 24, 675–684. [Google Scholar] [CrossRef]
  15. Gambolati, G.; Freeze, R.A. Mathematical simulation of the subsidence of Venice: 1. Theory. Water Resour. Res. 1973, 9, 721–733. [Google Scholar] [CrossRef]
  16. Biot, M.A. General theory of three-dimensional consolidations. J. Appl. Phys. 1941, 12, 155–164. [Google Scholar] [CrossRef]
  17. Gambolati, G.; Gatto, P.; Freeze, R.A. Mathematical simulation of the subsidence of Venice 2: Results. Water Resour. Res. 1974, 10, 563–577. [Google Scholar] [CrossRef]
  18. Vilarrasa, V.; Carrera, J.; Jurado, A.; Pujades, E.; Vázquez-Suné, E. A methodology for characterizing the hydraulic effectiveness of an annular low-permeability barrier. Eng. Geol. 2011, 120, 68–80. [Google Scholar] [CrossRef]
  19. Wu, Y.X.; Lyu, H.M.; Shen, S.L.; Zhou, A. A three-dimensional fluid-solid coupled numerical modeling of the barrier leakage below the excavation surface due to dewatering. Hydrogeol. J. 2020, 28, 1–15. [Google Scholar] [CrossRef]
  20. Xu, Y.Q.; Liu, G.F.; Sheng, Y.Q. Analysis and evaluation of the sealing effect of the rock-socketed underground diaphragm in deep foundation pit. Rock Soil Mech. 2013, 34, 2905–2910. [Google Scholar]
  21. Qiu, M.M.; Yang, G.L.; Duan, J.Y.; Zhang, P.R. Effect of groundwater leakage of row-pile supporting structure on deformation rule of foundation pit in sandy soil site. J. Water Resour. Water Eng. 2020, 31, 194–200. [Google Scholar]
  22. Guo, J.Z.; Cui, Z.L.; Wu, T.K.; Li, Z.S.; Li, Q.H.; Cheng, X.S. Refinement and application of variable particle-size methods in 3D discrete element modelling for large-scale problems. Build. Struct. 2022, 52 (Suppl. 2), 2443–2450. [Google Scholar]
  23. Pang, Z.Y.; Cui, W.H. Research and Practice on Identifying Defects of Waterproof Curtain for Excavation Engineering Based on Changes of Seepage Field. Urban Rapid Rail Transit. 2016, 29, 99–105+119. [Google Scholar]
  24. France, P.W. Finite element analysis of three-dimensional groundwater flow problems. J. Hydrol. 1974, 21, 381–398. [Google Scholar] [CrossRef]
  25. Wu, Y.X.; Shen, S.L.; Yin, Z.Y.; Xu, Y.S. Characteristics of groundwater seepage with cut-off wall in gravel aquifer. II: Numerical analysis. Can. Geotech. J. 2015, 52, 1539–1549. [Google Scholar] [CrossRef]
  26. Zeng, C.F.; Sun, H.Y.; Xue, X.L.; Song, W.W.; Lei, Y.; Chen, Q.N. Responses of adjacent building pile foundation to dewatering in the multi-aquifer system. China Civ. Eng. J. 2023, 56, 164–173+183. [Google Scholar]
  27. Xue, X.L.; Liao, H.; Zeng, C.F.; Liu, Y.S.; Zeng, X. Barrier effects of existing underground structures on deformation of strata induced by dewatering of foundation pits. Chin. J. Geotech. Eng. 2023, 45, 103–111. [Google Scholar]
  28. Zeng, C.F.; Bai, N.; Yuan, Z.C.; Xue, X.L.; Mei, G.X. Effect of buried depth of adjacent structure on the foundation pit deformation during pre-excavation dewatering. J. China Univ. Min. Technol. 2022, 51, 283–292. [Google Scholar]
  29. Wu, Y.X. Method of the Barrier Effect of the Waterproof Curtain on Groundwater Seepage During Dewatering in Aquifers; Shanghai Jiao Tong University: Shanghai, China, 2016. [Google Scholar]
  30. Yu, J.; Li, D.K.; Hu, Z.W.; Zheng, J.F. Analytical solution of steady seepage field of foundation pit considering the thickness of retaining wall. Chin. J. Geotech. Eng. 2023, 45, 1402–1411. [Google Scholar]
  31. Thushara, A.M.; Nagaratnam, S. Simple solutions for square and rectangular cofferdam seepage problems. Can. Geotech. J. 2018, 56, 730–745. [Google Scholar]
  32. Yu, J.; Yang, X.X.; Deng, P.B.; Chen, W.B. Analytical Solution for a Steady Seepage Field of a Foundation Pit in Layered Soil. Int. J. Geomech. 2022, 22, 04022160. [Google Scholar] [CrossRef]
  33. Brinkgreve, R.B.J. Plaxis Introductory: Student Pack and Tutorial Manual; Taylor Fransis: Abingdon-on-Thames, UK, 2010; ISBN 10:9076016100. [Google Scholar]
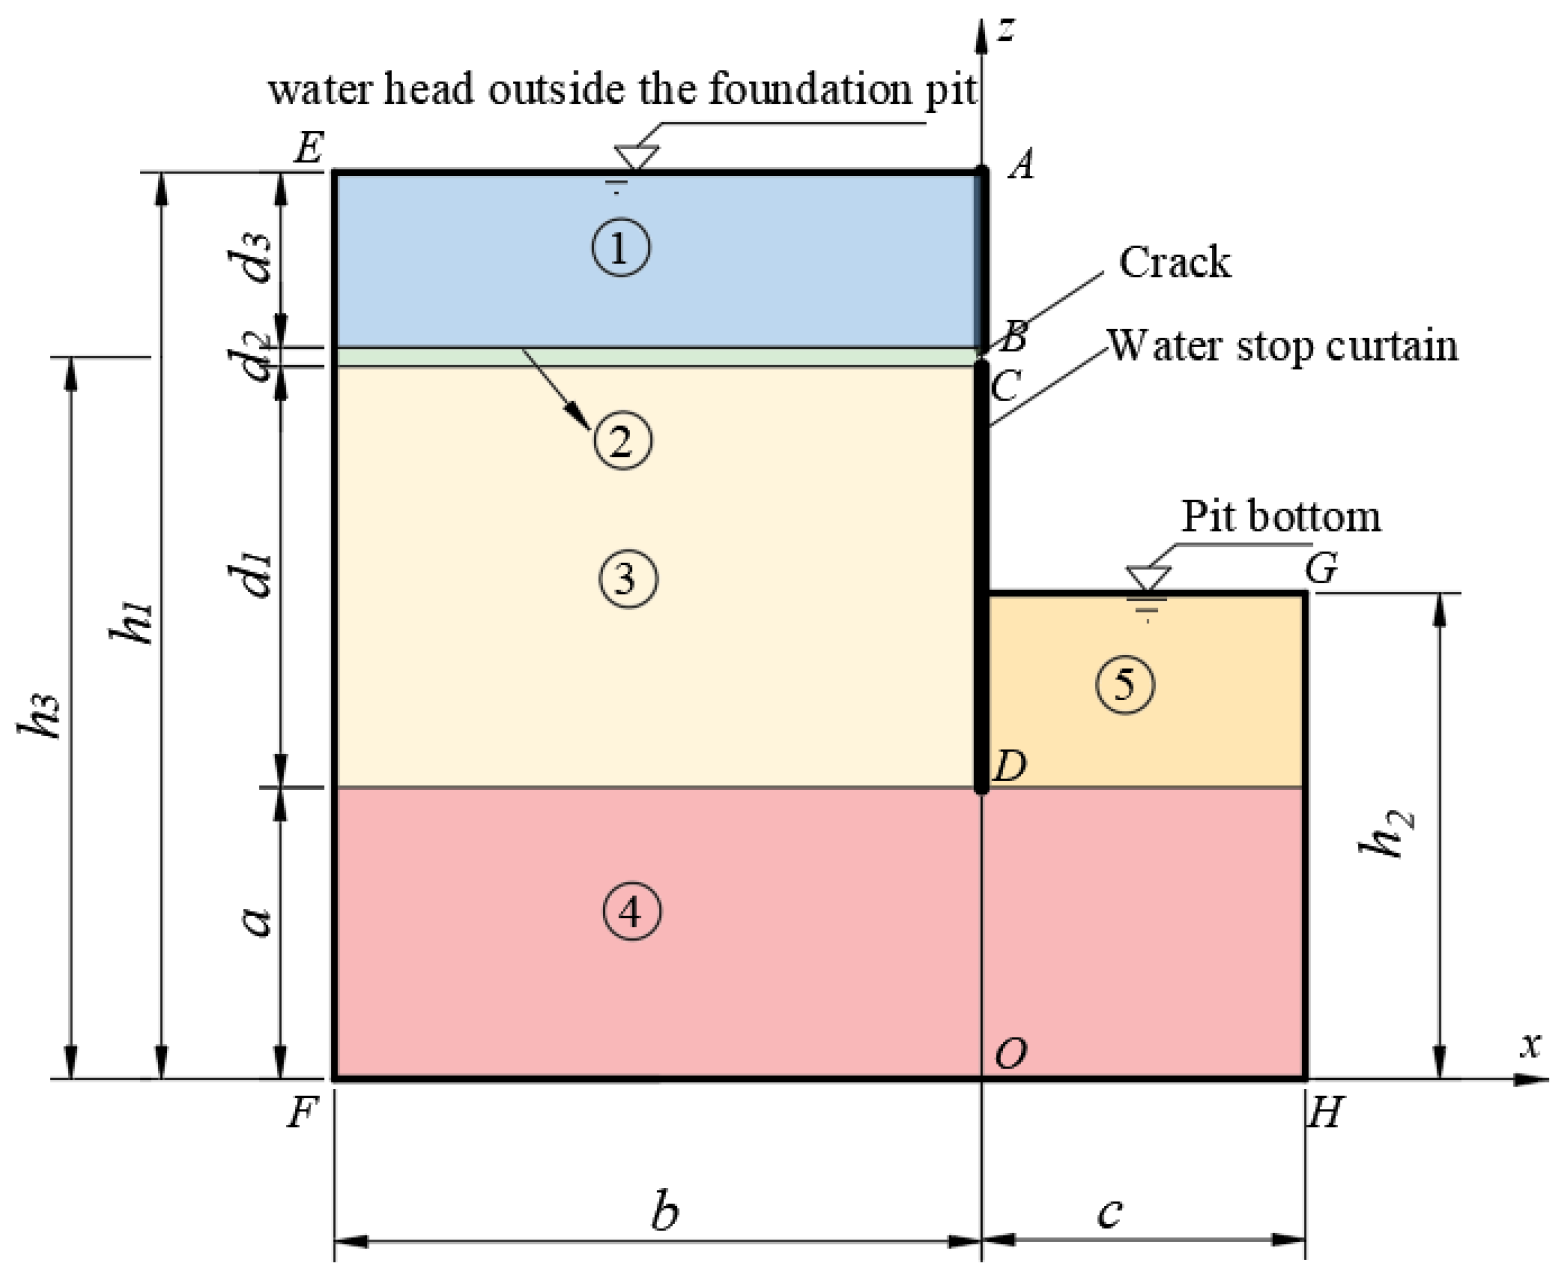
Figure 1. Two-dimensional steady-state seepage modelling of foundation pit during water curtain leakage.
Mathematics 13 00203 g001
Figure 2. Schematic diagram of finite element model meshing.
Mathematics 13 00203 g002
Figure 3. A comparison of this paper’s solution with the head calculation results of finite element software.
Mathematics 13 00203 g003
Figure 4. Comparative validation of the solution of this paper with the results of water pressure calculations in finite elements and literature [30].
Mathematics 13 00203 g004
Figure 5. A comparison of the finite element software seepage volume calculation results from the literature [29] with the solution in this paper.
Mathematics 13 00203 g005
Figure 6. The effect of d2 on the head in the vicinity of the pit.
Mathematics 13 00203 g006
Figure 7. The effect of h3 on the head in the vicinity of the pit.
Mathematics 13 00203 g007
Figure 8. A comparison of this paper’s solution with the results of the non-leakage head calculation of the water-stop curtain in the literature [30].
Mathematics 13 00203 g008
Figure 9. The effect of α on the total head distribution around the foundation pit.
Mathematics 13 00203 g009
Figure 10. Distribution of total head around foundation pit in permeable isotropic soil layer.
Mathematics 13 00203 g010
Figure 11. The effect of d2 on the surrounding water pressure after the pit reaches steady-state seepage.
Mathematics 13 00203 g011
Figure 12. The effect of h3 on the surrounding water pressure after the pit reaches steady-state seepage.
Mathematics 13 00203 g012
Figure 13. The effect of α on water pressure around the pit.
Mathematics 13 00203 g013
Figure 14. Influence of d2, h3, and α on seepage at stop curtain leakage.
Mathematics 13 00203 g014
Table 1. Parameters of the pit model.
b/mc/mh1/mh2/ma/mh3/md2/mmk/m/skh/kv
10316.811.2513.45801.00 × 10−90.5
Disclaimer/Publisher’s Note: The statements, opinions and data contained in all publications are solely those of the individual author(s) and contributor(s) and not of MDPI and/or the editor(s). MDPI and/or the editor(s) disclaim responsibility for any injury to people or property resulting from any ideas, methods, instructions or products referred to in the content.