Abstract
This paper introduces a formal mathematical framework for Digital Risk Twins (DRTs) as an extension of traditional digital twin (DT) architectures, explicitly tailored to the needs of safety-critical systems. While conventional DTs enable real-time monitoring and simulation of physical assets, they often lack structured mechanisms to model stochastic failure processes; evaluate dynamic risk; or support resilient, risk-aware decision-making. The proposed DRT framework addresses these limitations by embedding probabilistic hazard modeling, reliability theory, and coherent risk measures into a modular and mathematically interpretable structure. The DT to DRT transformation is formalized as a composition of operators that project system trajectories onto risk-relevant features, compute failure intensities, and evaluate risk metrics under uncertainty. The framework supports layered integration of simulation, feature extraction, hazard dynamics, and decision-oriented evaluation, providing traceability, scalability, and explainability. Its utility is demonstrated through a case study involving an aircraft brake system, showcasing early warning detection, inspection schedule optimization, and visual risk interpretation. The results confirm that the DRT enables modular, explainable, and domain-agnostic integration of reliability logic into digital twin systems, enhancing their value in safety-critical applications.
Keywords:
digital risk twin; digital twin; safety-critical systems; reliability engineering; mathematical modeling of risk; risk-aware decision support; resilience metrics; hazard analysis MSC:
93A15
1. Introduction
Digital twin (DT) technology has transformed how complex engineering systems are designed, monitored, and managed. A DT is a digital replica of a physical asset or process, continuously updated by operational data and capable of simulating, predicting, and optimizing system behavior [1]. Across aerospace, energy, transportation, and manufacturing, DTs enable real-time condition monitoring, predictive maintenance, and performance optimization [2].
However, most DT implementations focus privily on physical modeling and state estimation while leaving critical reliability, availability, maintainability, and safety (RAMS) aspects insufficiently formalized. As industries increasingly rely on digital ecosystems to manage safety-critical assets, from autonomous vehicles and industrial robotics to power grids and aerospace systems, new challenges emerge that exceed conventional DT capabilities. The growing interconnection between cyber and physical components introduces risks such as cascading failures, cyberattacks, and unanticipated environmental stressors. Dynamic regulatory frameworks demand not only traceable behavior but also proactive safety justification under uncertainty.
This limitation motivates the digital risk twin (DRT)—a conceptual and mathematical extension that explicitly incorporates stochastic failure processes, risk metrics, and decision-making policies [3]. Unlike conventional DTs that replicate system dynamics and states, a DRT represents “how the system may fail” and “what the consequences of failure entail.” The DRT provides a dedicated mathematical framework for quantifying risks, ensuring resilience, and guiding maintenance or operational decisions.
The interrelation between DT and DRT can be formulated as a mapping from state trajectories produced by the DT to risk trajectories evaluated by the DRT. This mapping integrates deterministic and stochastic models, reliability functions, hazard rates, and risk measures into a unified construct. Through such integration, the DRT enables coherent uncertainty quantification, derivation of RAMS indicators, and evaluation of resilience under operational and environmental stressors.
While previous studies have addressed elements of reliability modeling, probabilistic risk assessment, and digital simulation, there is a lack of a unified mathematical framework linking DTs with their risk-oriented counterparts. This paper fills this gap by developing a high-level formalization in which the DT is defined as a stochastic dynamical system equipped with estimation and simulation capabilities.
In the paper, the mathematical properties of the DT–DRT interrelation are analyzed and a framework which offers a pathway toward trustworthy, auditable, and resilient digital infrastructures capable of supporting safety-critical decision-making across engineering domains is proposed.
In infrastructure and operational domains, DTs have been extensively applied for condition monitoring and predictive maintenance. For instance, DTs have been used in aviation and to provide maintenance decisions [4]. The research [5] examines critical deficiencies in DT applications for maritime terminal operations. Similarly, urban management systems have implemented a three-tier DT framework supporting sustainable infrastructure planning [6]. An extensive analysis [7] investigates the implementation and obstacles of DT technology in electrical grid networks, analyzing their specifications, obstacles, and convergence with connected device networks and machine learning systems.
Recent research has started to bridge DTs with risk and resilience modeling. In disaster risk management, the DRT concept incorporates not only automated and human-in-the-loop data sources but also multi-disciplinary, cross-sector decision-making for enhanced hazard response [8]. Other studies focus on DTs as run-time predictive models for cyber–physical system resilience, enabling performability analysis and adaptation during operation [9]. Within structural engineering, the “Risk Twin” applies Bayesian inference for real-time risk visualization and control, advancing structural DTs toward proactive risk management [10]
Some DT frameworks apply Bayesian or graphical models to integrate multi-source data for lifecycle risk assessment. A notable example involves bridge networks, where a digital twin system uses Bayesian networks to quantify interdependencies and support infrastructure risk management [11]. Other works propose self-healing, fault-tolerant cloud-based DT architectures to enhance availability and reliability in cyber–physical platforms [12]. Valdés [13] investigated resilience enhancement in cyber–physical systems by introducing control strategies for fault tolerance and adaptive responses. In parallel, Guikema [14] examined vulnerabilities inherent to DT implementations and highlighted the necessity of modeling risk and system robustness.
One of the most structured implementations of reliability- and maintenance-aware modeling in engineering systems is represented by the Maintenance Aware Design Environment (MADE) platform developed by PHM Technology [15]. MADE provides a modular software environment that integrates failure logic modeling, reliability block diagrams, fault tree analysis, failure modes and effects analysis, and diagnostic coverage modeling, all within a unified framework for lifecycle risk assessment and design optimization.
DT-based virtual modeling systems represent an advancing technology currently enhancing surveillance of intricate networks, deployment of automated management protocols, and support during incidents and crises in immediate timeframes. The research [16] conducts a structured literature examination of virtual modeling focused on applications in protection analysis, hazard evaluation, and crisis coordination. The research [17] focuses on developing two complementary virtual models: a predictive twin for known failure patterns and a behavioral twin for anomaly detection in industrial applications. The dual digital twin approach provides comprehensive industrial Internet of Things risk surveillance by combining predictive and emergent fault detection capabilities.
Recent studies further highlight research gaps in the integration of reliability-focused methodologies into digital twin frameworks. For example, Li et al. [18] proposed a mixed-style network with batch spectral penalization for fault diagnosis of rotating machinery, demonstrating improved robustness in reliability-focused signal analysis but without extending these methods into a twin-based risk formalism. Similarly, Zhi et al. [19] introduced a chirplet transform-based method for enhanced time–frequency analysis and state estimation in nonstationary signals, advancing reliability-focused fault diagnosis but remaining domain-specific. While these works provide valuable contributions in machinery diagnostics and signal processing, they do not establish a unifying operator-chain framework. This underlines the novelty of the proposed DRT, which generalizes such approaches into a mathematically rigorous structure capable of integrating hazard modeling, risk evaluation, and decision support.
Despite growing interest in embedding risk awareness into digital twin applications, a fundamental limitation remains regarding the fragmentation of existing approaches. Prior research has often focused on specific components, such as probabilistic modeling, condition monitoring, or resilience evaluation, but lacks a unified mathematical architecture that integrates these elements into a coherent, modular framework. Furthermore, many existing DT-based systems treat risk modeling as an auxiliary layer rather than as an intrinsic part of the simulation-to-decision pipeline. As a result, current solutions fall short in supporting explainable, scenario-sensitive, and certifiable decision-making in safety-critical environments.
This article addresses these limitations by proposing the DRT as a mathematically grounded and operationally viable extension of the DT paradigm. The DRT framework incorporates stochastic failure modeling, hazard propagation, coherent risk measures, and resilience evaluation directly into the digital twin architecture, transforming traditional state replication into a risk-aware decision support system. By formalizing the DT to DRT transformation as a compositional operator chain, the framework ensures traceability, modularity, and semantic clarity from simulation outputs to risk-informed actions.
The originality of the proposed DRT lies in treating risk not as an auxiliary layer added to a digital twin, but as an intrinsic part of its computational structure. Unlike existing reliability- or risk-based DT approaches, the framework formalizes the transformation from system simulation to risk-aware outputs as a coherent operator chain, ensuring that reliability, availability, maintainability, and safety RAMS measures are embedded directly into the modeling pipeline. This provides traceable propagation of uncertainty from physical states to actionable risk metrics. Furthermore, the framework offers mathematical guarantees of stability, conservativeness, and risk refinement, which support explainability and certification in safety-critical applications. In contrast to descriptive DTs that primarily replicate system dynamics, the DRT is explicitly prescriptive, focusing on how systems may fail, what the consequences are, and how decisions can be optimized for resilience. This shift from descriptive monitoring to proactive risk-aware decision support constitutes the distinct contribution of the work.
The interrelation between DT and DRT can be formulated as a mapping from state trajectories produced by the DT to risk trajectories evaluated by the DRT (Figure 1).
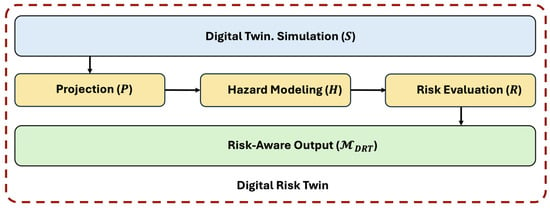
Figure 1.
DT to DRT transformation workflow.
The DRT extends a digital twin by embedding risk-oriented operators into the simulation–decision pipeline. The simulation operator produces trajectories that describe system behavior under varying conditions. These outputs are passed through the projection operator , which extracts risk-relevant features, followed by the hazard operator , which transforms these features into stochastic failure rates and reliability functions. Finally, the risk operator aggregates hazards into quantitative risk measures, such as conditional value-at-risk or resilience indices. In this way, the DRT converts descriptive digital replicas into decision-support systems capable of guiding early warnings, resilience assessment, and optimized maintenance scheduling.
The principal contributions of this work are twofold: (1) the development of a multi-layer mathematical framework for Digital Risk Twins, integrating system simulation, feature extraction, hazard dynamics, and risk functionals within a unified and interpretable structure; (2) the demonstration of this framework through a representative case study in aviation, where predictive risk modeling of an aircraft brake system illustrates the DRT’s capabilities for early warning detection, optimal inspection scheduling, and quantitative resilience analysis.
The remainder of the paper is organized as follows. Section 2 presents a mathematical description of the DRT formalism. Section 3 presents the modular architecture of the DRT and its application to a case study involving an aircraft brake system. Section 4 offers a discussion of the key findings, methodological implications, and limitations of the proposed approach and outlines directions for future research. Section 5 concludes the paper.
2. Materials and Methods
2.1. Mathematical Foundations for Digital Risk Twin Modeling
The DRT framework relies on mathematical foundations from stochastic dynamical systems, reliability modeling, and risk theory. This section introduces the necessary concepts.
2.1.1. Stochastic System Modeling and Trajectory-Based Simulation
A physical system is modeled as a controlled stochastic dynamical process:
where denotes the hidden state, the control input, the process noise, and the measurement noise. The mappings and represent the parametric dynamics and observation models.
Since the state is not directly observable, the DT maintains a belief state , which is a probability distribution over possible system states conditional on observed data
which is the probability that the system state at time equals , given all past observations and control inputs .
Future system behavior is characterized by trajectory measures. A trajectory of horizon is defined as . The notation is a compact way to write a sequence of state variables from time to time . Formally, it refers to
This represents a trajectory or rollout of the system over a time horizon of length , starting at time .
The DT induces a probability measure over trajectories:
These trajectory measures serve as the fundamental input to the risk evaluation layer of the DRT.
2.1.2. Failure Processes and Availability Models
Reliability and maintainability analysis relies on stochastic processes describing failure and repair events.
A sequence of failures can be modeled as a nonhomogeneous Poisson process with intensity function
The reliability function is [20]:
The cumulative intensity determines the reliability function
where is the time to failure.
For repairable systems with failure time and repair time system availability is [20]:
where is the expectation operator. It is also called the mean or average, for example, time to failure
where is the probability density function of . This gives the average time for which the system can be expected to operate before failure.
2.1.3. Risk Measures and Stochastic Orderings
The DRT requires mapping distributions of losses to scalar risk metrics.
In the context of the DRT framework, we define a risk functional as a mapping from a space of hazard or loss processes to the real numbers [21]:
where is a space of random variables (e.g., losses, hazards, degradation processes), and represents the real numbers, since the functional returns a scalar value that quantifies risk.
Here, denotes a suitable function space, such as the set of time-indexed failure rate trajectories , degradation signals, or probabilistic loss distributions. The output is a real-valued quantity representing a specific risk measure derived from the given process. Common examples include the expected time to failure , reliability functions , or risk-sensitive measures such as the conditional value-at-risk (CvaR). In resilience analysis, may also represent more complex functionals such as the area under a performance degradation curve or a resilience integral over time.
A risk measure is a mapping that satisfies desirable properties:
- Monotonicity if almost surely, then .
- Convexity if .
- Translation invariance if .
A widely used example is the CVaR at confidence level [21]:
where is the risk level, usually close to 1 (e.g., 0.95 or 0.99); is a real-valued threshold variable used in the optimization; is the positive part of , i.e., ; and is the infimum (greatest lower bound) over a possible threshold .
In general, CVaR reveals “What is the average loss in the worst of cases?” For example, if , CVaR tells us the expected loss in the worst 5% of scenarios.
In comparing the riskiness of random variables, we make use of the convex order, denoted by [22]. For two integrable random variables and , we write if and only if ] (equal expectations), and for all convex functions [22].
This relation implies that is less risky than under all convex risk measures—including variance, mean absolute deviation, and CVaR. Convex dominance is particularly useful in DRT analysis for comparing the outcomes of different simulation scenarios or intervention strategies. If a risk projection satisfies , then is preferable from a risk-averse decision-making perspective. This enables comparison of systems or policies with respect to their risk profiles.
2.1.4. Causal Graphs for Failure Propagation
Complex engineered systems exhibit structured dependencies among components and functions. To formally represent causal dependencies among system components in the DRT framework, we adopt the structure of structural causal models. These dependencies can be represented by a causal graph , where vertices correspond to component states or failure modes, and edges represent causal propagation between them (e.g., “Failure in node A increases failure rate in node B”). Each node is assigned a structural equation
where is the random variable or latent signal associated with node in a graph-based model, which can represent a state, measurement, or risk-related feature in a DRT framework (e.g., degradation level, failure indicator, or sensor signal); is the set of parent nodes and is exogenous noise.
Interventions expressed using Pearl’s do-operator , model corrective or preventive actions [23]. For example, corresponds to enforcing that a failure mode is mitigated by repair or design change.
Risk propagation is then computed along the graph, allowing the DRT to quantify the impact of failures, maintenance interventions, and safety measures on system-level outcomes. This causal representation ensures that reliability and safety metrics are traceable and consistent with the underlying system structure.
2.2. The DT to DRT Transformation Framework
This section develops the mathematical formulation of the interrelation between a DT and a DRT. The DT is treated as a probabilistic simulator of system trajectories, while the DRT is formulated as a risk evaluation and decision operator acting on these trajectories.
Formally, a DT is defined as a tuple
where
and represent the parametric state-transition and observation models;
is an estimator delivering belief states ;
is a simulator generating predictive trajectories .
The DT thus induces a trajectory measure on , the space of finite-horizon trajectories:
This probabilistic description captures all available information about future system evolution.
Not all state variables are equally relevant for reliability and safety. The DRT operates on risk features, defined as a projection:
Examples include load margins, stress levels, temperatures, or other indicators relevant to failure modes. The projected trajectory is
Risk features are transformed into stochastic failure intensities via a hazard map:
where denotes the set of possible failure modes.
The induced reliability function is [20]
and availability or maintainability can be derived when repair processes are included.
Each trajectory , together with a control or maintenance policy , yields a random loss
where
The DRT aggregates these losses by a coherent risk measure :
Conditional value-at-risk is particularly suitable, as it captures tail risks in safety-critical applications. It is defined in accordance with expression (1).
The overall DT with DRT interrelation can now be expressed as an operator composition
where is the DT simulation of trajectories, is the projection to risk features, is mapping to hazards, and is the risk functional on induced losses.
A trajectory denotes a finite-horizon sequence of system states generated by the simulation operator, while the loss function maps the trajectory under a control or maintenance policy to a random variable representing performance degradation or failure-related cost.
The operator (3) chain formalizes the transformation from digital state replication to risk evaluation.
Let denote the category of digital twin models, where objects are stochastic dynamical systems with estimation and simulation capabilities, and morphisms correspond to refinements such as improved system dynamics, enhanced observation models, or reduced estimation errors.
Let denote the category of risk models, where morphisms are defined by risk dominance relations, typically represented via convex order on the space of induced loss distributions.
Define the risk functor
where is the simulation operator, mapping model to a probability measure over the space of finite-horizon trajectories ; is the projection operator that extracts risk-relevant features from simulated trajectories; is the hazard mapping that transforms features into failure intensities or degradation dynamics; and is a coherent risk functional that maps induced loss processes to scalar risk metrics.
This compositional operator chain captures the transformation from simulated system dynamics to prescriptive risk evaluations.
The functor preserves structure in the following sense: if is a refinement in the category DT, then
in convex order. That is, an improved DT model yields a risk evaluation that is at least as conservative or accurate, ensuring consistency of risk interpretation across model upgrades.
The composition of operators from simulation to risk evaluation is not only a formal construct, but it also reflects a modular architecture essential for scalable, explainable digital twin systems. Each stage in the chain performs a distinct transformation: simulation generates system trajectories, projection extracts risk-relevant features, hazard modeling computes failure intensities, and risk evaluation derives actionable metrics. Structuring this process as a functional pipeline ensures that refinements in simulation models or data sources lead to traceable and consistent changes in the resulting risk outputs. This layered formulation supports modular validation, safe model substitution, and transparent integration of risk logic—key properties for applications in regulated or safety-critical domains.
The main properties of the framework can be summarized as follows:
- If the projection operator and the hazard mapping are Lipschitz-continuous [24,25], then small errors in DT state estimation propagate only as proportionally bounded errors in the resulting risk measures. This ensures robustness of the DRT against estimation uncertainties.
- If the hazard map systematically over-approximates true hazard rates, then the reliability and availability metrics computed by the DRT are guaranteed to be conservative. Such conservative estimates support certification and regulatory compliance in safety-critical domains.
- System composition is preserved: series, parallel, and standby configurations can be modeled by combining hazard processes. The DRT operator respects this compositionality, enabling scalable and modular risk modeling for complex system-of-systems architectures.
The hazard map can be refined through a causal graph , where failure modes propagate along directed edges. Interventions, represented as , model corrective maintenance or design changes.
The DRT then evaluates
where denotes loss contributions from hazardous nodes . This allows structured, explainable propagation of risk consistent with system topology.
The DT to DRT transformation operator inherits several desirable mathematical properties. We formalize these in the form of propositions.
Proposition 1. (Stability under estimation error).
Let and be Lipschitz with constants . Let the risk measure be 1-Lipschitz [24,25] with respect to the Wasserstein-1 metric [26]. If the DT provides an estimated state with expected error , then the DRT risk evaluation error satisfies
Proof.
By Lipschitz continuity,
and similarly
Since the loss is a measurable function of hazard rates, the induced distributions differ by at most this amount in Wasserstein distance. Because is 1-Lipschitz, the inequality follows. □
Proposition 2. (Soundness of conservative hazard modeling).
Suppose the hazard map used in the DRT, , over-approximates the true hazard rates
Then the reliability computed by the DRT is a lower bound on true reliability
Proof.
If the reliability function is defined by expression (2) and , then
Implying . □
Proposition 3. (Compositionality of system reliability).
Consider two independent subsystems with reliabilities . If they are connected in series, the DRT-computed reliability is
If they are connected in parallel, the reliability is
Proof.
For series composition, failure occurs if either subsystem fails; hence, reliability is the product. For parallel composition, the system fails only if both fail; hence, reliability is one minus the product of unreliabilities. The DRT respects this because it evaluates reliability from the joint hazard structure, which factorizes under independence. □
Proposition 4. (Risk refinement and convex order dominance).
Let be two DT models with trajectory measures such that the induced loss distributions satisfy (convex order). Then for any convex risk measure
Proof.
If , then for all convex . Since is convex and monotone, this dominance implies . Thus, model refinement that reduces variance or tail risk yields no greater risk measure. □
Proposition 5. (Resilience metric bounded by time-average availability).
Let denote the up/down indicator of the system at time . Let the performance (service) process satisfy
for fixed constants , where is the rate of transition from the “up” (working or operational) state to the “down” (failed or degraded) state in the CTMC, is the rate of transition from the “down” (failed) state back to the “up” (operational) state. This is the repair rate or recovery rate.
Define the finite-horizon resilience over by
Let the up/down process be a (possibly nonstationary) CTMC with failure rate and repair rate . Then
(i) Availability lower bound. For any ,
(ii) Uniform rate bounds ⇒ explicit resilience bound. If and for all , then there exist constants (depending only on the initial condition and ) such that, for all ,
and hence
(iii) Steady-state limit. If and (time-homogeneous CTMC), then
Proof.
(i) The pointwise inequality on gives
Integrate over , take expectations, divide by , and obtain the bound.
(ii) Under and , the two-state CTMC with rates is stochastically dominated in down-time and dominated from below in up-time by the given process. Standard comparison results for birth–death chains yield
for some . Averaging over yields the stated bound on ; substituting into (i) gives the resilience bound.
(iii) For homogeneous rates, the two-state continuous-time Markov chain (CTMC) is ergodic with stationary up-probability [27]. By the ergodic theorem, the time-average availability satisfies as . Substituting this limit into (i) yields the stated result. □
The DT to DRT transformation, as defined through operator composition, satisfies several structural and functional properties critical for reliability- and safety-critical systems:
- Risk metrics degrade gracefully with bounded state estimation errors (Proposition 1).
- Over-approximated hazard functions lead to conservative risk estimates, supporting safety certification (Proposition 2).
- Series and parallel subsystems can be reliably modeled via hazard function composition (Proposition 3).
- Model refinements lead to no worse risk measures under convex order (Proposition 4).
- Quantitative resilience indices can be derived from availability profiles (Proposition 5).
These guarantees allow the DRT framework to serve not only as a predictive engine but also as a provably safe and composable foundation for building scalable digital infrastructures.
2.3. DRT as a Modular Architecture and Method-Oriented Framework
The proposed DRT can be formally described not only as a mathematical operator chain but also as a modular architecture and method-oriented framework for orchestrating multi-layered reliability and resilience assessments in complex engineered systems. This abstraction is implementation-agnostic and allows practical instantiation using different modeling and simulation platforms, including those that support stochastic reliability models, risk graphs, or maintenance decision trees.
The DRT framework is structured in accordance with (3) as a functional composition. This composition defines the core analytics pipeline of a DRT, supporting both forward simulations (from scenario to risk) and backward evaluations (from risk metric to control).
In practice, this pipeline can be orchestrated using a combination of modeling tools and analytical methods, including
- Stochastic process modeling (e.g., Markov chains, renewal processes).
- Feature engineering from high-dimensional monitoring data.
- Probabilistic graphical models for hazard propagation.
- Convex and coherent risk functionals for decision layers.
- Optimization solvers for risk-aware maintenance planning.
The framework is inherently modular, enabling
- Substitution of specific modules (e.g., data-driven vs. physics-based simulation).
- Interoperability across domains (aviation, transport, power systems, etc.).
- Transparent layering of assumptions and data sources.
- Scalable implementations via containerized services or digital twin ecosystems.
Although software platforms exist that aim to support such functionalities (e.g., logic-based failure modeling or fault tree synthesis engines), this study does not rely on or endorse any particular implementation. Instead, it introduces a generalizable structure that aligns with modern digital engineering practices and provides a theoretical and operational basis for future instantiations of DRT in reliability- and resilience-critical applications.
The proposed DRT framework can be conceptually decomposed into a modular, method-oriented pipeline, where each layer performs a distinct yet interoperable function in the risk modeling chain (Figure 2).
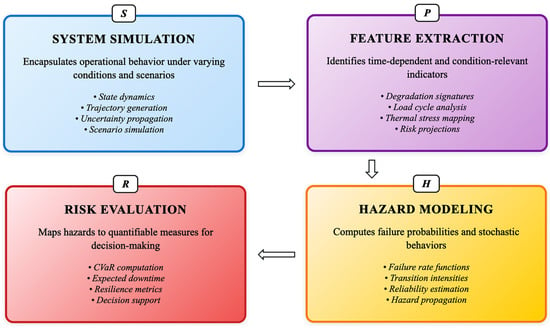
Figure 2.
Functional layers of the digital risk twin framework.
The process begins with system simulation, which encapsulates the operational behavior of the digital twin under varying conditions and scenarios. From this simulated behavior, a structured feature extraction layer identifies time-dependent and condition-relevant indicators such as degradation, load cycles, or thermal stress. These extracted features then serve as inputs for hazard modeling, where failure probabilities and stochastic behaviors (e.g., hazard functions, transition intensities) are computed. The final stage, risk evaluation, maps these hazards to quantifiable measures such as CVaR, expected downtime, or resilience loss, enabling actionable insight for maintenance planning and decision-making. This sequential architecture reflects the logical progression from data to decision, and supports modular development, validation, and deployment of each component in isolation or within a unified digital twin ecosystem.
3. Results
This section presents a representative case study to validate the proposed DRT framework in a safety-critical aviation context. Specifically, we consider the brake system of a commercial aircraft, a subsystem characterized by progressive wear, cumulative stress exposure, and operational sensitivity to load and temperature. Given its relevance to flight safety and maintenance cost, this use case provides a compelling environment for testing the risk-driven modeling and decision-making capabilities of the DRT architecture.
3.1. Overview of Use Case and System Components
The selected use case focuses on the predictive risk modeling of an aircraft brake system, a mission-critical subsystem known for its performance degradation under cyclical mechanical and thermal loads. Aircraft braking systems are subjected to extreme conditions such as high landing weights, elevated temperatures, and rapid deceleration demands. These operating conditions introduce gradual wear, stress accumulation, and potential performance instability, making brake systems ideal candidates for digital risk modeling through a DRT framework.
The primary motivation for selecting this system lies in its high failure impact, well-characterized degradation pathways, and the availability of both simulated and real-world operational data. In commercial aviation, brake system failures can lead to significant operational disruptions, maintenance delays, and safety-critical incidents. Consequently, early identification of failure risks and risk-aware maintenance planning are essential components of fleet-wide resilience.
Within the DRT framework, the brake system is modeled through a multi-layer computational architecture:
- The digital twin simulation layer replicates the physical evolution of the system across operational cycles, producing synthetic time series for core physical indicators.
- The feature extraction layer captures domain-relevant degradation signatures, specifically brake thickness wear , heat stress accumulation , and pressure loss rate .
- The hazard modeling layer computes a compound hazard rate based on these features, incorporating nonlinear and probabilistic effects that account for both slow degradation and sudden shifts (e.g., thermal spikes).
- The risk evaluation layer translates these hazard dynamics into system-level risk metrics, including CVaR, resilience score, and early warning triggers.
The brake system’s structural simplicity, coupled with its nonlinear degradation behavior and operational impact, makes it a representative and scalable use case for validating the modularity, transparency, and performance of the proposed DRT framework.
Traditional reliability models, such as constant-failure-rate assumptions or simple mean time-to-failure (MTTF) calculations, lack the capacity to dynamically respond to evolving operational states or multi-factor stress patterns. In contrast, the DRT framework introduces time-varying hazard functions that reflect real-time degradation and environmental conditions. This dynamic capability enables not only more accurate risk forecasts but also context-sensitive decision-making. The aircraft brake system, characterized by both progressive wear and sudden thermal overloads, exemplifies a domain where such capabilities outperform static reliability estimators and justify the use of risk-aware digital architectures.
3.2. Digital Twin Simulation Layer
The DT simulation layer is responsible for reproducing the behavior of the aircraft brake system under variable operational conditions. This component serves as the data-generating foundation of the DRT framework and is designed to capture realistic patterns of degradation, stress accumulation, and response variability over successive flight cycles.
To enable analysis of both typical and edge-case scenarios, we construct a synthetic simulation environment that reflects core operating features of the brake system. The simulation proceeds over a discrete time horizon of flight cycles, generating time series for three condition-relevant features:
- —brake pad thickness [mm], decreasing linearly with wear and subject to small stochastic noise representing environmental variation;
- —cumulative heat stress [arbitrary units], modeled as a nonlinear increasing function affected by load cycles and thermal dissipation;
- —pressure loss rate [%], assumed to increase modestly due to fatigue and mechanical seal wear.
The degradation processes were modeled using stylized but realistic assumptions, informed by maintenance engineering knowledge.
Brake thickness was modeled as with mm/flight, and small Gaussian noise representing fluctuations in wear per cycle. Heat stress was modeled quadratically to reflect compounding thermal effects, and pressure loss increased with a saturating trend.
Figure 3 presents the temporal evolution of three key features extracted from sensor data: brake thickness, heat stress, and pressure loss rate.
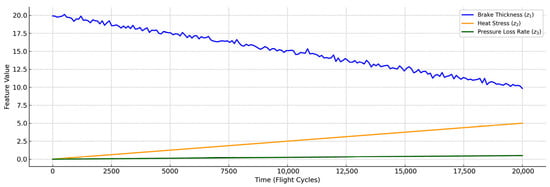
Figure 3.
Feature trajectories over time.
These features are chosen due to their relevance to the degradation and risk profile of aircraft braking systems. As shown, the brake thickness exhibits a gradual monotonic decrease due to normal wear, accompanied by small fluctuations caused by operational noise. In contrast, heat stress increases nearly linearly with usage, reflecting thermal accumulation effects under repeated braking events. The pressure loss rate, while increasing more slowly, also shows a consistent upward trend, indicating early signs of system inefficiency or leakage.
The continuous monitoring of such features enables dynamic estimation of the hazard rate and supports the implementation of proactive maintenance strategies discussed in later sections. Together, these features provide the input signal for subsequent feature projection and hazard modeling layers.
This simulation layer serves a dual purpose: first, it enables validation of the downstream layers of the DRT framework without requiring proprietary or sensitive airline data; second, it permits controlled experimentation across scenarios (e.g., stress intensification, delayed inspections), supporting sensitivity analyses and robustness checks.
The modularity of the simulation engine also allows for integration with higher-fidelity digital twins in future implementations, where physical modeling and sensor data fusion may enrich the degradation profiles beyond the current semi-synthetic setting.
3.3. Feature Extraction and Hazard Modeling
Following the generation of synthetic operational data in the simulation layer, the next stage of the DRT pipeline involves projecting this raw signal into a feature space suitable for risk modeling. The key variables of interest brake thickness , heat stress and pressure loss rate are treated as condition-based indicators that feed into a stochastic hazard model.
To ensure interpretability and model tractability, the projection step involves a normalization of each feature to a bounded, non-dimensional form, followed by the construction of a hazard rate function , defined over the operational horizon. The hazard function is designed to reflect both instantaneous risk and cumulative degradation effects, modeled via a nonlinear function
where are scaling coefficients that encode domain knowledge regarding the relative importance of brake wear, thermal loading, and pressure instability. For this case study, the parameters were empirically selected as .
This structure ensures that hazard increases with higher heat stress and pressure loss, while inversely responding to brake thickness (i.e., worn brakes increase failure probability).
Figure 4 illustrates the joint evolution of the performance level and the hazard rate of the aircraft brake system over 20,000 flight cycles.
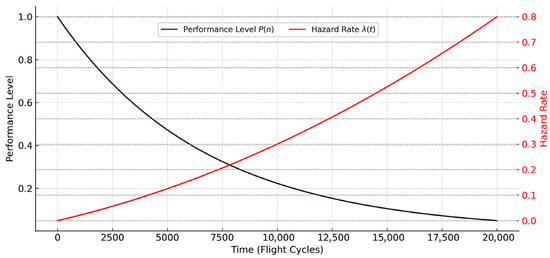
Figure 4.
Performance level and computed hazard rate as functions of flight cycles.
Performance level is defined as the normalized braking efficiency:
where is the effective braking efficiency at cycle , and is the nominal certified value at the beginning of service. Braking efficiency quantifies the ability of the brake system to convert kinetic energy into braking force, gradually declining with pad wear, thermal fade, and fatigue.
In parallel, the hazard rate increases monotonically with accumulated cycles, reflecting the growing probability of failure per cycle. The figure emphasizes their inverse relationship: as braking efficiency diminishes, the risk of failure rises.
This dual representation connects observable degradation (braking efficiency) with probabilistic failure modeling (hazard rate) and underpins the DRT framework for predictive risk analysis and resilience assessment.
The hazard rate is then treated as a conditional intensity function within a non-homogeneous Poisson process, which models the probability of system failure within a given interval. This probabilistic formulation allows integration of the hazard model into higher-order risk measures, such as CVaR and resilience metrics, in subsequent layers.
From a systems engineering perspective, this stage also plays a crucial role in separating physical degradation from abstract risk metrics, enabling modular calibration and retraining of the hazard model as more data or domain updates become available.
To illustrate the adaptability and predictive power of the DRT hazard modeling layer, we introduce a comparative simulation involving two operational profiles:
- A nominal scenario, representing regular wear and moderate thermal stress accumulation across 100 flight cycles;
- A high-stress scenario, reflecting accelerated wear due to compounded mechanical and thermal loads, simulating more adverse operational conditions.
Both scenarios were modeled using the same structural DRT pipeline, with scenario-specific inputs for degradation rate and thermal exposure. Figure 5 shows the resulting hazard trajectories. The high-stress profile exhibits earlier and more intense nonlinear hazard spikes, crossing the predefined risk threshold significantly sooner than in the nominal case. This demonstrates the DRT’s ability to detect emergent risks in real time and differentiate between seemingly similar operational states.
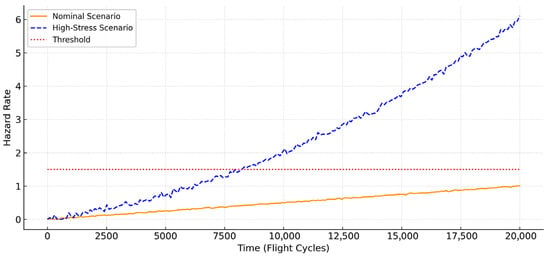
Figure 5.
Comparison of hazard trajectories: nominal vs. high-stress scenarios.
To assess how these hazard dynamics translate into risk-sensitive cost implications, CVaR was computed across a range of inspection timings. Figure 6 presents the CVaR curves for both scenarios. While both exhibit U-shaped cost profiles centered around an optimal inspection window (near cycle 65), the high-stress scenario incurs significantly greater CVaR values when inspections are delayed. This emphasizes the DRT’s utility in supporting time-critical maintenance decisions and avoiding worst-case financial outcomes under escalating degradation.
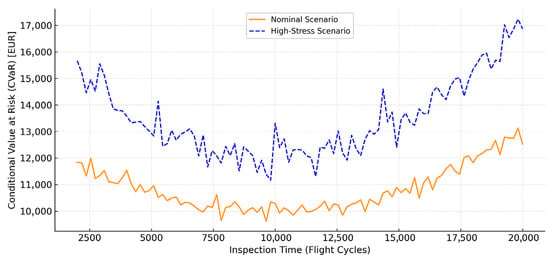
Figure 6.
CVaR comparison across inspection timing: nominal vs. high stress.
3.4. Risk Measures and CVaR Computation
Once the hazard trajectory is established, the digital risk twin framework proceeds to compute interpretable and decision-relevant risk measures. These measures quantify not only the likelihood of failure but also its impact under uncertainty, enabling data-driven optimization of maintenance actions and inspection timing.
Two primary classes of risk metrics are used in this case study:
- CvaR, a widely used coherent risk measure that captures the expected loss in the worst-case quantile of the outcome distribution.
- Resilience Index, which quantifies system robustness over time by integrating a normalized performance function , representing the system’s operational status. A high resilience score indicates sustained operational quality, while a sharp drop in reflects deteriorating serviceability or delayed recovery from failure.
To illustrate the decision-making power of these metrics, we simulate a range of inspection thresholds and compute the associated CVaR values over a fixed planning horizon. At each candidate inspection time , the hazard rate is truncated, and a Bernoulli loss model [28] is applied:
- If failure occurs before , a large cost (e.g., EUR 30,000 [29,30]) is incurred.
- If inspection is performed before failure, only inspection cost (e.g., EUR 5000 [29,30]) is applied.
The resulting loss distribution allows computation of CVaR, providing an interpretable metric of the worst-case maintenance cost for each inspection strategy. Figure 7 show that intermediate inspection times (e.g., 65–70 cycles) minimize CVaR, offering a balance between early cost and late risk.
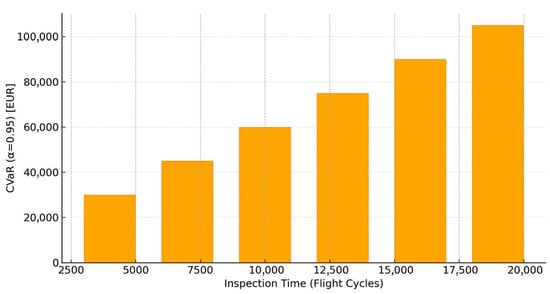
Figure 7.
Conditional value at risk.
These metrics form the foundation for the subsequent layer of the DRT pipeline—visual and structural risk interpretation, which provides explainable insights to support decision-making in safety-critical operations.
3.5. Visual Insights and Decision Maps
In safety-critical applications like aviation, decision support systems must not only be accurate but also interpretable and actionable for human operators. The visual components of the DRT, such as radar charts, early-warning overlays, and 2D decision maps, serve as cognitive bridges between complex analytics and operational insight. By translating mathematical risk models into intuitive dashboards, the DRT supports real-time human-in-the-loop maintenance workflows, reduces reliance on black-box estimations, and improves stakeholder confidence in the system’s outputs.
To enable actionable interpretation of the computed risk measures and support operational decisions, the DRT architecture integrates a series of visual analytics tools. These provide human-understandable diagnostics and help convert high-dimensional, time-dependent data into prescriptive insights for maintenance planning.
To enhance the interpretability of resilience assessment, a set of four resilience dimensions is proposed (Table 1). These dimensions capture complementary aspects of system performance under stress: (i) degradation tolerance, (ii) recovery speed, (iii) maximum performance loss, and (iv) stability. In this study, stress is defined as the combined effect of environmental and operational loads (e.g., thermal, mechanical, or usage intensity). Five representative stress scenarios (S1–S5) are analyzed, ranging from nominal operation (S1) to extreme combined load and thermal conditions (S5).

Table 1.
Definitions of resilience dimensions and stress scenarios.
Figure 8 presents the resilience profiles as a function of stress level using a line chart, which makes nonlinear deterioration patterns explicit. Degradation tolerance and recovery speed decline steadily, stability remains robust until high stress levels, and maximum performance loss accelerates sharply under compounding hazards.
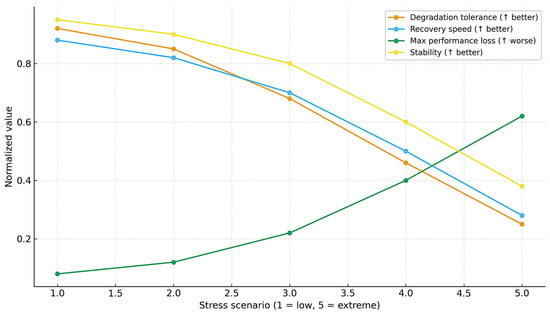
Figure 8.
Resilience dimensions versus stress scenarios.
Figure 9 shows the same data in a grouped bar chart, emphasizing trade-offs across scenarios: at low stress (S1–S2) the four dimensions remain balanced, whereas at high stress (S4–S5) degradation tolerance and recovery speed decline disproportionately while maximum performance loss dominates the profile.
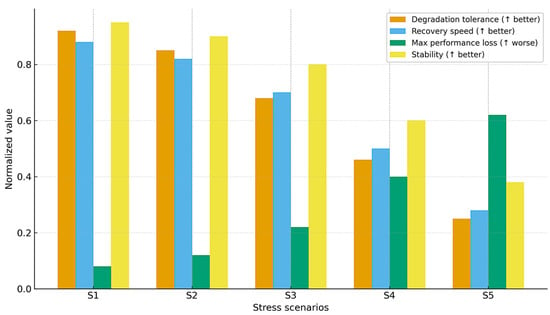
Figure 9.
Comparative resilience profiles across five stress scenarios.
Together, the table and figures demonstrate how the DRT framework translates quantitative resilience metrics into interpretable decision aids, supporting scenario-based robustness evaluation in safety-critical systems.
To demonstrate the decision-support role of the DRT, three representative maintenance strategies are considered. Delayed maintenance, also referred to as the baseline strategy (corrective, run-to-failure), performs interventions only after excessive delay or failure, which reduces short-term costs but increases risk exposure and unplanned downtime. Threshold-triggered maintenance, or the early maintenance strategy (preventive), initiates interventions once a predefined threshold such as wear, hazard value, or reliability limit is reached, thereby reducing the likelihood of failure but potentially leading to unnecessary actions if thresholds are conservative. Proactive maintenance, also called the risk-based strategy (predictive), adapts interventions dynamically using DRT-derived measures such as hazard trajectories, CVaR values, or resilience indices, balancing safety and cost through condition-aware decision-making. Together, these strategies illustrate how the DRT framework not only evaluates risks but also supports rational maintenance policies that optimize the trade-off between reliability, safety, and efficiency.
To evaluate the impact of different maintenance strategies on system risk evolution, we constructed a decision map using DRT outputs. As shown in Figure 10, the two-dimensional space is defined by the hazard index (λ-normalized) and a corresponding risk functional (CVaR).
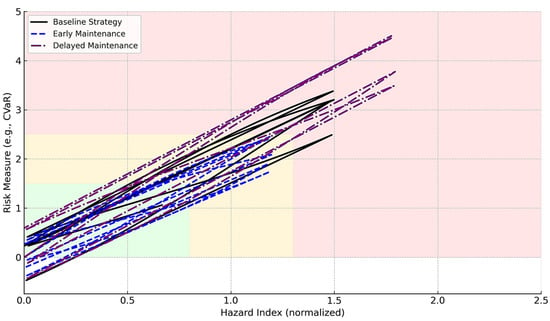
Figure 10.
Decision map with distinct system trajectories under alternative maintenance strategies.
The system’s operational state is classified into three zones:
- The safe zone (green) is characterized by low hazard levels and acceptable risk values.
- The monitoring zone (orange) indicates emerging risk that may warrant observation or adjustment.
- The intervention zone (red) signifies high-risk conditions requiring immediate action.
Each trajectory corresponds to a different strategy. The baseline strategy (black line) follows a standard maintenance schedule and enters the intervention zone intermittently. The early maintenance scenario (blue dashed line) triggers inspections and component replacements at more conservative thresholds, preventing entry into the red zone entirely. In contrast, the delayed maintenance strategy (purple dash-dotted line) postpones inspections, resulting in steeper hazard growth and prolonged exposure to critical risk.
This visualization supports scenario-based robustness evaluation and demonstrates the practical use of DRT for explainable decision-making in safety-critical operations. By comparing trajectories, decision-makers can identify control policies that minimize risk exposure over time.
To complement the graphical analysis in Figure 9, Table 2 provides a comparative summary of the three maintenance strategies in terms of their risk characteristics and operational implications. The comparison highlights how each strategy affects the system’s exposure to different risk zones, offering a compact view of the trade-offs between risk prevention, monitoring burden, and intervention delays. These attributes can inform risk-informed maintenance scheduling and real-time decision-making in safety-critical domains.

Table 2.
Comparative summary of maintenance strategies and risk profiles.
Figure 11 illustrates the time evolution of the hazard rate across three maintenance strategies: delayed maintenance (red), threshold-triggered maintenance (orange), and proactive maintenance (green). The horizontal dashed line marks the hazard threshold, beyond which system risk becomes unacceptable.
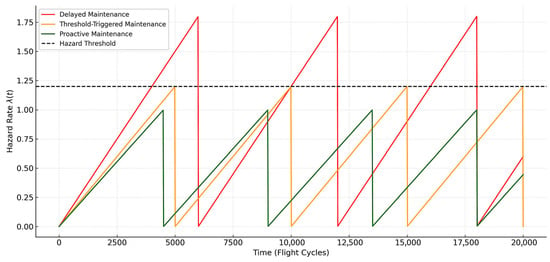
Figure 11.
Comparison of maintenance strategies on hazard rate trajectories.
Each strategy demonstrates a characteristic sawtooth behavior where the hazard rate accumulates linearly due to wear and is periodically reduced by maintenance. Delayed maintenance allows the hazard to exceed the safe threshold before intervening. Threshold-triggered maintenance activates when the threshold is reached. Proactive maintenance performs actions before the threshold is breached, reducing risk exposure and enabling more stable reliability profiles. This comparison highlights the trade-off between risk containment and intervention frequency.
The 3D surface plot at Figure 12 presents the evolution of the hazard rate over time (flight cycles) and varying levels of stress severity. The sawtooth structure along the time axis reflects periodic proactive maintenance activities, which reset the hazard rate before it exceeds the risk threshold. As stress severity increases along the vertical axis, the peak values of also rise, emphasizing the role of operational conditions in driving failure risk. This figure visually supports the benefits of proactive maintenance in constraining hazard growth and preventing critical peaks.
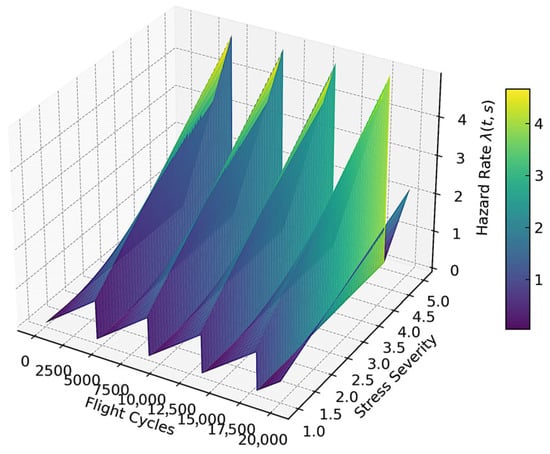
Figure 12.
Three-dimensional hazard surface under proactive maintenance.
Figure 13 illustrates the causal structure of DRT framework as a directed acyclic graph, organized across five distinct computational layers that correspond to the mathematical formulation presented in Section 2.2. The graph representation enables transparent reasoning about information flow, causal dependencies, and intervention points within the DT to DRT transformation pipeline.
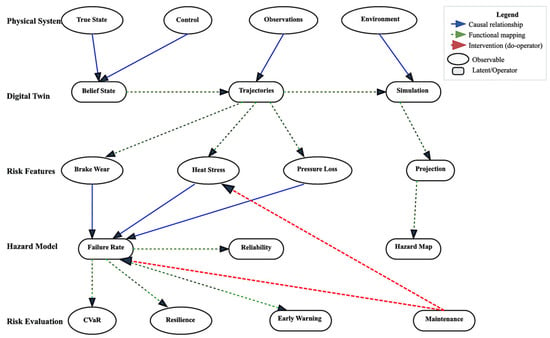
Figure 13.
Causal structure of the digital risk twin framework.
The physical system layer contains the fundamental observable variables that characterize the real-world system: true state, control inputs, sensor observations and environmental factors. These variables represent the stochastic dynamical system, where environmental noise influences both the system dynamics and measurement processes.
The digital twin layer encompasses the computational components that estimate and simulate system behavior: belief states representing probabilistic state estimates, trajectory generation for predictive simulation, and the simulation operator that produces forward-looking system behavior under various scenarios. The connection from environmental factors to the simulation component reflects how environmental parameters and noise models are incorporated into the predictive simulation process.
Risk features layer implements the projection operator that extracts risk-relevant indicators from system trajectories. In the aircraft brake system case study, these features include brake wear degradation, cumulative heat stress, and pressure loss rate. The projection operator transforms high-dimensional system states into interpretable degradation signatures that directly relate to failure mechanisms.
The hazard modeling layer applies the hazard mapping to convert risk features into stochastic failure intensities. The failure rate represents the instantaneous probability of system failure, while the reliability function provides cumulative failure probability over time.
The risk evaluation layer aggregates hazard information into actionable risk metrics through the risk functional. CVaR quantifies worst-case financial exposure, resilience metrics assess system robustness, and early warning alerts provide operational triggers. The maintenance decision node represents interventions using Pearl’s do-operator, enabling counterfactual reasoning about preventive actions.
The graph distinguishes three types of relationships through different arrow styles. Causal relationships (solid blue arrows) represent direct probabilistic dependencies following Pearl’s structural causal model framework, such as how environmental factors influence simulation processes or how degradation features causally affect failure rates. Functional mappings (dashed green arrows) indicate deterministic transformations within the DT to DRT operator chain, including the projection from trajectories to risk features and the mapping from hazards to risk measures. Intervention pathways (dashed red arrows) show how maintenance decisions can intervene on system components, enabling risk-aware control policies that modify feature trajectories or hazard processes.
This causal representation supports several key analytical capabilities. Modular inference allows individual components to be validated, calibrated, or replaced without affecting the overall framework structure. Counterfactual reasoning enables evaluation of hypothetical scenarios, such as “What would the risk level be if maintenance had been performed at cycle 50?” Traceable propagation ensures that changes in physical measurements can be systematically traced through feature extraction, hazard modeling, and risk evaluation to final decisions. Intervention analysis supports optimization of maintenance policies by modeling the causal effects of different action strategies on system-level risk outcomes.
This layered architecture reflects the mathematical progression from raw sensor data to prescriptive maintenance decisions, providing a formal foundation for implementing DRT in safety-critical applications where transparency, traceability, and causal reasoning are essential for operational acceptance and regulatory compliance.
Figure 14 visualizes a 2D decision map based on projected feature values (brake thickness and heat stress). It defines “Safe”, “Caution”, and “Critical” zones, enabling real-time classification of system health status and providing interpretable feedback to operators or predictive maintenance systems.
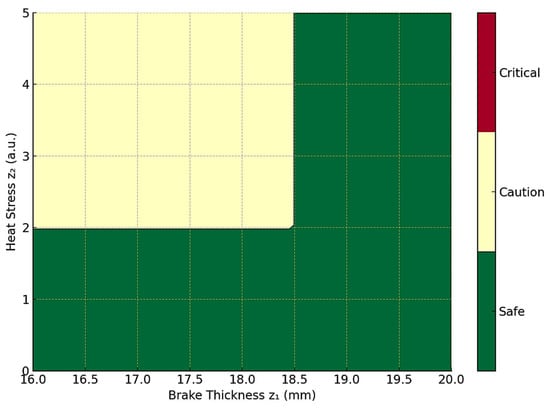
Figure 14.
Decision map based on feature zones.
Each zone encodes a combination of extracted features (e.g., degradation indicators, hazard intensities, or reliability margins) and the associated decision rules. By mapping trajectory-derived features into these regions, the decision map provides a visual and interpretable representation of when to continue operation, initiate inspection, or enforce corrective actions. This zone-based structure supports explainable decision-making, enabling operators and regulators to trace risk assessments back to measurable system features. Furthermore, it highlights the modularity of the DRT approach: alternative risk metrics or hazard functions can be incorporated without altering the overall geometry of the decision map.
Together, these visual tools enhance the explainability and transparency of the DRT, facilitating its integration into safety-critical workflows where trust, interpretability, and timing are essential.
3.6. Discussion of Key Findings
The empirical validation through the aircraft brake system case study demonstrates the operational viability and theoretical soundness of the proposed Digital Risk Twin framework. The results provide evidence for several critical aspects of risk-aware digital twin architectures in safety-critical applications.
The modular decomposition of the DRT pipeline into distinct computational layers facilitates transparent uncertainty propagation from observational data to strategic decision criteria. This architectural separation enables systematic validation of individual components while maintaining compositional guarantees for the integrated framework. Furthermore, the modular structure supports adaptive model refinement as empirical data availability and domain expertise evolve, addressing a fundamental limitation of monolithic reliability modeling approaches.
The formulation of the hazard function as a nonlinear combination of exponential, quadratic, and linear feature dependencies captures the complex, non-monotonic degradation patterns characteristic of engineering systems under multi-factorial stress. The empirical hazard trajectories exhibit sensitivity amplification whereby modest variations in system parameters manifest as substantial changes in failure probability—a phenomenon consistent with established reliability engineering principles but often inadequately represented in homogeneous Poisson failure models. This sensitivity underscores the necessity of continuous, feature-level risk monitoring in dynamic operational environments.
The optimization of inspection scheduling through risk-sensitive metrics, particularly conditional value at risk, yields actionable maintenance policies that balance competing economic objectives under uncertainty. The identification of intermediate inspection thresholds as CVaR-minimizing strategies corroborates theoretical predictions from stochastic control theory regarding the optimality of risk-constrained decision policies. This result provides empirical validation for the integration of coherent risk measures within digital twin architectures, advancing beyond purely expectation-based maintenance planning.
The visual analytics components serve dual functions as interpretability tools and cognitive interfaces for human–machine collaboration in maintenance decision-making. The radar charts, decision surfaces, and temporal overlays translate high-dimensional risk dynamics into intuitive representations accessible to domain experts across organizational hierarchies. Such visualization capabilities address a critical gap in current digital twin implementations, where complex analytical outputs often remain opaque to operational personnel.
The robustness analysis across varying degradation scenarios confirms the framework’s adaptability to operational heterogeneity while preserving structural consistency. The DRT’s capacity to discriminate between nominal and high-stress operational profiles through early risk signature detection validates the theoretical claims regarding the framework’s sensitivity to evolving system conditions. This adaptability is particularly relevant for applications in stochastic operational environments where system behavior exhibits significant temporal and contextual variation.
The most significant contribution lies in the establishment of a formal bridge between descriptive digital twin capabilities and prescriptive decision-making frameworks. Traditional digital twin implementations primarily serve monitoring and diagnostic functions, while the DRT architecture enables direct integration of risk quantification with strategic intervention planning. This transformation from passive observation to active risk management represents a fundamental advancement in digital twin methodology, with implications extending beyond individual asset management to system-of-systems applications.
The findings collectively support the proposition that Digital Risk Twins constitute a necessary evolution of digital twin technology for safety-critical applications. The framework’s generalizability across domains, demonstrated through its domain-agnostic mathematical formulation and modular implementation architecture, positions it as a foundational technology for next-generation risk-aware digital infrastructures in transportation, energy, and industrial systems where reliability and resilience are paramount operational requirements.
4. Discussion
4.1. From Representation to Risk-Oriented Decision Support: Advancing DT Through DRT
This research establishes a mathematically rigorous framework for DRTs as a reliability- and resilience-oriented extension of conventional digital twin paradigms. The proposed architecture transcends traditional passive monitoring by integrating structured risk logic as a fundamental computational layer, enabling predictive, transparent, and risk-informed decision-making in safety-critical applications.
The principal contribution resides in the formal unification of mathematical rigor with operational applicability. The integration of stochastic hazard modeling, coherent risk measures including conditional value at risk, and resilience-based optimization constraints provides a theoretically sound foundation for decision-making under uncertainty. The modular architecture (encompassing system simulation, feature projection, hazard modeling, and risk evaluation) ensures interpretability, adaptability, and systematic extensibility across diverse engineering applications.
The aircraft brake system case study validates the framework’s operational viability in supporting early-warning detection, inspection schedule optimization, and quantitative resilience assessment. The results establish the necessity of dynamic hazard modeling and demonstrate the efficacy of visual diagnostic tools in facilitating expert interpretation and reducing decision-making latency.
The DRT architecture exhibits substantial potential for scalability and cross-domain applicability extending beyond the presented use case. Prospective applications encompass energy infrastructure systems, smart manufacturing environments, healthcare device monitoring, and critical logistics networks—domains characterized by complex risk evolution and system interdependencies that exceed the capabilities of static analytical approaches. The DRT paradigm addresses these requirements by establishing risk quantification as a first-class computational component rather than a derivative analytical output.
Practical deployment requires consideration of computational scalability, real-time data integration, and system responsiveness. The operator-chain architecture (simulation → projection → hazard modeling → risk evaluation) supports parallel processing and containerized deployment, enabling scalable execution across distributed infrastructures. Critical implementation challenges include maintaining low-latency, fault-tolerant operation in safety-critical domains through containerized microservices, distributed messaging, and redundant processing protocols.
The modular DRT framework facilitates broad applicability across safety-critical sectors. Applications include energy infrastructure for cascading failure anticipation and resilience strategies; automotive systems for predictive interventions in autonomous vehicles; healthcare for patient-device monitoring with embedded risk guarantees. The modular DT to DRT operator chain enables domain-specific hazard model integration without architectural modification, while formal risk logic integration aligns with evolving regulatory frameworks, providing auditable, mathematically coherent foundations for certification-ready digital infrastructures.
4.2. Challenges and Limitations of the Study
While this study presents a structured and computationally viable framework for DRT modeling, several challenges and limitations should be acknowledged. These span both the theoretical formulation and the practical application of the proposed approach.
The validation scenario in this work, based on an aircraft brake system, relies on semi-synthetic data constructed from stylized degradation models and manually tuned hazard parameters. While this provides conceptual clarity and allows controlled experimentation, it does not fully reflect the complexity and noise inherent in real-world operational data.
The hazard function and CVaR model coefficients used in this study were selected based on expert information. This limits the external validity of the specific numerical results and may not generalize to other systems or domains.
The case study is focused on a single failure mode (brake degradation) in isolation from the broader aircraft system. In practice, risk evolves through multi-modal and interdependent failure processes, where cascading effects (e.g., from landing gear, hydraulic systems, or environmental interactions) are common. The current formulation does not yet incorporate joint hazard propagation models, which are essential for complex system-of-systems applications.
The inspection optimization scenario is constructed using a simplified binary cost model (inspection vs. failure). However, real-world decisions typically involve multi-layered cost structures, including operational delays, warranty policies, contractual penalties, and mission-critical constraints.
Although the DRT pipeline is modular by design, real-time integration into operational workflows poses challenges. These include maintaining low-latency processing, synchronizing multi-source data feeds, and ensuring fault-tolerant system behavior.
4.3. Future Research Directions
The digital risk twin framework introduced in this work opens multiple promising avenues for theoretical refinement, methodological extension, and practical deployment.
While the current formulation emphasizes mathematically defined hazard functions and risk metrics, future research may explore hybrid architectures that combine data-driven approaches (e.g., deep learning, Gaussian processes) with structured stochastic models. Such integration can improve performance in scenarios with partially observed systems, nonlinear dependencies, or multi-modal degradation patterns. For example, learned surrogates for simulation or hazard functions could enhance scalability in large digital twin ecosystems.
Future research could extend the DRT framework to support multi-component systems, where failures in one unit (e.g., landing gear) influence risk in others (e.g., brake system or avionics). This calls for scalable causal graph structures, intervention-aware modeling, and distributed inference schemes, enabling digital twins to reflect true system-of-systems behavior.
To support industrial and regulatory adoption, especially in aviation, energy, or healthcare, future DRT systems will require formal verification of risk logic. Research into certifiable DRT architectures with verifiable bounds on false alarms, resilience loss, or decision regret will help ensure that these systems meet rigorous safety standards and remain trustworthy under model drift or adversarial conditions.
As interest in digital twins grows across sectors, there is a need for standardized representations of risk logic, interoperable models, and reusable components. Future work could focus on developing open-source libraries and semantic ontologies to accelerate adoption.
Another direction involves integrating DRT outputs into multi-period cost models and lifecycle optimization frameworks. This includes computing net present value of different maintenance policies under uncertainty, or optimizing inventory, personnel, and asset utilization based on DRT risk forecasts.
These research directions reflect a broader ambition: to elevate digital twins from passive observers of complex systems to active orchestrators of safe, reliable, and resilient operations with mathematical guarantees, transparent logic, and cross-domain applicability.
5. Conclusions
This paper proposed a mathematically grounded and operationally oriented framework for DRTs, extending the traditional DT concept to explicitly capture aspects of reliability, maintainability, and resilience. Unlike standard digital twins, which primarily serve as mirrors of system behavior, the DRT is designed as a decision-support architecture, integrating stochastic hazard modeling, risk-sensitive optimization, and interpretable metrics such as CVaR and resilience indices.
A layered modeling structure was introduced (spanning system simulation, feature extraction, hazard projection, and risk evaluation) allowing for modularity, explainability, and adaptability across domains. Formal propositions were provided to define key mathematical properties, such as risk dominance, convexity, and resilience bounds. The approach was validated through a case study focused on the aircraft brake system, demonstrating how the DRT enables early warning triggers, cost–risk trade-off analysis, and actionable inspection scheduling.
The study illustrates how mathematically principled methods can be effectively embedded into digital twin environments to create trustworthy, transparent, and adaptive risk intelligence tools. Furthermore, it establishes the foundation for scalable extensions, including integration into multi-component systems, human-in-the-loop decision frameworks, and hybrid machine learning architectures.
While challenges remain in real-world calibration, multi-modal risk propagation, and operator interaction, the DRT framework provides a clear path forward toward the realization of resilience-aware digital ecosystems. As industries continue to digitize their operations, the inclusion of risk-aware logic at the twin level will be essential for sustaining performance, safety, and long-term system value.
Funding
This research received no external funding.
Data Availability Statement
The original contributions presented in this study are included in this article. Further inquiries can be directed to the corresponding author.
Conflicts of Interest
The author declares no conflicts of interest.
References
- Grieves, M. Digital Twin: Manufacturing Excellence through Virtual Factory Replication; White Paper. 2014, pp. 1–7. Available online: https://www.researchgate.net/publication/275211047_Digital_Twin_Manufacturing_Excellence_through_Virtual_Factory_Replication (accessed on 2 September 2025).
- Errandonea, I.; Beltrán, S.; Arrizabalaga, S. Digital Twin for Maintenance: A Literature Review. Comput. Ind. 2020, 123, 103316. [Google Scholar] [CrossRef]
- Thorn, A.C.; Conroy, P.; Chan, D.; Stecki, C. The Digital Risk Twin—Enabling Model-Based RAMS. In Proceedings of the 2023 Annual Reliability and Maintainability Symposium (RAMS), Orlando, FL, USA, 23–26 January 2023; pp. 1–6. [Google Scholar] [CrossRef]
- Kabashkin, I. Digital Twin Framework for Aircraft Lifecycle Management Based on Data-Driven Models. Mathematics 2024, 12, 2979. [Google Scholar] [CrossRef]
- Zhu, M.; Calderon, C.; Ford, A.; Robson, C.; Jin, J. Digital Twin for Resilience and Sustainability Assessment of Port Facility. Sustain. Resilient Infrastruct. 2025, 1–34. [Google Scholar] [CrossRef]
- Villani, L.; Gugliermetti, L.; Barucco, M.A.; Cinquepalmi, F. A Digital Twin Framework to Improve Urban Sustainability and Resiliency: The Case Study of Venice. Land 2025, 14, 83. [Google Scholar] [CrossRef]
- Mchirgui, N.; Quadar, N.; Kraiem, H.; Lakhssassi, A. The Applications and Challenges of Digital Twin Technology in Smart Grids: A Comprehensive Review. Appl. Sci. 2024, 14, 10933. [Google Scholar] [CrossRef]
- Ghaffarian, S. Rethinking Digital Twin: Introducing Digital Risk Twin for Disaster Risk Management. NPJ Nat. Hazards 2025, 2, 79. [Google Scholar] [CrossRef]
- Flammini, F. Digital Twins as Run-Time Predictive Models for the Resilience of Cyber-Physical Systems: A Conceptual Framework. Philos. Trans. R. Soc. A 2021, 379, 20200369. [Google Scholar] [CrossRef] [PubMed]
- Wang, Z.; Wang, Z. Risk Twin: Real-Time Risk Visualization and Control for Structural Systems. arXiv 2024, arXiv:2403.00283. [Google Scholar] [CrossRef]
- Geng, Z.; Zhang, C.; Jiang, Y.; Pugliese, D.; Cheng, M. Integrating Multi-Source Data for Life-Cycle Risk Assessment of Bridge Networks: A System Digital Twin Framework. J. Infrastruct. Preserv. Resil. 2025, 6, 9. [Google Scholar] [CrossRef]
- Saxena, D.; Singh, A.K. A Self-Healing and Fault-Tolerant Cloud-Based Digital Twin Processing Management Model. IEEE Trans. Ind. Inform. 2025, 21, 4233–4242. [Google Scholar] [CrossRef]
- Valdés, V.; Zaidi, F.; Cavalli, A.R.; Mallouli, W. A Resilience Component for a Digital Twin. In Foundations and Practice of Security: FPS 2023; Mosbah, M., Sèdes, F., Tawbi, N., Ahmed, T., Boulahia-Cuppens, N., Garcia-Alfaro, J., Eds.; Lecture Notes in Computer Science; Springer: Cham, Switzerland, 2024; Volume 14552. [Google Scholar] [CrossRef]
- Guikema, S.; Flage, R. Digital Twins as a Security Risk? Risk Anal. 2025, 45, 269–273. [Google Scholar] [CrossRef] [PubMed]
- PHM Technology. MADE—Maintenance Aware Design Environment. Available online: https://www.phmtechnology.com/made/made-overview (accessed on 2 September 2025).
- Zio, E.; Miqueles, L. Digital Twins in Safety Analysis, Risk Assessment and Emergency Management. Reliab. Eng. Syst. Saf. 2024, 246, 110040. [Google Scholar] [CrossRef]
- Kien, D.T.; Colcha Ortiz, R.V.; Özker, A.N.; Pozo Safla, E.R.; Misnan, M.S.; Phorah, K. Digital Twin Technology for Real-Time Risk Management in Industrial IoT Systems. J. Inf. Syst. Eng. Manag. 2025, 10, 1124–1133. [Google Scholar]
- Li, X.; Yu, T.; Zhang, F.; Huang, J.; He, D.; Chu, F. Mixed style network based: A novel rotating machinery fault diagnosis method through batch spectral penalization. Reliab. Eng. Syst. Saf. 2025, 255, 110667. [Google Scholar] [CrossRef]
- Zhi, S.; Niu, Y.; Ma, L.; Wu, H.; Shen, H.; Wang, T. Local Entropy Selection Scaling-extracting Chirplet Transform for Enhanced Time-Frequency Analysis and Precise State Estimation in Reliability-Focused Fault Diagnosis of Non-stationary Signals. Eksploat. Niezawodn. Maint. Reliab. 2025. [Google Scholar] [CrossRef]
- Barlow, R.E.; Proschan, F. Statistical Theory of Reliability and Life Testing: Probability Models; Holt, Rinehart and Winston: New York, NY, USA, 1975. [Google Scholar]
- Rockafellar, R.T.; Uryasev, S. Optimization of Conditional Value-at-Risk. J. Risk 2000, 2, 21–41. [Google Scholar] [CrossRef]
- Shaked, M.; Shanthikumar, J.G. Stochastic Orders; Springer: New York, NY, USA, 2007. [Google Scholar] [CrossRef]
- Pearl, J. Causality: Models, Reasoning, and Inference, 2nd ed.; Cambridge University Press: Cambridge, UK, 2009. [Google Scholar] [CrossRef]
- Searcóid, M.Ó. Metric Spaces; Springer: London, UK, 2007. [Google Scholar] [CrossRef]
- Khalil, H.K. Nonlinear Systems, 3rd ed.; Prentice Hall: Upper Saddle River, NJ, USA, 2002. [Google Scholar]
- Vallender, S.S. Calculation of the Wasserstein Distance between Probability Distributions on the Line. Theory Probab. Appl. 1974, 18, 784–786. [Google Scholar] [CrossRef]
- Rubino, G.; Sericola, B. Markov Chains and Dependability Theory; Wiley: Hoboken, NJ, USA, 2014. [Google Scholar]
- Ross, S.M. Introduction to Probability Models, 12th ed.; Academic Press: Cambridge, MA, USA, 2019. [Google Scholar]
- Ackert, S. Basics of Aircraft Maintenance Reserve Development and Management; Aircraft Monitor: San Francisco, CA, USA, 2012; Available online: https://www.aircraftmonitor.com/uploads/1/5/9/9/15993320/basics_of_aircraft_maintenance_reserves___v1.pdf (accessed on 2 September 2025).
- Richardson, M. How Much Do Aircraft Components Actually Cost? Aerospace Manufacturing. 21 July 2025. Available online: https://www.aero-mag.com/how-much-do-aircraft-components-actually-cost (accessed on 2 September 2025).
Disclaimer/Publisher’s Note: The statements, opinions and data contained in all publications are solely those of the individual author(s) and contributor(s) and not of MDPI and/or the editor(s). MDPI and/or the editor(s) disclaim responsibility for any injury to people or property resulting from any ideas, methods, instructions or products referred to in the content. |
© 2025 by the author. Licensee MDPI, Basel, Switzerland. This article is an open access article distributed under the terms and conditions of the Creative Commons Attribution (CC BY) license (https://creativecommons.org/licenses/by/4.0/).