Abstract
High-quality development highlights the importance of environmental protection and green low-carbon development. The high-quality development of the manufacturing industry is not only the key content for achieving green transformation, but also an important cornerstone for building a modern national industrial system. Current research focuses on companies and governments, ignoring the important value of suppliers and consumers. As a result, existing mechanisms have failed to deliver the desired results. This paper constructs an evolutionary game model involving manufacturing enterprises, local governments, suppliers, and consumers, and systematically analyzes the strategy selection process of the four participating populations. On this basis, the impact of exogenous and endogenous factors on the evolutionarily stable strategy is studied at the microscopic level using numerical simulation methods. The results show that (1) increasing any of the endogenous factors, such as innovative capability, organization building, and industrial resources, can accelerate the evolution of manufacturing enterprises evolve to smart upgrade strategy. (2) Increasing any one of the exogenous factors, such as policy environment, industrial cooperation, and market demand, can accelerate the rate at which manufacturing enterprises choose to adopt the strategy of smart upgrade. The purpose of this paper is to provide a theoretical reference for the behavioral strategies of manufacturing enterprises, and to provide a realistic reference for local governments to build a mechanism to promote the high-quality development of the manufacturing industry.
Keywords:
manufacturing industry; endogenous and exogenous factors; four-party evolutionary game; behavioral strategy; high-quality development MSC:
91A22
1. Introduction
In the context of the profound changes in the global economic landscape and the continuous surge of technological innovation, the high-quality development of the manufacturing industry [1], as the cornerstone of the national economy, has become a focal point for countries. Especially in China, As the economy shifts towards deep optimization and efficient growth, comprehensive innovation and intelligent upgrading of the manufacturing industry become particularly crucial [2,3]. High-quality development (hereinafter referred to as HQD) is a new development model proposed by the Chinese government [4,5]. Its essence is efficient, fair, and green sustainable development with the goal of achieving a better life [6,7]. High-quality development of manufacturing industry (hereinafter referred to as HQDMI) refers to a high-level sustainable development that, under the guidance of the new development concepts, achieves low input of production factors, high efficiency in resource allocation, strong strength in quality improvement, excellent ecological and environmental quality, and good economic and social benefits throughout the entire process of production, manufacturing and sales [8,9]. The transformation of this development model is not only in line with the trend of global economic development [10,11], but also an inevitable requirement for China’s economic transformation and upgrading. As a new development model, the HQDMI is affected by both endogenous and exogenous factors.
In the research on endogenous factors in HQDMI, scholars mainly focus on factors such as innovative capability, industrial resources, and organization building. The three endogenous factors not only profoundly affect HQDMI, but also constitute the key driving force for its development. Specifically, (1) innovative capability is the core driving force for the HQDMI. In the context of increasingly fierce global competition, the improvement of innovative capability can help the manufacturing industry achieve technological breakthroughs and industrial upgrading [12]. In the study on the impact of innovative capability on HQDMI, Han and Ren [13] and Liu and Wang [14] found that innovation elements are a major factor in the HQDMI. The stronger the innovative capability, the more conducive it is to shortening the innovation cycle. (2) Organization building is an important guarantee for the HQDMI. An efficient and flexible organization structure and management system can help enterprises quickly respond to market changes and improve operational efficiency [15]. In the study on the impact of organization building on the HQDMI, Mathieu [16] found that organization capacity and corporate cultural willingness have an impact on the successful strategic transformation of the manufacturing industry. Meanwhile, the research of Hu and Hu [17] further elucidates the unique soft resources such as organization building within enterprises, which have crucial strategic significance for promoting sustainable development of enterprises. Therefore, organization building such as human capital, style building, and corporate culture have a significant promoting effect on the HQDMI. (3) Industrial resources are the material foundation for the HQDMI. Rich industrial resources help reduce production costs and improve product quality for enterprises. In the study of the impact of industrial resources on manufacturing enterprises, Pang [18] believes that a reasonable industrial structure can optimize resource allocation, enhance the synergistic effect of the industrial chain, and promote the HQDMI; Song [19] asserts that the HQDMI is frequently constrained by a fragile industrial foundation. Therefore, as key industrial resource elements, the industrial foundation and industrial structure exert a profound influence on the achievements of the HQDMI.
In the research on exogenous factors in HQDMI, scholars mainly focus on policy environment, industry cooperation, and market demand. They believe that these three types of exogenous factors also play an irreplaceable role in HQDMI. Specifically, (1) the policy environment is an important support for the HQDMI. A fair, just, and transparent policy environment helps stimulate the innovation vitality of enterprises. Local government should improve relevant regulations, strengthen intellectual property protection, and provide strong guarantees for the HQDMI [20]. In the study of the impact of policy environment on the HQDMI, the scholar Shao [21] believes that legal and financial business environments can promote the HQD of enterprises; Zhang and Yao [22] found that industrial policies have a promoting effect on the HQDMI and are an essential main driving force; Liang [23] believes that industrial greening and green industrialization are the directions of industrial transformation, and a diversified and balanced open system is an important driving force for the HQDMI. Therefore, a supportive policy environment can reduce the transaction costs of enterprises, improve the collaborative efficiency of industries, and enhance the benefits of manufacturing enterprises actively participating in HQD. (2) Industrial cooperation is a key link in HQDMI. Strengthening industry cooperation with international partners can help achieve deep integration of industrial and supply chains, and enhance the overall efficiency and competitiveness of the manufacturing industry. In the study of the impact of industry cooperation on HQDMI, Song and Yang [24] believe that the modernization of the industrial chain and supply chain is an important driving force for promoting HQD and driving the conversion of kinetic energy; Zhang [25] believes that under spatial heterogeneity, industrial agglomeration can promote the upgrading of manufacturing structure and promote HQD of industries. Guo [26] found through research that intelligent technology has an important impact on promoting industrial structure transformation and upgrading, and achieving HQD. Therefore, enhancing the level and depth of industrial cooperation can significantly promote the modernization process of cooperation mode; Improving the level of industrial digitization can promote industrial development towards high-end, intelligent, and green development, ultimately accelerating the HQDMI. (3) Market demand is the fundamental driving force for the HQDMI. Closely monitoring the changing trends in global market demand can help manufacturing enterprises adjust their product structure and market strategies in a timely manner to meet market demand. Facing with the comprehensive impact of various endogenous and exogenous factors, in order to adapt to environmental changes, manufacturing enterprises will gradually adjust their own strategies and corporate behavior. Market demand has a promoting effect on enhancing the core competitiveness of enterprises. Qi et al. [27] found that customer participation demand provides impetus for the development of the manufacturing industry in the digital economy; Subin et al. [28] believe that a competitive orientation helps companies develop new products and services that are different from those of competing companies. Therefore, expanding market demand can increase the degree of market competition, force enterprises to pursue core technological progress to enhance market competitiveness, and bring external impetus for HQD to enterprises.
Along with the involvement of endogenous and exogenous factors, the HQDMI also involves the mutual influence of multiple stakeholders such as manufacturing enterprises, local governments, suppliers, and consumers. Only by comprehensively and deeply considering these endogenous and exogenous factors, and fully coordinating the comprehensive role of the four stakeholders, can the manufacturing industry truly achieve high-quality and sustainable development.
In the above process, various factors interact with each other and subjects constrain each other. In order to adapt to complex environmental changes, manufacturing enterprises must dynamically adjust their own strategies and corporate behavior, gradually achieving HQD. Therefore, the HQDMI is a dynamic evolution process. The evolutionary game model [29,30] provides an important tool for the dynamic evolution analysis of systems. Based on evolutionary game theory, comprehensively analyzing the behavior strategy selection of various groups in the process of HQDMI, clearly understanding the evolution mechanism of HQDMI, comprehensively grasping the internal laws of HQDMI have become important issues that urgently need to be solved at this stage.
After reviewing the existing literature, we found that there are still certain limitations in the current research on the evolution mechanism of HQDMI. Firstly, current research on HQDMI mainly focuses on two party games (such as government and enterprises [31], leading enterprises and follower enterprises [32], and enterprises and the public [33]) and tripartite games (such as the study of the tripartite game between follower enterprises, leading enterprises, and local governments [34], as well as the study of the tripartite game between government, firms and the public [35]). Obviously, the study of evolutionary game strategies among the four stakeholder populations of local government, manufacturing enterprises, suppliers, and consumers is of greater theoretical significance than the analysis of evolutionary games between two and three parties. Thus, it is an urgent problem to explore the game relationship and equilibrium stable strategy of manufacturing enterprises, local government, suppliers and consumers in HQDMI system. Secondly, both endogenous and exogenous factors constitute a complex system that affects the HQDMI. Only by fully considering and reasonably utilizing these factors can the HQDMI be achieved. However, existing research mostly focuses on studying it from a single factor perspective. How to scientifically analyze the evolution mechanism of the strategic influence of participating entities in the HQDMI from the perspective of the comprehensive effects of endogenous and exogenous factors is also an important issue that this article needs to solve. Thirdly, in the process of constructing game theory models, researchers mostly assume that all participants have perfect judgment and predictive ability. Obviously, this condition of complete rationality and complete information is difficult to achieve. Especially in the HQDMI, involving dynamic behavioral strategy choices from multiple stakeholders, the likelihood of participants being completely rational is almost zero. The results of research based on incorrect assumptions are inevitably unreliable. Therefore, how to achieve the evolutionary game of HQDMI based on bounded rationality is an urgent problem that needs to be solved in this study.
Based on the limitations of the aforementioned research, the primary research questions of this paper are as follows: (1) how to scientifically judge the stable strategy of the four-party evolutionary game among manufacturing enterprises, local governments, suppliers, and consumers in the HQDMI? (2) How to scientifically analyze the evolutionary mechanism of the impact of endogenous and exogenous factors on the strategies of participating entities in the HQDMI? (3) How to scientifically understand the behavioral evolution and evolutionary stability strategies of game entities such as local governments, manufacturing enterprises, suppliers, and consumers under bounded rationality conditions?
In comparison with existing research, the contributions of this paper are as follows: Firstly, this study utilizes the population evolution theory and bounded rationality theory to analyze the effects of both endogenous and exogenous factors on party strategies. It is hypothesized that the strategies utilized by the participants on the HQDMI are a result of both collaborative learning and competitive dynamics. This observation is consistent with the intrinsic characteristics of an ecological population and the coevolutionary dynamics of the environment. Secondly, in line with the context of China’s HQD and enterprise production practices, this study provides a systematic analysis of the dynamic evolution characteristics of participants’ behavioral strategies. The analysis takes into account a wide range of exogenous and endogenous factors, including innovative capability, organization building, industrial resources, market demand, policy environment, and industrial cooperation. Thirdly, this study employs two complementary research methodologies, namely evolutionary game theory and numerical simulation, to investigate the evolutionarily stable strategies within a four-party evolutionary game involving manufacturing enterprises, local governments, suppliers, and consumers. The current study aims to examine the dynamics of these strategies in various scenarios. The findings of the present study offer valuable insights into the evolutionary mechanism that drives participants’ behavioral strategies on the HQDMI, thereby providing theoretical support for the HQDMI.
The paper is organized as follows. Section 2 delves into the core of the problem, proposes the basic assumptions of the model, and constructs a benefit matrix. By solving the evolutionary stability strategy, this section provides a detailed analysis of the stability of the equilibrium point. Section 3 focuses on the simulation experiments of the model, which verified its effectiveness and applicability through numerical simulations. Section 4 proposes a facilitation mechanism for HQDMI and provides management insights. Section 5 outlines the conclusions and limitations.
2. Problem Description and Model Assumptions
2.1. Research Methods and Framework
Evolutionary game theory is an interdisciplinary research method that combines game theory with biological evolutionary theory [36]. Evolutionary game theory embodies the concept of bounded rationality not by assuming that participants are “irrational,” but by redefining rationality through a dynamic adaptation process that replaces one-shot optimization. It views equilibrium as an emergent outcome that gradually arises through long-term learning, trial and error, and evolution. This framework significantly enhances the explanatory power for long-term dynamic processes in real-world societies, such as institutional evolution, the formation of cultural norms, and behavioral strategies, thereby providing a solid foundation for studying strategic interactions among boundedly rational agents. In this study, tools such as the replicator dynamic equation are employed to describe the diffusion of strategies within a population. Through trial and error and learning, strategies are gradually optimized, eventually leading to a dynamic equilibrium. Evolutionary game theory is widely used to study the evolution of corporate strategies in market competition. Enterprises continuously adjust their strategies to adapt to the external environment in competition, ultimately forming a stable strategic pattern, similar to the survival of the fittest in natural selection [37]. The overall research framework of this study is shown in Figure 1.
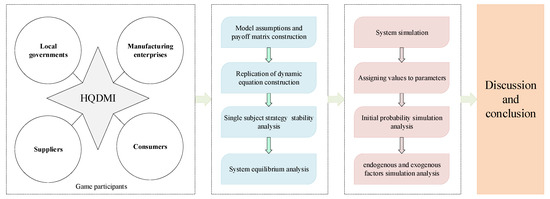
Figure 1.
Overall research framework.
2.2. Problem Description
In the evolution of manufacturing towards HQD, there are four key stakeholders involved: the local government, manufacturing enterprises, suppliers, and consumers. Given the diverse interests and demands of all parties, the success of the manufacturing industry in achieving HQD largely depends on the outcome of the game between these four parties. The four parties will adjust their behavior based on subjective judgments of economic interests, and choose strategies from the perspective of maximizing their own interests under bounded rationality, thus forming a complex game relationship as shown in Figure 2. The strategy selection analysis of all parties involved is as follows:
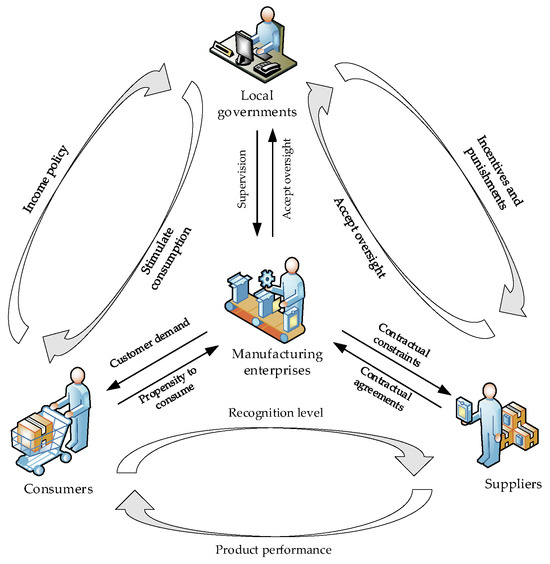
Figure 2.
The relationship of game participants.
(1) For local governments, there game strategies can be divided into two behavioral choices: strict supervision and lax supervision. When opting for a strict supervision strategy, the government’s relevant measures can promote consumer behavior by offering subsidies, tax incentives, and other incentives to manufacturing enterprises pursuing smart upgrades, while rewarding cooperating suppliers to advance HQDMI. If local governments adopt lax supervision, the development of manufacturing enterprises will follow the basic laws and principles of the market economy.
(2) For manufacturing enterprises, their game strategies can be divided into two behavioral choices: smart upgrade and extensive development. When they choose a smart upgrade strategy, the enterprise will shift towards the high-end of the global value chain, gain good brand value, enhance market competitiveness, and thus obtain excess returns if manufacturing enterprises tend to adopt a more conservative participation strategy, namely extensive development. Under this strategy, enterprises rely on resource consumption, labor, and capital investment to drive development, representing an extensive development strategy. The strategy chosen by manufacturing enterprises depends on whether the expected benefits of smart upgrade are greater than those of extensive development.
(3) For suppliers, their game strategy can be divided into two behavioral choices: positive cooperation and negative cooperation. When choosing a positive cooperation strategy, suppliers need to enhance their abilities in product quality control, product cost control, and technological innovation to increase consumer recognition of their products. On the contrary, it will be punished by manufacturing enterprises and even lead to the breakdown of cooperative relationships.
(4) For consumers, their game strategies can be divided into two behavioral choices: green consumption and traditional consumption. As the ultimate experiencer of HQDMI, consumers’ green consumption [38] decisions are influenced by various factors, including government subsidies, product quality of enterprises, and after-sales service. The changes in these factors will directly affect consumers’ consumption behavior. When the benefits brought by green consumption are higher than traditional consumption [39], consumers are more inclined to choose green consumption strategies; On the contrary, traditional consumption strategies will be chosen.
Based on the above basic understanding, in the game process of HQDMI, a total of 16 strategy sets were generated under the influence of the four participating entities (as shown in Figure 3). This paper employs evolutionary game theory to investigate the behavioral strategies and their influencing factors among four participant groups: local governments, manufacturing enterprises, suppliers, and consumers. (Behavioral strategies refer to the decision-making process through which participants in a strategic environment adjust their actions based on predictions of other participants’ behaviors, aiming to maximize their own interests.)
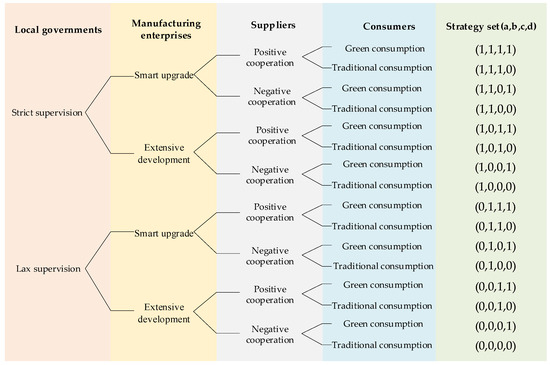
Figure 3.
Strategy scenarios in the game.
To reflect the dynamic characteristics of decision sequences in the real world, this paper employs timeline diagrams to clarify the order of decisions, as shown in Figure 4.
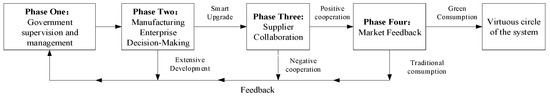
Figure 4.
Decision timeline.
2.3. Model Assumptions
Assumption 1.
The evolution of HQDMI can be comprehended as a dynamic process wherein strategies are consistently adapted by four primary stakeholders: local governments, manufacturing enterprises, suppliers, and consumers, operating within a distinct environmental framework. The strategic adaptations exhibited by individuals within a population can be understood through the application of the replicator dynamics equation, which shares similarities with the fundamental principles of biological evolution. In the context of the evolution of HQDMI, participants in the game engage in competitive interactions while also acquiring knowledge from each other, thus having the ability to modify their strategies. Therefore, the decision-making process of the game subject is characterized by a dynamic and continuous nature, necessitating ongoing adjustments. represents local governments, represents manufacturing enterprises, represents suppliers, and represents consumers. Individuals within the four-party population exhibit bounded rationality. In the course of the game, four participants engage in a repeated game with a finite number of iterations.
Assumption 2.
Due to the current low level of the HQDMI, a longer period of government support and guidance is needed to promote the long-term sustainable development of the manufacturing industry. The tax revenue when local governments choose lax supervision is recorded as . For local governments, when manufacturing enterprises undergo smart upgrades, they will gain socioeconomic benefits, which is denoted as . It is worth noting that this paper aggregates the government’s multidimensional objectives into a comprehensive ‘benefit’ indicator. Therefore, should be understood as a holistic benefit encompassing economic, social, and political benefits. The cost incurred by local governments in raising awareness of the HQD among manufacturing enterprises, suppliers, and consumers, as well as in optimizing the policy environment, is recorded as . The cost of the smart upgrade subsidy provided by local governments is recorded as . The incentive cost provided by local governments to encourage suppliers to choose positive cooperation strategies is recorded as . Local governments stimulate consumption and release green consumption demand through subsidies, with the subsidy cost recorded as . The coefficient representing the increase in socioeconomic benefits resulting from the smart upgrade of manufacturing enterprises is denoted as , where .
Assumption 3.
In order to prevent “free-riding” behavior between manufacturing enterprises and suppliers, the establishment of supply chain contracts and penalty mechanisms can motivate long-term cooperation between them. In other words, when manufacturing enterprises have an incentive to “free-riding” and choose extensive development, suppliers will induce manufacturing enterprises to choose smart upgrade through contractual agreements. Thus, if manufacturing enterprises choose the extensive development strategy, it will incur a loss due to the contractual agreement in the case of positive cooperation by suppliers, the loss cost is recorded as . When suppliers have an incentive to “free-riding” and do not positively collaborate, manufacturing enterprises will induce suppliers to positive cooperation through contractual agreements. Thus, if suppliers choose the extensive development strategy, they will incur a loss due to the contractual agreement in the case of smart upgrade by manufacturing enterprises, the loss cost is recorded as .
Assumption 4.
When manufacturing enterprises adopt the “extensive development” strategy, the initial benefit to the enterprise is recorded as ; If manufacturing enterprises adopt the “smart upgrade” strategy, it needs to invest in innovative capability, organization building, and industrial resources. The costs of these investments are denoted as , , and , respectively, where , , and . When manufacturing enterprises choosing the strategy of “smart upgrade”, they will move toward the high-end of the global value chain, build a strong brand value, enhance market competitiveness, and ultimately gain economic benefits, which are recorded as . Since the levels of innovative capability, organization building, and industrial resources vary among individual manufacturing enterprises in the population, it is necessary to analyze the impact of different values of these factors on the stability of the evolutionary equilibrium. The three parameters, namely innovative capability, organization building, and industrial resources, are recorded as , , and , respectively, where . Further, implies that the higher the factor of innovative capability of manufacturing enterprises, the lower the required inputs for innovative capability. implies that the higher the factor of organization building of manufacturing enterprises, the lower the required inputs for organization building. Lastly, implies that the higher the factor of industrial resources of manufacturing enterprises, the lower the required inputs for industrial resources.
Assumption 5.
HQDMI is also constrained by exogenous factors, such as the policy environment, industrial cooperation, and market demand. The government provides support for the HQDMI by optimizing the policy environment and implementing industrial policies [40]. Therefore, the benefit obtained by manufacturing enterprises from choose the “smart upgrade” strategy, when local governments strictly supervise, is recorded as . Through industrial cooperation, suppliers enhance Internet information technology services for the HQDMI, promote the development of industrial resource agglomeration, and improve the modernization of industrial chain and supply chain. Thus, when suppliers positively cooperate, the benefit obtained by manufacturing enterprises from choosing the “smart upgrade” strategy is recorded as ; The change in consumer attitudes and the upgrading of consumer demand also provide a greater market space and development potential for the HQDMI. Thus, the benefit obtained by manufacturing enterprises from choose the “smart upgrade” strategy, when consumers engage in green consumption, is denoted as .
Assumption 6.
Given the differences in policy environments exhibited by different individuals within the local government population, in order to further explore the impact of changes in policy environment variables on the stability evolution equilibrium of the HQDMI system, this paper takes policy environment as the core variable and sets it as . At the same time, considering the uneven level of industrial cooperation among individual suppliers, in order to analyze the impact of changes in different levels of industrial cooperation on the stability evolutionary equilibrium, we take industrial collaboration as another key variable and set it as . Furthermore, given the diversity of individual consumption demands within the consumer population, in order to evaluate the impact of changes in market demand on the stability evolutionary equilibrium, we take market demand as a key variable and set is as , where . This aims to comprehensively understand how changes in various exogenous factors affect the evolutionary equilibrium stability of the HQDMI system through precise parametric analysis. Further, implies that the more favorable the policy environment, the greater the benefit to manufacturing enterprises when they choose the “smart upgrade” strategy; implies that the closer the industrial cooperation, the greater the benefit to manufacturing enterprises when they choose the “smart upgrade” strategy; implies that the higher the market demand, the greater the benefit to manufacturing enterprises when they choose the “smart upgrade” strategy.
Assumption 7.
The initial benefit when suppliers adopt the negative cooperation strategy is denoted as ; the economic benefit when suppliers choose the positive cooperation strategy is denoted as . The cost of inputs when suppliers choose the positive cooperation strategy is denoted as . When consumers adopt the green consumption strategy and suppliers choose the negative cooperation strategy, suppliers will receive extra income, denoted as . When suppliers adopt the positive cooperation strategy and consumers choose the traditional consumption strategy, the suppliers incur a cost of loss, denoted as .
Assumption 8.
The initial benefit when consumers choose the traditional consumption strategy is denoted as ; the direct benefit when consumers choose the green consumption strategy is denoted as . The cost of inputs when consumers choose the green consumption strategy is denoted as . When suppliers choose the positive cooperation strategy, consumers who choose the green consumption strategy will receive green benefits, denoted as . When manufacturing enterprises choose the “smart upgrade” strategy, consumers who choose the green consumption strategy will receive green benefits, denoted as .
Assumption 9.
Suppose the probability that local governments implement strict supervision is , and the probability that local governments implement lax supervision is . Suppose the probability that manufacturing enterprises adopt smart upgrade is , and the probability that manufacturing enterprises adopt extensive development is . Suppose the probability that suppliers adopt positive cooperation is , and the probability that suppliers adopt negative cooperation is . Suppose the probability that consumers adopt green consumption is , and the probability that consumers adopt traditional cooperation is .
Based on the above assumptions, the parameters of the four-party evolutionary game model are presented in Table 1.

Table 1.
Parameter settings.
2.4. Model Construction
Based on the above assumptions, the game payoff matrix is shown in Table 2.
Table 2.
The payoff matrix.
2.5. Solving the Stable Strategy Equilibrium Solution
2.5.1. Constructing the Payoff Expectation Functions
Let and represent, respectively, the expected returns of “Strict supervision” and “Lax supervision” for local governments. In accordance with Table 2, the payoffs of the local governments with the two distinct behavioral strategies are herein described:
The average return of the local governments is denoted as showed as follows:
Let and represent, respectively, the expected returns of “Smart upgrade” and “Extensive development” for manufacturing enterprises. In accordance with Table 2, the payoffs of the manufacturing enterprises with the two distinct behavioral strategies are herein described:
The average return of the manufacturing enterprises is denoted as showed as follows:
Let and represent, respectively, the expected returns of “Positive cooperation” and “Negative cooperation” for suppliers. In accordance with Table 2, the payoffs of the suppliers with the two distinct behavioral strategies are herein described:
The average return of the suppliers is denoted as , shown as follows:
Let and represent, respectively, the expected returns of “Green consumption” and “Traditional consumption” for consumers. In accordance with Table 2, the payoffs of the consumers with the two distinct behavioral strategies are herein described:
The average return of the consumers is denoted as showed as follows:
2.5.2. Model Analysis
In accordance with the principles of evolutionary game theory, the four participating populations will adjust their strategies multiple times to achieve maximum expected returns [41]. When the returns of a strategy exceed the average returns of the gaming system, the strategy will gradually evolve and develop within the system [42,43]. Replication dynamics equation is commonly used to establish models and analyze the dynamic process of strategy evolution. It describes the relationship between the rate of change in strategy frequency over time and strategy returns in the form of differential equations [44,45,46].
Analysis of Evolutionarily Stable Strategy of Local Governments
According to Equations (1)~(3), the replicator dynamic equation for local governments can be as follows:
By taking the derivative of , we can obtain the following:
According to the stability theorem and properties [47], based on Equations (13)~(14), when , and , the solution is the stable strategy equilibrium solution. From , we can obtain: , , and . When , , and all are evolutionarily stable strategies. This means that the strategy of local governments remains unchanged over time. When , we can obtain: . It follows that is the equilibrium solution, i.e., the “strict supervision” strategy is the evolutionarily stable strategy of local governments. When , we can obtain: . It follows that is the equilibrium solution, i.e., the “lax supervision” strategy is the evolutionarily stable strategy of local governments. Based on the aforementioned analysis, the evolutionary phase diagram of local governments can be obtained, depicted in Figure 5.
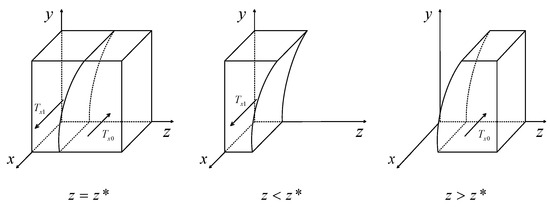
Figure 5.
Evolutionary phase diagram of local governments.
From Figure 5, the volume of represents the probability of local governments choose the “strict supervision” strategy. The volume of represents the probability of local governments choose the “lax supervision” strategy. After calculation, it can be obtained:
Proposition 1.
The probability of local governments choosing the strict supervision strategy is positively related to the socio-economic benefits resulting from the smart upgrade of manufacturing enterprises; the probability of local governments choosing the strict supervision strategy is negatively related to subsidies for manufacturing enterprises, incentives for suppliers, subsidies for consumers, and the cost of inputs to the policy environment. The proofs of the corollaries are included in Appendix A.
Analysis of Evolutionarily Stable Strategy of Manufacturing Enterprises
According to Equations (4)~(6), the replicator dynamic equation for manufacturing enterprises can be as follows:
By taking the derivative of , we can obtain the following:
According to the stability theorem and properties, based on Equations (17)~(18), when , and , the solution is the stable strategy equilibrium solution. From , we can obtain: , , and . When , , and all are evolutionarily stable strategies. This means that the strategy of manufacturing enterprises remains unchanged over time. When , we can obtain: . It follows that is the equilibrium solution, i.e., the “extensive development” strategy is the evolutionarily stable strategy of manufacturing enterprises. When , we can obtain: . It follows that is the equilibrium solution, i.e., the “smart upgrade” strategy is the evolutionarily stable strategy of manufacturing enterprises. Based on the aforementioned analysis, the evolutionary phase diagram of manufacturing enterprises can be obtained, as shown in Figure 6.
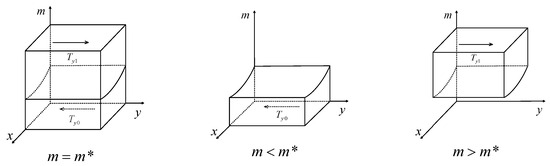
Figure 6.
Evolutionary phase diagram of manufacturing enterprises.
From Figure 6, the volume of represents the probability of manufacturing enterprises choose the “extensive development” strategy. The volume of represents the probability of manufacturing enterprises choose the “smart upgrade” strategy. After calculation, it can be obtained:
Proposition 2.
The probability that manufacturing enterprises choose the smart upgrade strategy is positively related to the subsidies provided by local governments to the manufacturing industry, the benefits gained by the enterprises choose smart upgrade, and the contractual losses incurred when the enterprise engages in extensive development. The probability of manufacturing enterprises choosing smart upgrade strategy is negatively related to the input cost of innovative capability, organization building, and industrial resources, contractual loss resulting from suppliers’ negative cooperation, and the initial benefits. The proofs of the corollaries are included in Appendix A.
Analysis of Evolutionarily Stable Strategy of Suppliers
According to Equations (7)~(9), the replicator dynamic equation for suppliers can be as follows:
By taking the derivative of , we can obtain the following:
According to the stability theorem and properties, based on Equations (21)~(22), when , and , the solution is the stable strategy equilibrium solution. From , we can obtain: , , and . When , , and all are evolutionarily stable strategies. This means that suppliers’ strategy remains unchanged over time. When , we can obtain: . It follows that is the equilibrium solution, i.e., the “positive cooperation” strategy is the evolutionarily stable strategy of suppliers. When , we can obtain: . It follows that is the equilibrium solution, i.e., the “negative cooperation” strategy is the evolutionarily stable strategy of suppliers. Based on the aforementioned analysis, the evolutionary phase diagram of suppliers can be obtained, illustrated in Figure 7.
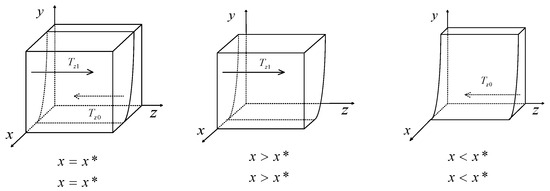
Figure 7.
Evolutionary phase diagram of suppliers.
From Figure 7, the volume of represents the probability of suppliers choose the “negative cooperation” strategy. The volume of represents the probability of suppliers choose the “positive cooperation” strategy. After calculation, it can be obtained:
Proposition 3.
The probability that suppliers choose the positive cooperation strategy is positively related local governments incentives, contractual losses experienced by manufacturing enterprises in the case of extensive development, contractual losses incurred by suppliers in the event of negative cooperation, and economic benefits in the case of positive cooperation. The probability that suppliers choose the positive cooperation strategy is negatively related to input costs, excess benefits accrued by consumers, initial benefits, and loss costs. The proofs of the corollaries are included in Appendix A.
Analysis of Evolutionarily Stable Strategy of Consumers
According to Equations (10)~(12), the replicator dynamic equation for consumers can be as follows:
By taking the derivative of , we can obtain the following:
According to the stability theorem and properties, based on Equations (25)~(26), when , and , the solution is the stable strategy equilibrium solution. From , we can obtain: , , and . When , , and all are evolutionarily stable strategies. This means that the strategy of consumers remains unchanged over time. When , we can obtain: . It follows that is the equilibrium solution, i.e., the “green consumption” strategy is the evolutionarily stable strategy of consumers. When , we can obtain: . It follows that is the equilibrium solution, i.e., the “traditional consumption” strategy is the evolutionarily stable strategy of consumers. Based on the aforementioned analysis, the evolutionary phase diagram of consumers can be obtained, illustrated in Figure 8.
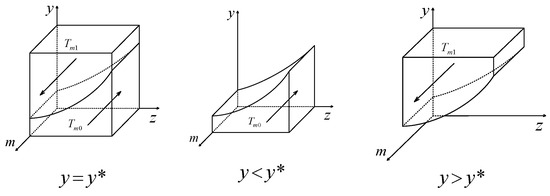
Figure 8.
Evolutionary phase diagram of consumers.
From Figure 8, the volume of represents the probability of consumers choose the “traditional consumption” strategy. The volume of represents the probability of consumers choose the “green consumption” strategy. After calculation, it can be obtained:
Proposition 4.
The probability of consumers choosing green consumption strategies is positively related to green benefits, consumption subsidies, and direct benefits of green consumption. The probability of consumers choosing green consumption strategies is negatively related to initial benefits and costs of green consumption. The proofs of the corollaries are included in Appendix A.
2.5.3. System Equilibrium Analysis
Equilibrium points are not always evolutionarily stable strategies, because evolutionarily stable strategies must also have the ability to resist errors or biases that arise from bounded rationality. In other words, they must be able to return to a stable state after a perturbation. In order to study the evolutionarily stable strategies of the players, the stability of the equilibrium point of the evolving system can be determined using a method called partial asymptotic stabilization for the Jacobi matrix [48]. Based on the replicator dynamic equations of the game participants, i.e., Equations (13), (17), (21), and (25), the Jacobi matrix of the game model is shown in Equation (29).
Of which:
To further assess the uniqueness of evolutionary stable equilibrium, a Jacobi test is also conducted in this paper. Set the replicator dynamic equations , , , and are all equal to zero, multiple local equilibrium points of the evolutionary game system can be solved. Since the stable solution in multiple population evolution games is a strict Nash equilibrium, this paper draws on the literature [49] and adopts Lyapunov’s first rule to analyze the stability of only 16 pure strategy equilibrium points. The eigenvalues corresponding to the equilibrium points are presented in Table 3.
Table 3.
Eigenvalues of the equilibrium points.
For the purpose of determining the stability of the 16 equilibrium points, this paper introduces Lyapunov’s stability theory. According to the theory, the equilibrium point is asymptotically stable when the eigenvalues of all Jacobi matrices are less than 0. Otherwise, the equilibrium point is undesirable. Based on the characteristic values of equilibrium points in Table 3, in the following cases, that is, when manufacturing enterprises choose the smart upgrade strategy, its economic benefits are greater than the combined costs of increased input and initial benefits (i.e., ). When suppliers choose the positive cooperation strategy, its economic benefits are greater than the sum of its initial benefit, input cost, and loss cost (i.e., ), and when consumers choose the green consumption strategy, its benefits are greater than the sum of input cost and initial benefit (i.e., ). According to the range of values for each parameter in the expression. There are four equilibrium points that may evolve to be evolutionarily stable strategies, namely , , , and , as can be seen in Table 4.
Table 4.
Stability analysis of the evolutionary game among local government, manufacturing enterprises, suppliers and consumers.
By combining Table 3 and Table 4, the eigenvalues of equilibrium points , , , and are analyzed. We can observe that the signs of the eigenvalue for , , and are opposite, and the signs of the eigenvalue for , , and are also opposite. This means that if equilibrium points and are evolutionarily stable strategies, then equilibrium points and are not, and vice versa. By comparing these four equilibrium points, only equilibrium point is the optimal outcome. In this scenario, local governments adopt the “strict supervision” strategy, manufacturing enterprises adopt the “smart upgrade” strategy, suppliers adopt the “positive cooperation” strategy, and consumers adopt the “green consumption” strategy. This scenario is in line with the strategic requirement of the HQDMI. Therefore, this paper focuses on this scenario. When the equilibrium point is the evolutionarily stable strategy, all of its eigenvalues must be negative. Thus, the model needs to include sets of inequalities as constraints, which are shown in Equation (30).
3. System Simulation Analysis
Based on the system stability analysis, this study conducts scientific initial assignment processing for key variables in the HQDMI evolutionary game model. In order to obtain the initial values for the evolutionary simulation, we estimated them by reviewing policies and regulations, China Bureau of Statistics, China Manufacturing Development Research Report, field research and the existing literature [50,51,52], and finally compiled the parameter values in Table 5. Using MATLAB 2018b, the data in Table 5 are used as input parameters, and the simulation results of the system can be obtained by running the game model.
Table 5.
Simulation initial values.
3.1. The Impact of the Innovative Capability Factor on the System
In this paper, the impact of the innovative capability factor on the stability of the evolutionary equilibrium is studied. The system is simulated with the variables of the innovative capability factor and the initial probability, while keeping other parameters unchanged. When the initial probabilities of the game participants, denoted as , , , and , are at low, medium, and high levels, we can assume the initial probabilities to be 0.3, 0.5, and 0.7 for the sake of generality. The factor of innovative capability variable is analyzed separately for three scenarios: low, medium, and high levels. The innovative capability factor is assumed to be , , and in order to analyze the impact of different scenarios on the strategies of the evolutionary game. The evolution of the replication dynamics system is shown in Figure 9.
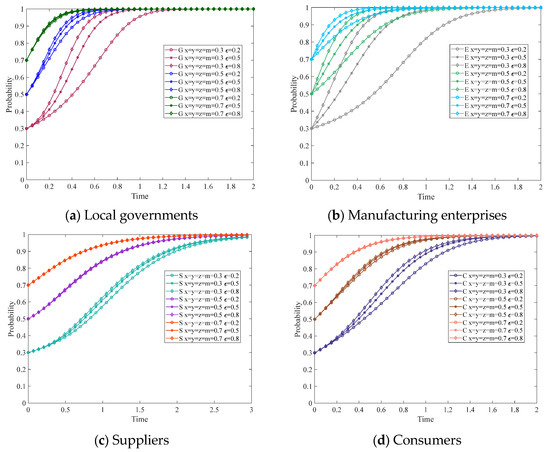
Figure 9.
The impact of on the strategy evolution of the game parties.
From Figure 9, we can observe that at low initial probabilities (i.e., ), increasing the innovative capability factor enhances the speed of local governments’ evolution to the “strict supervision” strategy. It also accelerates the speed of manufacturing enterprises’ evolution to the “smart upgrade” strategy. Additionally, the increase in the innovative capability factor has a positive impact on the speed of evolution for both suppliers and consumers. The system ultimately stabilizes at equilibrium point . Namely, local governments choose the “strict supervision” strategy, manufacturing enterprises choose the “smart upgrade” strategy, suppliers choose the “positive cooperation” strategy, and consumers choose the “green consumption” strategy. With a medium initial probability (i.e., ), increasing the factor of innovative capability enhances the speed at which local governments evolve to the strict supervision strategy. Additionally, the speed at which manufacturing enterprises evolve to the smart upgrade strategy increases significantly, and the speed at which consumers evolve to the green consumption strategy accelerates further. However, there is almost no increase in the speed at which suppliers evolve to the positive cooperation strategy. The system ultimately stabilizes at equilibrium point . With a high initial probability (i.e., ), increasing the factor of innovative capability has little (or no) impact on the evolutionary speed of local governments, suppliers, and consumers. However, it does improve the speed at which manufacturing enterprises arrive at a stabilization strategy. The system ultimately stabilizes at equilibrium point . It can be seen that increasing the factor of innovative capability has a positive impact on the choice of the smart upgrade strategy for manufacturing enterprises.
Figure 9 shows that innovative capability is a crucial factor that influences the smart upgrade of manufacturing enterprises. Enhancing innovative capability helps manufacturing enterprises choose smart upgrade strategy. The reasons are as follows: from the perspective of manufacturing enterprises, this paper assumes that individual enterprises within the population of manufacturing enterprises have varying levels of innovative capability. When manufacturing enterprises have a higher level of innovative capability, it can not only reduce the cost of investment in innovation, but also improve the efficiency of new product development, enhance the core competitiveness of the enterprise, and upgrade the industrial structure. Thus, regardless of the level of the initial probability, increasing innovative capability enables manufacturing enterprises to choose smart upgrade.
3.2. The Impact of the Organization Building Factor on the System
In order to analyze the impact of the organization building factor on the stability of the evolutionary equilibrium, the system is simulated with the organization building factor and the initial probability as variables, while keeping other parameters unchanged. When the initial probabilities of the game parties, denoted as , , , and , are at low, medium, and high levels, we can assume the initial probabilities to be 0.3, 0.5, and 0.7 for the sake of generality. The factor of organization building variable is analyzed separately for three scenarios: low, medium, and high levels. The organization building factor is assumed to be , , and in order to analyze the impact of different scenarios on the strategies of the evolutionary game. The evolution of the replication dynamics system is shown in Figure 10.
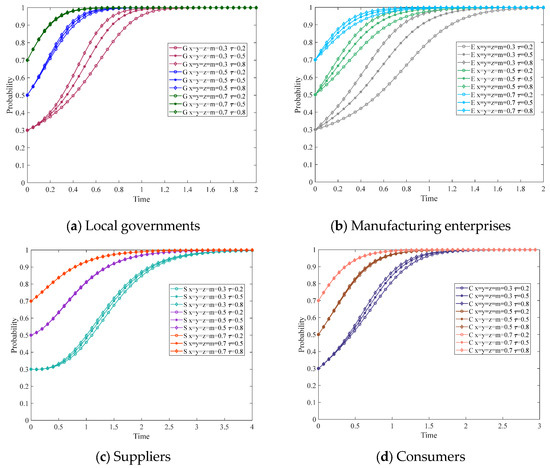
Figure 10.
The impact of on the strategy evolution of the game parties.
From Figure 10, we can observe that at low initial probabilities (i.e., ), increasing the organization building factor enhances the speed of local governments’ evolution to the “strict supervision” strategy. It also accelerates the speed of manufacturing enterprises’ evolution to the “smart upgrade” strategy. Additionally, increasing the organization building factor enhances the speed of the suppliers’ evolution to the “positive cooperation” strategy. It also accelerates the speed of consumers’ evolution to the “green consumption” strategy. The system ultimately stabilizes at equilibrium point . With a medium initial probability (i.e., ), increasing the factor of organization building enhances the speed at which local governments evolve to the strict supervision strategy. Additionally, the speed at which manufacturing enterprises evolve to the smart upgrade strategy increases significantly. However, the increase in the organization building factor has little (or no) impact on the rate of evolution of suppliers and consumers. The system ultimately stabilizes at equilibrium point . With a high initial probability (i.e., ), increasing the factor of organization building has little or no impact on the evolutionary speed of local governments, suppliers, and consumers. However, it does improve the speed at which manufacturing enterprises arrive at a stabilization strategy. The system ultimately stabilizes at equilibrium point . It can be seen that increasing the factor of organization building has a positive impact on the choice of the smart upgrade strategy for manufacturing enterprises.
Figure 10 shows that organization building is an important factor influencing the smart upgrade of manufacturing enterprises. Enhancing the level of organization building in the enterprise can help manufacturing enterprises to choose smart upgrade strategy. The reasons are as follows: From the perspective of manufacturing enterprises, this paper assumes that individual enterprises within the manufacturing population have different levels of organization development. It suggests that when manufacturing enterprises have a higher level of organization building, manufacturing enterprises can not only reduce investment costs but also improve organization efficiency and management efficiency. This higher level of organization building also makes them more adaptable to the requirements of HQD. Thus, regardless of the level of the initial probability, increasing organization building enables manufacturing enterprises to choose smart upgrade strategy.
3.3. The Impact of the Industrial Resources Factor on the System
In order to analyze the impact of the industrial resources factor on the stability of the evolutionary equilibrium, the system is simulated with the industrial resources factor and the initial probability as variables, while keeping other parameters unchanged. When the initial probabilities of the game parties, denoted as , , , and , are at low, medium, and high levels, we can assume the initial probabilities to be 0.3, 0.5, and 0.7 for the sake of generality. The factor of industrial resources variable is analyzed separately for three scenarios: low, medium, and high levels. The industrial resources factor is assumed to be , , and in order to analyze the impact of different scenarios on the strategies of the evolutionary game. The evolution of the replication dynamics system is shown in Figure 11.
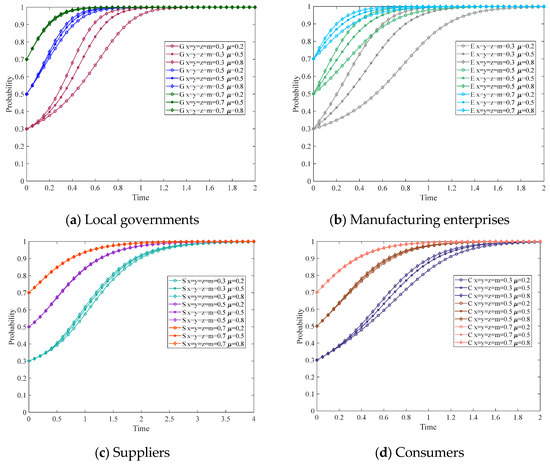
Figure 11.
The impact of on the strategy evolution of the game parties.
From Figure 11, we can observe that at low initial probabilities (i.e., ), increasing the industrial resources factor can enhance the speed at which local governments evolve to a strict supervision strategy and the speed at which manufacturing enterprises evolve to a smart upgrade strategy. At the same time, increasing the industrial resources factor enhances the evolutionary speed of suppliers and consumers. The system ultimately stabilizes at equilibrium point . With a medium initial probability (i.e., ), increasing the industrial resources factor enhances the speed at which local governments evolve to the strict supervision strategy and the speed at which manufacturing enterprises evolve to the smart upgrade strategy. However, the speed of evolution of suppliers and consumers is not significantly enhanced. The system ultimately stabilizes at equilibrium point . With a high initial probability (i.e., ), increasing the factor of industrial resources has little (or no) impact on the evolutionary speed of local governments, suppliers, and consumers. However, it does improve the speed at which manufacturing enterprises arrive at a stabilization strategy. The system ultimately stabilizes at equilibrium point . It can be seen that increasing the factor of organization building has a positive impact on the choice of the smart upgrade strategy for manufacturing enterprises.
Figure 11 shows that industrial resources are a significant factor influencing the smart upgrading of manufacturing enterprises. Improving the level of industrial resources for enterprises helps manufacturing enterprises to choose the smart upgrade strategy. The reasons for this are as follows: From the perspective of manufacturing enterprises, this study assumes that individual enterprises within the population of manufacturing enterprises have different levels of industrial resources. When manufacturing enterprises have higher industrial resources, they can not only reduce investment costs at the industry resource level, but also improve the rationalization and advancement of the industrial structure [53]. Therefore, increasing the industrial resources available to manufacturing enterprises will encourage them to choose the smart upgrade strategy.
3.4. The Impact of the Policy Environment Factor on the System
In order to analyze the impact of the policy environment factor on the stability of the evolutionary equilibrium, the system is simulated with the policy environment factor and the initial probability as variables, while keeping other parameters unchanged. When the initial probabilities of the game parties, denoted as , , , and , are at low, medium, and high levels, we can assume the initial probabilities to be 0.3, 0.5, and 0.7 for the sake of generality. The factor of policy environment variable is analyzed separately for three scenarios: low, medium, and high levels. The policy environment factor is assumed to be , , and in order to analyze the impact of different scenarios on the strategies of the evolutionary game. The evolution of the replication dynamics system is shown in Figure 12.
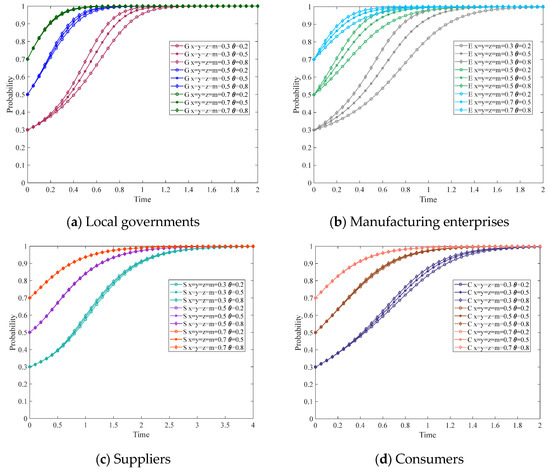
Figure 12.
The impact of on the strategy evolution of the game parties.
From Figure 12, we can observe that at low initial probabilities (i.e., ), increasing the factor of the policy environment can significantly enhance the speed of evolution of local governments choosing the strict supervision strategy and manufacturing enterprises choosing the smart upgrade strategy. Furthermore, it can also enhance the speed of evolution of suppliers choose the positive cooperation strategy and consumers choose the green consumption strategy. The system ultimately stabilizes at equilibrium point . With a medium initial probability (i.e., ), increasing the policy environment can enhance the speed of evolution for local governments that choose the strict supervision strategy, as well as the speed of evolution for manufacturing enterprises that choose the smart upgrade strategy. However, the speed of evolution of suppliers and consumers is not significantly enhanced. The system ultimately stabilizes at equilibrium point . With a high initial probability (i.e., ), increasing the factor of the policy environment has little (or no) impact on the evolutionary speed of local governments, suppliers, and consumers. However, it does improve the speed at which manufacturing enterprises arrive at a stabilization strategy. The system ultimately stabilizes at equilibrium point . It can be seen that increasing the factor of the policy environment has a positive impact on the choice of the smart upgrade strategy for manufacturing enterprises.
Figure 12 shows that improving the policy environment can effectively incentivize manufacturing enterprises to smart upgrade. The policy environment is crucial for manufacturing enterprises to effectively engage in HQD. A favorable policy environment not only alleviates the additional burden of environmental regulations on manufacturing enterprises’ smart upgrade but also enhances the stability of the business environment and the efficiency of enterprises. By providing a favorable policy environment that involves improving infrastructure, promoting transparency, enhancing public services, and implementing suitable industrial policies, among other actions, it is possible to enhance the quality of factor supply for HQDMI and improve resource allocation efficiency [54]. Therefore, improving the policy environment is an important aspect of the HQD process in the manufacturing industry. The government should take effective measures to provide a favorable development environment for manufacturing enterprises [55].
3.5. The Impact of the Industrial Cooperation Factor on the System
In order to analyze the impact of the industrial cooperation factor on the stability of the evolutionary equilibrium, the system is simulated with the industrial cooperation factor and the initial probability as variables, while keeping other parameters unchanged. When the initial probabilities of the game parties, denoted as , , , and , are at low, medium, and high levels, we can assume the initial probabilities to be 0.3, 0.5, and 0.7 for the sake of generality. The factor of industrial cooperation variable is analyzed separately for three scenarios: low, medium, and high levels. The industrial cooperation factor is assumed to be , , and in order to analyze the impact of different scenarios on the strategies of the evolutionary game. The evolution of the replication dynamics system is shown in Figure 13.
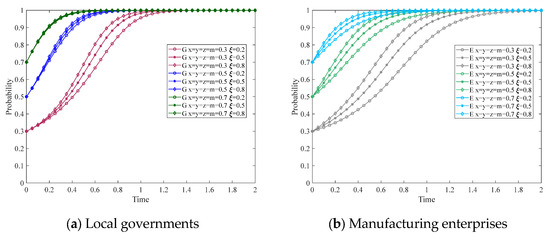
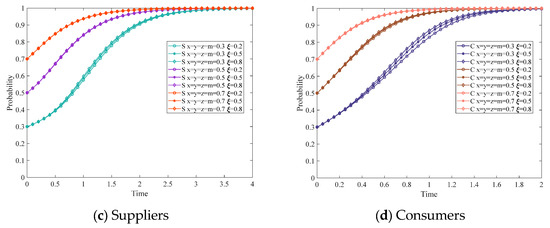
Figure 13.
The impact of on the strategy evolution of the game parties.
From Figure 13, we can observe that at low initial probabilities (i.e., ), increasing the factor of the industrial cooperation can significantly enhance the speed of evolution of local governments choosing the strict supervision strategy and manufacturing enterprises choosing the smart upgrade strategy. Furthermore, it can also enhance the speed of evolution of suppliers choose the positive cooperation strategy and consumers choose the green consumption strategy. The system ultimately stabilizes at equilibrium point . With a medium initial probability (i.e., ), increasing the industrial cooperation factor can enhance the speed of evolution for local governments that choose the strict supervision strategy, as well as the speed of evolution for manufacturing enterprises that choose the smart upgrade strategy. However, the speed of evolution of suppliers and consumers is not significantly enhanced. The system ultimately stabilizes at equilibrium point . With a high initial probability (i.e., ), increasing the factor of industrial cooperation enhances the evolutionary speed of arrival stabilization strategies for manufacturing enterprises. However, it has no impact on the evolutionary speed of local governments, suppliers, and consumers. The system ultimately stabilizes at equilibrium point . It can be seen that increasing the factor of the industrial cooperation has a positive impact on the choice of the smart upgrade strategy for manufacturing enterprises.
Figure 13 shows that industrial cooperation has a positive impact on the strategic choices of manufacturing enterprises. Increasing the level of industrial cooperation can effectively incentivize manufacturing enterprises to choose the smart upgrade strategy in the HQDMI. This is because the associated industries create mutual demand, which allows for the “integration effect” and “scale effect” of the industrial chain. This can increase the total revenue of the entire industrial chain and enhance the overall level of development in the manufacturing industry within the region. Therefore, the establishment of an industrial cooperation mechanism is an important measure for the HQDMI.
3.6. The Impact of the Market Demand Factor on the System
In order to analyze the impact of the market demand factor on the stability of the evolutionary equilibrium, the system is simulated with the market demand factor and the initial probability as variables, while keeping other parameters unchanged. When the initial probabilities of the game parties, denoted as , , , and , are at low, medium, and high levels, we can assume the initial probabilities to be 0.3, 0.5, and 0.7 for the sake of generality. The factor of market demand variable is analyzed separately for three scenarios: low, medium, and high levels. The market demand factor is assumed to be , , and in order to analyze the impact of different scenarios on the strategies of the evolutionary game. The evolution of the replication dynamics system is shown in Figure 14.
Figure 14.
The impact of on the strategy evolution of the game parties.
From Figure 14, we can observe that at low initial probabilities (i.e., ), increasing the factor of the market demand can significantly enhance the speed of evolution of local governments choosing the strict supervision strategy and manufacturing enterprises choosing the smart upgrade strategy. Furthermore, it can also enhance the speed of evolution of suppliers choose the positive cooperation strategy and consumers choose the green consumption strategy. The system ultimately stabilizes at equilibrium point . With a medium initial probability (i.e., ), increasing the market demand factor can enhance the speed of evolution for local governments that choose the strict supervision strategy, as well as the speed of evolution for manufacturing enterprises that choose the smart upgrade strategy. However, the speed of evolution of suppliers and consumers is not significantly enhanced. The system ultimately stabilizes at equilibrium point . With a high initial probability (i.e., ), increasing the factor of the market demand enhances the evolutionary speed of arrival stabilization strategies for manufacturing enterprises. However, it has no impact on the evolutionary speed of local governments, suppliers, and consumers. The system ultimately stabilizes at equilibrium point . It can be seen that increasing the factor of the market demand has a positive impact on the choice of the smart upgrade strategy for manufacturing enterprises.
Figure 14 shows that market demand has a significant impact on the strategic choices of manufacturing enterprises. Increasing demand for environmentally friendly products can effectively encourage manufacturing enterprises to choose the smart upgrade strategy. The reasons for this are as follows: in the context of the new era’s development, there is a trend of transitioning from primarily fulfilling basic needs to gradually adjusting to the upgrading and diversification of consumption needs [56]. This requires manufacturing enterprises to continuously provide consumers with high-quality products and services in order to meet the diverse needs of environmentally conscious consumption. Due to the greater market potential of green consumption and the possibility of increased profits, manufacturing enterprises can generate substantial additional revenue by producing and developing green products. At this stage, obtaining excess profits serves as a crucial incentive for manufacturing enterprises to choose the smart upgrade strategy. Therefore, green consumption is a crucial driving force for promoting the HQDMI. It is of great significance to strengthen the promotion and education of green consumption concepts, raise consumers’ awareness of green consumption, and encourage the market demand for green transformation. This will enable manufacturing enterprises to smart upgrade and subsequently change their development concepts, methods, and structures.
4. Discussion
4.1. The Promotion Mechanism of the HQDMI
This paper deeply explores the internal mechanism that promotes the HQDMI under different stages, and shows it visually through Figure 15. This figure clearly illustrates that the implementation of a series of measures by the four participating populations at different stages of HQDMI can enhance the competitive advantage of the manufacturing industry.
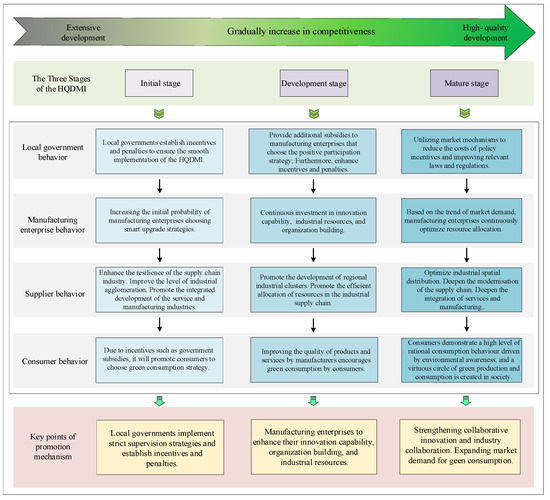
Figure 15.
Promotion mechanism for the HQDMI at different stages.
In the initial stage of HQDMI, for enterprises, due to technological upgrades and cost control difficulties, they often face the dilemma of overspending on investment and insufficient returns. To address this issue, the government can guide enterprises to smart upgrade through economic incentives (such as land discounts, tax reductions) and industrial policies. Specifically, through the construction of a dual-track system of incentive mechanisms and punitive tax policies, the aim is to stimulate the innovative vitality of enterprises and promote the transformation of intelligent production; at the same time, tax measures are implemented for high-energy-consuming enterprises, so as to use economic leverage to promote the transformation of their production modes to low-carbon, environmentally friendly and high-efficiency. For suppliers, the government can promote their technological transformation and environmental improvement through tax incentives, and build an information platform to facilitate supply and demand docking and optimize the supply chain. For consumers, the government can implement consumption incentives to guide them to form healthy, rational, and green consumption concepts, promote market demand growth and consumption upgrading, and expand market space for enterprises.
In the development stage of HQDMI, as manufacturing enterprises continue to improve innovative capability, optimize organization building and strengthen industrial resources integration capabilities, the products or services they provide will experience a comprehensive and profound quality transformation process. This process not only enriches the intrinsic value of the product, but also significantly enhances the added value experience offered to consumers. Consumer demand, as the core element of market feedback, will actively act on this process, forming a positive incentive and support for the continuous progress of manufacturing enterprises, and building a virtuous circle. At this time, the government should continue to strongly support enterprise technology research and innovation to reduce investment costs. In addition, suppliers also play an important role in this stage, actively promoting the efficient allocation of industrial and supply chain resources, so as to maximize the efficiency and benefits of manufacturing enterprises.
In the mature stage of HQDMI, the government should establish an efficient regulatory system that not only establishes and promotes industry standards, but also takes mandatory measures to encourage enterprises to smart upgrade. In this process, the government flexibly utilizes market mechanisms and intangible resource leverage, reduces direct fiscal subsidies, and instead strengthens the core position of the market in resource allocation, promoting a profound transformation from “policy-driven innovation” to “market-demand-led innovation” and promoting the sustained prosperity and upgrading of the manufacturing industry.
4.2. Managerial Insights
Firstly, improve incentives and publicity. On the one hand, local governments currently provide less incentive for manufacturing enterprises to smart upgrade, resulting in higher cost for manufacturing enterprises to choose smart upgrade strategies. Local governments can improve the incentive effect by increasing subsidies or implementing tax relief and other diversified means to reduce the cost of manufacturing enterprises, so as to encourage them to choose smart upgrade strategies. For manufacturing enterprises that adopt extensive development strategies, local governments can formulate appropriate restrictive measures. For example, local governments can implement negative incentives by imposing environmental taxes and other measures, so as to force manufacturing enterprises to evolve into smart upgrade strategies. On the other hand, to maximize the potential benefits of HQDMI, local governments should guide and incentivize manufacturing enterprises to take the plunge and ensure their smart upgrading. In a competitive market, smart upgrading can continuously improve market competitiveness and sustainability.
Secondly, it can be observed from the analysis of the evolutionary path that various supervisory measures need to be implemented at different stages to facilitate the HQDMI. To achieve this goal, it may also be necessary for the relevant departments of local governments to implement a series of effective supervision systems. These systems will enhance innovative capability, industrial resources, and organization building in the manufacturing industry. These regulatory systems should be able to promptly adapt their methods in response to changes in the system’s condition and establish an efficient regulatory framework for HQD. The government should fully recognize the important role of upstream suppliers and downstream consumers in promoting HQDMI. Actively encourage and guide manufacturing enterprises to smart upgrade. Encourage suppliers to positively collaborate and stimulate consumers’ potential for green consumption.
Thirdly, it is urgent to promote HQDMI. The government plays a crucial role in promoting HQDMI by formulating reasonable regulations and policies. This encourages manufacturing enterprises to smart upgrade. At the level of industrial policy, there is an urgent need for local governments to introduce and strengthen laws and regulations. Additionally, at the implementation level, it is necessary to gradually establish and improve mechanisms for assessing, supervising, incentivizing, and distributing benefits as guarantees. These measures will effectively stimulate the enthusiasm, initiative, and creativity of manufacturing enterprises.
Finally, manufacturing enterprises should strive to build a multi-party HQD network with upstream suppliers, downstream consumers, and relevant government agencies. This network should involve multiple parties and aim to establish strong interactions and cooperative relationships. The goal is to promote the effective flow of knowledge, technology, and resources within the network and to reach a consensus on HQD cooperation in the manufacturing industry.
5. Conclusions and Limitations
5.1. Conclusions
The manufacturing industry plays an indispensable key role in promoting technological innovation capabilities and fostering stable economic growth. Its high-quality development is not only the core pillar for building a modern economic system and realizing a new development pattern, but also the top priority for economic transformation, upgrading, and prosperous development. However, in the HQDMI system, the knowledge-based game among populations is not only related to the survival and development of individuals, but also affects the evolution of HQDMI system. This paper studies the problem of behavioral strategies selection in the HQDMI system from the perspective of population evolutionary game theory. The four-party evolutionary game model and numerical simulation model were constructed successively to analyze the influence of factors such as innovative capability, organization building, industrial resources, policy environment, industrial cooperation, and market demand on the stability on the evolutionary equilibrium stability and evolutionarily stable strategies of the HQDMI. Based on theoretical and simulation analysis, the following conclusions are drawn:
(1) Theoretical analysis shows that, based on different situations, the game situation among local governments, manufacturing enterprises, suppliers and consumers is different, and the HQDMI system stabilizes in different strategies after repeated games. They are: ① {Lax supervision, Smart upgrade, Negative cooperation, Green consumption}; ② {Strict supervision, Smart upgrade, Negative cooperation, Green consumption}; ③ {Lax supervision, Smart upgrade, Positive cooperation, Green consumption}; ④ {Strict supervision, Smart upgrade, Positive cooperation, Green consumption}. By comparing the characteristic values of these four equilibrium points, it is found that only the fourth situation is the best result, which also meets the strategic requirements of the HQDMI.
(2) The simulation model further found that whether by enhancing the level of endogenous factors or increasing the level of exogenous factors, it can effectively improve the evolution speed of manufacturing enterprises to the smart upgrade strategy, and the system ultimately tends to a stable state . In this state, local governments are stable in the strict supervision strategy, manufacturing enterprises are stable in the smart upgrade strategy, suppliers are stable in the positive cooperation strategy, and consumers are stable in the green consumption strategy. This combination of strategies constitutes a stable pattern of coordinated development.
(3) In the high-quality development system of the manufacturing industry, the four participating entities exhibit significant heterogeneity in their response efficiency to key influencing factors and in the evolutionary paths of their strategic behaviors converging towards a stable state. The simulation results indicate apparent differences in the rate of strategic evolution among the entities. Ranked from highest to lowest evolution rate, the order is: manufacturing enterprises, local governments, consumers, and suppliers.
5.2. Limitations
This study provides insights into the mechanism of equilibrium strategy formation in the HQDMI system, which consists of manufacturing enterprises, local governments, suppliers and consumers. It also examines the impact of changes in endogenous and exogenous factors on the evolutionarily stable strategy of the system. Although this study provides insightful analysis and practical recommendations for government policy makers and corporate management, it is important to point out that it has certain limitations:
First, endogenous and exogenous factors may have mixed effects on the HQDMI system. In this study, we have investigated the effects of exogenous and endogenous factors on the HQDMI system separately. Nevertheless, we do not analyze whether the exogenous and endogenous factors have a mixed effect on the HQDMI system. In future research, we will try to collect data through questionnaires and set up interaction variables using an econometric regression model to determine the mixed effects of endogenous and exogenous factors on the HQDMI. Second, the model employed in this study does not account for the internal decision-making processes of the government as a complex system, such as the time delays caused by inter-departmental coordination and legislative procedures. Future research could incorporate institutional factors such as political consultation. Finally, the analysis in this paper is based on relatively idealized assumptions, and at this stage, numerical simulations have been conducted using only partial empirical data from China. In subsequent research, more comprehensive and detailed case data can be collected through systematically designed questionnaires, thereby yielding more systematic and universally applicable conclusions.
Author Contributions
Conceptualization, J.S. and Y.S.; methodology, J.S. and Y.S.; software, Y.S.; data curation, Y.S.; writing—original draft preparation, Y.S. and M.Z.; validation, Y.S. and M.Z.; writing—review and editing, Y.S. and M.Z. All authors have read and agreed to the published version of the manuscript.
Funding
This study was supported by the Soft Science Research Plan Project of Henan Province (252400411164); the Philosophy and Social Science Planning Project of Henan Province (2022BJJ066); and the Key Research Project of Henan Universities (26A630009).
Data Availability Statement
The original contributions presented in this study are included in the article. Further inquiries can be directed to the corresponding author.
Conflicts of Interest
The authors declare no conflicts of interest.
Appendix A
Proof of Proposition 1.
Calculating the first-order partial derivatives of with respect to , , , , and , respectively, we can obtain: , , , , and . Q. E. D. □
Proof of Proposition 2.
Calculating the first-order partial derivatives of with respect to , , , , , , , , , , and, respectively, we can obtain: , , , , , , , , , , and . Q. E. D. □
Proof of Proposition 3.
Calculating the first-order partial derivatives of with respect to , , , , , , , and, respectively, we can obtain: , , , , , , , and . Q. E. D. □
Proof of Proposition 4.
Calculating the first-order partial derivatives of with respect to , , , , , and, respectively, we can obtain: , , , , , and . Q. E. D. □
References
- Panda, S.K.; Xiang, Y.; Liu, R. Dynamic resource matching in manufacturing using deep reinforcement learning. Eur. J. Oper. Res. 2024, 318, 408–423. [Google Scholar] [CrossRef]
- Liu, P.; Wu, J. Can digital transformation enable the energy enterprises to achieve high-quality development?: An empirical analysis from China. Energy Rep. 2023, 10, 1182–1197. [Google Scholar] [CrossRef]
- Gupta, A.; Khanna, A. A holistic approach to sustainable manufacturing: Rework, green technology, and carbon policies. Expert Syst. Appl. 2024, 244, 122943. [Google Scholar] [CrossRef]
- Chi, Z.; Jiang, F.; Yan, L.; Wang, C.; Chen, X.; Esposito, L. Nexus between enterprise innovation and viability: Strategic differentiation of China manufacturing sector unveils the truth. Environ. Dev. Sustain. 2025, 27, 7757–7778. [Google Scholar] [CrossRef]
- Zheng, W.; Zhang, L.; Hu, J. Green credit, carbon emission and high quality development of green economy in China. Energy Rep. 2022, 8, 12215–12226. [Google Scholar] [CrossRef]
- Chen, Y.; Tian, W.; Zhou, Q.; Shi, T. Spatiotemporal and driving forces of Ecological Carrying Capacity for high-quality development of 286 cities in China. J. Clean. Prod. 2021, 293. [Google Scholar] [CrossRef]
- Li, X.; Li, S.; Li, C.; Shi, J.; Wang, N. The impact of high-quality development on ecological footprint: An empirical research based on STIRPAT model. Ecol. Indic. 2023, 154, 110881. [Google Scholar] [CrossRef]
- Liu, Y.; He, Z. Synergistic industrial agglomeration, new quality productive forces and high-quality development of the manufacturing industry. Int. Rev. Econ. Financ. 2024, 94, 103373. [Google Scholar] [CrossRef]
- Wang, L.; Wang, Z.; Ma, Y. Does environmental regulation promote the high-quality development of manufacturing? A quasi-natural experiment based on China’s carbon emission trading pilot scheme. Socio-Econ. Plan. Sci. 2022, 81, 101216. [Google Scholar] [CrossRef]
- Jabbour, A.B.L.d.S.; Ndubisi, N.O.; Roman Pais Seles, B.M. Sustainable development in Asian manufacturing SMEs: Progress and directions. Int. J. Prod. Econ. 2020, 225, 107567. [Google Scholar] [CrossRef]
- Mani, V.; Jabbour, C.J.C.; Mani, K.T.N. Supply chain social sustainability in small and medium manufacturing enterprises and firms’ performance: Empirical evidence from an emerging Asian economy. Int. J. Prod. Econ. 2020, 227, 107656. [Google Scholar] [CrossRef]
- Kafetzopoulos, D.; Psomas, E. The impact of innovation capability on the performance of manufacturing companies. J. Manuf. Technol. Manag. 2015, 26, 104–130. [Google Scholar] [CrossRef]
- Han, H.; Ren, B. Study on the high-quality development and competitiveness of manufacturing industry of the Yellow River Basin. Econ. Probl. 2020, 8, 1–9. (In Chinese) [Google Scholar]
- Liu, M.; Wang, X. Spatial transfer trend and its effect factors of manufacturing industry in China: 2007~2017. J. Quant. Technol. Econ. 2020, 37, 26–46. [Google Scholar]
- Li, Y.; Ma, H.; Xiong, J.; Zhang, J.; Divakaran, P.K.P. Manufacturing structure, transformation path, and performance evolution: An industrial network perspective. Socio-Econ. Plan. Sci. 2022, 82, 101230. [Google Scholar] [CrossRef]
- Mathieu, V. Service strategies within the manufacturing sector: Benefits, costs and partnership. Int. J. Serv. Ind. Manag. 2001, 12, 451–475. [Google Scholar] [CrossRef]
- Hu, C.; Hu, Q. The theoretical framework of the construction of the strategic competitive advantage of the service-oriented manufacturing industry: Based on multi-case analysis of manufacturing industry. China Bus. Mark. 2020, 34, 87–99. [Google Scholar]
- Pang, J. Deepening understanding of accelerating the formation of a new development pattern. Econ. Perspect. 2020, 10, 3–11. (In Chinese) [Google Scholar]
- Song, D. Thinking on development of emerging industries of strategic importance in new stage. Bull. Chin. Acad. Sci. 2021, 36, 328–335. [Google Scholar]
- Dechao, H. The Growth of Service Sectors, Institutional Environment and Quality Development in China’s Manufacturing. Systems 2023, 11, 128. [Google Scholar] [CrossRef]
- Shao, C. Regional business environment and high-quality development of private enterprises: Empirical evidence from China. Res. Econ. Manag. 2021, 42, 42–61. [Google Scholar]
- Zhang, M.; Yao, P. Industrial policy and high-quality development of manufacturing. Stud. Sci. Sci. 2020, 38, 1381–1389. [Google Scholar]
- Liang, D. Theoretical connotation, scientific basis and path selection of green and high quality development path in China. Chongqing Soc. Sci. 2022, 12, 54–65. [Google Scholar]
- Song, H.; Yang, Y. An analysis on the connotation and development of the modernization of Chinese industrial and supply chains. J. Renmin Univ. China 2022, 36, 120–134. (In Chinese) [Google Scholar]
- Zhang, S. Industrial agglomeration and economic growth in the Yellow River Basin: Pattern, characteristics and path. Econ. Probl. 2022, 3, 20–28. (In Chinese) [Google Scholar]
- Guo, K. Artificial intelligence, structural transformation and labor share. J. Manag. World 2019, 35, 60–77+202–203. [Google Scholar]
- Qi, L.; Wu, J.; Li, Q. The power and path of service oriented equipment manufacturing Industry in the digital economy era. Jianghai Acad. J. 2022, 4, 92–98. (In Chinese) [Google Scholar]
- Subin, I.; John, P.; Workman, J. Market orientation, creativity, and new product performance in high-technology firms. J. Mark. Res. 2004, 68, 114–132. [Google Scholar]
- Silveira, D.; Vasconcelos, S. Essays on duopoly competition with asymmetric firms: Is profit maximization always an evolutionary stable strategy? Int. J. Prod. Econ. 2020, 225, 107592. [Google Scholar] [CrossRef]
- Yuan, B.; Zhu, J.; Chen, Z.; Xu, C. How can stakeholders collaborate to promote the interconnection of charging infrastructure? A tripartite evolutionary game analysis. Expert Syst. Appl. 2024, 255, 124798. [Google Scholar] [CrossRef]
- Chen, W.; Hu, Z.-H. Using evolutionary game theory to study governments and manufacturers’ behavioral strategies under various carbon taxes and subsidies. J. Clean. Prod. 2018, 201, 123–141. [Google Scholar] [CrossRef]
- Tan, J.; Zhao, X. Firms’ technological strategies in an innovation ecosystem: A dynamic interaction between leading firms and following firms based on evolutionary game theory and multi-agent simulation. J. Manag. Sci. China 2022, 25, 13–28. (In Chinese) [Google Scholar]
- Qiao, W.; Yin, X. Understanding the impact on energy transition of consumer behavior and enterprise decisions through evolutionary game analysis. Sustain. Prod. Consump. 2021, 28, 231–240. [Google Scholar] [CrossRef]
- Shi, J.; Su, Y. Behavioural strategies of manufacturing firms for high-quality development from the perspective of government participation: A three-part evolutionary game analysis. Heliyon 2023, 9, e14982. [Google Scholar] [CrossRef] [PubMed]
- Chen, L.; Bai, X.; Chen, B.; Wang, J. Incentives for Green and Low-Carbon Technological Innovation of Enterprises Under Environmental Regulation: From the Perspective of Evolutionary Game. Front. Energy Res. 2022, 9, 793667. [Google Scholar] [CrossRef]
- Xu, Y.; Bao, H. FinTech regulation: Evolutionary game model, numerical simulation, and recommendations. Expert Syst. Appl. 2023, 211, 118327. [Google Scholar] [CrossRef]
- Tian, T.; Sun, S. Low-carbon transition pathways in the context of carbon-neutral: A quadrilateral evolutionary game analysis. J. Environ. Manag. 2022, 322, 116105. [Google Scholar] [CrossRef]
- Di Iorio, V.; Testa, F.; Korschun, D.; Iraldo, F.; Iovino, R. Curious about the circular economy? Internal and external influences on information search about the product lifecycle. Bus. Strategy Environ. 2023, 32, 2193–2208. [Google Scholar] [CrossRef]
- Ji, P.; Ma, X.; Li, G. Developing green purchasing relationships for the manufacturing industry: An evolutionary game theory perspective. Int. J. Prod. Econ. 2015, 166, 155–162. [Google Scholar] [CrossRef]
- Yang, D.; Miao, X.; Qiu, Y. A research on the competition and countermeasures of the integrated circuit industry development in China. Sci. Res. Manag. 2021, 42, 47–56. [Google Scholar]
- Yang, W.; Yang, Y. Research on Air Pollution Control in China: From the Perspective of Quadrilateral Evolutionary Games. Sustainability 2020, 12, 1756. [Google Scholar] [CrossRef]
- Adami, C.; Schossau, J.; Hintze, A. The reasonable effectiveness of agent-based simulations in evolutionary game theory Reply to comments on “Evolutionary game theory using agent-based methods”. Phys. Life Rev. 2016, 19, 38–42. [Google Scholar] [CrossRef] [PubMed][Green Version]
- Babu, S.; Mohan, U. An integrated approach to evaluating sustainability in supply chains using evolutionary game theory. Comput. Oper. Res. 2018, 89, 269–283. [Google Scholar] [CrossRef]
- Krivan, V.; Galanthay, T.E.; Cressman, R. Beyond replicator dynamics: From frequency to density dependent models of evolutionary games. J. Theor. Biol. 2018, 455, 232–248. [Google Scholar] [CrossRef]
- Shi, Y.; Pan, M.; Peng, D. Replicator dynamics and evolutionary game of social tolerance: The role of neutral agents. Econ. Lett. 2017, 159, 10–14. [Google Scholar] [CrossRef]
- Wang, Q.; He, N.; Chen, X. Replicator dynamics for public goods game with resource allocation in large populations. Appl. Math. Comput. 2018, 328, 162–170. [Google Scholar] [CrossRef]
- Taylor, P.; Jonker, L. Evolutionary stable strategies and game dynamics. Math. Biosci. 1978, 40, 145–156. [Google Scholar] [CrossRef]
- Friedman, D. On economic applications of evolutionary game theory. J. Evol. Econ. 1998, 8, 15–43. [Google Scholar] [CrossRef]
- Yang, Z. Quadripartite evolutionary game of public participation in interactive transboundary pollution control compensation. Chin. J. Manag. Sci. 2024, 32, 261–273. [Google Scholar]
- Su, Y. Multi-agent evolutionary game in the recycling utilization of construction waste. Sci. Total Environ. 2020, 738, 139826. [Google Scholar] [CrossRef]
- Wang, D.; Li, C.; Mao, J.; Yang, Q. What affects the implementation of the renewable portfolio standard? An analysis of the four-party evolutionary game. Renew. Energy 2023, 204, 250–261. [Google Scholar] [CrossRef]
- Zhou, X.; Jia, M.; Wang, L.; Sharma, G.D.; Zhao, X.; Ma, X. Modelling and simulation of a four-group evolutionary game model for green innovation stakeholders: Contextual evidence in lens of sustainable development. Renew. Energy 2022, 197, 500–517. [Google Scholar] [CrossRef]
- Lu, S.; Zhang, W.; Li, J. Influence of environmental regulations on industrial transformation of resource–based cities in the Yellow River Basin under resource endowment. Bull. Chin. Acad. Sci. 2020, 35, 73–85. [Google Scholar]
- Gao, X.; Huang, J.; Yuan, K. The embedded location of value chain and the domestic value added ratio of exports. J. Quant. Technol. Econ. 2019, 36, 41–61. (In Chinese) [Google Scholar]
- Bai, Y.; Song, S.; Jiao, J.; Yang, R. The impacts of government R&D subsidies on green innovation: Evidence from Chinese energy-intensive firms. J. Clean. Prod. 2019, 233, 819–829. [Google Scholar]
- Zhao, J.; Shi, D.; Deng, Z. A framework of China’s high-quality economic development. Res. Econ. Manag. 2019, 40, 15–31. [Google Scholar]


Disclaimer/Publisher’s Note: The statements, opinions and data contained in all publications are solely those of the individual author(s) and contributor(s) and not of MDPI and/or the editor(s). MDPI and/or the editor(s) disclaim responsibility for any injury to people or property resulting from any ideas, methods, instructions or products referred to in the content. |
© 2025 by the authors. Licensee MDPI, Basel, Switzerland. This article is an open access article distributed under the terms and conditions of the Creative Commons Attribution (CC BY) license (https://creativecommons.org/licenses/by/4.0/).