Article

Oscillation Controlling in Nonlinear Motorcycle Scheme with Bifurcation Study

by
Hany Samih Bauomy
1,* and
Ashraf Taha EL-Sayed
2
1
Department of Mathematics, College of Science and Humanities in Alkharj, Prince Sattam Bin Abdulaziz University, Alkharj 11942, Saudi Arabia
2
Department of Basic Science, Modern Academy for Engineering and Technology, Cairo 11439, Egypt
*
Author to whom correspondence should be addressed.
Mathematics 2025, 13(19), 3120; https://doi.org/10.3390/math13193120
Submission received: 21 August 2025 / Revised: 23 September 2025 / Accepted: 26 September 2025 / Published: 29 September 2025
(This article belongs to the Special Issue Control, Optimization and Intelligent Computing in Energy)

Abstract

By applying the Non-Perturbative Approach (NPA), the corresponding linear differential equation is obtained. Aimed at organizational investigation, the resulting linear equation is used. Strong agreement between numerical calculations and the precise frequency is demonstrated, and the reliability of the results acquired is established by the correlation with the numerical solution. Additionally, this study explores a new control process to affect the stability and behavior of dynamic motorcycle systems that vibrate nonlinearly. A multiple time-scale method (MTSM) is applied to examine the analytical solution of the nonlinear differential equations describing the aforementioned system. Every instance of resonance was taken out of the second-order approximations. The simultaneous primary and 1:1 internal resonance case ( Ω ω e q ,   ω 2 ω e q ) is recorded as the worst resonance case caused while working on the model. We investigated stability with frequency–response equations and bifurcation. Numerical solutions for the system are covered. The effects of the majority of the system parameters were examined. In order to mitigate harmful vibrations, the controller under investigation uses (PD) proportional derivatives with (PPF) positive position feedback as a new control technique. This creates a new active control technique called PDPPF. A comparison between the PD, PPF, and PDPPF controllers demonstrates the effectiveness of the PDPPF controller in reducing amplitude and suppressing vibrations. Unwanted consequences like chaotic dynamics, limit cycles, or loss of stability can result from bifurcation, which is the abrupt qualitative change in a system’s behavior as a parameter. The outcomes showed how effective the suggested controller is at reducing vibrations. According to the findings, bifurcation analysis and a control are crucial for designing vibrating dynamic motorcycle systems for a range of engineering applications. The MATLAB software is utilized to match the analytical and numerical solutions at time–history and frequency–response curves (FRCs) to confirm their comparability. Additionally, case studies and numerical simulations are presented to show how well these strategies work to control bifurcations and guarantee the desired system behaviors. An analytical and numerical solution comparison was prepared.
MSC:
65P40; 70K20; 74H10; 74H45

1. Introduction

The two basic purposes of a suspension control system’s scheme are to ensure driving stability and to provide a comfortable ride. Three measures are frequently employed to assess a suspension system in relation to these goals: tire deflection, vertical acceleration, and suspension stroke of the sprung mass [1]. Suspension stroke and tire deflection are used to assess driving stability. The relationship between the three metrics and the two objectives is well summarized in the literature [2,3]. While driving stability is correlated with the movement of the un-sprung mass, ride comfort is correlated with the motion of the sprung mass. It is challenging to drive steadily and maintain a comfortable ride. The heaviness of choosing the performance objective or modifying the neutral function has thus been the subject of the majority of research. Linear quadratic regulator (LQR) [4], LQ static control [5,6], H∞ control [7,8], fuzzy control [9,10], adaptive control [11,12], back-stepping control [13,14], and model predictive control (MPC) [15,16] are some of the controller design approaches that have been used to create vehicle suspension systems. Ride comfort and vehicle stability may be jeopardized in typical road configurations due to increased wheel motion caused by uneven road surfaces [17,18]. Commercial vehicles frequently use active actuators, including hydraulic, electromagnetic, and electromechanical types. They do, however, have expensive components and high-power consumption. Hydraulic shock absorbers, magnetorheological (MR) dampers [19,20], electrorheological (ER) dampers [21], and electromagnetic dampers [22] are examples of semi-active actuators that, in contrast, provide higher stability, reduced power requirements, and a more compact design. Nevertheless, they are limited to producing force within particular velocity–force quadrants.
People’s health may suffer from negative vibrations brought on by trains, motorcycles, noise, and other sources. System variables like damping, excitation amplitude, and the system itself all have an influence on the vibration amplitudes of a system when it is directly excited. When there are significant nonlinearities or when the excitation frequency is near one of the system’s intrinsic frequencies, massive responses can be acquired in directly motivated systems. However, parametrically stimulated systems are sensitive to extremely large vibration amplitudes because the force manifests as time-varying coefficients in the equation of motion. Numerous applications, including counting vibration energy harvesting, response intensification, oscillation suppression, and signal identification, have made extensive use of parametric excitation. Vibration energy harvesters transform ambient vibrations’ mechanical energy into useful electrical power. Vibration energy harvesting is demonstrated to be a well-organized energy source for everyday use of electronic devices when performed properly [23]. The most widely used mechanical-to-electrical transduction devices in vibration energy harvesting are piezoelectric [24], magnetostrictive [25], electrostatic [26], and electromagnetic [27]. Additionally, a number of control device solutions have been researched and shown to reduce the dangerous vibrations brought on by numerous nonlinear systems [28,29,30,31].
Worldwide, motorcycle riders make up 23% of all traffic contributors [32], and crashes with car passengers are included in the list of frequent traffic accidents [33]. In Poland, for instance, it can be stated that the number of car and motorcycle accidents is equal to 1% of the total number of recorded vehicles. The average amount of time spent riding a motorcycle each year is significantly less than that of a car, which is important in the case of motorcycles. Motorcycles make up around 5% of all recorded motor vehicles in Poland, according to Refs. [3,4]. In 2019 alone, motorcycle riders were involved in 8.6% of accidents, which resulted in 8.6% of damages and 14.2% of fatalities. Motorcycle accidents remain at the same level, even though the total number of traffic accidents fell by over 30% between 2007 and 2019 [34,35]. Additionally, long-lasting, albeit tiny, vibrations may be generated that serve to diminish safety, which may have the effect of momentary perceptual disruptions and detrimental well-being [36]. Motorcycle vibrations are characterized by a variety of frequencies that arise from both external excitations and natural vibrations. Different natural frequencies are present in a motorcycle’s structure, and resonance may be caused by the frequencies that arise from external excitation [37]. Because organs and body parts have unique natural frequencies, vibrations in the frequency range of 0.1 to 100 Hz can have especially negative impacts on people (Figure 1). Even after several hours of riding, limb numbness and decreased sensation may be experienced, and they may last for many days. Ref. [37] provided the frequency values.
To decrease the impacts of vibrations on humans, it is essential to investigate the basis of oscillations, seek solutions to lessen them, and assess the impacts on the body. Nonetheless, numerous studies have assessed the effects of vibrations on humans, including vibrations created by the structure of a motorcycle. For instance, Ref. [38] used four motorcycles with varying masses and geometrical characteristics to measure the acts of shaking on a motorcyclist on seven various exteriors. Acceleration sensor placement is very important. It has been demonstrated, nevertheless, that the vibrations sent to the driver are so strong that they can have negative physiological effects on people, even after brief exposure. Motorcycle motion and vibration examinations are carried out via specialized investigation outlooks to confirm the studies within computer simulation and mathematical modelling. Regrettably, scientific publications hardly ever describe this kind of research. Consequently, Ref. [39] details experiments with a distinct routing scheme of a motorcycle whose tire wheel rotates on a sliding strap. However, in [40,41], bench tests are carried out with a motorcycle that is partially restrained and whose front wheel works with a revolving drum that reflects the road surface. The examinations are carried out using the mathematical model described in [42], which also details how it was verified. The use of mathematical models has expanded with the advancement of computer techniques. With the help of the motorcycle model outlined in [43], the author was able to identify the three types of vibrations that arise when riding a motorcycle hands-free: capsize, weave, and wobble. This already demonstrates that the dynamics of a motorcycle can be analyzed using comparatively basic models [44]. Mainframe susceptibility was later added to the research by both Sharp (as outlined in [44,45]) and Kane [46]. Thus, it was demonstrated that the mainframe’s stiffness has a chief influence on the motorcycle’s stability and, consequently, its weave vibration, but it has no effect on the other two. Regrettably, there are not many models available for the frequency analysis of vibrations in motorcycle steering. It is especially important to draw attention to Ref. [47], a thorough book on motorcycle dynamics. A detailed analysis was conducted on the impact of different motorcycle structural parameters on vibration damping at varying speeds. The presence derived from the single mass model includes the conclusion that the steering system’s moment of inertia may be significant for a motorcycle’s stability. This model, however, ignores a number of additional steering parameters, the precise values of which may also be responsible for vibration. The natural frequency of the routing structure is determined in other works, such as [48,49,50].
Bifurcation analysis is crucial for researching dynamical models because it illustrates how system behavior changes when parameters change, making it possible to find stability thresholds and important transitions. Researchers can use bifurcations to detect transitions from stable states to quasiperiodic, periodic, or chaotic regimes in order to understand complicated dynamics in fields such as engineering, physics, and biology. By giving a detailed account of how a system responds to external incentives, this study sheds light on both expected and impulsive behaviors [51,52]. In the end, it aids in the development of control approaches to guarantee preferred performance and avoid unintended chaotic reactions in practical applications. Several works on various controls of different systems for vibration suppression. Three different control techniques were introduced to eliminate the undesired vibrations of the twelve-pole rotor electromagnetic suspension system. The introduced control algorithms were the proportional derivative (PD) controller, the integral resonant controller (IRC), and the positive position feedback (PPF) controller as well as their different combinations (i.e., PD + IRC, PD + PPF, and PD + IRC + PPF) schemes for mitigating the rotor’s undesired vibrations and improving its catastrophic bifurcation [53]. A PD + PPF integration showed lateral vibration suppression and stabilization of quasiperiodic motions in rotor systems [54]. A slightly different variant, a PD + CPPF (Compensated Positive Position Feedback), has been proposed for attitude control with flexible appendages [55]. The positive position feedback (PPF) controller and the adaptive positive position feedback (APPF) controller are suggested to control the primary resonance vibration of a nonlinear dynamical system to track excitation frequencies automatically [56].
This paper investigates a new active control method with a bifurcation study on the dynamic performance of a motorcycle model subjected to harmonic excitation, focusing on the simultaneous primary and 1:1 internal resonance case ( Ω ω e q ,   ω 2 ω e q ). The analysis utilizes multiple scales and numerical methods to assess the system’s stability through frequency–response equations and bifurcation analysis. A novel control technique, termed proportional derivative positive position feedback (PDPPF), is introduced to mitigate dangerous vibrations typically observed in such dynamic systems. The PDPPF controller combines the advantages of traditional proportional derivative (PD) control and positive position feedback (PPF), and its performance is compared with conventional PD and PPF controllers. The outcomes display that the PDPPF controller significantly outperforms the other methods in reducing vibration amplitudes. In addition to the proposed control strategy, this study delves into the act of bifurcations on the system’s performance. It explores how variations in system parameters can induce chaotic dynamics, limit cycles, or instability, further complicating the system’s response. Bifurcation analysis provides crucial insights into the regions where these transitions may occur, making it an essential tool for understanding system stability and designing effective control strategies. Both analytical and numerical solutions, validated through MATLAB simulations, demonstrate good agreement, confirming the strength of the offered control process. The outcomes emphasize how crucial the PDPPF controller and bifurcation analysis are to guaranteeing the intended system performance and stability. The results offer valuable insights for the dynamic system design of engineering applications, where vibration control is critical to maintaining stability and performance under resonant conditions.

2. Description of the Non-Perturbative Approach (NPA)

Examine a weakly nonlinear oscillator as a nonlinear ordinary differential equation (ODE) of the following type that is extremely nonlinear up to the third order, expressed as
η ¨ + F ( η , η ˙ , η ¨ ) + G ( η , η ˙ , η ¨ ) + H ( η , η ˙ , η ¨ ) = f t ,
where f ( t ) is the excitation force, each F ( η , η ˙ , η ¨ ) and G ( η , η ˙ , η ¨ ) are odd functions. As is well known, these functions produce secular terms [57,58]. At the same time, H ( η , η ˙ , η ¨ ) is a quadratic function. Overall, up to the third order, these functions may typically be formulated as follows:
F ( η , η ˙ , η ¨ ) = a 1 η ˙ + b 1 η η ˙ η ¨ + c 1 η 2 η ˙ + d 1 η ˙ 3 + e 1 η ¨ 2 η ˙ G ( η , η ˙ , η ¨ ) = ω 2 η + a 2 η 3 + b 2 η η ˙ 2 + c 2 η ¨ η 2 + d 2 η ¨ η 2 H ( η , η ˙ , η ¨ ) = a 3 η η ˙ + b 3 η ˙ 2 + c 3 η 2 + d 3 η ˙ η ¨ + e 2 η η ¨
where a i , b i , c i , d i , e j ( i = 1 , 2 , 3 )   ( j = 1 , 2 ) are coefficients that remain constant, and ω symbolizes the structure’s natural frequency.
As previously documented [59,60,61,62,63,64], the NPA seeks to transform a weakly nonlinear second-order differential equation oscillator into a linear form. Indeed, this concept was founded by the ancient Chinese upon the knowledge of He’s frequency formula. To help readers, the methodology of NPA is presented in this section, where Equation (1) represents a general form of a nonlinear ordinary differential equation oscillator. Actually, the formulae in Equation (2) provide the nonlinear coefficients that appear in Equation (1). In light of the progression of NPA, the restrictions on these nonlinear terms depend on the behavior of these functions, not on their signs. As is well-known from all traditional perturbations, especially the multiple time-scale method, the odd terms produce secular terms; meanwhile, the even terms do not. Therefore, in general, one obtains three different categories. The first functions deal with odd terms of the damping ones F ( η , η ˙ , η ¨ ) . The second concerns odd terms with no damping G ( η , η ˙ , η ¨ ) . Finally, the last ones H ( η , η ˙ , η ¨ ) concern the quadratic terms. Actually, the previous three functions are analyzed differently. It should be noted that there are three different limitations concerning NPA. These restrictions may be listed as follows:
  • The method deals with weakly nonlinear oscillators.
  • The initial conditions are fixed with no changes.
  • To obtain better accuracy, the initial amplitude must be less than unity.
To achieve this goal, as per He [59], a guessing solution of the provided nonlinear ODE is as follows [59]:
z = A cos φ t
The initial conditions (ICs) are assigned as z ( 0 ) = A , and z ( 0 ) = 0 .
The total frequency, which will be ascertained later, is captured by the parameter φ . Below provides the necessary linear differential equation:
z + ζ z + ϖ 2 z = Γ
The three criteria can be assessed in the manner described below, as demonstrated before [59,60,61,62,63,64]:
ζ = 0 2 π / φ z F ( z , z , z ) d t 0 2 π / φ z 2 d t = ζ ( φ )
Actually, the positivity of the parameter ( ζ ) produces a decay of the solution and then enhances the stability zones.
Think about a similar frequency, ϖ 2 , which can be computed using the following function and the overall frequency:
ϖ 2 = 0 2 π / φ z G ( z , z , z ) d t 0 2 π / φ z 2 d t = ϖ 2 ( φ )
The symbol ϖ 2 is just a sign to indicate the equivalent frequency. After performing the linear ODE, a simple harmonic motion provides an expression of total frequency. Actually, the square of the total frequency must be positive to yield the stability criterion.
It should be noted that the quadratic formula is a part of the non-secular section.
As shown by Moatimid et al. [63,64], the last parameter Γ is the resultant force H ( η , η ˙ , η ¨ ) , which can be presented as
Γ = F H ( η , η ˙ , η ¨ )
Consequently, the inhomogeneity will be calculated by substituting η E A , η ˙ E A φ , and η ¨ E A φ 2 , even in the non-secular function H ( η , η ˙ , η ¨ ) . As previously shown [59,60,61,62,63,64], the parameter E is denoted as E = 1 / 2 n r , where n demonstrates the system’s order and r represents the system’s level of freedom. Consequently, in this instance, one receives n = 2 , and r = 1 , formerly, the value of E = 1 / 2 , corresponds to the quadratic’s (non-secular term’s) value. As a result, the inhomogeneity component will be calculated by substituting
η A 2 ,   η ˙ A φ 2 ,   and   η ¨ A φ 2 2 .
The following substitution can be used to express Equation (4) in the ordinary normal form for simplicity’s sake:
z ( t ) = f ( t ) E x p ( ζ t / 2 )
Actually, to convert the linear ODE as given in Equation (4) into a simple harmonic motion, the middle term in Equation (4) should be removed. This process is simply obtainable via the standard normal form, as shown in Equation (8).
When Equation (8) is entered into Equation (4), it produces
f + ϖ 2 1 4 ζ 2 f = Γ E x p ( ζ t / 2 )
Lastly, the total frequency is stated as φ 2 = ϖ 2 1 4 ζ 2 .
The NPA method is presented in the step-by-step flowchart in Figure 2 to enhance clarity and readability. The diagram outlines the essential stages of the approach, emphasizing the procedures that simplify and improve the problem-solving process. In this framework, a nonlinear ordinary differential equation is analyzed by combining the NPA with He’s frequency formula. The method transforms the nonlinear ODE into an equivalent linear form by proposing a trial solution, which is subsequently verified and validated through numerical simulations.

3. Application of NPA: Equivalent Equation of a Dynamic Motorcycle

This study examines the dynamic vibration of a motorcycle, with relevance to the processes mentioned above. The mathematical model of a dynamical structure consisting of a single degree of freedom (SDOF) is displayed in Figure 3.
The symbols of the system modeling can be considered as follows:
SymbolDescription
m e q The equivalent mass of rider and motorcycle
c e q The equivalent damping coefficient
k e q The equivalent stiffness through a linear and nonlinear spring k e q = k e q 11 l i n e a r + k e q 12 + k e q 13 ( n o n l i n e a r )
x , x ˙ , x ¨ Displacement, velocity, and acceleration, respectively.
ω e q The equivalent natural frequency ω e q = k e q 11 m e q
μ e q The equivalent damping factor μ e q = c e q m e q
α e q Cubic nonlinear duffing factor α e q = k e q 12 m e q
β e q Quintic nonlinear duffing factor β e q = k e q 13 m e q
f e q External excited force f e q = F m e q
Ω Excitation forcing frequency coefficient
The kinetic energy ( T ) and potential energy ( V ) of the SDOF system can be expressed as follows:
T = 1 2 m e q x ˙ e q 2
V = 1 2 k e q 11 x e q 2 + 1 4 k e q 12 x e q 4 + 1 6 k e q 13 x e q 6
Equations (10) and (11) allow for the expression of the Lagrangian function ( L ) in the following way:
L = T V = 1 2 m e q x ˙ e q 1 2 k e q 11 x e q 2 1 4 k e q 12 x e q 4 1 6 k e q 13 x e q 6
The system equations of motion can be determined in the manner described below using Lagrange’s formulation:
d d t L x ˙ e q L x e q = c e q x ˙ e q + F cos Ω t
The fundamental equation of motion may be written as a nonlinear ordinary differential equation in the form
m e q x ˙ e q + k e q 11 x e q + k e q 12 x e q 3 + k e q 13 x e q 5 = c e q x ˙ e q + F cos Ω t
Dividing Equation (14) by m e q yields
x ¨ e q + c e q m e q x ˙ e q + k e q 11 m e q x e q + k e q 12 m e q x e q 3 + k e q 13 m e q x e q 5 = F m e q cos Ω t
Then, the equation of motion can be presented as
x ¨ e q + μ e q x ˙ e q + ω e q 2 x e q + α e q x e q 3 + β e q x e q 5 = f e q cos Ω t
As usual, the initial conditions are written as follows [59,60,61,62,63,64]:
x ( 0 ) = A , x ˙ 0 = 0
To solve the nonlinear structure, the NPA must generate a trial solution that satisfies the initial conditions.
One way to characterize the recommendation trial solution would be as follows
v = A cos ( φ t ) v ˙ = A φ sin ( φ t ) v ¨ = A φ 2 cos ( φ t )
Now, Equation (16) may be formulated as follows:
x ¨ e q + f 1 x + f 2 x ˙ = f e q cos Ω t
where
f 1 x = ω e q 2 x e q + α e q x e q 3 + β e q x e q 5 f 2 x ˙ = μ e q x ˙ e q
One useful technique for estimating the frequency is weighted residual improvement. The existence of odd terms in the basic equation of motion can be ascertained using this frequency estimate. The following conclusion, which has been previously reported [59,60,61,62,63,64], can be reached by using this method in conjunction with Equation (12) to approximate the frequency
ϖ 2 = 0 2 π / φ x f 1 x d t / 0 2 π / φ x 2 d t
Following the presentation and demonstration of the nonlinear oscillators’ abbreviated frequency construction, adaptation was recommended. Using the mathematics software, we can simplify the integration result of Equation (6), which is rather challenging. One sorts out
ϖ 2 = ω e q 2 + 5 8 β e q A 4 + 3 4 α e q A 2
Equation (22) represents the equivalent frequency of the associated linear ODE. Similarly, the corresponding equivalent damping can be determined as follows:
ζ = 0 2 π / φ x ˙ f 2 x d t / 0 2 π / φ x ˙ 2 d t .
As previously shown, we can evaluate the integrations in Equation (23) as follows
ζ = μ e q
Now, the associated linear ODE can be produced as
v ¨ + ϖ 2 v + ζ v ˙ = f e q cos Ω t
Equation (25) can be converted to its normal approach as follows:
v t = f t e ζ 2 t
Substituting Equation (26) into Equation (25), it is indicated to be
f ¨ t + φ 2 f t = f e q cos Ω t e ζ 2 t
where φ 2 = ϖ 2 ζ 2 4 .
Assuming a like preceding initial conditions, f 0 = A and f ˙ 0 = 0 , and referring to the earlier linear Equation (27), the solution of the linear equation is expressed as
f t = A γ 1 f e q γ 1 2 + γ 2 2 cos φ t γ 1 ζ 2 + γ 2 Ω f e q γ 1 2 + γ 2 2 sin φ t + γ 1 cos Ω t + γ 2 sin Ω t f e q e ζ 2 t γ 1 2 + γ 2 2
where
γ 1 = ϖ 2 Ω 2 , γ 2 = Ω ζ
From Equations (26) and (28), we obtain the following:
v t = A γ 1 f e q γ 1 2 + γ 2 2 cos φ t e ζ 2 t γ 1 ζ 2 + γ 2 Ω f e q γ 1 2 + γ 2 2 sin φ t e ζ 2 t + γ 1 cos Ω t + γ 2 sin Ω t f e q γ 1 2 + γ 2 2
The stability conditions can be written as
φ 2 > 0 , and ζ > 0 .

3.1. Validation of NPA

For convenience, a numerical comparison between Equations (16) and (25) is plotted for a selected system in the manner described below to validate the theoretical result that was obtained:
μ e q = 0.1 , ω e q = 1 , α e q = 0.5 , β e q = 0.3 , f e q = 0.5 , Ω = 3 , A = 0.01
The numerical solution (NS) of the nonlinear ODE (16) and the solution derived from the NPA-based linear ODE (25) are contrasted in Figure 4. The great precision and dependability of the suggested NPA are demonstrated by the close agreement between the two solutions. This high degree of consistency attests to the reliability and good agreement of the results generated by both methods. Additionally, Table 1 presents and summarizes the absolute errors that were computed using a MATLAB R2023b program.

3.2. Stability Analysis for NPA

Figure 5a–c illustrates the stability regions of a dynamical system in terms of the parameters A (x-axis) and φ 2 (y-axis), under different sets of the damping coefficient μ e q = 0.1 , 1 , 1.5 . The green regions represent the unstable regions for different values μ e q , while the area above the curve corresponds to the stable region for the given parameter values.

3.3. Demonstrates the Time History at Various Parameters and the Polar Plot

The effects of the parameters f e q and Ω are illustrated in Figure 6 and Figure 7 to highlight their respective roles in the amplitudes of the motion solutions to Equation (29). Figure 6, for instance, shows how the excited force f e q affects the system. As observed, increasing the force f e q leads to a larger solution amplitude, suggesting that this parameter has an undermining effect on the stability outline. The influence of the excitation frequency coefficient Ω is depicted in Figure 7. It is well known that as the system moves further from resonance states, the solution amplitude decreases.
Here is a polar plot of the solution of Equation (29) over the time interval 0 , 50 π . Figure 8 has been graphed to clarify the function v t in a polar formula, rendered to the distinct values of f e q = 0.5 , 0.8 , 1 . This figure indicates the behavior of the structure at a minor difference in the values of its excitation force, where f e q is measured. Moreover, the system is sensitive to the variation in these values. The diagrams have stable behaviors and symmetric procedures regarding the origin point of these graphs, and their strength increases with the slight variation that happens in the excitation force value.

4. The Vibrating Dynamic of the Motorcycle via the PDPPF Controller

It is important to note that the Non-Perturbative Approach (NPA), discussed in the previous subsection, provides an accurate baseline description of the system without control. However, when resonance is approached, higher-order nonlinear interactions and secular terms dominate the dynamics, and the NPA alone becomes insufficient for capturing these critical behaviors. For this reason, the Method of Multiple Scales (MMS) is employed in the following analysis. The NPA results thus establish a global system without control, while the MMS framework enables a precise characterization of the resonant responses that are essential for evaluating and validating the proposed PDPPF control strategy. In this way, the two methods are complementary rather than independent, ensuring that both non-controlled and controlled operating conditions are thoroughly addressed.

4.1. Motion Equations Within the Control Process

Following the system model’s connection to the PDPPF control, which incorporates two control proportional derivatives and positive position feedback of the compensating output as a control force, the equations of motion for the dynamic framework are displayed as
x ¨ e q + ε μ e q x ˙ e q + ω e q 2 x e q + ε α e q x e q 3 + ε β e q x e q 5 = ε f e q cos Ω t + ε G 1 y ε γ 1 x e q ε γ 2 x ˙ e q
y ¨ + ε μ 2 y ˙ + ω 2 2 y = ε G 2 x e q
The vibrations’ amplitudes are expected to be of a minor parameter’s order 0 < ε 1 . In contrast, the control’s natural frequency is designated as ω 2 . Likewise, the control’s damping coefficient is to be μ 2 . The PDPPF controller gains are G 1 , γ 1 , γ 2 , and the feedback signal gain is G 2 .

4.2. Time Histories and Phase-Planes via Numerical Simulation

RK-4 is used to simulate numerically the dynamical model mentioned above in order to explain the time histories of the measured framework before adding a controller at one of the worst resonance instances, which is accessible as the simultaneous primary and 1:1 internal resonance case Ω ω e q , and ω 2 ω e q with the initial conditions x 0 = 0.01 ; x ˙ 0 = 0 ; y 0 = 0 ; y ˙ 0 = 0 .
These calculations were derived using MATLAB software controllers. Consequently, the model’s chosen dimensionless parameters are as follows:
μ e q = 0.1 , ω e q = 1 , α e q = 0.5 , β e q = 0.3 , f e q = 0.5 , Ω = ω e q , μ 2 = 0.003 , ω 2 = ω e q , G 1 = 2 , G 2 = 0.5 , γ 1 = 2 , γ 2 = 2 .
All numerical simulations were performed in MATLAB using the ODE45 solver (adaptive Runge–Kutta (4,5)), with default tolerances (RelTol = 10−3, AbsTol = 10−6).
Figure 9a presents the time history for the steady-state amplitude of the uncontrolled dynamical framework. As shown, the amplitude proceeds to 0.951073 for x . The dynamical system is stable with a multi-limit cycle, as presented in Figure 9b.
On the opposite hand, Figure 10a, is the steady-state amplitude of the dynamical scheme after adding the PDPPF controller to develop 6.75 × 10 4 for x , with a small amplitude value y for PDPFF, as exposed in Figure 10c. Hence, by applying this control, the vibration amplitude is lessened by the ratio 99.93% for x . Lastly, the efficiency of the PDPPF controller E a is referred to ( E a = the steady-state amplitude of the construction before the controller PDPPF/the steady-state amplitude of the construction after the control PDPPF) as 14,090 for x . The phase plane aimed at the framework and the PDPPF controller are stable, with a slightly chaotic cycle, as shown in Figure 10b,d.

4.3. Mathematical Treatment

Applying the MTSM, as mentioned in [57,58], obtains the perturbation solution for Equations (31) and (32). The first approximation can be expressed as
x e q t , ε = x e q 0 T 0 , T 1 + ε x e q 1 T 0 , T 1 + O ε 2
y t , ε = y 0 T 0 , T 1 + ε y 1 T 0 , T 1 + O ε 2
The derivatives are
d d t = D 0 + ε D 1 +
d 2 d t 2 = D 0 2 + 2 ε D 0 D 1 +
we introduce two time scales, where T n = ε n t and D n = T n ( n = 0 , 1 ) .
Substituting (33)–(36) into (31) and (32) and comparing coefficients of like powers ε , we acquire
O ε 0
D 0 2 x e q 0 + ω e q 2 x e q 0 = 0
D 0 2 y 0 + ω 2 2 y 0 = 0
O ε
D 0 2 x e q 1 + ω e q 2 x e q 1 = 2 D 0 D 1 x e q 0 μ e q D 0 x e q 0 α e q x e q 0 3 β e q x e q 0 5 + f e q cos Ω t + G 1 y 0 γ 1 x e q 0 γ 2 D 0 x e q 0
D 0 2 y 1 + ω 2 2 y 1 = 2 D 0 D 1 y 0 μ 2 D 0 y 0 + G 2 x e q 0
The general solutions of Equations (37) and (38) are produced as
x e q 0 T 0 , T 1 = A 1 T 1 e i ω e q T 0 + c c .
y 0 T 0 , T 1 = A 2 T 1 e i ω 2 T 0 + c c .
where A m ( m = 1 , 2 ) is a complex function in T 1 and cc signifies complex conjugate functions of the exceeding terms.
Relieving Equations (41) and (42) into Equations (39) and (40) and solving the resulting differential equations after eliminating the secular terms from the first approximation, we attain the particular solution of Equations (39) and (40) as
x e q 1 = α e q A 1 3 + 5 β e q A 1 4 A ¯ 1 8 ω e q 2 e 3 i ω e q T 0 + β e q A 1 5 24 ω e q 2 e 5 i ω e q T 0 + c c .
y 1 = 0
The different resonance cases from the above equations are condensed as
(i)
Primary resonance: Ω ω e q
(ii)
Internal resonance: ω 2 ω e q
(iii)
Simultaneous resonance: Any combination of the above resonance cases is considered as simultaneous resonance.
From these resonance scenarios, we measured the simultaneous resonance case as Ω ω e q and ω 2 ω e q and applied them as the resonance conditions with the minor detuning parameters σ 1 and σ 2 according to
Ω ω e q + ε σ 1 , ω 2 ω e q + ε σ 2
Inserting Equation (45) into the minor divisor and secular terms, which have been obtained from the first approximation in Equations (39) and (40), leads to solvability conditions as
2 i ω e q D 1 A 1 = i μ e q ω e q γ 1 i γ 2 ω e q A 1 3 α e q A 1 2 A ¯ 1 10 β e q A 1 3 A ¯ 1 2 + f e q 2 e i σ 1 T 1 + G 1 A 2 e i σ 2 T 1
2 i ω 2 D 1 A 2 = i μ 2 ω 2 A 2 + G 2 A 1 e i σ 2 T 1
Rewrite A n T 1 in polar form as the following:
A n T 1 = 1 2 a n T 1 e i ψ n T 1
where a n are the steady-state amplitudes, and ψ n are the phases of the motion.
Inserting Equation (48) into Equations (46) and (47), associating the imaginary and real parts as
a ˙ 1 = μ e q 2 γ 2 2 a 1 + f e q 2 ω e q sin θ 1 + G 1 2 ω e q a 2 sin θ 2
a 1 ψ ˙ 1 = γ 1 2 ω e q a 1 + 3 α e q 8 ω e q a 1 3 + 5 β e q 16 ω e q a 1 5 + f e q 2 ω e q cos θ 1 + G 1 2 ω e q a 2 cos θ 2
a ˙ 2 = μ 2 2 a 2 + G 2 2 ω 2 a 1 sin θ 2
a 2 ψ ˙ 2 = G 2 2 ω 2 a 1 cos θ 2
where θ 1 = σ 1 T 1 ψ 1 , θ 2 = σ 2 T 1 + ψ 2 ψ 1 .
Then, we obtain ψ ˙ 1 = σ 1 θ ˙ 1 and ψ ˙ 2 = θ ˙ 2 θ ˙ 1 + σ 1 σ 2 . Next, by replacing the last derivatives outcomes into Equations (50) and (52), we have
θ ˙ 1 = σ 1 γ 1 2 ω e q 3 α e q 8 ω e q a 1 2 5 β e q 16 ω e q a 1 4 + f e q 2 ω e q a 1 cos θ 1 + G 1 2 ω e q a 1 a 2 cos θ 2
θ ˙ 2 = θ ˙ 1 + σ 2 σ 1 + G 2 2 ω 2 a 2 a 1 cos θ 2
It is noted that neglecting higher-order terms in MTSM may underestimate chaotic responses; however, this limitation is complemented by the full numerical simulations presented, which capture the complete nonlinear dynamics.

4.4. Frequency–Response Equations

An examination is focused on the constructions a ˙ m = 0 , θ ˙ m = 0 . The frequency–response equations are improved by applying the periodic solution at the fixed points and the stable solutions in Equations (48)–(52), which are displayed as
0 = μ e q 2 γ 2 2 a 1 + f e q 2 ω e q sin θ 1 + G 1 2 ω e q a 2 sin θ 2
a 1 σ 1 = γ 1 2 ω e q a 1 + 3 α e q 8 ω e q a 1 3 + 5 β e q 16 ω e q a 1 5 + f e q 2 ω e q cos θ 1 + G 1 2 ω e q a 2 cos θ 2
0 = μ 2 2 a 2 + G 2 2 ω 2 a 1 sin θ 2
a 2 σ 1 σ 2 = G 2 2 ω 2 a 1 cos θ 2
From Equations (57) and (58), we obtain
sin θ 2 = ω 2 μ 2 a 2 G 2 a 1
cos θ 2 = 2 ω 2 a 2 σ 1 σ 2 G 2 a 1
Substituting Equations (59) and (60) into (55) and (56), we obtain
sin θ 1 = 2 ω e q f e q μ e q 2 + γ 2 2 a 1 + G 1 ω 2 μ 2 a 2 2 2 ω e q G 2 a 1
cos θ 1 = 2 ω e q f e q a 1 σ 1 γ 1 2 ω e q a 1 + 3 α e q 8 ω e q a 1 3 + 5 β e q 16 ω e q a 1 5 G 1 ω 2 a 2 2 σ 1 σ 2 ω e q G 2 a 1
Substituting Equations (59) and (60) in (55) and (56), squaring the given equation after that, and adding both sides together. Also, squaring (57) and (58) and adding both sides together. Then, the frequency–response equations may be written from the previous process as follows:
μ e q 2 + γ 2 2 a 1 + G 1 ω 2 μ 2 a 2 2 2 ω e q G 2 a 1 2 + a 1 σ 1 γ 1 2 ω e q a 1 + 3 α e q 8 ω e q a 1 3 + 5 β e q 16 ω e q a 1 5 G 1 ω 2 a 2 2 σ 1 σ 2 ω e q G 2 a 1 2 = f e q 2 4 ω e q 2
μ 2 2 4 + σ 1 σ 2 2 a 2 2 = G 2 2 4 ω 2 2 a 1 2

4.5. Stability of the Problem

To determine the stability of the attained fixed points’ nonlinear solution.
Let
a m = a m 0 + a m 1 , θ m = θ m 0 + θ m 1 .
where a m 0 and θ m 0 are the solutions of Equations (49)–(54), and a m 1 , θ m 1 are minor perturbations, which are expected to be minor in comparison to a m 0 and θ m 0 .
Substituting Equation (65) into (49)–(54) and expanding for little a 11 , a 21 , θ 11 , θ 21 to carry on linear terms only, we acquire the framework of first-order differential equations, which are offered in the next matrix:
a ˙ 11 θ ˙ 11 a ˙ 21 θ ˙ 21 T = J a 11 θ 11 a 21 θ 21 T ,
J = M 11 M 12 M 13 M 14 M 21 M 22 M 23 M 24 M 31 M 32 M 33 M 34 M 41 M 42 M 43 M 44 .
where J is the Jacobian matrix, and M i j i = 1 , 2 , 3 , 4 j = 1 , 2 , 3 , 4 are presented in Equations (49), (53), (51), and (54), respectively. We can conclude all the Jacobian elements in Appendix A.
Equation (67) is placed in the following determinant form in order to get the eigenvalues of the overhead Jacobian matrix:
M 11 λ M 12 M 13 M 14 M 21 M 22 λ M 23 M 24 M 31 M 32 M 33 λ M 34 M 41 M 42 M 43 M 44 λ = 0 .
To determine the roots of a characteristic polynomial problem, we set out to solve the determinant. Then, we determine which of the next polynomials has the resulting roots:
λ 4 + Γ 1 λ 3 + Γ 2 λ 2 + Γ 3 λ + Γ 4 = 0 .
where Γ i are functions of M i j .
Via the Routh–Hurwitz criterion, the necessary and sufficient conditions for every root of Equation (69) to have negative real parts are that the determinant D and all of its primary minors are positive. The conforming equilibrium solution is asymptotically stable when the real part of each eigenvalue is negative; otherwise, it becomes unstable.
D = Γ 1 1 0 0 Γ 3 Γ 2 Γ 1 1 0 Γ 4 Γ 3 Γ 2 0 0 0 Γ 4 .

5. Simulation of the Results

5.1. Frequency–Response Curves (FRCs) Description

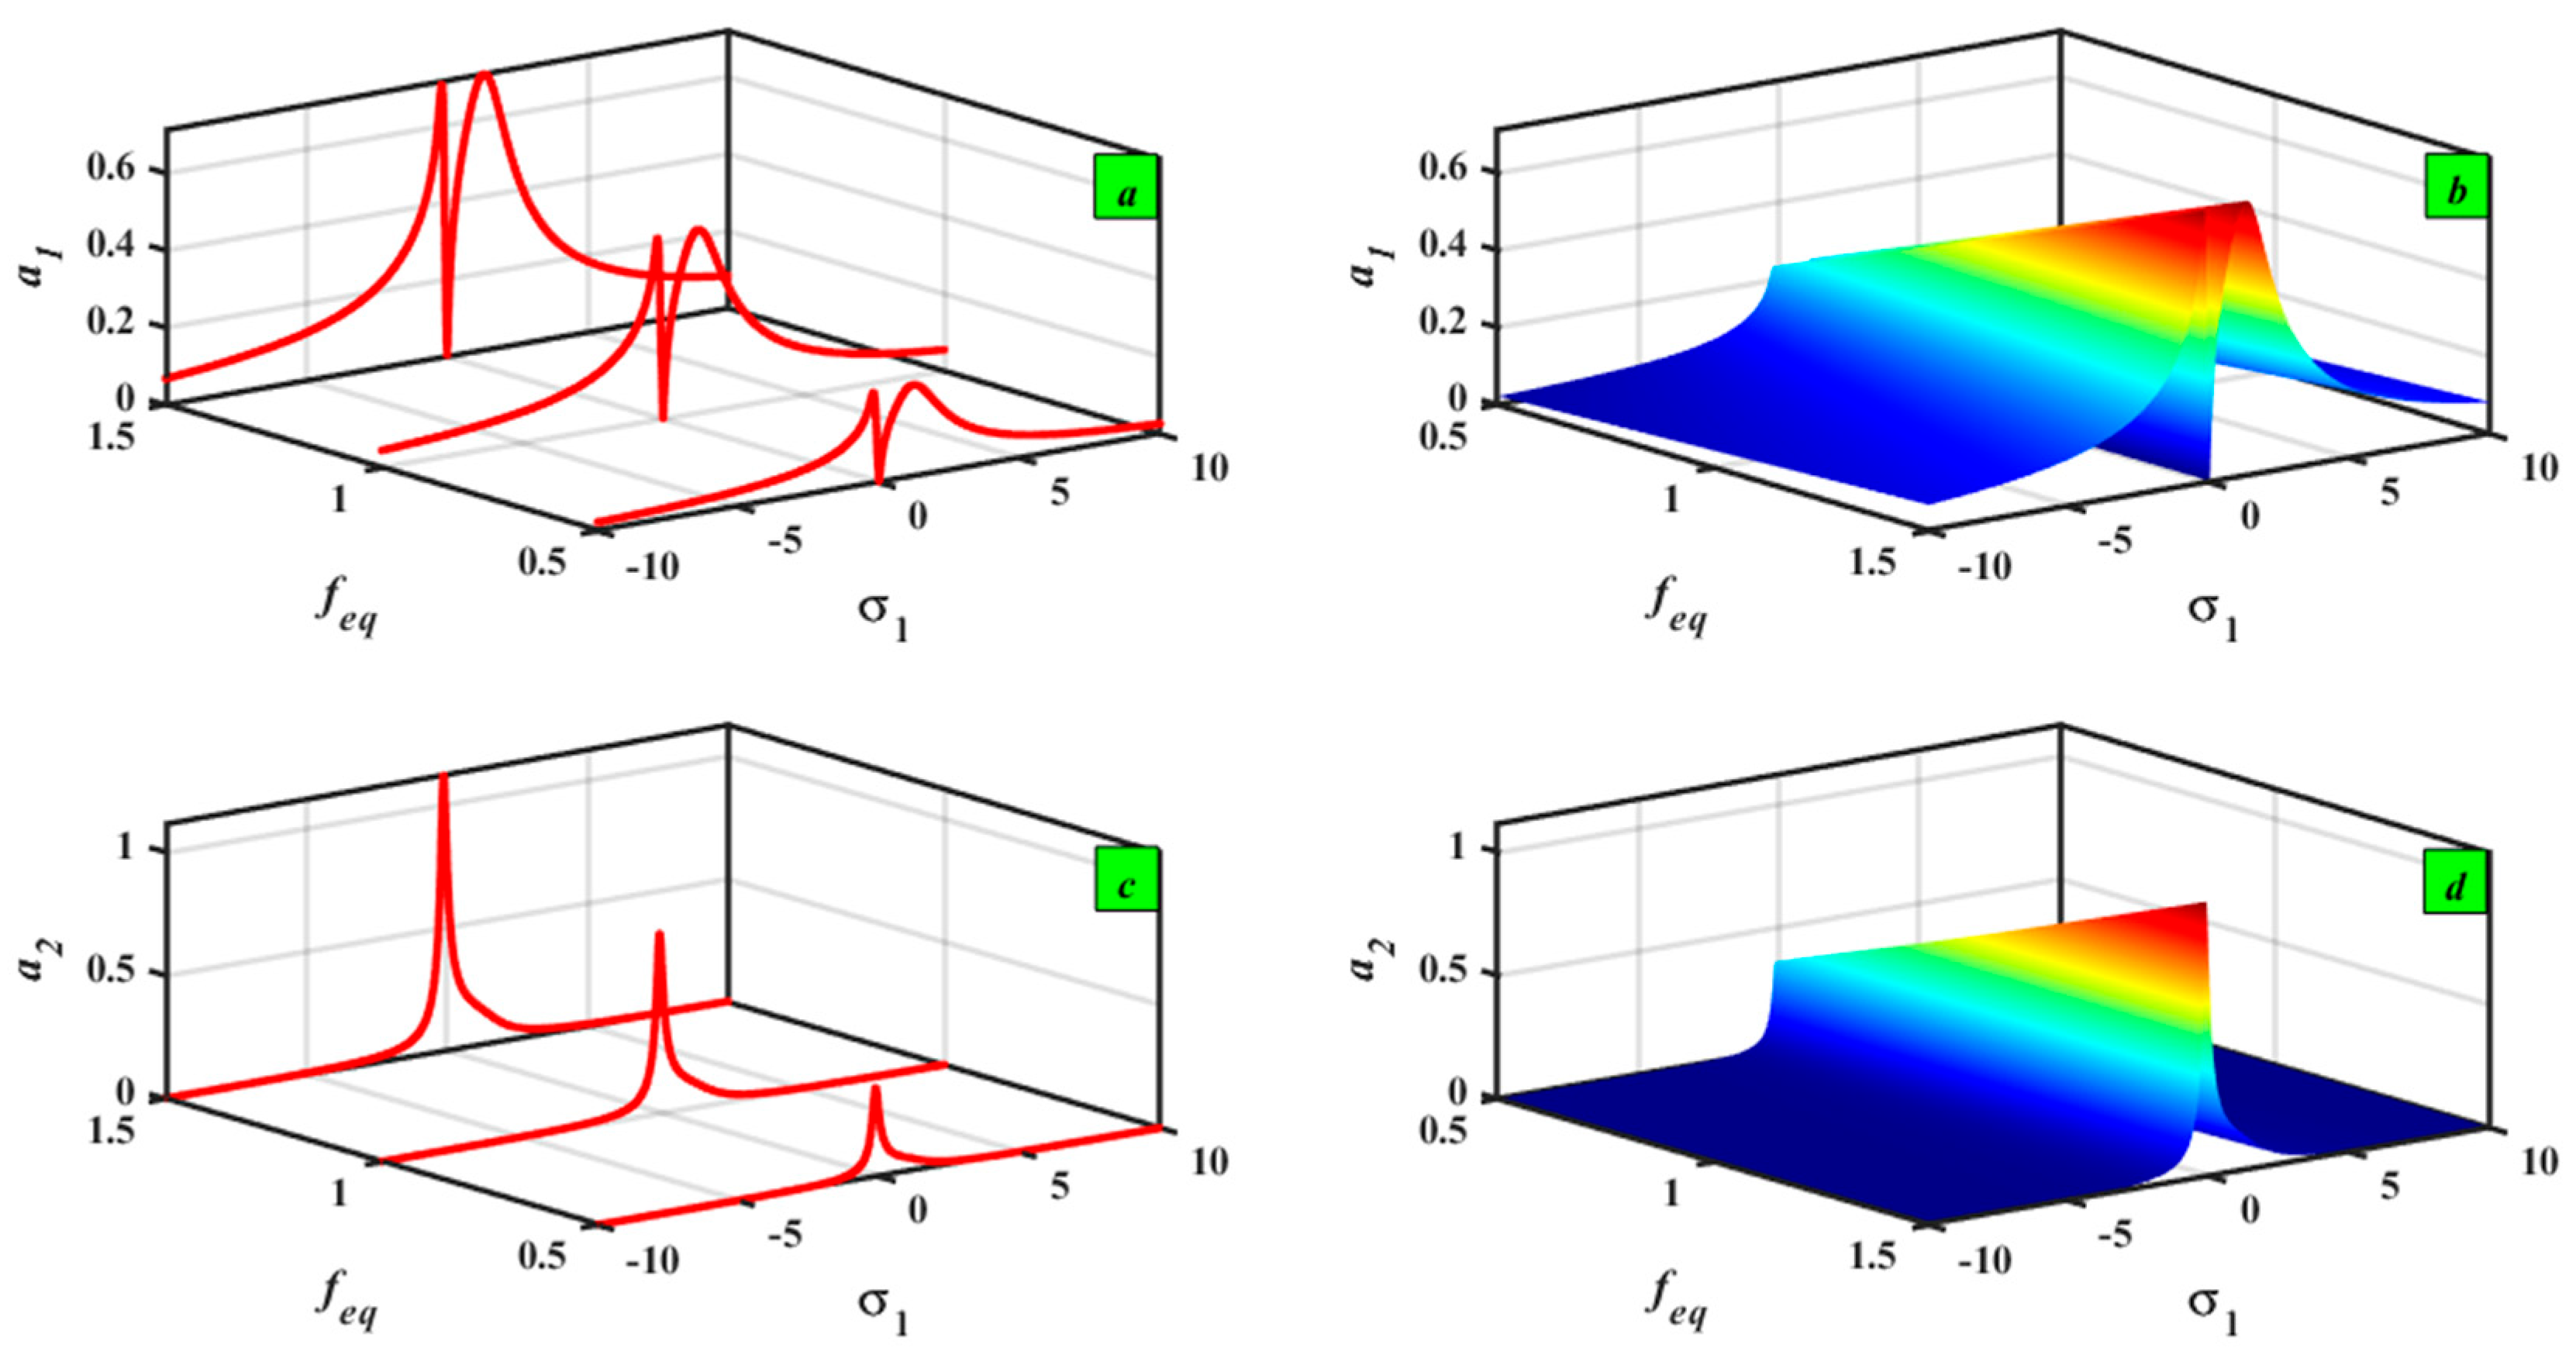
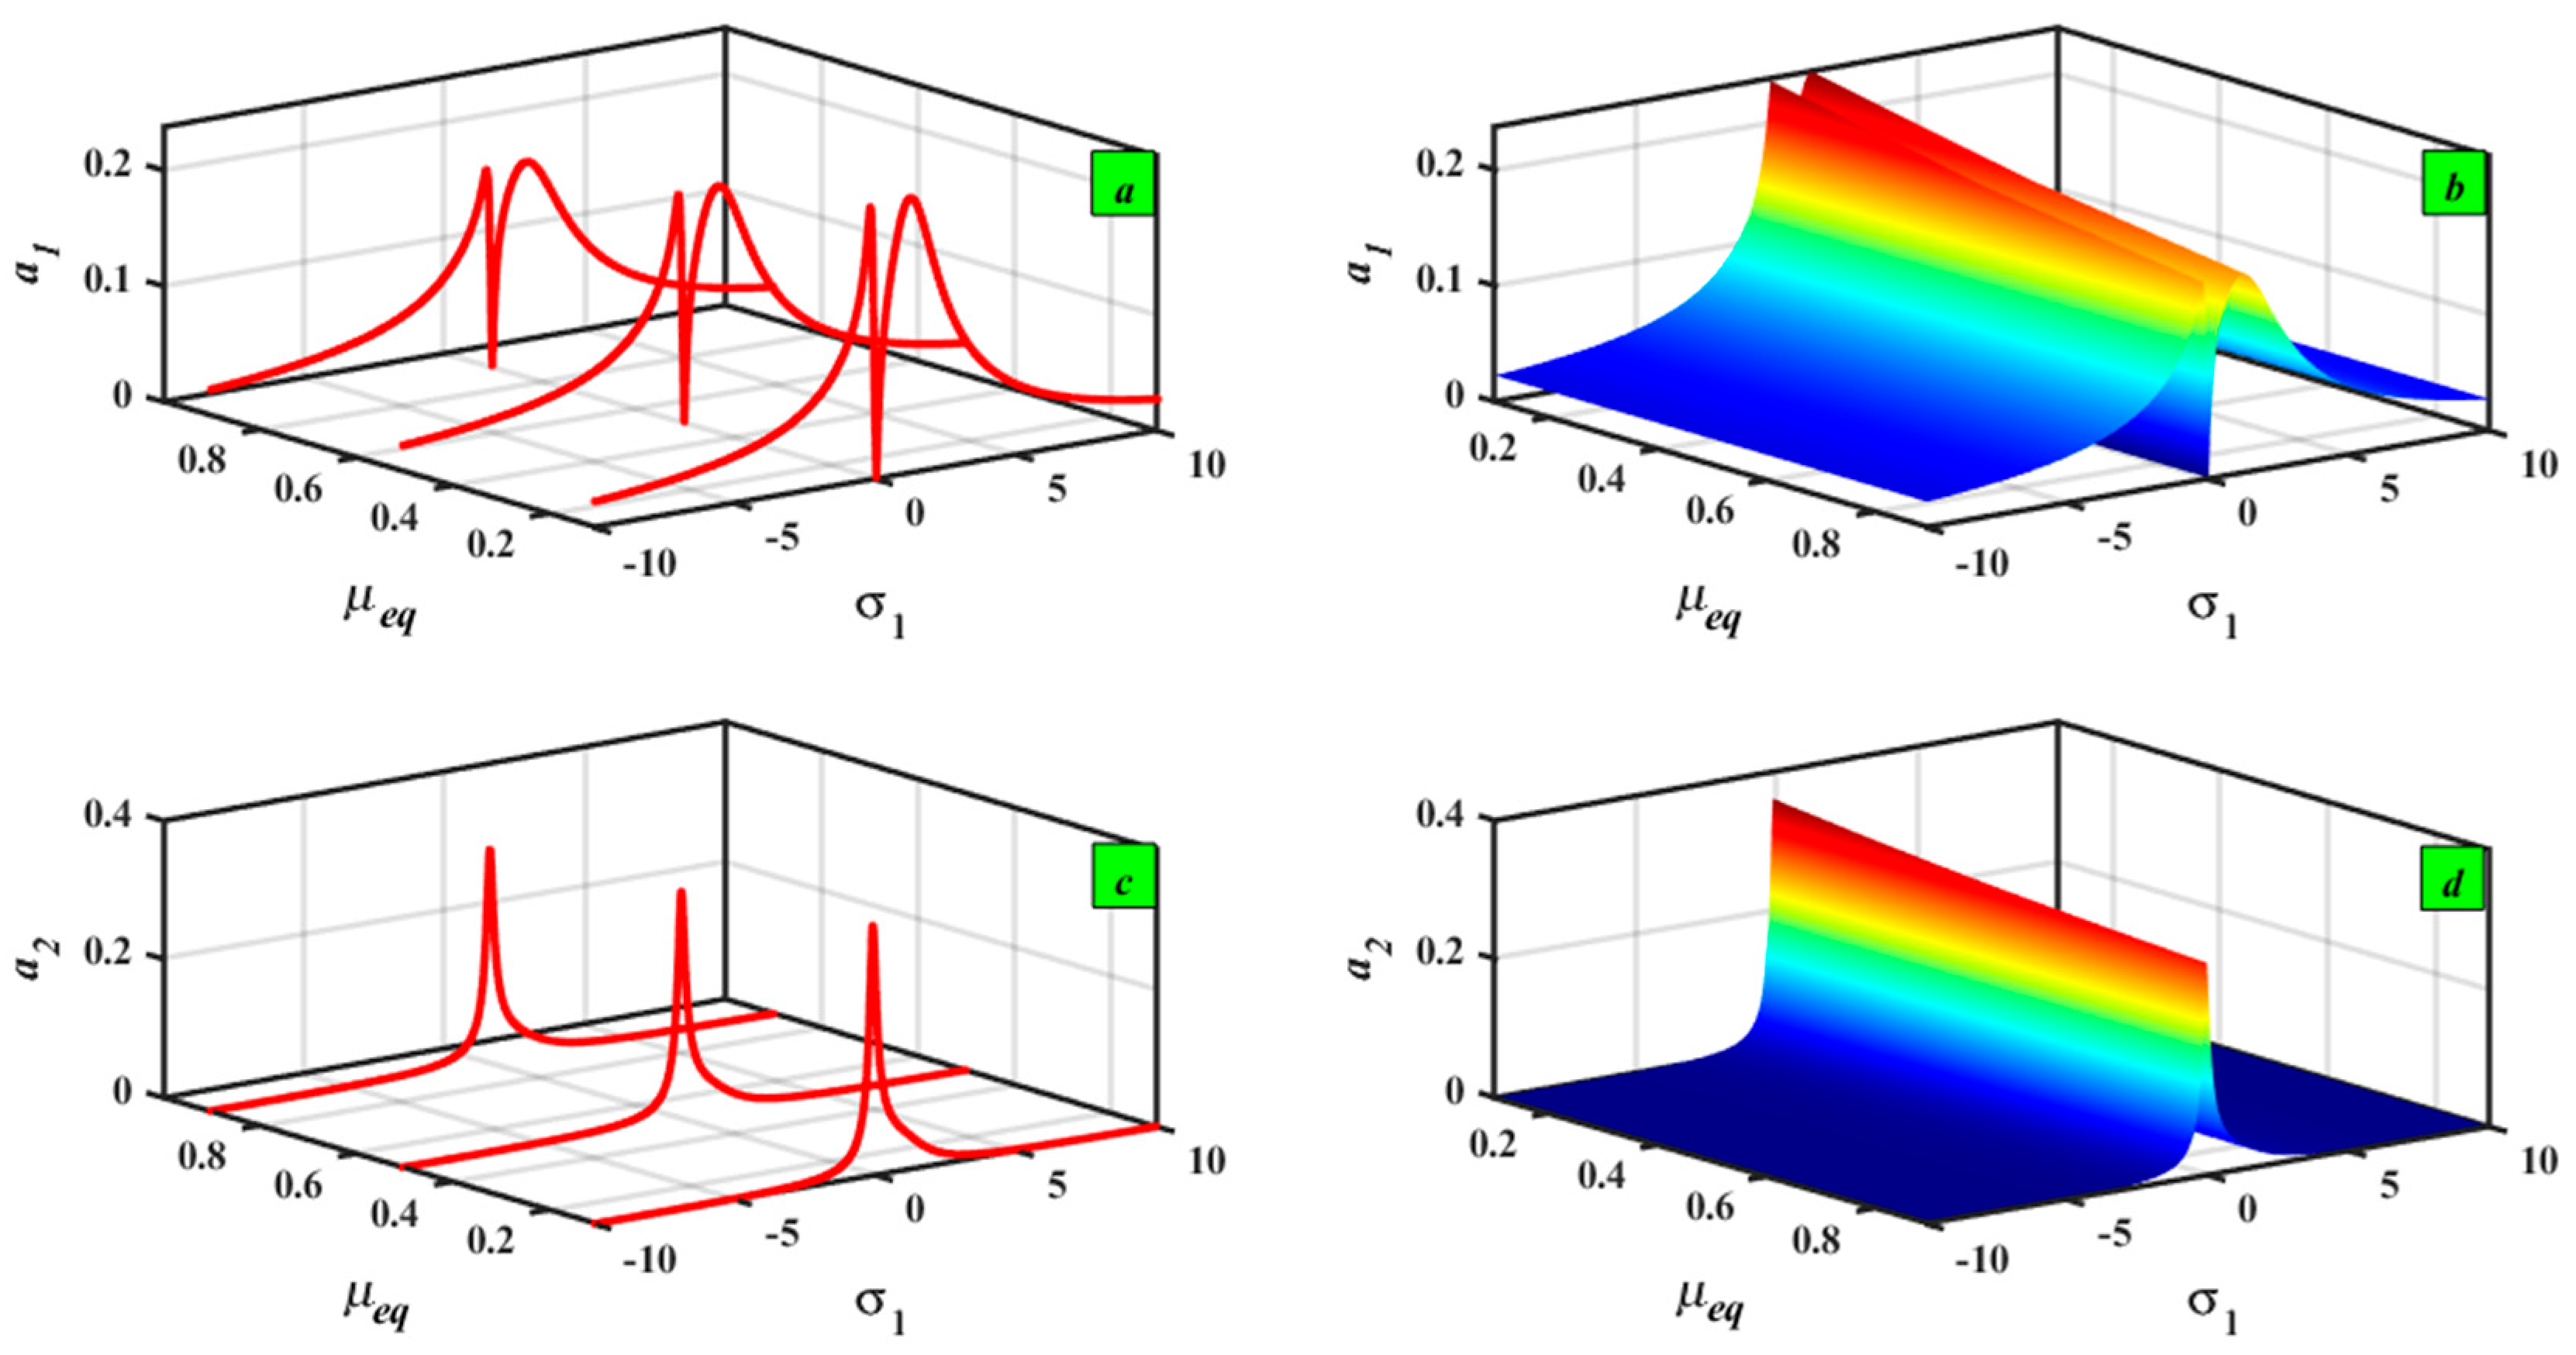
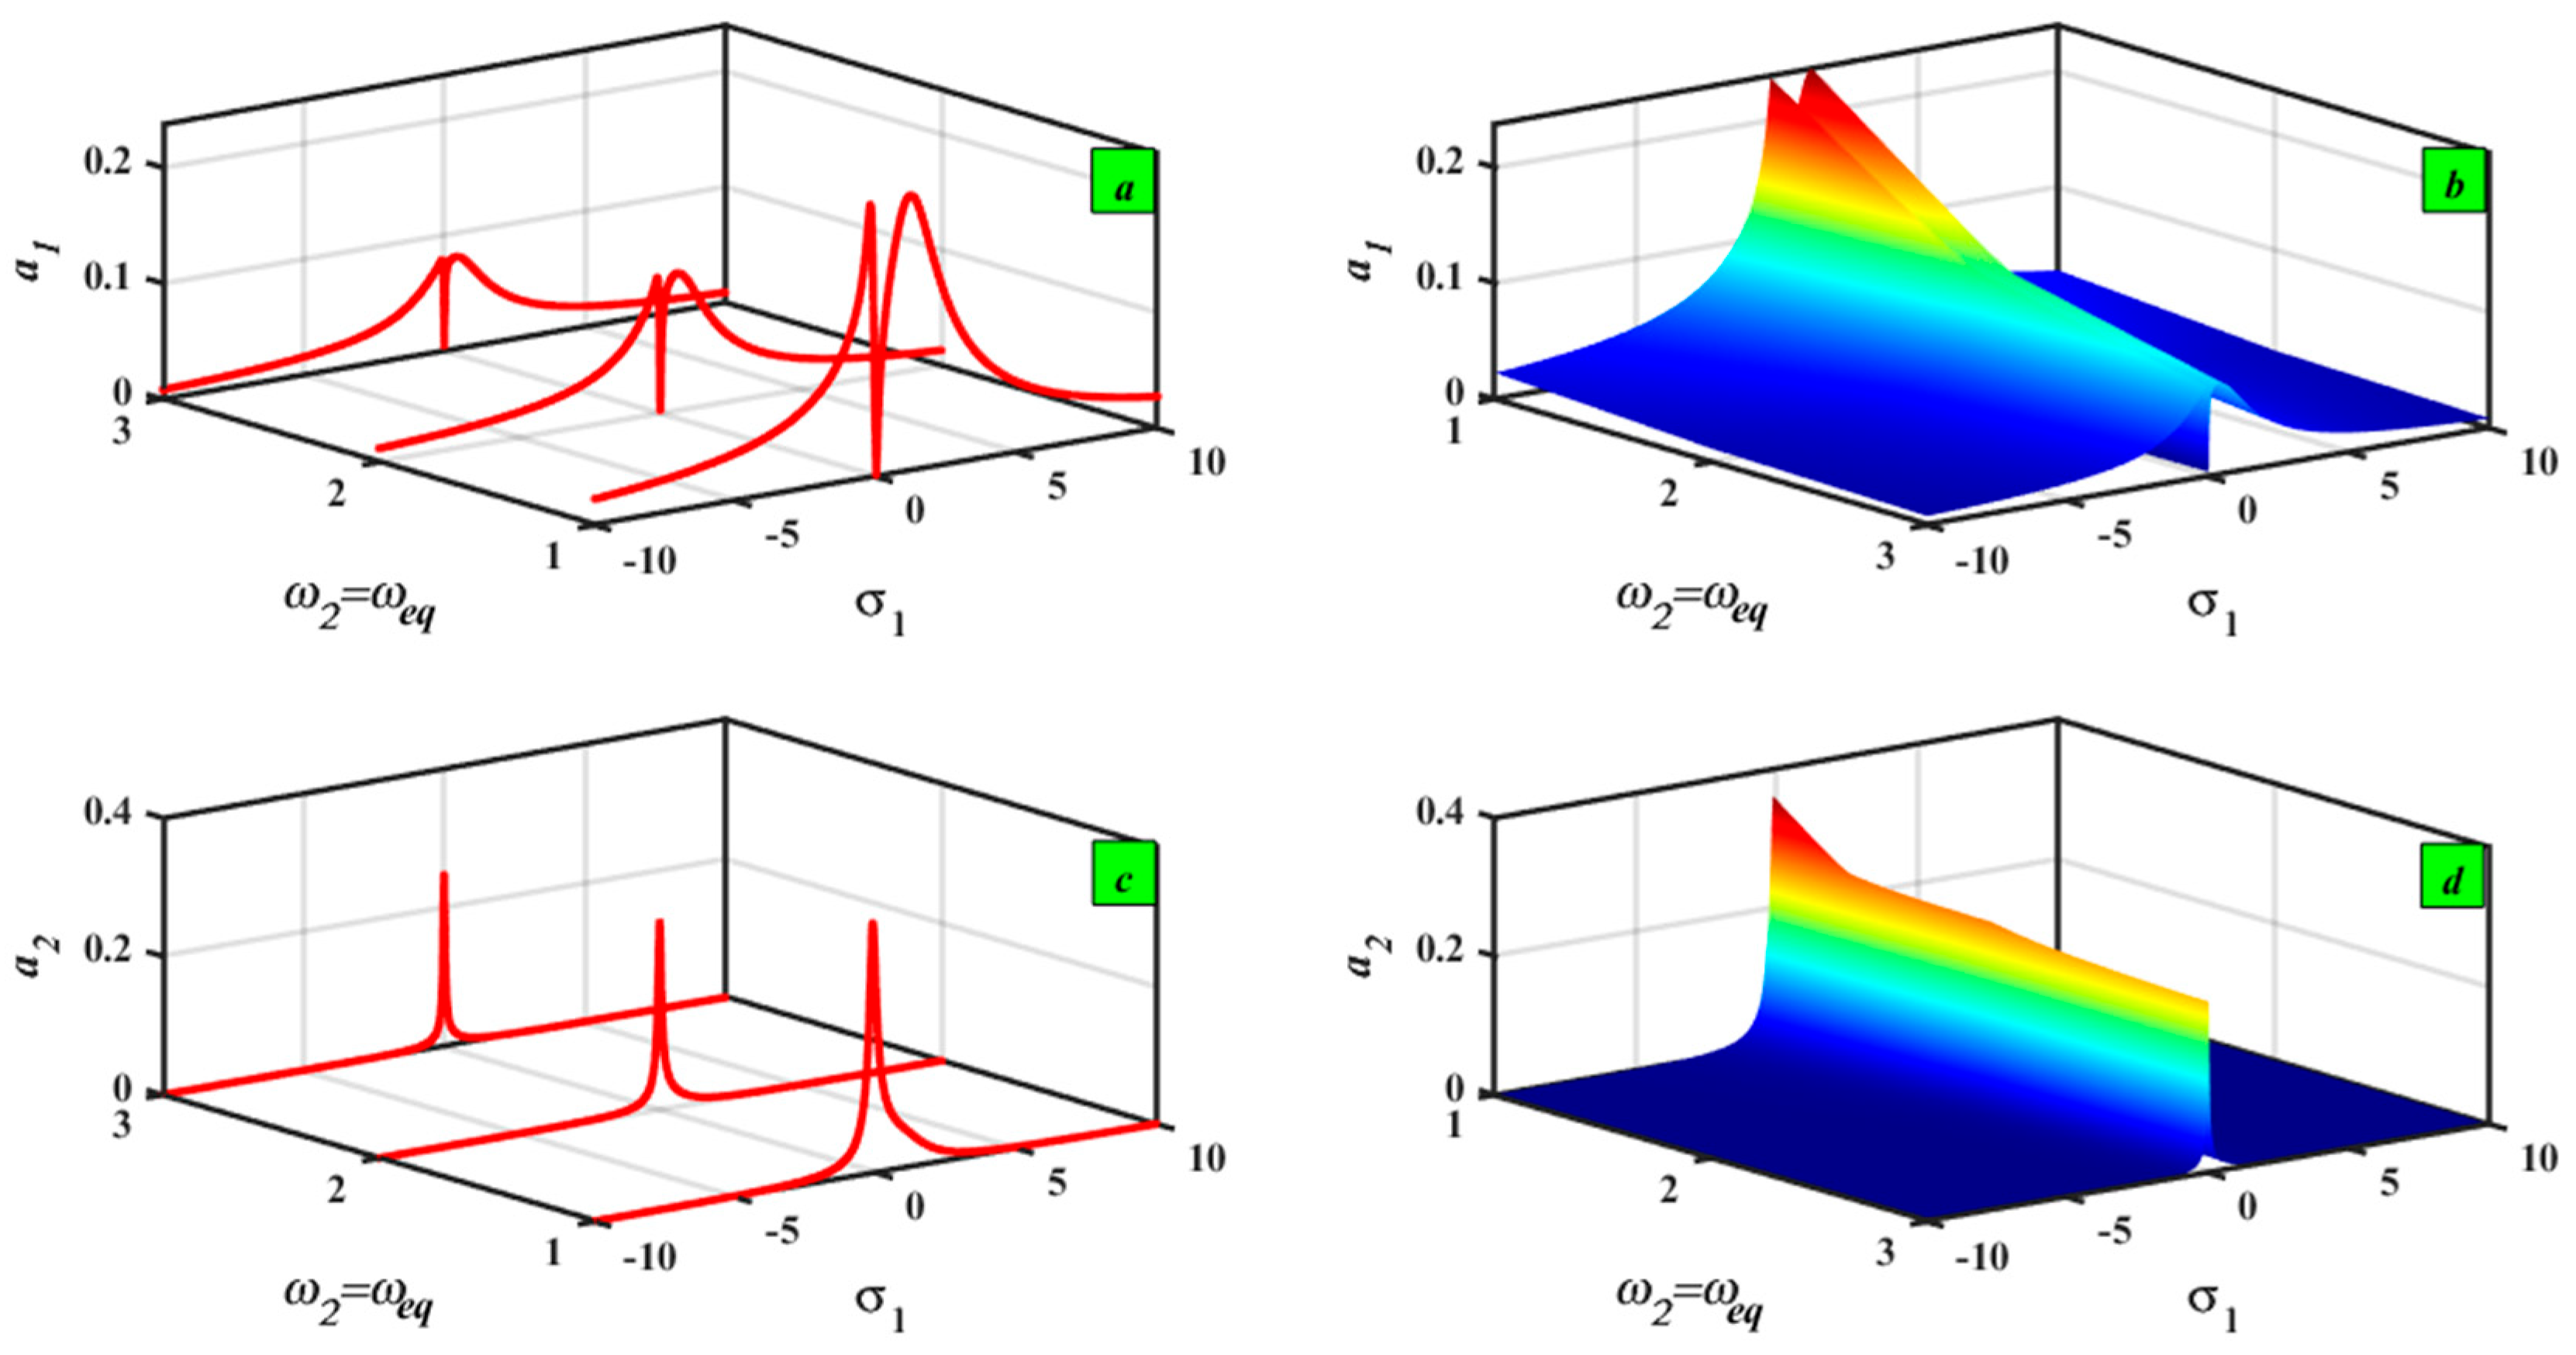
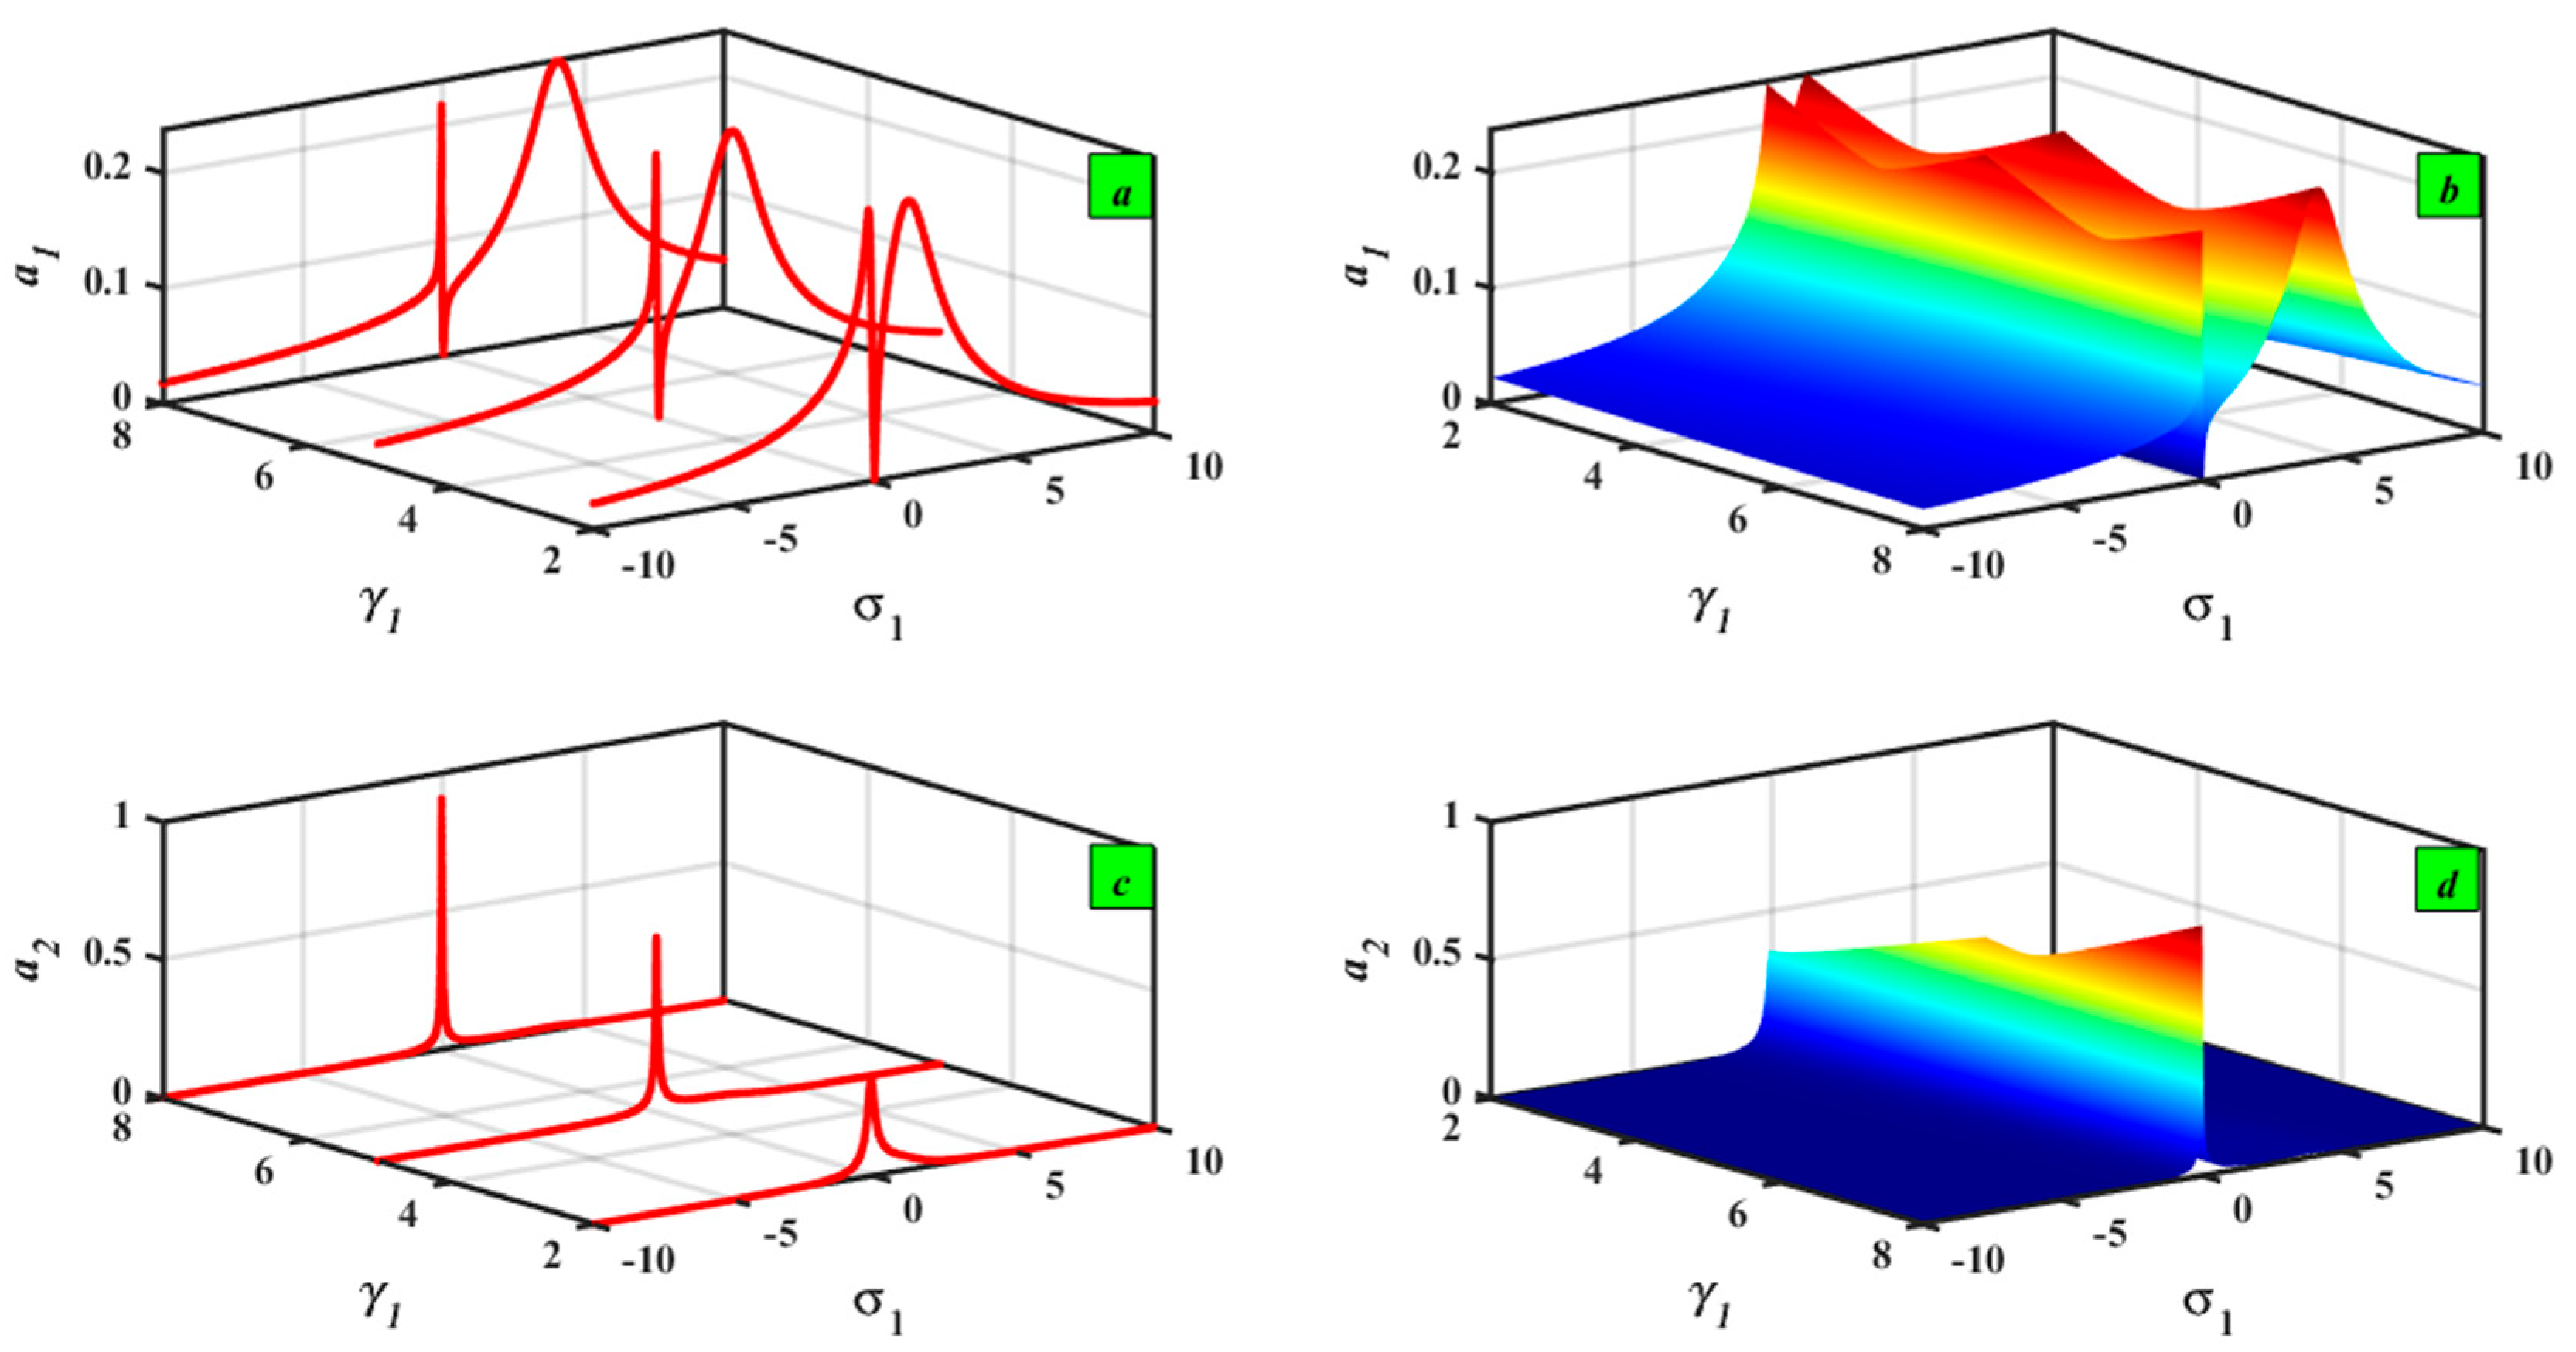
This section includes 2D and 3D graphics to examine the impacts of the coefficients in the nonlinear Equations (63) and (64), which speak to the frequency–response equations (FREs) for the motorcycle system with the PDPPF controller. The frequency–response curves (FRCs) present the relations between modulation amplitude a 1 for the motorcycle system and the modulation amplitude a 2 for the new controller, with the detuning parameter σ 1 in the practical case a 1 0 ,   a 2 0 . In all Figures, unstable areas did not appear, indicating the efficiency of the new controller in making the motorcycle system more stable. These figures have two peaks on both sides around σ 1 , and the zone between these peaks is known as the vibration suppression bandwidth.
The impact of f e q on FRC for both amplitudes a 1 , a 2 are exposed in Figure 11. For increasing the values of the external force f e q , the motorcycle system’s amplitude a 1 and the PDPPF controller’s amplitude a 2 increase, as shown in Figure 11a and Figure 11c, respectively. Figure 11b,d shows the same result with 3D graphs.
Figure 12 displays the influences of various values of μ e q on the FRC. With increasing values of μ e q , the motorcycle system’s amplitude a 1 decreases clearly, as shown in Figure 12a. Also, the amplitude a 2 decreases slightly, as displayed in Figure 12c. Figure 12b,d displays the same description in 3D graphs.
Furthermore, the effect of ω e q is publicized in Figure 13. From Figure 13a,b, the amplitude a 1 decreases visibly when the values of ω e q are increased, and the amplitude a 2 drops significantly and then starts to decrease slightly, as indicated in Figure 13c,d.
Also, we found that after adding PDPPF to the system, there were no changes in amplitudes a 1 and a 2 when increasing α e q and β e q ; this indicates the stability of the system, as presented in Figure 14 and Figure 15.
By increasing the values of G 1 , the bandwidths increase from the left branch of the motorcycle system’s amplitude a 1 , as denoted in Figure 16a,b. But the curves of the amplitude a 2 decrease clearly, as represented by Figure 16c,d. Also, with increasing values of γ 1 , the bandwidths increase visibly from the right branch curve of the amplitude a 1 , as appeared in Figure 17a,b. Moreover, the amplitude a 2 increases, as illustrated by Figure 17c,d.
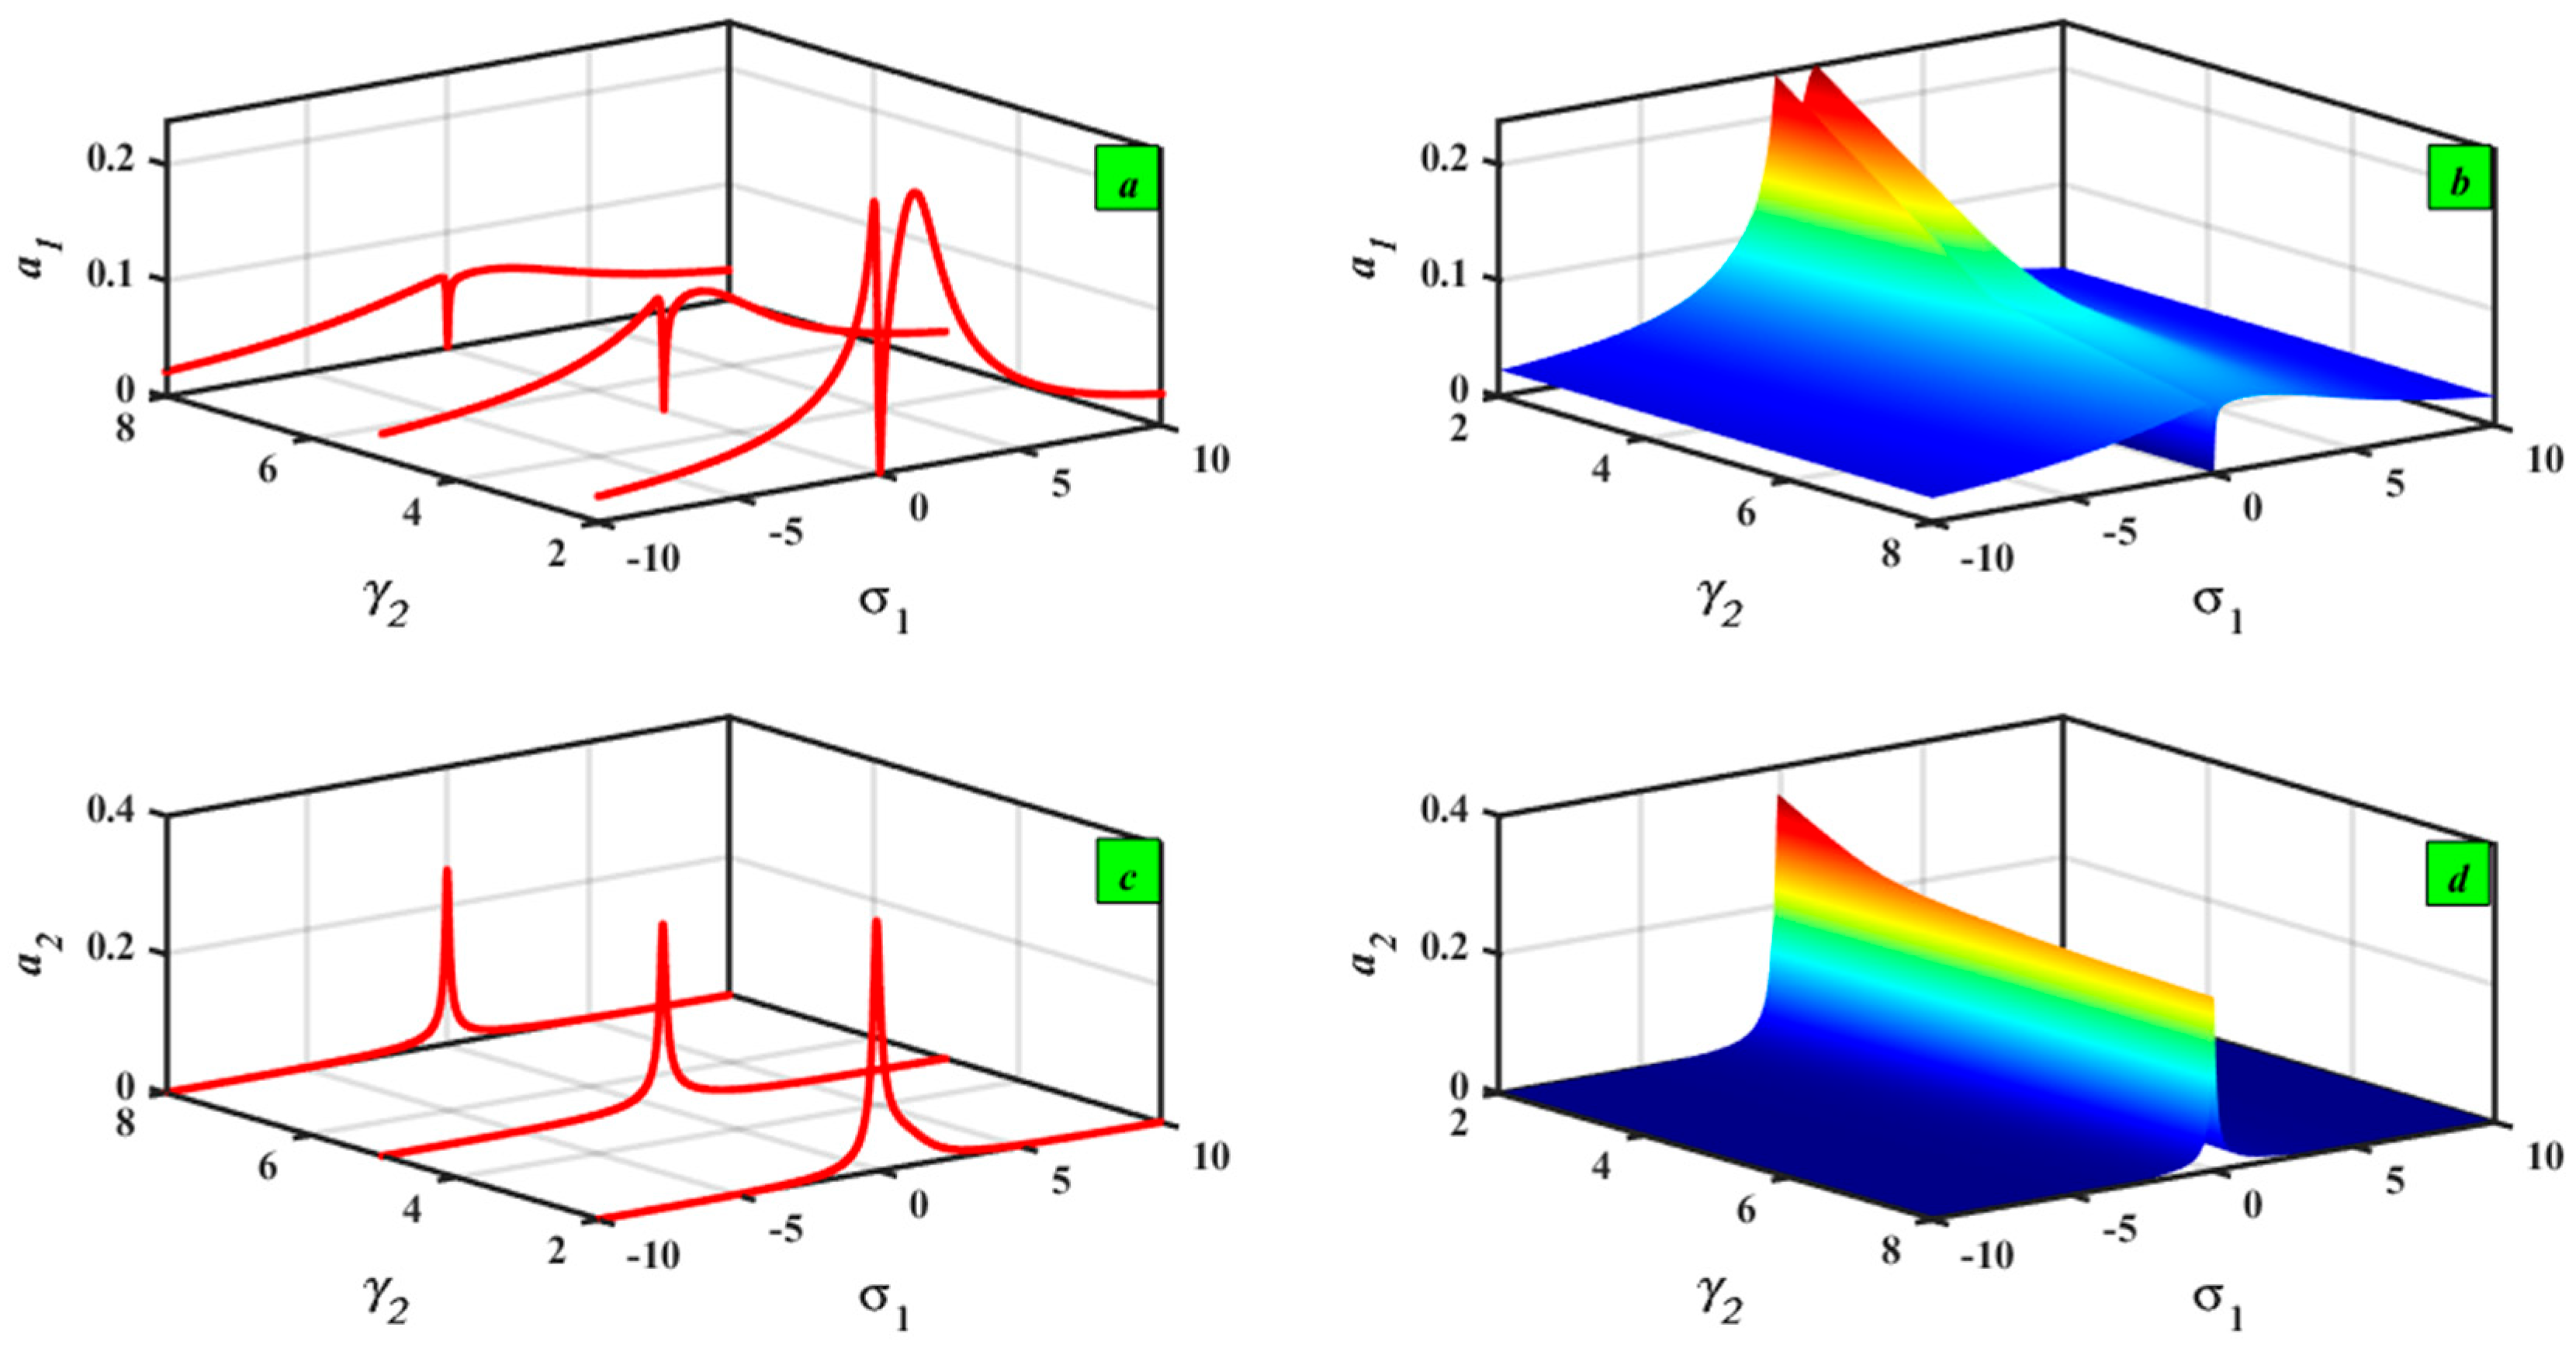
Figure 18 expresses the act of various values of γ 2 on FRC. Figure 18a–d describe the curves of the amplitudes a 1 and a 2 , which decrease when increasing the values of γ 2 .
Respectively, the changing values of G 2 with their effect on FRC are exhibited in Figure 19. For large values of G 2 , the bandwidth region increases for the system amplitude a 1 , which presents the smallest values in this region, as shown in Figure 19a,b. The corresponding PDPPF control amplitude a 2 increases; then, the FRC is divided into two branches, and the bandwidth region appears in Figure 19c,d.
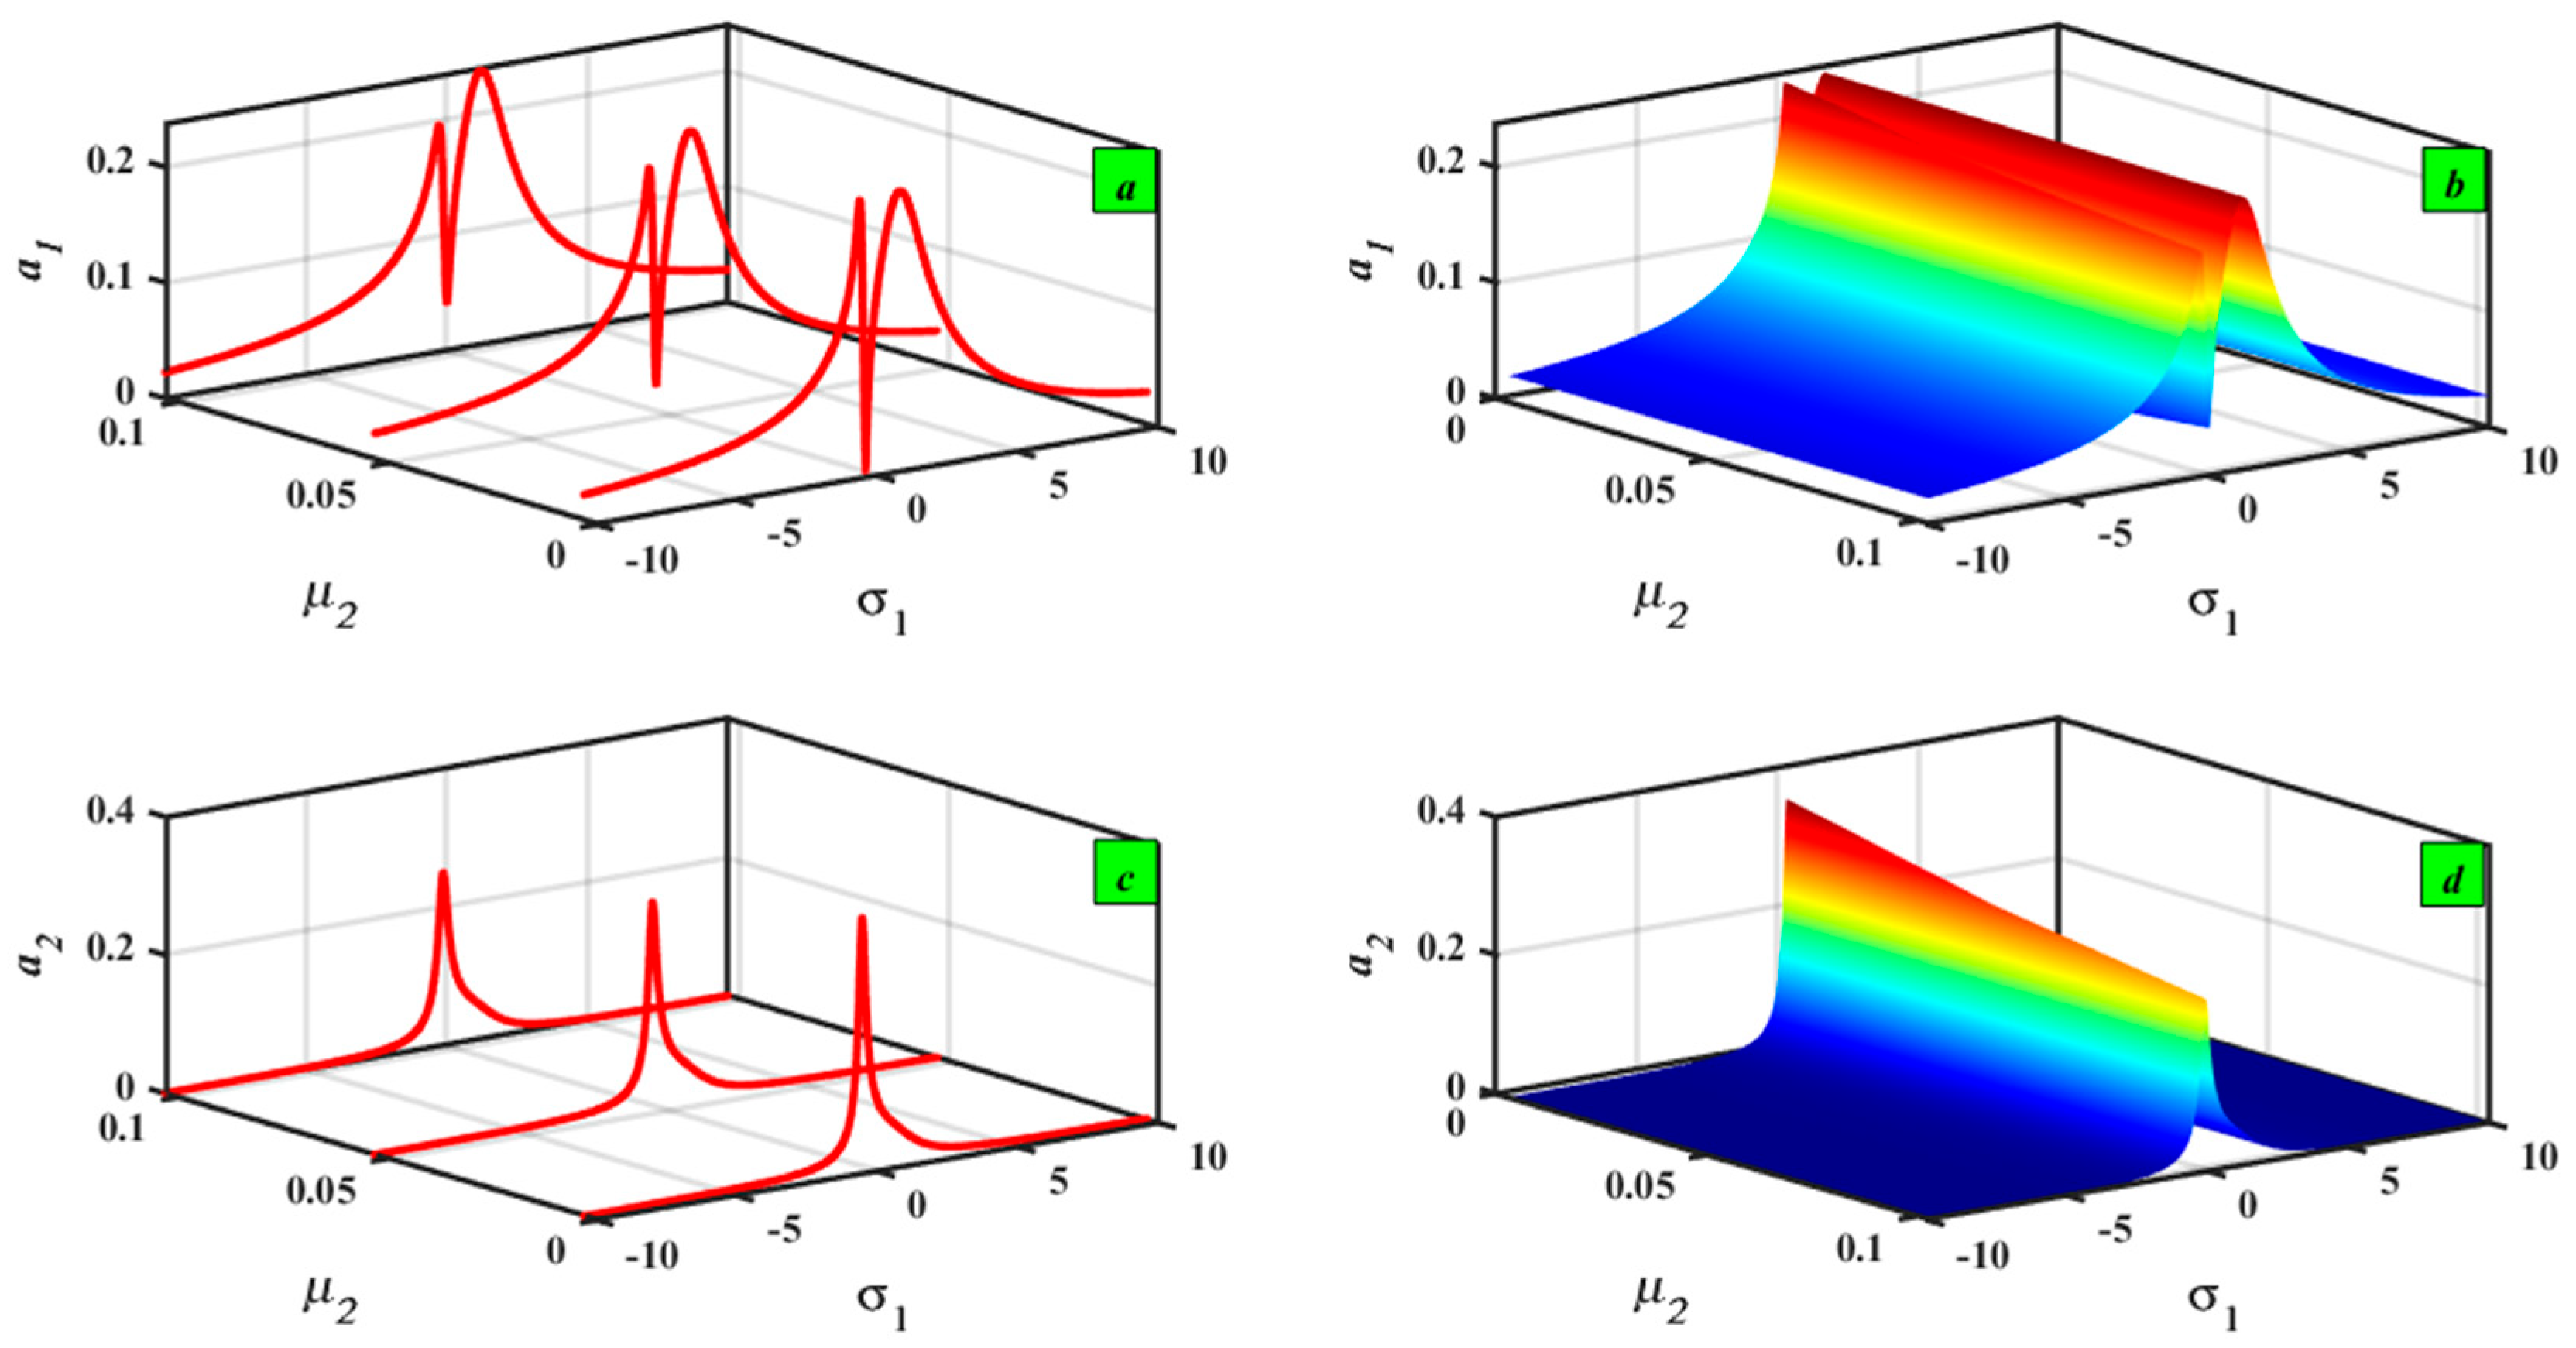
Likewise, Figure 20 shows the effects of μ 2 . By increasing the values of the previous parameters in Figure 20a,b, the left branch of the system curve a 1 decreases for a while and increases at σ 1 = 0 . Moreover, the correspondence of PDPPF control amplitude a 2 is decreased in Figure 20c,d.
We chose three individual values of σ 2 , the amplitudes of the chief system, and PDPPF to achieve their minimal value, as shown in Figure 21; at σ 2 = σ 1 , the PDPPF controller is more organized in the measured resonance case.

5.2. Sensitivity Analysis with ±5% and ±10%

To demonstrate robustness, we performed sensitivity analysis with ±5% and ±10% perturbations in the force f e q , damping μ e q , and controller G 1 , G 2 parameters. Representative results are shown in Figure 22, Figure 23, Figure 24 and Figure 25, where the resonance peaks remain stable under parameter variations. Similar trends were observed for other parameters and are not shown here for brevity.

5.3. Comparison Description

Figure 26 illustrates the outcomes of numerous control methods applied to the worst resonance scenario. To identify the most effective control strategy for the system, different methods are compared. In this analysis, PD and PPF controls are examined. The combination of PD and PPF, referred to as PDPPF, emerged as the most effective approach for controlling and minimizing oscillation, as evidenced by the outcomes. We can explain the comparison more, as presented in Table 2.
As illustrated in Figure 27, a comparison between the numerical solution and the approximation solution in the worst resonance situation employing the PDPPF control produced virtually identical results and significant conclusions.
To calculate the effectiveness of the system’s control, a comparison is applied between the frequency–response curves before and after implementing the control. Before applying the control, the curves exhibited high amplitude and unstable regions within the system. However, after the control was introduced, the amplitude was reduced, and the unstable regions were eliminated, resulting in a fully stabilized system, as shown in Figure 28.

5.4. Bifurcation and Chaotic Motion Description

In order to comprehend the complexity of nonlinear dynamical systems, it is essential to examine chaotic behavior, which is examined in this subsection. The system experiences transitions as its parameters change, leading to a range of behaviors from periodic motion that is steady to total chaos. The bifurcation graph, which displays how the structure changes in response to changes in a crucial parameter, provides an illustration of this development.
The dimensionless form of Equations (31) and (32) was used to carry out the bifurcation analysis. These second-order differential equations have been converted to a corresponding framework of first-order equations to make the analysis easier. The results that follow show the bifurcation figures, Poincaré maps, and phase diagrams that were created by examining the altered system using MATLAB software.
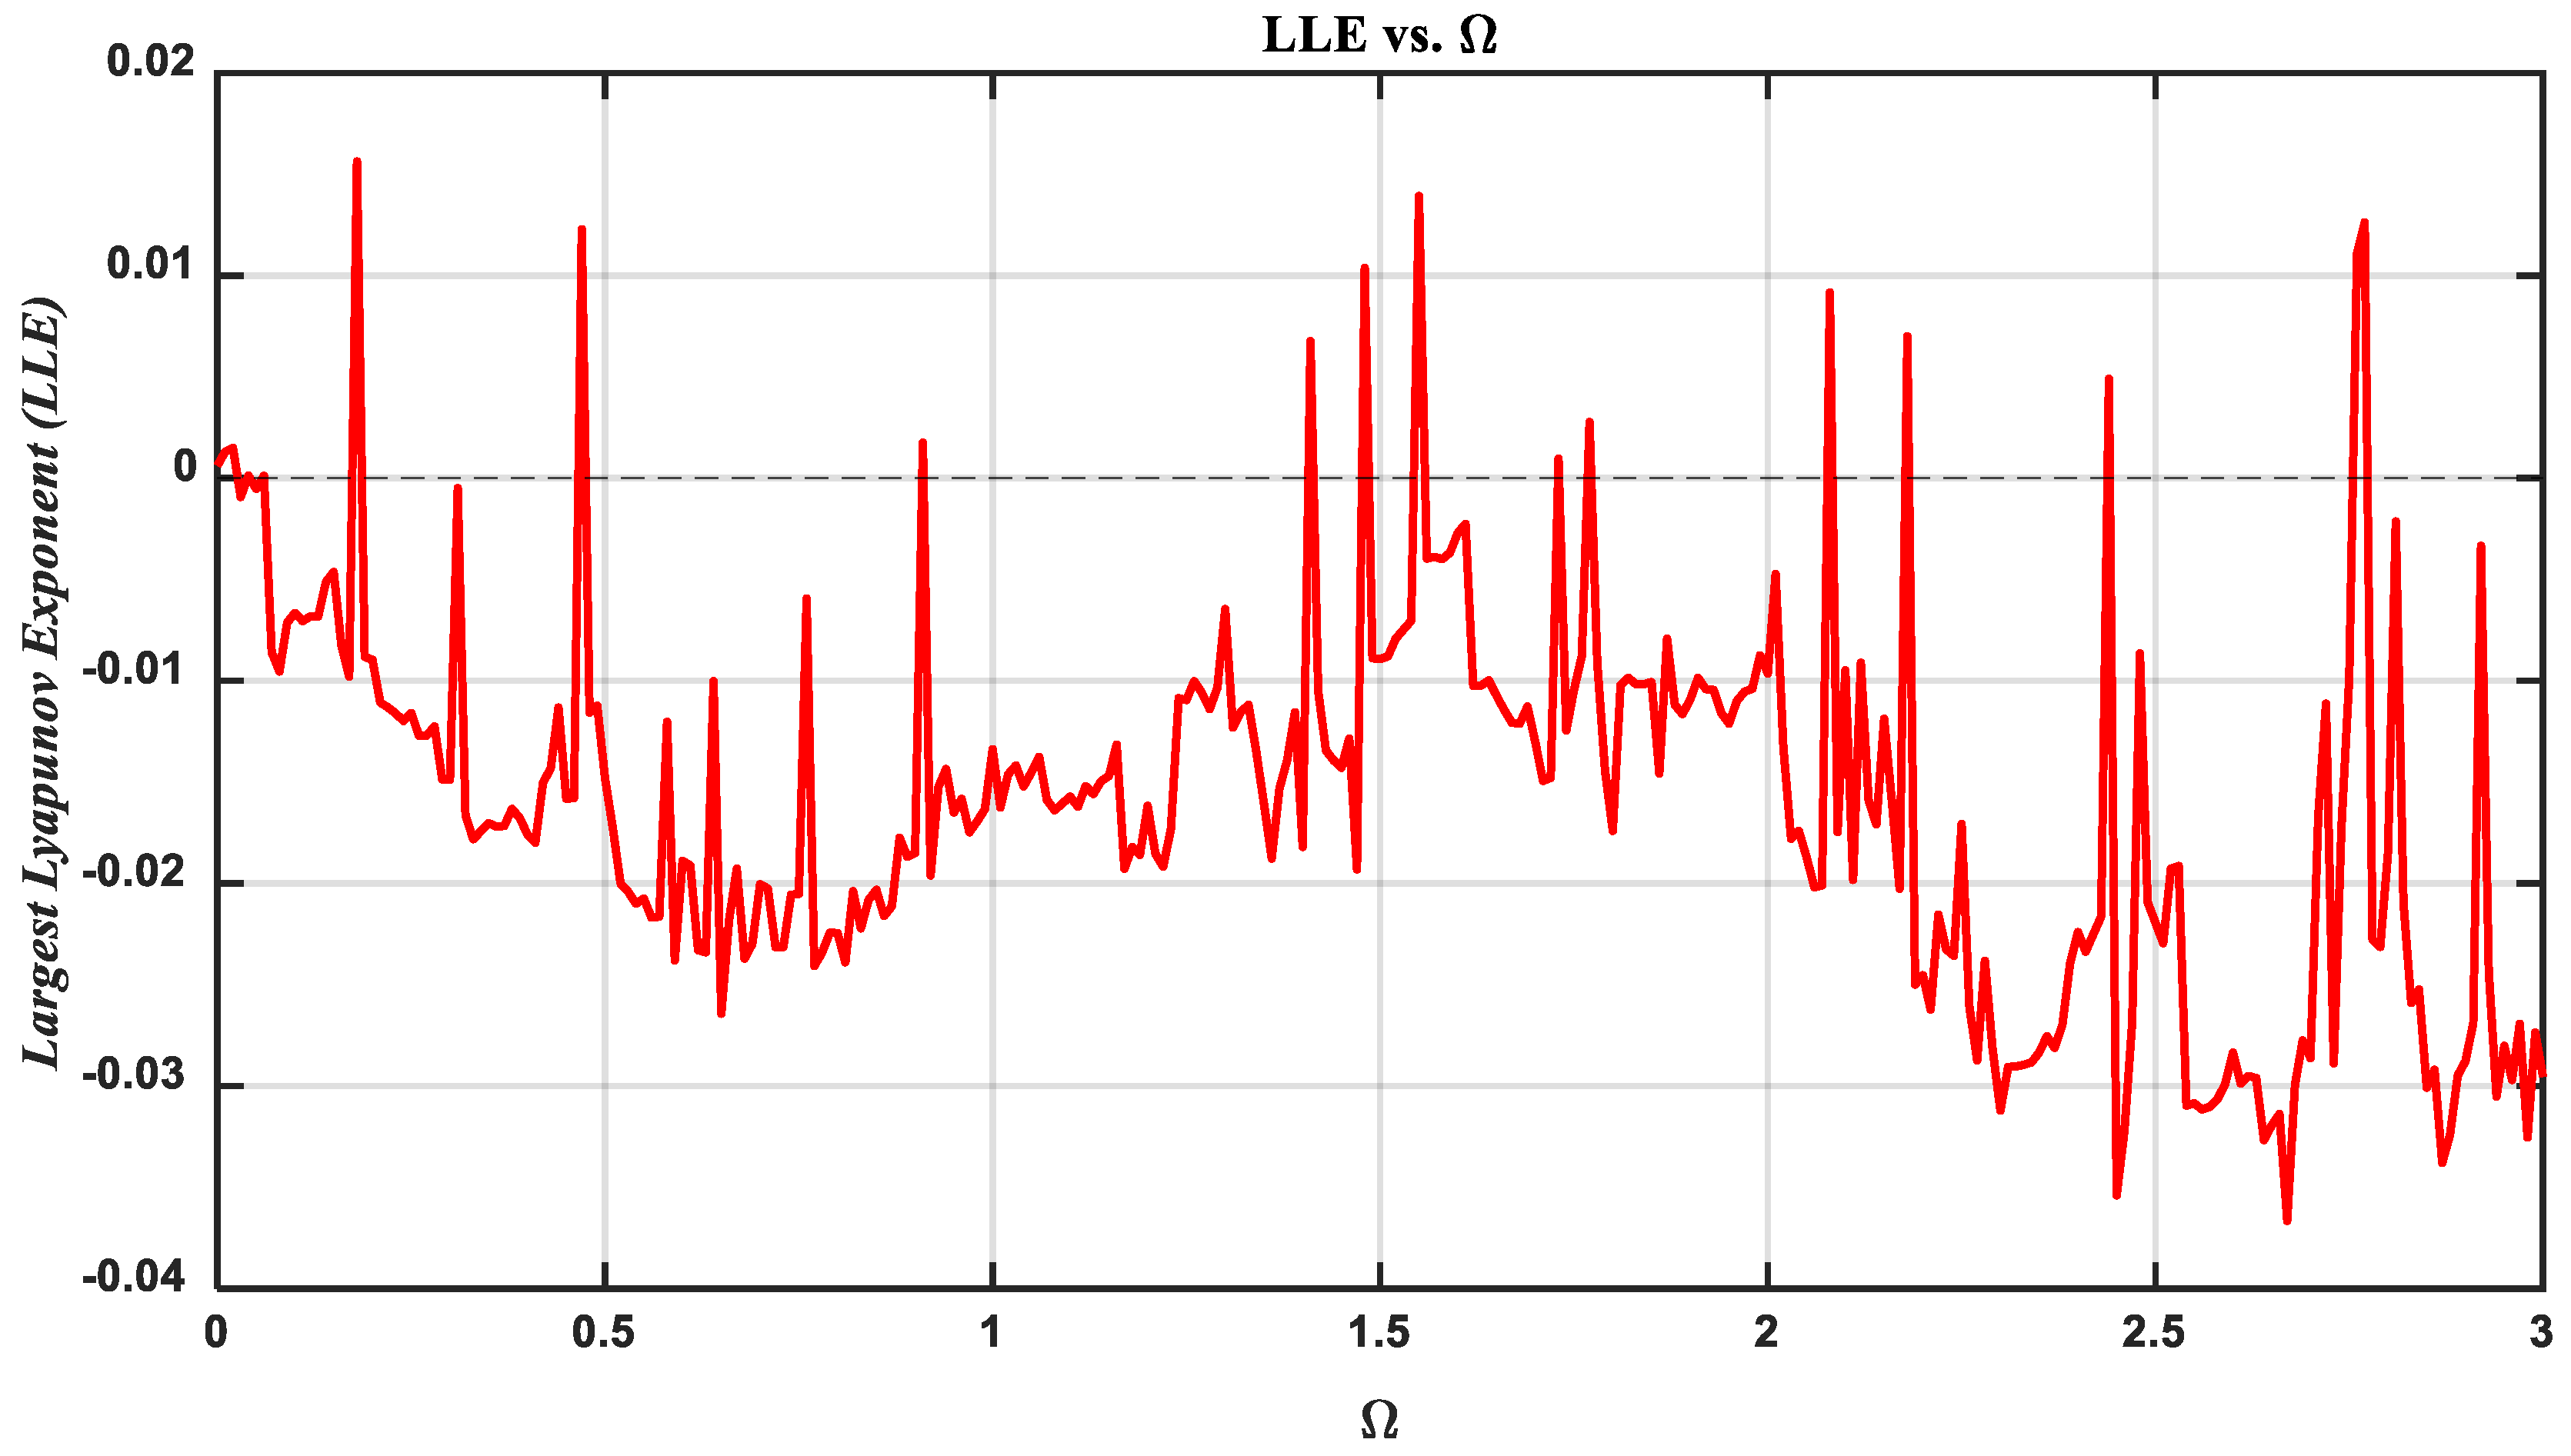
The bifurcation diagram in Figure 29 identifies critical junctures where the behavior of the system changes, usually from quasiperiodic motion to more complex or chaotic dynamics. Bifurcation points, which are crucial for classifying shifts in the stability of the scheme, correspond to these transitions. Before eventually developing into chaotic motion, quasiperiodic behavior sometimes appears when the bifurcation parameter ( Ω ) declines. In many nonlinear systems, this shift from quasiperiodic to chaotic performance is distinguishing.
It should be noted that the controller gains used in this bifurcation analysis are selected as G 1 = γ 1 = γ 2 = 0.2 , G 2 = 0.5 , which are those that are lower than those employed in the main resonance-control results. The rationale for this choice is that smaller gains allow the system to exhibit its intrinsic nonlinear transitions, including quasiperiodic and chaotic behaviors, which would otherwise be strongly suppressed under higher control gains. The bifurcation diagrams, therefore, serve as a diagnostic tool to reveal the possible instability scenarios of the system. Importantly, even in the chaotic and quasiperiodic regimes, the PDPPF controller reduces the response amplitude and postpones the onset of chaos compared with the uncontrolled case, confirming its effectiveness beyond the strictly resonant regime.
Figure 29 presents the bifurcation graphs for G 1 = γ 1 = γ 2 = 0.2 , G 2 = 0.5 , revealing the following behavior: within the ranges 0.02 < Ω < 0.8 and 1.37 < Ω < 3 , the framework displays periodic motion. This is evident from the structured, repetitive patterns in the bifurcation diagrams, indicating periodic oscillations without chaotic behavior. The Poincaré map within this range produces a single point, further confirming the system’s periodic nature. This phase is characterized by regular oscillations with multiple incommensurate frequencies, resulting in periodic motion, as illustrated in Figure 30a,b at Ω = 0.72 and Ω = 2.5 , respectively.
As Ω loses value between 1.37 and 0.9, the structure transitions from a periodic to quasiperiodic performance. This is evident in the bifurcation diagram within this range, indicating sustained regular oscillations. The resultant Poincaré map in Figure 30c at Ω = 1.37 displays a closed loop, further confirming the quasiperiodic nature of the system’s dynamics. This phase is characterized by regular, non-chaotic oscillations with multiple incommensurate frequencies, resulting in quasiperiodic motion.
For Ω 0.02 , the system transitions from quasiperiodic to chaotic performance. The bifurcation graph’s dispersed spots within this range, which show the breakdown of regular oscillations, make this clear. The presence of chaotic motion is further supported by the equivalent Poincaré sketch in Figure 30d, at Ω = 0.02 , which shows randomly distributed red spots. The system shows a remarkable sensitivity to beginning conditions in this chaotic regime, where slight changes over time lead to noticeably different trajectories.
Figure 31 shows the variation in the largest Lyapunov exponent (LLE) with respect to the excitation frequency parameter Ω. The diagram illustrates the stability and transition behavior of the system: in regions where the LLE is negatively correlated to periodic or stable quasiperiodic responses, values close to zero indicate the onset of quasiperiodic behavior, and peaks of positive values identify the presence of chaotic dynamics. The plot highlights the complex interplay between Ω and the system’s nonlinear response, with alternating intervals of stability and instability.

6. Conclusions

This article investigated the dynamic response of a nonlinear motorcycle model subjected to harmonic excitation, particularly in the presence of simultaneous primary and 1:1 internal resonance ( Ω ω e q ,   ω 2 ω e q ). By employing the method of multiple scales and numerical simulations, the study conducted a detailed stability and bifurcation analysis using frequency–response curves (FRCs). These analyses revealed complex dynamic phenomena, including transitions from stable periodic motion to chaotic behavior, driven by small variations in system parameters. The outcomes of this study are as follows:
  • To suppress the resulting dangerous vibrations, a novel proportional derivative positive position feedback (PDPPF) control strategy was proposed, combining the strengths of PD and PPF controllers.
  • Comparative analysis showed that the PDPPF controller reduced peak vibration amplitudes by up to 99.93% near resonant frequencies, outperforming standalone PD and PPF controllers under the same conditions.
  • The PDPPF controller offered a highly effective solution for enhancing ride comfort and structural integrity in motorcycle suspension systems, especially under resonant excitation.
  • The numerical and analytical solutions, validated through MATLAB simulations, confirmed the accuracy and reliability of the proposed approach, demonstrating good agreement between both methods. These findings underscore the effectiveness of the PDPPF control technique in addressing vibration issues and ensuring stability in dynamic systems.
  • The PDPPF control approach provided a viable method for enhancing ride comfort, stability, and component longevity in motorcycle suspension systems.
  • The bifurcation diagram illustrated these transitions, offering valuable insights into how small changes in system parameters can induce significant shifts in behavior. This understanding is crucial for predicting and controlling instability, chaotic dynamics, and limit cycles, which are typical in nonlinear systems.
  • Overall, this investigation contributed valuable insights into the control and analysis of dynamic systems with resonant behavior, offering practical implications for the design and optimization of engineering applications, particularly in systems prone to vibration-related challenges. Future work could extend this approach to other types of resonant systems, exploring additional control strategies and optimization techniques.
  • The 99.93% suppression predicted in simulations should be interpreted as a theoretical upper bound under the idealized assumptions of the model. In practical scenarios, physical constraints such as actuator saturation, energy limitations, and sensor noise will limit the achievable performance. Nevertheless, the results confirm the mathematical effectiveness of the PDPPF strategy and its potential for substantial vibration reduction in real-world applications.

7. Future Work

Although a simplified single-degree-of-freedom model was employed in this study to highlight the essential nonlinear mechanisms and controller effects, future work will focus on extending the analysis to comprehensive multi-degree-of-freedom motorcycle models that capture weaves, wobbles, and other critical dynamic modes as shown in Figure 32. Moreover, experimental validation will be pursued to confirm the robustness and practical applicability of the proposed control strategy.

Author Contributions

H.S.B.: Investigation, Data curation, Writing—original draft. A.T.E.-S.: Conceptualization, Methodology, Software. All authors have read and agreed to the published version of the manuscript.

Funding

The authors extend their appreciation to Prince Sattam bin Abdulaziz University for funding this research work through the project number (PSAU/2024/01/31420).

Data Availability Statement

The original contributions presented in this study are included in the article. Further inquiries can be directed to the corresponding author.

Acknowledgments

The authors extend their appreciation to Prince Sattam bin Abdulaziz University for funding this research work through the project number (PSAU/2024/01/31420).

Conflicts of Interest

The authors declare that they have no known competing financial interests or personal relationships that could have appeared to influence the work reported in this paper.

Appendix A

M 11 = μ e q 2 γ 2 2 , M 12 = f e q 2 ω e q cos θ 10 , M 13 = G 1 2 ω e q sin θ 20 , M 14 = G 1 a 20 2 ω e q cos θ 20 M 21 = σ 1 a 10 γ 1 2 ω e q a 10 9 α e q 8 ω e q a 10 25 β e q 16 ω e q a 10 3 , M 22 = f e q 2 ω e q a 10 sin θ 10 , M 23 = G 1 2 ω e q a 10 cos θ 20 , M 24 = G 1 a 20 2 ω e q a 10 sin θ 20 M 31 = G 2 2 ω 2 sin θ 20 , M 32 = 0 , M 33 = μ 2 2 , M 34 = G 2 2 ω 2 a 10 cos θ 20 M 41 = σ 1 a 10 γ 1 2 ω e q a 10 9 α e q 8 ω e q a 10 25 β e q 16 ω e q a 10 3 G 2 2 ω 2 a 20 cos θ 20 , M 42 = f e q 2 ω e q a 10 sin θ 10 M 43 = G 1 2 ω e q a 10 cos θ 20 + σ 2 σ 1 a 20 , M 44 = G 1 a 20 2 ω e q a 10 sin θ 20 + G 2 2 ω 2 a 20 a 10 sin θ 20

References

  1. Tseng, H.E.; Hrovat, D. State of the art survey: Active and semi-active suspension control. Veh. Syst. Dyn. 2015, 53, 1034–1062. [Google Scholar] [CrossRef]
  2. Tseng, T.; Hrovat, D. Some characteristics of optimal vehicle suspensions based on quarter-car models. In Proceedings of the 29th IEEE Conference on Decision and Control, Honolulu, HI, USA, 5–7 December 1990; pp. 2232–2237. [Google Scholar]
  3. Hrovat, D. Survey of advanced suspension developments and related optimal control applications. Automatica 1997, 33, 1781–1817. [Google Scholar] [CrossRef]
  4. Attia, T.; Vamvoudakis, K.G.; Kochersberger, K.; Bird, J.; Furukawa, T. Simultaneous dynamic system estimation and optimal control of vehicle active suspension. Veh. Syst. Dyn. 2019, 57, 1467–1493. [Google Scholar] [CrossRef]
  5. Park, M.; Yim, S. Design of static output feedback and structured controllers for active suspension with quarter-car model. Energies 2021, 14, 8231. [Google Scholar] [CrossRef]
  6. Park, M.; Yim, S. Comparative Study on Effects of Input Configurations of Linear Quadratic Controller on Path Tracking Performance under Low Friction Condition. Actuators 2023, 12, 153. [Google Scholar] [CrossRef]
  7. Yang, M.; Peng, C.; Li, G.; Wang, Y.; Ma, S. Event-triggered H∞ control for active semi-vehicle suspension system with communication constraints. Inf. Sci. 2019, 486, 101–113. [Google Scholar] [CrossRef]
  8. Zhang, Y.; Liu, M.; Zhang, C. Robust fault-tolerant H∞ output feedback control of active suspension and dynamic vibration absorber with finite-frequency constraint. IET Intell. Transp. Syst. 2020, 14, 1935–1945. [Google Scholar] [CrossRef]
  9. Du, H.; Zhang, N. Fuzzy control for nonlinear uncertain electrohydraulic active suspensions with input constraint. IEEE Trans. Fuzzy Syst. 2008, 17, 343–356. [Google Scholar] [CrossRef]
  10. Gad, A.S.; El-Zoghby, H.; Oraby, W.; El-Demerdash, S.M. Application of a Preview Control with an MR Damper Model Using Genetic Algorithm in Semi-Active Automobile Suspension; Technical Paper No. 2019-01-5006; SAE: Warrendale, PA, USA, 2019. [Google Scholar]
  11. Huang, Y.; Na, J.; Wu, X.; Liu, X.; Guo, Y. Adaptive control of nonlinear uncertain active suspension systems with prescribed performance. ISA Trans. 2015, 54, 145–155. [Google Scholar] [CrossRef]
  12. Pan, H.; Sun, W.; Jing, X.; Gao, H.; Yao, J. Adaptive tracking control for active suspension systems with non-ideal actuators. J. Sound Vib. 2017, 399, 2–20. [Google Scholar] [CrossRef]
  13. Su, X. Master–slave control for active suspension systems with hydraulic actuator dynamics. IEEE Access 2017, 5, 3612–3621. [Google Scholar] [CrossRef]
  14. Liu, L.; Zhu, C.; Liu, Y.J.; Wang, R.; Tong, S. Performance improvement of active suspension constrained system via neural network identification. IEEE Trans. Neural Netw. Learn. Syst. 2022, 34, 7089–7098. [Google Scholar] [CrossRef]
  15. Liu, Y.; Zuo, L. Energy-flow-driven (EFD) semi-active suspension control. In Proceedings of the 2014 American Control Conference, Portland, OR, USA, 4–6 June 2014; pp. 2120–2125. [Google Scholar]
  16. Enders, E.; Burkhard, G.; Munzinger, N. Analysis of the influence of suspension actuator limitations on ride comfort in passenger cars using model predictive control. Actuators 2020, 9, 77. [Google Scholar] [CrossRef]
  17. Shao, X.; Naghdy, F.; Du, H. Reliable fuzzy H∞ control for active suspension of in-wheel motor driven electric vehicles with dynamic damping. Mech. Syst. Signal Process. 2017, 87, 365–383. [Google Scholar] [CrossRef]
  18. Slaski, G.; Gudra, A.; Borowicz, A. Analysis of the influence of additional unsprung mass of in-wheel motors on the comfort and safety of a passenger car. Arch. Automot. Eng.–Arch. Motoryz. 2014, 65, 51–64. [Google Scholar]
  19. Choi, S.B.; Lee, H.S.; Park, Y.P. H8 control performance of a full-vehicle suspension featuring magnetorheological dampers. Veh. Syst. Dyn. 2002, 38, 341–360. [Google Scholar] [CrossRef]
  20. Sohn, J.W.; Oh, J.S.; Choi, S.B. Design and novel type of a magnetorheological damper featuring piston bypass hole. Smart Mater. Struct. 2015, 24, 035013. [Google Scholar] [CrossRef]
  21. Pham, T.P.; Sename, O.; Dugard, L. Real-time damper force estimation of vehicle electrorheological suspension: A nonlinear parameter varying approach. IFAC-Pap. Online 2019, 52, 94–99. [Google Scholar] [CrossRef]
  22. Kawamoto, Y.; Suda, Y.; Inoue, H.; Kondo, T. Modeling of electromagnetic damper for automobile suspension. J. Syst. Des. Dyn. 2007, 1, 524–535. [Google Scholar] [CrossRef]
  23. Parker, R.G.; Wu, X. Parametric instability of planetary gears having elastic continuum ring gears. J. Vib. Acoust. 2012, 134, 041011. [Google Scholar] [CrossRef]
  24. Yildirim, T.; Ghayesh, M.H.; Li, W.; Alici, G. Design and development of a parametrically excited nonlinear energy harvester. Energy Convers. Manag. 2016, 126, 247–255. [Google Scholar] [CrossRef]
  25. Rhoads, J.F.; Kumar, V.; Shaw, S.W.; Turner, K.L. The non-linear dynamics of electromagnetically actuated micro beam resonators with purely parametric excitations. Int. J. Non-Linear Mech. 2013, 55, 79–89. [Google Scholar] [CrossRef]
  26. Genter, S.; Paul, O. Parylene-C as an Electret Material for Micro Energy Harvesting. Ph.D. Thesis, Universität Freiburg, Breisgau, Germany, 2019. [Google Scholar]
  27. Mbong, T.D.; Siewe, M.S.; Tchawoua, C. Controllable parametric excitation effect on linear and nonlinear vibrational resonances in the dynamics of a buckled beam. Commun. Nonlinear Sci. Numer. Simul. 2018, 54, 377–388. [Google Scholar] [CrossRef]
  28. El-Sayed, A.T.; Bauomy, H.S. NIPPF versus ANIPPF controller outcomes on semi-direct drive cutting transmission system in a shearer. Chaos Solitons Fractals 2022, 156, 111778. [Google Scholar] [CrossRef]
  29. Bauomy, H.S.; El-Sayed, A.T. A new six-degrees of freedom model designed for a composite plate through PPF controllers. Appl. Math. Model. 2020, 88, 604–630. [Google Scholar] [CrossRef]
  30. Bauomy, H.S.; El-Sayed, A.T. Act of nonlinear proportional derivative controller for MFC laminated shell. Phys. Scr. 2020, 95, 095210. [Google Scholar] [CrossRef]
  31. Bauomy, H.S.; El-Sayed, A.T. Nonlinear saturation controller simulation for reducing the high vibrations of a dynamical system. Math. Biosci. Eng. 2022, 19, 3487–3508. [Google Scholar] [CrossRef]
  32. Piantini, S.; Pierini, M.; Delogu, M.; Baldanzini, M.; Franci, A.; Mangini, M.; Peris, A. Injury Analysis of Powered Two-Wheeler versus Other Vehicle Urban Accidents. In Proceedings of the 2016 IRCOBI Conference, Malaga, Spain, 14–16 September 2016; IRCOBI: Malaga, Spain, 2016. [Google Scholar]
  33. Prochowski, L.; Pusty, T. Charakterystyka Obrotu i Unoszenia Motocykla po Uderzeniu w Bok Samochodu. In The Archives of Automotive Engineering; Archiwum Motoryzacji: Warszawa, Poland, 2012. [Google Scholar]
  34. Wypadki Drogowe w Polsce w 2019 roku; Technical Report; Biuro Ruchu Drogowego Zespół Profilaktyki i Analiz: Warszawa, Poland, 2020.
  35. Stan Bezpiecze’ Nstwa Ruchu Drogowego Oraz Działania Realizowane w Tym Zakresie w 2019r. Available online: https://www.krbrd.gov.pl/baza-wiedzy/raporty-o-stanie-brd/ (accessed on 18 August 2021).
  36. Dukalski, P.; B˛edkowski, B.; Parczewski, K.; Wn ˛ek, H.; Urba’s, A.; Augustynek, K. Dynamics of the vehicle rear suspension system with electric motors mounted in wheels. Eksploat. I Niezawodn. Maint. Reliab. 2019, 21, 125–136. [Google Scholar] [CrossRef]
  37. Nader, M.; Korzeb, J. Przeglad ˛ Biomechanicznych Modeli do Oceny Oddziaływania Drga ’n na Organizm Ludzki, Materiały III Krajowego Sympozjum, Komputerowe Systemy Wspomagania Prac Inzynierskich w Przemy’sle i Transporcie; Politechnika Radomska: Zakopane, Poland, 1999; pp. 219–234. [Google Scholar]
  38. Shivakumara, B.S.; Sridhar, V. Study of Vibration and Its Effect on Health of the Motorcycle Rider. Online J. Health Allied Sci. 2010, 9, 9. [Google Scholar]
  39. Di Massa, G.; Pagano, S.; Strano, S.; Terzo, M. A Mono-axial Wheel Force Transducer for the Study of the Shimmy Phenomenon. In Proceedings of the World Congress on Engineering, London, UK, 3–5 July 2013. [Google Scholar]
  40. Grzegozek, W.; Weigel-Millert, K. Analiza możliwości wykorzystania badań stanowiskowych do oceny stabilności pojazdu jednośladowego. Arch. Automot. Eng. Arch. Motoryz. 2015, 67, 165–173. [Google Scholar]
  41. Slusarczyk, P. Analiza Modelowa Stateczno’sci Pojazdu Jedno’sladowego, Czasopismo Techniczne; Wyd, P.K., Ed.; Zeszyt 7-M: Kraków, Poland, 2004; pp. 165–173. [Google Scholar]
  42. D˛ebowski, A. Analiza Mozliwo’sci Ograniczenia Drga ’n Skr˛etnych w Układzie Kierowniczym Motocykla. Ph.D. Thesis, Military University of Technology, Warszawa, Poland, 2019. [Google Scholar]
  43. Sharp, R.S. The stability and control of motorcycles. J. Mech. Eng. Sci. 1971, 13, 313–329. [Google Scholar] [CrossRef]
  44. Sharp, R.S. The Influence of Frame Flexibility on the Lateral Stability of Motorcycles. J. Mech. Eng. Sci. 1974, 16, 117–120. [Google Scholar] [CrossRef]
  45. Sharp, R.S.; Alstead, C.J. The influence of structural flexibilities on the straight-running stability of motorcycles. Veh. Syst. Dyn. 1980, 9, 327–357. [Google Scholar] [CrossRef]
  46. Kane, T.R. The Effect of Frame Flexibility on High Speed Weave of Motorcycles; SAE Technical Paper 780306; SAE International: Warrendale, PA, USA, 1978. [Google Scholar]
  47. Cossalter, V. Motorcycle Dynamics; LULU: Morrisville, NC, USA, 2006. [Google Scholar]
  48. Cossalter, V.; Lot, R.; Massaro, M. An Advanced Multibody Code for Handling and Stability Analysis of Motorcycles; Springer Meccanica: Berlin/Heidelberg, Germany, 2011; Volume 46, pp. 943–958. [Google Scholar]
  49. De Falco, D.; Di Massa, G.; Pagano, S.; Strano, S. Wheel Force Transducer for Shimmy Investigation. In Proceedings of the World Congress on Engineering, London, UK, 1–3 July 2015. [Google Scholar]
  50. Sharp, R.S.; Limbeer, D.J.N. On steering wobble oscillations of motorcycles. J. Mech. Eng. Sci. 2004, 14, 1449–1456. [Google Scholar] [CrossRef]
  51. Abohamer, M.K.; Awrejcewicz, J.; Amer, T.S. Modeling and analysis of a piezoelectric transducer embedded in a nonlinear damped dynamical system. Nonlinear Dyn. 2023, 111, 8217–8234. [Google Scholar] [CrossRef]
  52. Bauomy, H.S.; EL-Sayed, A.T.; Amer, T.S.; Abohamer, M.K. Negative derivative feedback control and bifurcation in a two-degree-of-freedom coupled dynamical system. Chaos Solitons Fractals 2025, 193, 116138. [Google Scholar] [CrossRef]
  53. Saeed, N.A.; EL-Shourbagy, S.M.; Kamel, M.; Raslan, K.R.; Awrejcewicz, J.; Gepreel, K.A. On the Resonant Vibrations Control of the Nonlinear Rotor Active Magnetic Bearing Systems. Appl. Sci. 2022, 12, 8300. [Google Scholar] [CrossRef]
  54. Saeed, N.A.; Kandil, A. Lateral vibration control and stabilization of the quasiperiodic oscillations for rotor-active magnetic bearings system. Nonlinear Dyn. 2019, 98, 1191–1218. [Google Scholar] [CrossRef]
  55. Wu, Y.; Wang, G.; Yu, K.; Gao, X.; Wang, D.; Ge, M. Attitude Control and Vibration Suppression Using PD + CPPF Compound Control Strategy. Adv. Guid. Navig. Control 2022, 845, 6934–6944. [Google Scholar]
  56. Saeed, N.A.; Awwad, E.M.; Abdelhamid, T.; EL-Meligy, M.A.; Sharaf, M. Adaptive versus Conventional Positive Position Feedback Controller to Suppress a Nonlinear System Vibrations. Symmetry 2021, 13, 255. [Google Scholar] [CrossRef]
  57. Nayfeh, A.H. Perturbation Methods; Wiley: New York, NY, USA, 2000. [Google Scholar]
  58. Nayfeh, A.H.; Mook, D.T. Nonlinear Oscillations; John Wiley & Sons: New York, NY, USA, 1979. [Google Scholar]
  59. He, J.H. An improved amplitude-frequency formulation for nonlinear oscillators. Int. J. Nonlinear Sci. Numer. Simul. 2008, 9, 211–212. [Google Scholar] [CrossRef]
  60. El-Dib, Y.O. Insightful and comprehensive formularization of frequency-amplitude formula for strong or singular nonlinear oscillators. J. Low Freq. Noise Vib. Act. Control 2023, 42, 89–109. [Google Scholar] [CrossRef]
  61. El-Dib, Y.O. The damping Helmholtz -Rayleigh-Duffing oscillator with the non-perturbative approach. Math. Comput. Simul. 2022, 194, 552–562. [Google Scholar] [CrossRef]
  62. Moatimid, G.M.; El-Sayed, A.T.; Salman, H.F. Different controllers for suppressing oscillations of a hybrid oscillator via non-perturbative analysis. Sci. Rep. 2024, 14, 307. [Google Scholar] [CrossRef] [PubMed]
  63. Moatimid, G.M.; Amer, T.S.; Galal, A.A. Studying highly nonlinear oscillators using the non-perturbative methodology. Sci. Rep. 2023, 13, 20288. [Google Scholar] [CrossRef] [PubMed]
  64. Moatimid, G.M.; Amer, T.S.; Galal, A.A. Inspection of some extremely nonlinear oscillators using an inventive. J. Vib. Eng. Technol. 2024, 12 (Suppl. S2), S1211–S1221. [Google Scholar] [CrossRef]
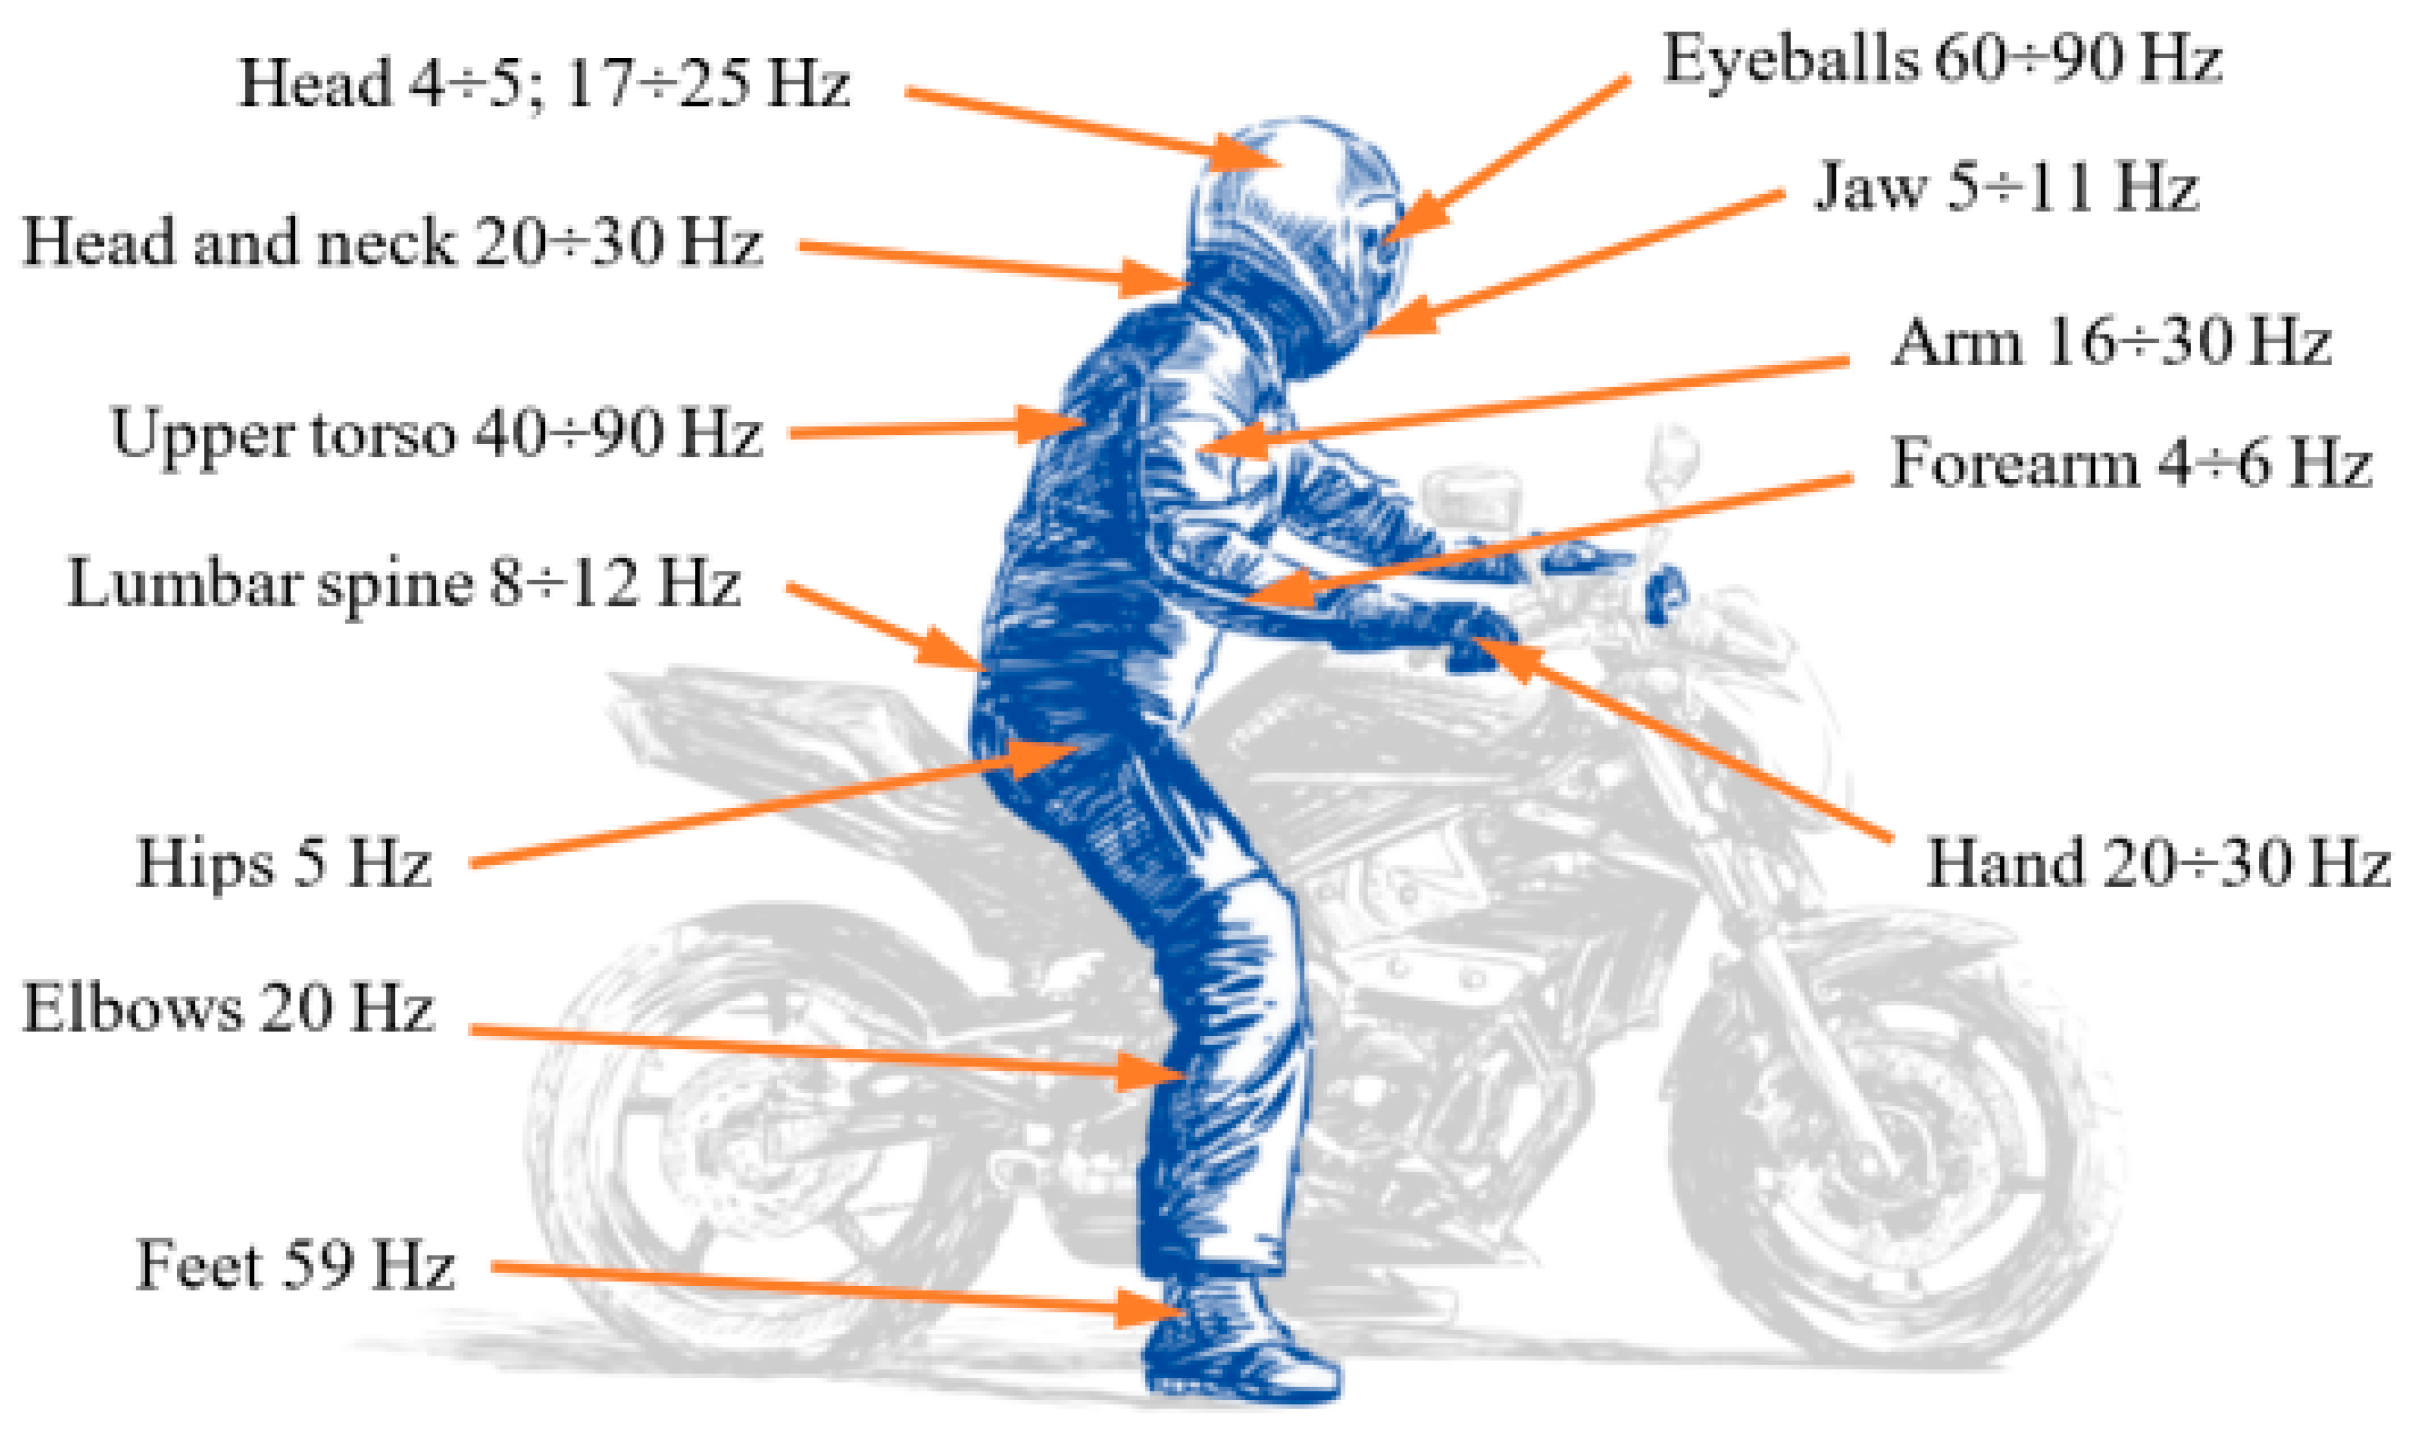
Figure 1. Normal frequencies of designated parts and organs of the human body.
Mathematics 13 03120 g001
Figure 2. Step-by-step flowchart process, specifically highlighting the integration of the He’s frequency formula and NPA.
Mathematics 13 03120 g002
Figure 3. Shows the vibrating dynamics of a motorcycle.
Mathematics 13 03120 g003
Figure 4. Shows a comparison between the solutions for the vibrating dynamics of a motorcycle using NS for x e q t and NPA for v t .
Mathematics 13 03120 g004
Figure 5. Portrays the stable/unstable regions at (a) μ e q = 0.1 ; (b) μ e q = 1 ; (c) μ e q = 1.5 .
Mathematics 13 03120 g005
Figure 6. Illustrates the impacts of f e q .
Mathematics 13 03120 g006
Figure 7. Illustrates the impacts of Ω .
Mathematics 13 03120 g007
Figure 8. Exhibits the polar plots of the linear equivalent differential (10) for the variation in the excitation force f e q .
Mathematics 13 03120 g008
Figure 9. Influence of the uncontrolled dynamical system at primary resonance case ( Ω ω e q ). (a) Time history; (b) phase plane.
Mathematics 13 03120 g009
Figure 10. Response of the controlled dynamical system per PDPPF controller at simultaneous primary and 1:1 internal resonance case ( Ω ω e q ,   ω 2 ω e q ). (a) time history for (x) (b) phase plane x-velocity (c) time history for (y) (d) phase plane y-velocity.
Mathematics 13 03120 g010
Figure 11. FRC of the external excitation coefficient f e q on (a) the motorcycle system’s amplitude a 1 -2D, (b) the motorcycle system’s amplitude a 1 -3D, (c) the PDPPF controller’s amplitude a 2 -2D, and (d) the PDPPF controller’s amplitude a 2 -3D.
Mathematics 13 03120 g011
Figure 12. FRC of the equivalent damping coefficient μ e q on (a) the motorcycle system’s amplitude a 1 -2D, (b) the motorcycle system’s amplitude a 1 -3D, (c) the PDPPF controller’s amplitude a 2 -2D, and (d) the PDPPF controller’s amplitude a 2 -3D.
Mathematics 13 03120 g012
Figure 13. FRC of the equivalent natural frequency ω e q at ω 2 = ω e q on (a) the motorcycle system’s amplitude a 1 -2D, (b) the motorcycle system’s amplitude a 1 -3D, (c) the PDPPF controller’s amplitude a 2 -2D, and (d) the PDPPF controller’s amplitude a 2 -3D.
Mathematics 13 03120 g013
Figure 14. FRC of the cubic nonlinear coefficient α e q on (a) the motorcycle system’s amplitude a 1 -2D, (b) the motorcycle system’s amplitude a 1 -3D, (c) the PDPPF controller’s amplitude a 2 -2D, (d) the PDPPF controller’s amplitude a 2 -3D.
Mathematics 13 03120 g014
Figure 15. FRC of the quintic nonlinear coefficient β e q on (a) the motorcycle system’s amplitude a 1 -2D, (b) the motorcycle system’s amplitude a 1 -3D, (c) the PDPPF controller’s amplitude a 2 -2D, (d) the PDPPF controller’s amplitude a 2 -3D.
Mathematics 13 03120 g015
Figure 16. FRC of the PDPPF controller gain G 1 on (a) the motorcycle system’s amplitude a 1 -2D, (b) the motorcycle system’s amplitude a 1 -3D, (c) the PDPPF controller’s amplitude a 2 -2D, (d) the PDPPF controller’s amplitude a 2 -3D.
Mathematics 13 03120 g016
Figure 17. FRC of the PDPPF controller gain γ 1 on (a) the motorcycle system’s amplitude a 1 -2D, (b) the motorcycle system’s amplitude a 1 -3D, (c) the PDPPF controller’s amplitude a 2 -2D, (d) the PDPPF controller’s amplitude a 2 -3D.
Mathematics 13 03120 g017
Figure 18. FRC of the PDPPF controller gain γ 2 on (a) the motorcycle system’s amplitude a 1 -2D, (b) the motorcycle system’s amplitude a 1 -3D, (c) The PDPPF controller’s amplitude a 2 -2D, (d) the PDPPF controller’s amplitude a 2 -3D.
Mathematics 13 03120 g018
Figure 19. FRC of the feedback signal gain G 2 on (a) The motorcycle system’s amplitude a 1 -2D, (b) the motorcycle system’s amplitude a 1 -3D, (c) the PDPPF controller’s amplitude a 2 -2D, (d) the PDPPF controller’s amplitude a 2 -3D.
Mathematics 13 03120 g019
Figure 20. FRC of the PDPPF damping coefficient μ 2 on (a) the motorcycle system’s amplitude a 1 -2D, (b) the motorcycle system’s amplitude a 1 -3D, (c) the PDPPF controller’s amplitude a 2 -2D (d), the PDPPF controller’s amplitude a 2 -3D.
Mathematics 13 03120 g020
Figure 21. FRC of the detuning coefficient σ 2 on (a) the motorcycle system’s amplitude a 1 -2D, (b) the motorcycle system’s amplitude a 1 -3D, (c) the PDPPF controller’s amplitude a 2 -2D, (d) the PDPPF controller’s amplitude a 2 -3D.
Mathematics 13 03120 g021
Figure 22. Frequency–response with sensitivity analysis at different values of f e q (a) a 1 via σ 1 ; (b) a 2 via σ 1 .
Mathematics 13 03120 g022
Figure 23. Frequency–response with sensitivity analysis at different values of μ e q (a) a 1 via σ 1 ; (b) a 2 via σ 1 .
Mathematics 13 03120 g023
Figure 24. Frequency–response with sensitivity analysis at different values of G 1 (a) a 1 via σ 1 ; (b) a 2 via σ 1 .
Mathematics 13 03120 g024
Figure 25. Frequency–response with sensitivity analysis at different values of G 2 (a) a 1 via σ 1 ; (b) a 2 via σ 1 .
Mathematics 13 03120 g025
Figure 26. Impacts of various types of control on the framework before control.
Mathematics 13 03120 g026
Figure 27. Comparison between the perturbation (blue) and numerical solutions (red) at the worst case with control. (a) Time history for the motorcycle system. (b) Time history for the PDPPF Controller.
Mathematics 13 03120 g027
Figure 28. Comparison between FRCs for the motorcycle system before and after PDPPF.
Mathematics 13 03120 g028
Figure 29. Bifurcation diagram of x vs. Ω with PDPPF control at G 1 = γ 1 = γ 2 = 0.2 , G 2 = 0.5 .
Mathematics 13 03120 g029
Figure 30. Phase portraits and Poincaré maps of (a) the periodic state at Ω = 0.72 . (b) The periodic state at Ω = 2.5 . (c) The quasiperiodic state at Ω = 1.37 . (d) The chaotic behavior at Ω = 0.02 .
Mathematics 13 03120 g030aMathematics 13 03120 g030b
Figure 31. Largest Lyapunov exponent (LLE) as a function of the excitation frequency Ω. Negative values indicate stable motion, while positive values denote chaos.
Mathematics 13 03120 g031
Figure 32. (a,b) Schematic representation of a motorcycle suspension model including the rider mass ( m r ), the vehicle mass ( m v ), the wheel mass ( m w ), the tire stiffness ( k t ), the strut stiffness ( k s ), the strut damping ( c s ), the rider stiffness ( k r ), and the rider damping ( c r ).
Mathematics 13 03120 g032
Table 1. Approves the equivalence between the numerical solution (NS) of x e q t and its corresponding NPA v t .
T i m e NS   for   x e q t
Nonlinear ODE
NPA   for   v t
Linear ODE
Absolute Error
00.010.010
50.07974330.07933040.0004129
10−0.0506181−0.05105580.0004377
15−0.0477873−0.04681010.0009772
200.06495390.06590820.0009543
25−0.0414129−0.04137793.5 × 10−5
300.04880450.0484110.0003935
350.002473370.001053230.00142014
40−0.0459552−0.04454590.0014093
450.06574080.06632840.0005876
50−0.0443966−0.04523820.0008416
550.007989730.009314820.00132509
600.01776710.01744130.0003258
65−0.0597973−0.05935120.0004461
700.06223740.06250570.0002683
75−0.0281102−0.02827660.0001664
80−0.0174564−0.01742842.8 × 10−5
850.04952480.04946645.84 × 10−5
90−0.0627916−0.06262330.0001683
950.04350450.04381880.0003143
100−0.00163407−0.003246070.001612
Table 2. Comparison of vibration suppression performance for different controllers in terms of peak amplitude reduction and settling time.
ControllerPeak AmplitudeReduction %Settling Time (s)
No Control0.95ــــــــــــــ150
PD0.1782.11%150
PPF0.01498.53%117.53
PDPPF0.00067599.93%23.64
Disclaimer/Publisher’s Note: The statements, opinions and data contained in all publications are solely those of the individual author(s) and contributor(s) and not of MDPI and/or the editor(s). MDPI and/or the editor(s) disclaim responsibility for any injury to people or property resulting from any ideas, methods, instructions or products referred to in the content.