Abstract
Broken or loose strands in high-voltage transmission conductors constitute critical defects that jeopardize grid reliability. Unmanned aerial vehicle (UAV) inspection has become indispensable for their timely discovery; however, conventional detectors falter in the face of cluttered backgrounds and the conductors’ diminutive pixel footprint, yielding sub-optimal accuracy and throughput. To overcome these limitations, we present PowerStrand-YOLO—an enhanced YOLOv8 derivative tailored for UAV imagery. The method is trained on a purpose-built dataset and integrates three technical contributions. (1) A C2f_DCNv4 module is introduced to strengthen multi-scale feature extraction. (2) An EMA attention mechanism is embedded to suppress background interference and emphasize defect-relevant cues. (3) The original loss function is superseded by Shape-IoU, compelling the network to attend closely to the geometric contours and spatial layout of strand anomalies. Extensive experiments demonstrate 95.4% precision, 96.2% recall, and 250 FPS. Relative to the baseline YOLOv8, PowerStrand-YOLO improves precision by 3% and recall by 6.8% while accelerating inference. Moreover, it also demonstrates competitive performance on the VisDrone2019 dataset. These results establish the improved framework as a more accurate and efficient solution for UAV-based inspection of power transmission lines.
MSC:
68T07; 68U10
1. Introduction
Transmission conductors form the essential pathway where electric power traverses from the generating centre station to the distribution sub-station [1]. Their operational reliability underpins the overall stability of the power system. These lines, exposed to natural environments over long periods, are prone to defects such as broken and loose strands, posing threats to the safe operation of electrical systems [2].
Timely and accurate identification of the defect is essential for preventing catastrophic failures. Although UAV-based inspection offers operational advantages, the diminutive target size of conductors and the cluttered backgrounds in UAV imagery severely restrict the accuracy of conventional detection algorithms. In recent years, many experts have conducted research on the detection of transmission line defects. Siddiqui et al. [3] proposed a defect recognition method based on the edge detection technique, which can achieve more accurate recognition results for defects in simple backgrounds. Huang et al. [4] proposed a segmentation method based on the weighted chromatic aberration method to achieve segmentation and extraction of power transmission conductors under different background conditions. Liu et al. [5] proposed a detection model based on the improvement of yolov8n for a transmission line on abnormal targets. Ye et al. [6] proposed an online monitoring method for transmission conductors combining deep reinforcement learning and image intelligent recognition. Liu Z et al. [7] proposed key target and defect detection of high-voltage power transmission lines with deep learning. Choi H et al. [8] proposed an attention-based multimodal image feature fusion module for transmission line detection. Zhao W et al. [9] proposed an insulator in transmission line recognition and fault detection model based on improved faster RCNN. Di et al. [10] proposed a method based on the YOLO algorithm for power line damage detection. Wang et al. [11] proposed a real-time transmission wire defect detection method based on improved YOLOv7. It enables real-time detection of transmission conductors and reduces false-positive and missed detection rates for conductor defects. Li et al. [12] effectively solved the sample category imbalance and sample difficulty imbalance problem by using the Focal-DIoU loss function on the basis of the YOLOv7 Tiny algorithm. Nevertheless, the aforementioned algorithms have yet to fully address the challenges posed by aerial imagery of transmission lines. Consequently, both the accuracy and efficiency of broken or loose strand detection in UAV-acquired images remain sub-optimal. Additionally, due to the lack of data, a special dataset tailored for model training must be created.
As object detection techniques evolve, the field has naturally bifurcated into two dominant paradigms: (1) two-stage algorithms, exemplified by R-CNN [13], Fast R-CNN [14], and Faster R-CNN [15], and (2) single-stage algorithms, represented by Single Shot Detector (SSD) and You Only Look Once (YOLO) series [16]. The YOLO family continues to evolve, with recent releases such as YOLOv10 [17], YOLOv11 [18], and YOLOv12 [19] delivering state-of-the-art performance. The YOLO algorithm not only sustains real-time inference speed but also preserves high accuracy for target detection in complex backgrounds. However, the environment of power transmission lines renders conductors highly similar to their backgrounds in texture, color, and spatial structure. Consequently, the unoptimized YOLO algorithm exhibits low accuracy and slow inference when tasked with power transmission conductor defect detection. To address these challenges, an improved PowerStrand-YOLO model is proposed in this study, and the key contributions are summarized below.
1. To address the scarcity of authentic aerial images of transmission lines, we employ data augmentation techniques to construct a task-specific dataset. Empirical results demonstrate that the dataset faithfully preserves the underlying data distribution, substantially mitigates overfitting in deep learning-based detection models, and markedly improves their generalization capability and robustness in previously unseen scenarios.
2. To address the difficulty of feature extraction, we redesign the C2f module of YOLOv8 by replacing its standard convolutions with Deformable Convolution v4 (DCNv4). This modification significantly enhances the network’s representation of conductor features with negligible additional computational cost. The DCNv4 replaces fixed-grid sampling with a dynamic sampling mechanism, allowing the convolutional kernel to adjust its positions in real time according to the shape and size of the target. Consequently, the model can adaptively extract multi-scale transmission line features, further improving accuracy and robustness in complex aerial scenarios.
3. To mitigate interference from extraneous objects and cluttered backgrounds in aerial imagery, we integrate the Efficient Multi-Scale Attention (EMA) module into the baseline model backbone. Leveraging cross-scale feature interaction and channel space co-calibration, EMA adaptively emphasizes conductor regions while preserving lightweight design. It substantially improves the discrimination and aggregation of multi-scale transmission conductor features and enhances overall detection accuracy and robustness.
4. To further refine the geometric localization of irregular transmission conductor defects, we replace the CIoU loss function with Shape-IoU. By integrating a dynamic re-weighting scheme that jointly considers target scale and shape complexity, the Shape-IoU loss function maintains high sensitivity to subtle deformations and spatial configurations of defects. It significantly improves the network’s localization accuracy for irregular conductor flaws.
2. Dataset and Samples
For detecting broken or loose strands of transmission conductors in UAV-captured images, public datasets are unable to meet the requirements for model training. To elevate both accuracy and cross-domain generalization, we need to construct a specialized dataset for the model training. We construct the dataset from drone images collected by the power inspection authority and augment it using the small-sample dataset expansion algorithm proposed by Zhou et al. [20].
The process of constructing the dataset is shown in Figure 1. We began by annotating the image using the LabelMe tool to extract the shapes. Subsequently, image processing technology was employed to accurately extract the annotated transmission conductor contours in UAV aerial images and generate high-fidelity mask images. Pure background patches were then cropped from the original aerial images. Finally, the conductor mask and background patches were fused under spatial consistency constraints to synthesize photorealistic aerial conductor images in batch.
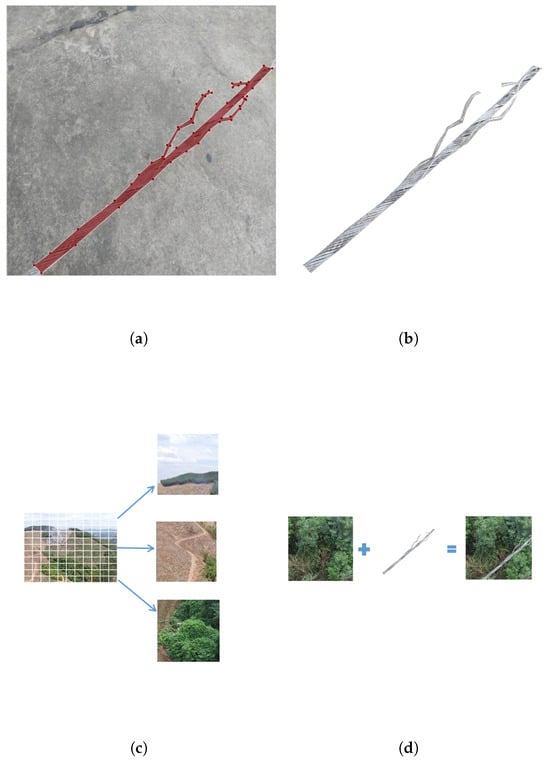
Figure 1.
(a) The shapes of broken or loose strands are extracted from inspection images using LabelMe. (b) Wire mask extraction. (c) The background is generated using image cropping technology. (d) The mask image and the background image are used to generate a simulated picture.
The synthesized instances exhibit near-photorealistic fidelity, as demonstrated in Figure 2. After generating synthetic data, we further augmented it with techniques like image rotation, brightness adjustment, grayscale conversion, and data cleaning. The data cleaning technique in object detection can improve the quality of the dataset [21]. Starting with a base dataset of 65 original images, we use the techniques to expand it to a total of 2700 images. We then split these into training, validation, and test sets in an 8:1:1 ratio, initially allocating 65 images accordingly. Subsequently, we divide the augmented 2635 images in the same ratio. Finally, the dataset is divided into training, validation, and test sets containing 2160, 271, and 269 images, respectively. The division ensures that each subset contains both real and synthetic data.
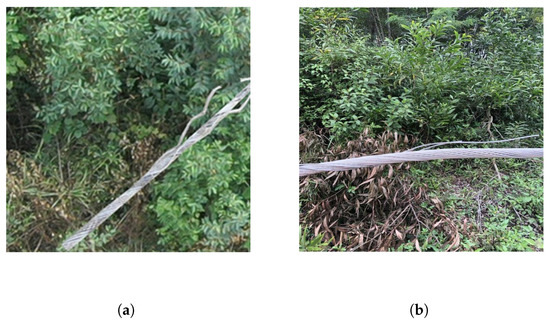
Figure 2.
(a) The generated image. (b) The original image.
To evaluate the distribution consistency between the augmented dataset and the real dataset, we utilize the Maximum Mean Discrepancy (MMD) metric. This method, grounded in Gaussian kernel techniques, effectively assesses the distribution divergence between two datasets within the reproducing kernel Hilbert space. By extracting 262-dimensional feature vectors from both real and augmented images, we compute the MMD2 value to quantify the distribution difference. The calculation formula of MMD2 is as follows:
where is the Gaussian kernel function and is the bandwidth parameter, typically chosen as , with d being the dimensionality of the feature space.
Heusel M et al. [22] proved that when MMD2 < 0.05, the data samples do not have outliers. Our MMD2 value of 0.03 is well below the empirical threshold, indicating that the augmented data closely align with the real data distribution. This affirms the suitability of the augmented dataset for model training. In this study, we define transmission conductors with broken or loose strand defects as the “abnormal_wire” label and conductors without such defects as the “normal_wire” label.
3. Methodology
3.1. Baseline Algorithm
When selecting a baseline algorithm, we chose YOLOv8n (a lightweight version of the YOLOv8 [23] series) due to several key factors. Firstly, YOLOv8 offers essential flexibility, particularly in the backbone module. The C2f module enhances computational efficiency through lightweight design and features. Moreover, the C2f provides a flexible architecture in YOLOv8, allowing effective feature extraction and fusion. This modular design is crucial for our research goals. It enables us to specifically improve the model’s detection capabilities under complex scenarios, such as detecting power line defects. Additionally, YOLOv8 also enjoys a more mature and active community. Though newer YOLO versions like YOLOv9 and YOLOv12 introduce innovations like PGI and GELAN, these may not be necessary for our task.
Like previous YOLO models, YOLOv8 comprises four functional blocks: an input layer, backbone network, neck, and detection head. Its architecture structure is shown in Figure 3.
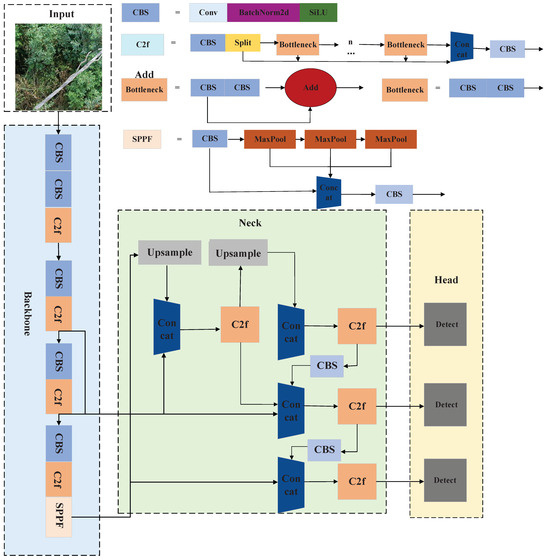
Figure 3.
The original YOLOv8 input layer, backbone network, neck, and detection head network architecture diagram, along with the CBS, C2f, SPPF, and bottleneck network architecture diagrams.
Relative to YOLOv5 [24], YOLOv8 embeds the CSPLayer_2Conv (C2f) module within its backbone to endow the network with residual learning capabilities. Drawing upon the cross-stage partial (CSP) design of YOLOv5 and the efficient layer aggregation network (ELAN) of YOLOv7 [25], the C2f block orchestrates gradient flow across hierarchical feature maps. In the neck, the C2f supersedes the earlier C3 blocks, while a path aggregation network (PAN) [26] coupled with a feature pyramid network (FPN) enables bidirectional information fusion. The detection head includes three heads, designed for multi-scale object detection. With these improvements, YOLOv8 outperforms YOLOv7 in terms of performance [27].
3.2. PowerStrand-YOLO Algorithm
Although the YOLOv8 detection model demonstrates outstanding performance, the original model still exhibits low accuracy and generalization in detecting the targets of this study. In complex aerial scenes, the backbone struggles with insufficient feature fusion. Moreover, YOLOv8’s default CIoU loss function is insensitive to the subtle geometric variations of slender conductor defects, amplifying localization errors for small and irregular targets. To achieve higher accuracy and generalization, we improve the baseline model to develop the PowerStrand-YOLO model. The PowerStrand-YOLO model includes improving the original YOLOv8 C2f block to C2f_DCNv4, introducing the EMA attention model at the end of backbone, and incorporating the Shape-IoU loss function. The architectural design of PowerStrand-YOLO is shown in Figure 4.
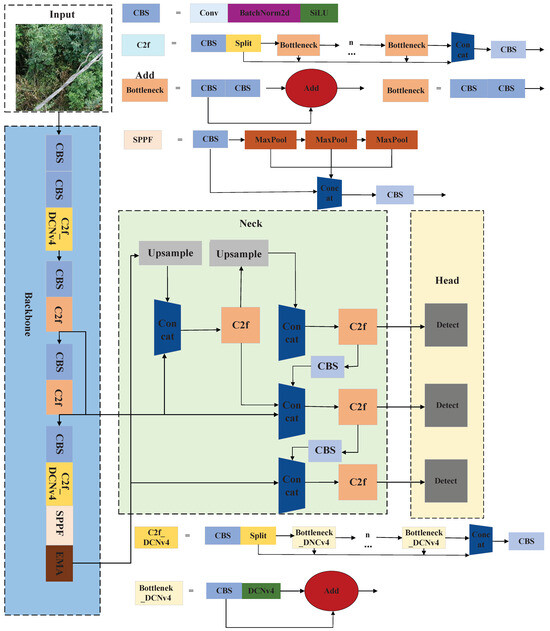
Figure 4.
The PowerStrand-YOLO input, backbone, neck, and head network architecture diagram, along with the CBS, C2f, SPPF, and bottleneck network architecture diagrams.
3.2.1. Feature Extraction Module C2f_DCNv4
Deformable Convolution v4 (DCNv4) [28] is an efficient operator. It retains the outstanding feature extraction capabilities inherent to the DCN family. Its operational pipeline is shown in Figure 5.
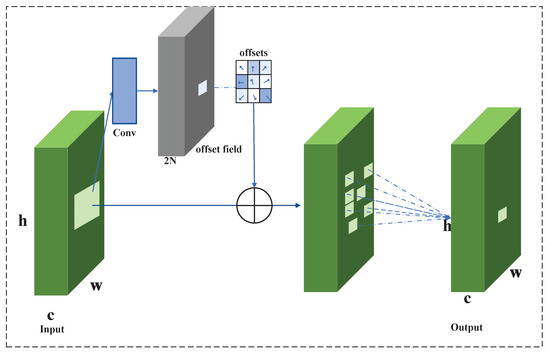
Figure 5.
DCN processing feature workflow.
In contrast to Deformable Convolution v3 [29] (DCNv3), DCNv4 removes softmax normalization and optimizes memory access, enabling unbounded dynamic weights and delivering a sparse convolution operator with more than triple the speedup and quicker convergence. Integrating DCNv4 into the C2f module equips the model to capture multi-scale representations of broken or loose transmission conductor strands within UAV imagery. Specifically, the second 3 × 3 standard convolution within each bottleneck of the C2f module is replaced with DCNv4. It reduces the parameters of the C2f module while substantially enhancing the kernel’s geometric adaptability. During feature sampling, C2f_DCNv4 dynamically learns both sampling offsets and modulation weights. Consequently, the model maintains high-precision feature extraction. A comparison of the module after the introduction of C2f_DCNv4 and the original C2f network structure is shown in Figure 6.
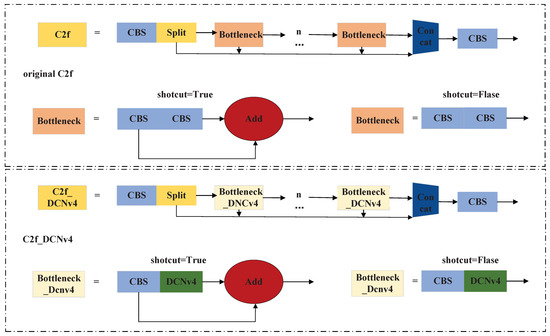
Figure 6.
The comparison diagram between the C2f_DCNv4 and original C2f modules, as well as the Bottleneck_DCNv4 and original C2f modules.
Within the C2f_DCNv4 module, the input feature map is sliced into multiple channel groups. Then, convolution is computed at every position within each group. Each group obtains its own sampling offsets and modulation scales. The convolution outputs of all groups are then concatenated to form the final result. Introducing DCNv4 compensates for the C2f module’s limited ability to extract fine, irregular conductor defect features. The DCNv4 is formulated as follows:
where G is the number of aggregation groups. and represent the projection weights for different positions and K is the count of sampling points and represents the k-th sampling point’s modulation factor, softmax-normalized across dimension K.
3.2.2. Efficient Multi-Scale Attention (EMA) Mechanism
Due to the complex background, the original model faces difficulty in accurately capturing key features of the defects. As an attention mechanism, Efficient Multi-Scale Attention (EMA) [30] can help models to better focus on the target region. EMA preserves per-channel details while trimming computation. It splits channels into several sub-features and then evenly disperses spatial semantics across every group.
The network structure is shown in Figure 7.
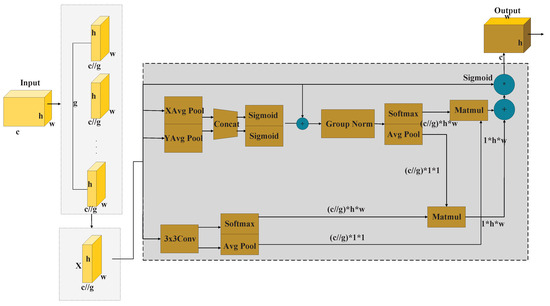
Figure 7.
EMA attention mechanism network structure.
The core process of EMA can be abstracted as “dual-track parallelism–cross-scale re-coupling”. The incoming feature is first squeezed by two consecutive pooling branches, a global average pooling followed by a global max pooling, producing a pair of 1 × 1 polarized statistics. These vectors are concatenated and fused into a single-channel weight map through a 1 × 1 convolution and then normalized by a sigmoid to yield a 1 × 1 global channel attention. Similarly, a 3 × 3 depthwise convolution slides across the original resolution to capture local context; the resulting 3 × 3 feature map is spatially softmax-normalized and reshaped into a 3 × 3 channel descriptor. Next, the 1 × 1 channel weights from the first branch are matrix-multiplied with the 3 × 3 descriptor from the second branch, generating a 3 × 3 spatial attention under the 1 × 1 channel view. Conversely, the 3 × 3 spatial features are multiplied with the 1 × 1 channel descriptor, producing a 1 × 1 channel attention under the 3 × 3 spatial view. The two attentions of different scales are element-wise summed, passed through another sigmoid to form the final fused weights, and applied as a residual re-calibration to the input. Owing to its distinctive feature capturing strategy, the EMA model can efficiently extract multi-scale target features. In the backbone of YOLOv8, we incorporated the attention mechanism to direct the model to pay more attention to the locations of transmission conductor features in the UAV-captured images.
3.2.3. Shape-IoU Loss Function
Bounding-box regression in YOLOv8 is optimized via the CIoU loss function. CIoU supplements the standard IoU with center-point separation and aspect ratio penalties. These additional terms increase computational overhead and often cause the predicted boxes to oscillate during training, thereby compromising convergence stability. More critically, CIoU imposes excessive penalties on low-quality samples. Due to the complex operating environment of the transmission conductors, the UAV-captured images often have poor quality. And the defects of broken strands and loose strands in transmission conductors occupy small areas and exhibit irregular shapes. Consequently, CIoU tends to amplify noise-induced errors, leading to overfitting and reduced generalization to the defects of transmission conductors in UAV-captured images.
To address these challenges, we replace CIoU with Shape-IoU [31] to fully exploit the geometrical features of transmission line defects. Building upon the conventional IoU, Shape-IoU explicitly incorporates a shape consistency constraint on bounding boxes and re-weights the loss through two dynamic terms: a small-target scale factor and a shape complexity factor. This re-weighting strategy amplifies shape discrepancies of irregular defects such as broken or loose strands while suppressing the excessive penalties imposed on low-quality samples. So it steers the network’s attention toward defect contours rather than background noise. Consequently, Shape-IoU markedly improves the model’s generalization and fitting accuracy across multi-scale transmission defects of varying morphologies. Its complete formulation is given as follows:
the IoU is defined as follows:
where is the ground truth box and B denotes the predicted box. The distance lose calculation formula is as follows:
where and represent the width and height of the GT box; c represents the span of the tightest axis-aligned rectangle that simultaneously circumscribes the predicted and ground truth boxes, measured corner to corner. The parameter scale acts as a scale factor whose value is determined by the size distribution of targets within the dataset. and serve as horizontal and vertical weighting coefficients, respectively, whose magnitudes adapt to the aspect ratio of the ground truth bounding box. These parameters are dynamically re-scaled according to the varying shapes and sizes of individual samples. The shape loos calculation formula is as follows:
where h denotes the height of the anchor box and w is the width of the anchor box.
4. Experimental Results and Analyses
4.1. Experimental Platform
All experiments are conducted on a single NVIDIA RTX A4000 GPU (16 GB). The software environment comprises Python 3.10, PyTorch 2.0.0, CUDA 11.8, and cuDNN 8.9.2. Models are trained for 300 epochs with SGD, with an initial learning rate of 0.01 and batch size of 16. The other experimental parameters are the default values of the model.
4.2. Evaluation Matrix
In this study, the precision, recall, mAP, and FPS are used to evaluate the performance of model. The specific meanings of the above indexes are as follows. precision (P), recall (R), and mean Average Precision (mAP) are key metrics in object detection. They collectively mirror the overall effectiveness of the detection model. Their values are computed as follows:
where TP is the number of objects correctly detected by the model. TN is the number of non-objects correctly identified by the model. FP is the number of non-objects incorrectly detected by the model. FN is the number of objects missed by the model.
FPS is a crucial metric in object detection, measuring a model’s processing speed and its ability to handle real-time applications.
4.3. Ablation Experiment
To validate the efficacy of the enhancements, we conduct multi-round ablation studies employing precision, recall, mAP50, mAP50–95, and FPS as evaluation metrics. The results are shown in Table 1.

Table 1.
Ablation experiment.
As shown in Table 1, each of the three improvement strategies exhibit substantial performance gains over the baseline YOLOv8n. We replace the C2f blocks at positions 1 and 4 in the original YOLOv8 backbone with our improved C2f_DCNv4 modules. Not only does the model enhance feature extraction for transmission lines, but it also reduces computational overhead. Through such improvements, it improves the baseline precision by 1.7%, the recall by 4.1%, the mAP50 by 1.6%, and the mAP50–95 by 5.9%. Meanwhile the deployment of lighter-weight convolutions within C2f_DCNv4 boosts inference throughput to 251 FPS. On the basis of adding C2f_DCNv4, we introduce the EMA model; the improved model has a unique feature capture strategy and is more sensitive to the features of power transmission conductors. So the precision increases by 0.9%, the recall by 1.5%, the mAP50 by 1.4%, and the mAP50–95 by 3.5%. However, compared to the original model, it has an additional attention mechanism module, which results in a certain decrease in processing speed. On the basis of adding C2f_DCNv4 and EMA, we replace the original loss function with Shape-IoU to mitigate its inherent limitations. The model’s fitting ability for irregular defects has been optimized. As a result, the precision of the model increases by 0.4%, the recall by 1.2%, the mAP50 by 0.6%, and the mAP50–95 by 1.5%. The final model is named PowerStrand-YOLO. When compared with the baseline YOLOv8 model, PowerStrand-YOLO has an overall improvement of 3% in precision, 6.8% in recall, 3.7% in mAP50, 10.9% in mAP50-90, and 8 in FPS. This means that PowerStrand-YOLO can markedly elevate both detection accuracy and the speed of detecting broken or loose strands of transmission conductors in UAV aerial images.
4.4. Position Comparison Experiment of C2f_DCNv4
As shown in Figure 8, there are four C2f modules in the original YOLOv8 backbone. For the decision of using positions in YOLOv8 with the improved C2f_DCNv4, we use mAP50 and Params for the comparison and evaluation. mAP50 emphasizes detection at the 0.5 IoU level, which best reflects the practical tolerance for positioning errors in safety-critical inspections. The results are shown in Table 2.
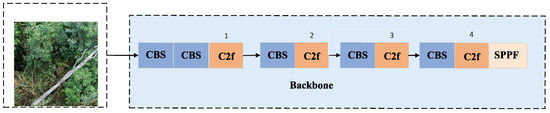
Figure 8.
YOLOv8 backbone network.
Table 2.
Experimental results of C2f_DCNv4 in the YOLOv8 network position.
As shown in Table 2, after using C2f_DCNv4 for the C2f module in the first and fourth positions in the original YOLOv8 backbone, the mAP is 95.7%. After using it in the third and fourth, the mAP is 95.1%. After using it in the first, second, and third, the mAP is 94.9%. They are all higher than that of the baseline model. Especially when the C2f_DCNv4 is used at the first and fourth positions, the mAP is best. This is because early layers (first C2f) benefit most from deformable kernels because they process low-level edges and textures and later layers (fourth C2f) refine feature maps before detection. Replacing C2f_DCNv4 here maximizes shape adaptive gain without diluting mid-level semantics. Additionally, the improved model achieves a reduction in parameters. Replacing every C2f block in the backbone with C2f_DCNv4 yields a lighter model; the model’s parameter count has decreased by about 1.8 M. But mAP50 is inferior when the module replaces the first and fourth positions. Additionally, by replacing the first and fourth positions, the model’s parameters also decreased by about 1.0M. This also achieves a certain degree of model lightweighting. So we use C2f_DCNv4 in the first and fourth positions of the original YOLOv8.
4.5. Comparative Experiments on Different Attention Mechanisms
To examine how varied attention modules influence model efficacy, we conduct comparative experiments on an identical experimental platform (as in Section 4.1) using four widely adopted attention mechanisms—CBAM [32], ECA [33], SE [34], and EMA. The results are summarized in Table 3.
Table 3.
Experimental results of different attention models.
As shown in Table 3, EMA surpasses the other mechanisms on most metrics; although ECA attains the highest mAP50, it is only 0.2% more than EMA and underperforms on the remaining indicators. The reason may be that ECA, by virtue of its dimensionality-preserving channel attention mechanism, effectively captures inter-channel interactions and thereby enhances the expressive capacity of certain features. Overall, integrating EMA into the backbone of the baseline YOLOv8 strengthens feature extraction and yields the best comprehensive performance. It improves precision by 1.6%, recall by 4.4%, mAP50 by 1.7%, and mAP50–95 by 6.8%. The result confirms that introducing EMA into the backbone network of YOLOv8 effectively enhances detection of transmission conductor defect accuracy in aerial images.
4.6. Comparative Experiments on Different Loss Functions
To systematically evaluate the impact of different loss functions for the detection accuracy, we conduct comparative experiments under a unified protocol, examining CIoU, DIoU [35], EIoU [36], and Shape-IoU. The quantitative results are shown in Table 4.
Table 4.
Experimental results of different loss functions.
As shown in Table 4, Shape-IoU delivered the best performance across four metrics: P reached 93.0%, R 90.2%, mAP50 95.3%, and mAP50–95 65.5%. Compared with the baseline model, these results correspond to improvements of 0.6% in precision, 0.8% in recall, 1.2% in mAP50, and 0.5% in mAP50–95. Shape-IoU also outperforms the other loss functions. This superiority is attributed to its unique dynamic re-weighting strategy. It combines small-target scale weighting and complex shape feature weighting, thereby aligning the loss with the characteristics of the investigated defects. The experiment confirmed that substituting the default loss function of YOLOv8 with Shape-IoU significantly boosts the model’s aptitude for detecting defects of transmission conductors in UAV aerial imagery.
4.7. Visualization Analysis
To further validate model performance, we present a visualization analysis using absolute and normalized confusion matrices and training plots, as shown in Figure 9.
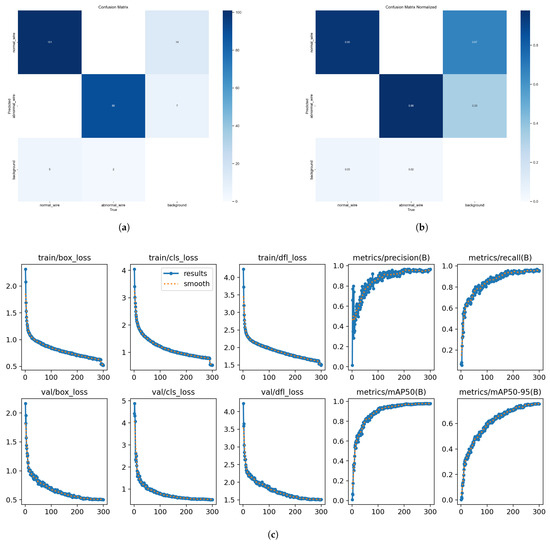
Figure 9.
(a) The absolute confusion matrix. (b) The confusion matrix normalized. (c) The training plot.
The absolute confusion matrix exhibits high diagonal values and minimal miss-detections in abnormal class. The normalized matrix reveals nearly perfect recall and precision for all classes, with errors restricted to boundary regions. The training plot shows that losses continue to decrease and metrics such as P, R, mAP50, and mAP50–95 keep rising, stabilizing near 300 epochs. The model does not exhibit early stopping, indicating that it continues to learn target features effectively. Thus, choosing 300 epochs is reasonable. These findings demonstrate that data augmentation introduces no class bias and that the model remains robust under complex backgrounds.
4.8. Comparison Experiments of Different Detection Algorithms
In order to evaluate the performance of Powerstrand-YOLO, we compare the improved model with other advanced detection models. Furthermore, we incorporated our improved module into YOLOv5-n to form PowerStrand-YOLO (YOLOv5-n) for the comparative experiments. Each model is trained on the same dataset and assessed using precision, recall, mAP, and FPS as unified metrics. The results are shown in Table 5.
Table 5.
Results of comparative experiments on different detection models.
As shown in Table 5, we can see that PowerStrand-YOLO has a higher precision, recall, mAP(50), mAP(50–95), and FPS than the baseline. P is 94.4%, R is 96.2%, mAP50 is 97.8%, mAP50–95 is 75.9%, and FPS is 250. In addition, other detection algorithms were worse than PowerStrand-YOLO in terms of precision, recall, mAP(50), and mAP(50–95). Although YOLOv5, YOLOv9, YOLOv10, and PowerStrand-YOLO (YOLOv5-n) have a higher FPS than our model, other evaluation indicators are generally lower. This is because they sacrificed accuracy in exchange for speed. These detection models’ performance on high-voltage transmission conductor defects falls markedly short of the improved model’s capability. PowerStrand-YOLO (YOLOv5-n) underperforms our model because we adopted YOLOv8-n as the baseline; YOLOv8-n delivers superior overall performance. Therefore, it can be concluded that the improved model for detecting transmission conductor defects in UAV imagery has excellent performance.
4.9. Comparative Experiments on the VisDrone2019 Dataset
To further assess the generalization capability of PowerStrand-YOLO, we conduct comparative experiments on the more challenging VisDrone2019 [37] dataset. The experimental environment is the same as that described in Section 4.1. VisDrone2019 is a large-scale benchmark collected by the AISKYEYE team at Tianjin University for drone-based computer vision tasks. It comprises 288 video clips and 10,209 static images captured by diverse UAV-mounted cameras across 14 Chinese cities under varying weather, lighting, and altitude conditions. The dataset provides over 2.6 million manually annotated bounding boxes covering ten object classes, such as pedestrian, car, van, truck, and bicycle, and includes attributes such as occlusion and truncation. The results are shown in Table 6.
Table 6.
Experimental results on VisDrone2019.
As shown in Table 6, on the VisDrone2019 dataset, PowerStrand-YOLO attains 51.2% precision, 34.1% recall, 43.6% mAP50, and 27.1% mAP50–95, demonstrating competitive efficacy. OSD-YOLOv10 [38] is a state-of-the-art detector on VISDrone2019. YOLOv10 and OSD-YOLOv10 surpass our model in recall, presumably because its dynamic sparse training strategy and adaptive label assignment mechanism jointly suppress missed detections. However, they underperform our model on the remaining three metrics. PowerStrand-YOLO surpasses the baseline model, achieving a 5.3% increase in precision, 0.9% increase in recall, 9.7% increase in mAP50, and 7.3% increase in mAP50–95. Moreover, the comprehensive performance surpasses that the of new algorithm in the YOLO series, YOLOv12. These improvements can be attributed to PowerStrand-YOLO, which enhances the model’s ability to extract discriminative features from aerial imagery. The results demonstrate that PowerStrand-YOLO possesses promising generalization capability for object detection in aerial scenes. The model has the potential for further development.
4.10. Performance Verification of PowerStrand-YOLO
To evaluate the performance of PowerStrand-YOLO, we choose real-scene imagery acquired by power inspection drones, which includes small targets and multi-interference factor images for comparison. Transmission conductor defects shown in UAV aerial images do not occur in the dataset. The results are shown in Figure 10.
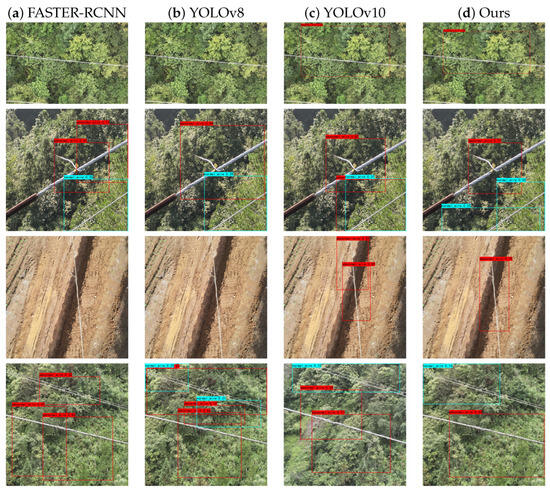
Figure 10.
Comparison of four models across three categories.
The experimental outcomes reveal that PowerStrand-YOLO markedly outperforms other detection models. Whether they are abnormal_wire or normal_wire, there are more correctly detected targets. Especially for small and multi-scale broken or loose strands in transmission conductors, the improved model outperforms the other three models by a clear margin. This is because of the synergistic enhancements of C2f_DCNv4, EMA, and Shape-IoU, which collectively strengthen the extraction of small, multi-scale transmission conductor features in UAV aerial images. The model’s accuracy has been significantly enhanced.
These results lead to the conclusion that PowerStrand-YOLO has a high accuracy for detecting broken or loose strands of transmission conductors within UAV aerial images. In practical applications, it can effectively enhance the efficiency of power inspection.
5. Discussion
In this study, we first construct a specialized dataset for the training of the target detection model. Then, based on the YOLOv8 model, we develop an improved high-voltage transmission conductor defect detection model for aerial images, named PowerStrand-YOLO.
Although the improved model demonstrates superiority, the model consequently exhibits missed detections under extreme conditions. This is because all data are collected within a single power line region. When broken or loose strands are minute and their texture and color closely resemble the background, the model fails to discriminate the defect from surrounding clutter and incorrectly treats it as part of the background. This failure stems from the model’s inability to learn discriminative features that separate fine-grained broken or splayed strands from the whitish, low-contrast background. In addition, for deployment scenarios demanding stricter lightweight constraints—such as mobile terminals—the present model still exhibits excessive parameter overhead. Future work will proceed along two complementary directions. First, we will upgrade to higher-resolution cameras and expand data collection across geographically diverse power line regions. Second, we will pursue model lightweighting—via structural re-parameterization, channel pruning, and knowledge distillation. Therefore, the model can be deployed on more mobile or edge devices without compromising accuracy while preserving real-time inspection performance. Finally we will focus on enhancing PowerStrand-YOLO’s generalization beyond UAV power line inspection. We plan to fine-tune the model on diverse aerial object datasets (e.g., VisDrone and DOTA) with domain-adaptive techniques and continual learning, enabling robust detection of vehicles, buildings, and maritime targets under varying sensors and environments. An intelligent detection model for the UAV will be formed.
6. Conclusions
Due to the complex and heterogeneous environments surrounding transmission conductors, public datasets fail to satisfy the practical demands for detecting broken or loose strands in UAV imagery. Moreover, conventional algorithms exhibit limited accuracy in defect detection. This study proposes a novel methodology for detecting broken or loose strands of transmission conductors within UAV-captured images. Our approach revolves around two pillars: (1) a small set of power line UAV images is augmented to create full training data; (2) the design of conductor broken or loose strands in the transmission conductor detection algorithm is carried out. The YOLOv8 model is used and improved, including improving the C2f module of YOLOv8 to C2f_DCNv4, adding the Efficient Multi-Scale Attention (EMA) module into the backbone of YOLOv8, and introducing the Shape-IoU loss function to replace CIoU. We aim to boost UAV detection of broken or loose transmission strands—accuracy, recall, speed, and generalization—under complex backgrounds. Furthermore, the model demonstrates competitive performance on the VisDrone2019 dataset. Through rigorous experiments, PowerStrand-YOLO demonstrates high accuracy and speed in detecting transmission line defects in UAV imagery.
Owing to the scarcity of publicly available datasets for this task, the improved model is trained on a set of datasets from the same area. So, its accuracy may therefore decline in rare real-world cases. To mitigate this limitation, future efforts will prioritize gathering a wider spectrum of in-the-wild samples to expand and diversify the dataset. In addition, the model will be made lightweight through means such as structural re-parameterization, channel pruning, and knowledge distillation so that PowerStrand-YOLO can be deployed to mobile terminals or edge computing platforms without sacrificing accuracy through progressive refinements, such as spanning richer multi-regional data, domain-adaptive training, and continual lightweight optimization. Ultimately, PowerStrand-YOLO will evolve into a universal, ultra-lightweight aerial vision backbone that enables fully autonomous real-time drone-based intelligent detection across a broad spectrum of applications.
Author Contributions
Conceptualization, Z.D. and J.L.; methodology, Z.D. and J.L.; software, J.L. and R.Y.; validation, S.J. and Q.W.; formal analysis, Z.D. and R.Y.; investigation, J.L. and J.H.; resources, Z.D.; data curation, J.L.; writing—original draft preparation, J.L. and J.H.; writing—review and editing, Z.D. and R.Y.; visualization, Z.D.; supervision, Z.D.; project administration, Z.D.; funding acquisition, Z.D. All authors have read and agreed to the published version of the manuscript.
Funding
This work was partially by the Guangxi Science and Technology Project (No. AB25069087, AB22035052 and AB20238013) and supported by the Guangxi Key Laboratory of Image and Graphic Intelligent Processing Project (Nos. GIIP2211 and GIIP2308) and the Innovation Project of GUET Graduate Education (No. 2025YCXS065).
Data Availability Statement
The data presented in this study are available on request from the corresponding author. Owing to statutory restrictions related to critical infrastructure security and personal privacy, the data cannot be deposited in a public repository.
Acknowledgments
We would like to thank the reviewers for their valuable comments and all the authors of the references cited in this article.
Conflicts of Interest
Shuaizheng Jiang and Qiuying Wu were employed by the Guangxi Shuifa Digital Technology Co., Ltd. The remaining authors declare that the research was conducted in the absence of any commercial or financial relationships that could be construed as a potential conflict of interest.
References
- Kgoete, F.M.; Uyor, U.O.; Popoola, A.P.; Popoola, O. Insight on the recent materials advances for manufacturing of high-voltage transmission conductors. Int. J. Adv. Manuf. Technol. 2024, 130, 4123–4136. [Google Scholar] [CrossRef]
- Gou, M.; Tang, H.; Song, L.; Chen, Z.; Yan, X.; Zeng, X.; Fu, W. Research on Defect Diagnosis of Transmission Lines Based on Multi-Strategy Image Processing and Improved Deep Network. Processes 2024, 12, 1832. [Google Scholar] [CrossRef]
- Siddiqui, Z.A.; Park, U. A drone-based transmission line components inspection system with deep learning technique. Energies 2020, 13, 3348. [Google Scholar] [CrossRef]
- Huang, X.; Zhang, X.; Zhang, Y.; Yang, L.; Liu, C.; Li, W. State Identification of Transmission Line Defect Based on Radial Basis Probabilistic Neural Network. Autom. Electr. Power Syst. 2019, 44, 201–210. [Google Scholar] [CrossRef]
- Liu, C.; Wei, S.; Zhong, S.; Yu, F. YOLO-PowerLite: A Lightweight YOLO Model for Transmission Line Abnormal Target Detection. IEEE Access 2024, 12, 105004–105015. [Google Scholar] [CrossRef]
- Ye, J.; Deng, W.; Xu, C.; Zhao, L. Transmission line online monitoring system based on deep reinforcement learning and image intelligent recognition. Ind. Technol. Innov. 2020, 7, 72–75. [Google Scholar] [CrossRef]
- Liu, Z.; Wu, G.; He, W.; Fan, F.; Ye, X. Key target and defect detection of high-voltage power transmission lines with deep learning. Int. J. Electr. Power Energy Syst. 2022, 142, 108277. [Google Scholar] [CrossRef]
- Choi, H.; Yun, J.P.; Kim, B.J.; Jang, H.; Kim, S. Attention-based multimodal image feature fusion module for transmission line detection. IEEE Trans. Ind. Inform. 2022, 18, 7686–7695. [Google Scholar] [CrossRef]
- Zhao, W.; Xu, M.; Cheng, X.; Zhao, Z. An insulator in transmission lines recognition and fault detection model based on improved faster RCNN. IEEE Trans. Instrum. Meas. 2021, 70, 5016408. [Google Scholar] [CrossRef]
- Di, T.; Feng, L.; Guo, H. Research on real-time power line damage detection method based on YOLO algorithm. In Proceedings of the IEEE 3rd International Conference on Electronic Technology, Communication and Information (ICETCI), Changchun, China, 26–28 May 2023; IEEE: Changchun, China, 2023; pp. 671–676. [Google Scholar] [CrossRef]
- Wang, Y.; Shang, J.; Zhang, Y.; Liu, J.; Yang, L.; Li, B. Real-time detection method for transmission line defects based on improved YOLOv7. South. Power Grid Technol. 2023, 17, 127–134. [Google Scholar] [CrossRef]
- Li, M.; Ding, L. DF-YOLO: Highly Accurate Transmission Line Foreign Object Detection Algorithm. IEEE Access 2023, 11, 108398–108406. [Google Scholar] [CrossRef]
- Girshick, R.; Donahue, J.; Darrell, T.; Malik, J. Rich feature hierarchies for accurate object detection and semantic segmentation. In Proceedings of the IEEE Conference on Computer Vision and Pattern Recognition, Columbus, OH, USA, 23–28 June 2014; IEEE: Columbus, OH, USA, 2014; pp. 580–587. [Google Scholar] [CrossRef]
- Girshick, R. Fast R-CNN. In Proceedings of the IEEE International Conference on Computer Vision, Santiago, Chile, 7–13 December 2015; IEEE: Santiago, Chile, 2015; pp. 1440–1448. [Google Scholar] [CrossRef]
- Ren, S.; He, K.; Girshick, R.; Sun, J. Faster R-CNN: Towards real-time object detection with region proposal networks. In Advances in Neural Information Processing Systems; Curran Associates, Inc.: Montreal, QC, Canada, 2015; pp. 91–99. [Google Scholar] [CrossRef]
- Redmon, J.; Divvala, S.; Girshick, R.; Farhadi, A. You only look once: Unified, real-time object detection. In Proceedings of the IEEE Conference on Computer Vision and Pattern Recognition, Las Vegas, NV, USA, 26 June–1 July 2016; IEEE: Las Vegas, NV, USA, 2016; pp. 779–788. [Google Scholar] [CrossRef]
- Wang, A.; Chen, H.; Liu, L.; Chen, K.; Lin, Z.; Han, J.; Ding, G. Yolov10: Real-time end-to-end object detection. arXiv 2024, arXiv:2405.14458. [Google Scholar] [CrossRef]
- Khanam, R.; Hussain, M. Yolov11: An overview of the key architectural enhancements. arXiv 2024, arXiv:2410.17725. [Google Scholar] [CrossRef]
- Alif, M.A.R.; Hussain, M. Yolov12: A breakdown of the key architectural features. arXiv 2025, arXiv:2502.14740. [Google Scholar] [CrossRef]
- Zhou, F.; Zhang, H.; Zhe, M.; Wen, G.; Pan, H.; Lan, Z.; Zhang, Z. A Power Transmission Line and Its Defect Detection Method Based on Data Enhancement, Augmentation and Neural Network. South. Power Grid Technol. 2022, 16, 131–142. [Google Scholar] [CrossRef]
- Gong, Y.; Liu, G.; Xue, Y.; Li, R.; Meng, L. A survey on dataset quality in machine learning. Inf. Softw. Technol. 2023, 162, 107268. [Google Scholar] [CrossRef]
- Heusel, M.; Ramsauer, H.; Unterthiner, T.; Nessler, B. Gans trained by a two time-scale update rule converge to a local nash equilibrium. In Proceedings of the 30th Conference on Neural Information Processing Systems (NIPS 2017), Long Beach, CA, USA, 4–9 December 2017. [Google Scholar]
- Jocher, G.; Chaurasia, A.; Qiu, J. YOLO by Ultralytics. 2023. Available online: https://github.com/ultralytics/ultralytics (accessed on 27 May 2025).
- Jocher, G.; Nishimura, K.; Mineeva, T.; Vilarino, R. YOLOv5. 2020. Available online: https://github.com/ultralytics/yolov5 (accessed on 26 May 2025).
- Wang, C.-Y.; Bochkovskiy, A.; Liao, H.M. YOLOv7: Trainable Bag-of-Freebies Sets New State-of-the-Art for Real-Time Object Detectors. arXiv 2022, arXiv:2207.0296. [Google Scholar] [CrossRef]
- Lin, T.-Y.; Dollár, P.; Girshick, R.; He, K.; Hariharan, B.; Belongie, S. Feature pyramid networks for object detection. In Proceedings of the Conference on Computer Vision and Pattern Recognition, Honolulu, HI, USA, 21–26 July 2017; IEEE: Honolulu, HI, USA, 2017; pp. 936–944. [Google Scholar] [CrossRef]
- Li, Y.; Li, Q.; Pan, J.; Zhou, Y.; Zhu, H.; Wei, H.; Liu, C. SOD-YOLO: Small-Object-Detection Algorithm Based on Improved YOLOv8 for UAV Images. Remote Sens. 2024, 16, 3057. [Google Scholar] [CrossRef]
- Xiong, Y.; Li, Z.; Chen, Y.; Wang, F.; Zhu, X.; Luo, J.; Wang, W.; Lu, T.; Li, H.; Qiao, Y.; et al. Efficient Deformable ConvNets: Rethinking Dynamic and Sparse Operator for Vision Applications. arXiv 2024, arXiv:2401.06197. [Google Scholar] [CrossRef]
- Wang, W.; Dai, J.; Chen, Z.; Huang, Z.; Li, Z.; Zhu, X.; Hu, X.; Lu, T.; Lu, L.; Li, H.; et al. InternImage: Exploring large-scale vision foundation models with deformable convolutions. In Proceedings of the IEEE/CVF International Conference on Computer Vision, Paris, France, 1–6 October 2023; pp. 14408–14419. [Google Scholar] [CrossRef]
- Ouyang, D.; He, S.; Zhang, G.; Luo, M.; Guo, H.; Zhan, J.; Huang, Z. Efficient Multi-Scale Attention Module with Cross-Spatial Learning. In Proceedings of the IEEE ICASSP, Rhodes Island, Greece, 4–10 June 2023; pp. 1–5. [Google Scholar] [CrossRef]
- Zhang, H.; Zhang, S. Shape-IoU: More Accurate Metric Considering Bounding Box Shape and Scale. arXiv 2023, arXiv:2312.17663. [Google Scholar] [CrossRef]
- Woo, S.; Park, J.; Lee, J.Y.; Kweon, I.S. Cbam: Convolutional block attention module. In Proceedings of the European Conference on Computer Vision (ECCV), Munich, Germany, 8–14 September 2018; pp. 3–19. [Google Scholar] [CrossRef]
- Wang, Q.; Wu, B.; Zhu, P.; Li, P.; Zuo, W.; Hu, Q. ECA-Net: Efficient Channel Attention for Deep Convolutional Neural Networks. In Proceedings of the IEEE/CVF Conference on Computer Vision and Pattern Recognition (CVPR), Seattle, WA, USA, 13–19 June 2020; pp. 11531–11539. [Google Scholar]
- Hu, J.; Shen, L.; Sun, G. Squeeze-and-excitation networks. In Proceedings of the IEEE Conference on Computer Vision and Pattern Recognition, Salt Lake City, UT, USA, 18–22 June 2018. [Google Scholar]
- Zheng, Z.; Wang, P.; Liu, W.; Li, J.; Ye, R.; Ren, D. Distance-IoU Loss: Faster and Better Learning for Bounding Box Regression. In Proceedings of the AAAI Conference on Artificial Intelligence, New York, NY, USA, 7–12 February 2020. [Google Scholar]
- Zhang, Y.; Ren, W.; Liu, W.; Wang, X. Enhanced IoU Loss for Accurate Object Detection. In Proceedings of the IEEE/CVF Conference on Computer Vision and Pattern Recognition, Seattle, WA, USA, 17–21 June 2024. [Google Scholar]
- Du, D.; Zhu, P.; Wen, L.; Bian, X.; Lin, H.; Hu, Q.; Peng, T.; Zheng, J.; Wang, X.; Zhang, Y.; et al. VisDrone-DET2019: The Vision Meets Drone Object Detection in Image Challenge Results. In Proceedings of the IEEE/CVF International Conference on Computer Vision (ICCV) Workshops, Seoul, Republic of Korea, 27 October–2 November 2019. [Google Scholar]
- Zhang, Y.; Chen, X.; Sun, S.; You, H.; Wang, Y.; Lin, J.; Wang, J. Vehicle detection in drone aerial views based on lightweight OSD-YOLOv10. Sci. Rep. 2025, 15, 25155. [Google Scholar] [CrossRef]


Disclaimer/Publisher’s Note: The statements, opinions and data contained in all publications are solely those of the individual author(s) and contributor(s) and not of MDPI and/or the editor(s). MDPI and/or the editor(s) disclaim responsibility for any injury to people or property resulting from any ideas, methods, instructions or products referred to in the content. |
© 2025 by the authors. Licensee MDPI, Basel, Switzerland. This article is an open access article distributed under the terms and conditions of the Creative Commons Attribution (CC BY) license (https://creativecommons.org/licenses/by/4.0/).