Article

Test-Path Scheduling for Interposer-Based 2.5D Integrated Circuits Using an Orthogonal Learning-Based Differential Evolution Algorithm

1
School of Information Science and Engineering, Harbin Institute of Technology, Weihai 264209, China
2
School of Electronics and Information Engineering, Harbin Institute of Technology, Harbin 150001, China
3
School of Computing, Dublin City University, D09 V209 Dublin, Ireland
*
Author to whom correspondence should be addressed.
Mathematics 2025, 13(16), 2679; https://doi.org/10.3390/math13162679
Submission received: 21 July 2025 / Revised: 17 August 2025 / Accepted: 19 August 2025 / Published: 20 August 2025
(This article belongs to the Special Issue Intelligence Optimization Algorithms and Applications)

Abstract

2.5D integrated circuits (ICs), which utilize an interposer to stack multiple dies side by side, represent a promising architecture for improving system performance, integration density, and design flexibility. However, the complex interconnect structures present significant challenges for post-fabrication testing, especially when scheduling test paths under constrained test access mechanisms. This paper addresses the test-path scheduling problem in interposer-based 2.5D ICs, aiming to minimize both total test time and cumulative inter-die interconnect length. We propose an efficient orthogonal learning-based differential evolution algorithm, named OLELS-DE. The algorithm combines the global optimization capability of differential evolution with an orthogonal learning-based search strategy and an elites local search strategy to enhance the convergence and solution quality. Comprehensive experiments are conducted on a set of benchmark instances with varying die counts, and the proposed method is compared against five state-of-the-art metaheuristic algorithms and CPLEX. Experimental results demonstrate that OLELS-DE consistently outperforms the competitors in terms of test cost reduction and convergence reliability, confirming its robustness and effectiveness for complex test scheduling in 2.5D ICs.

1. Introduction

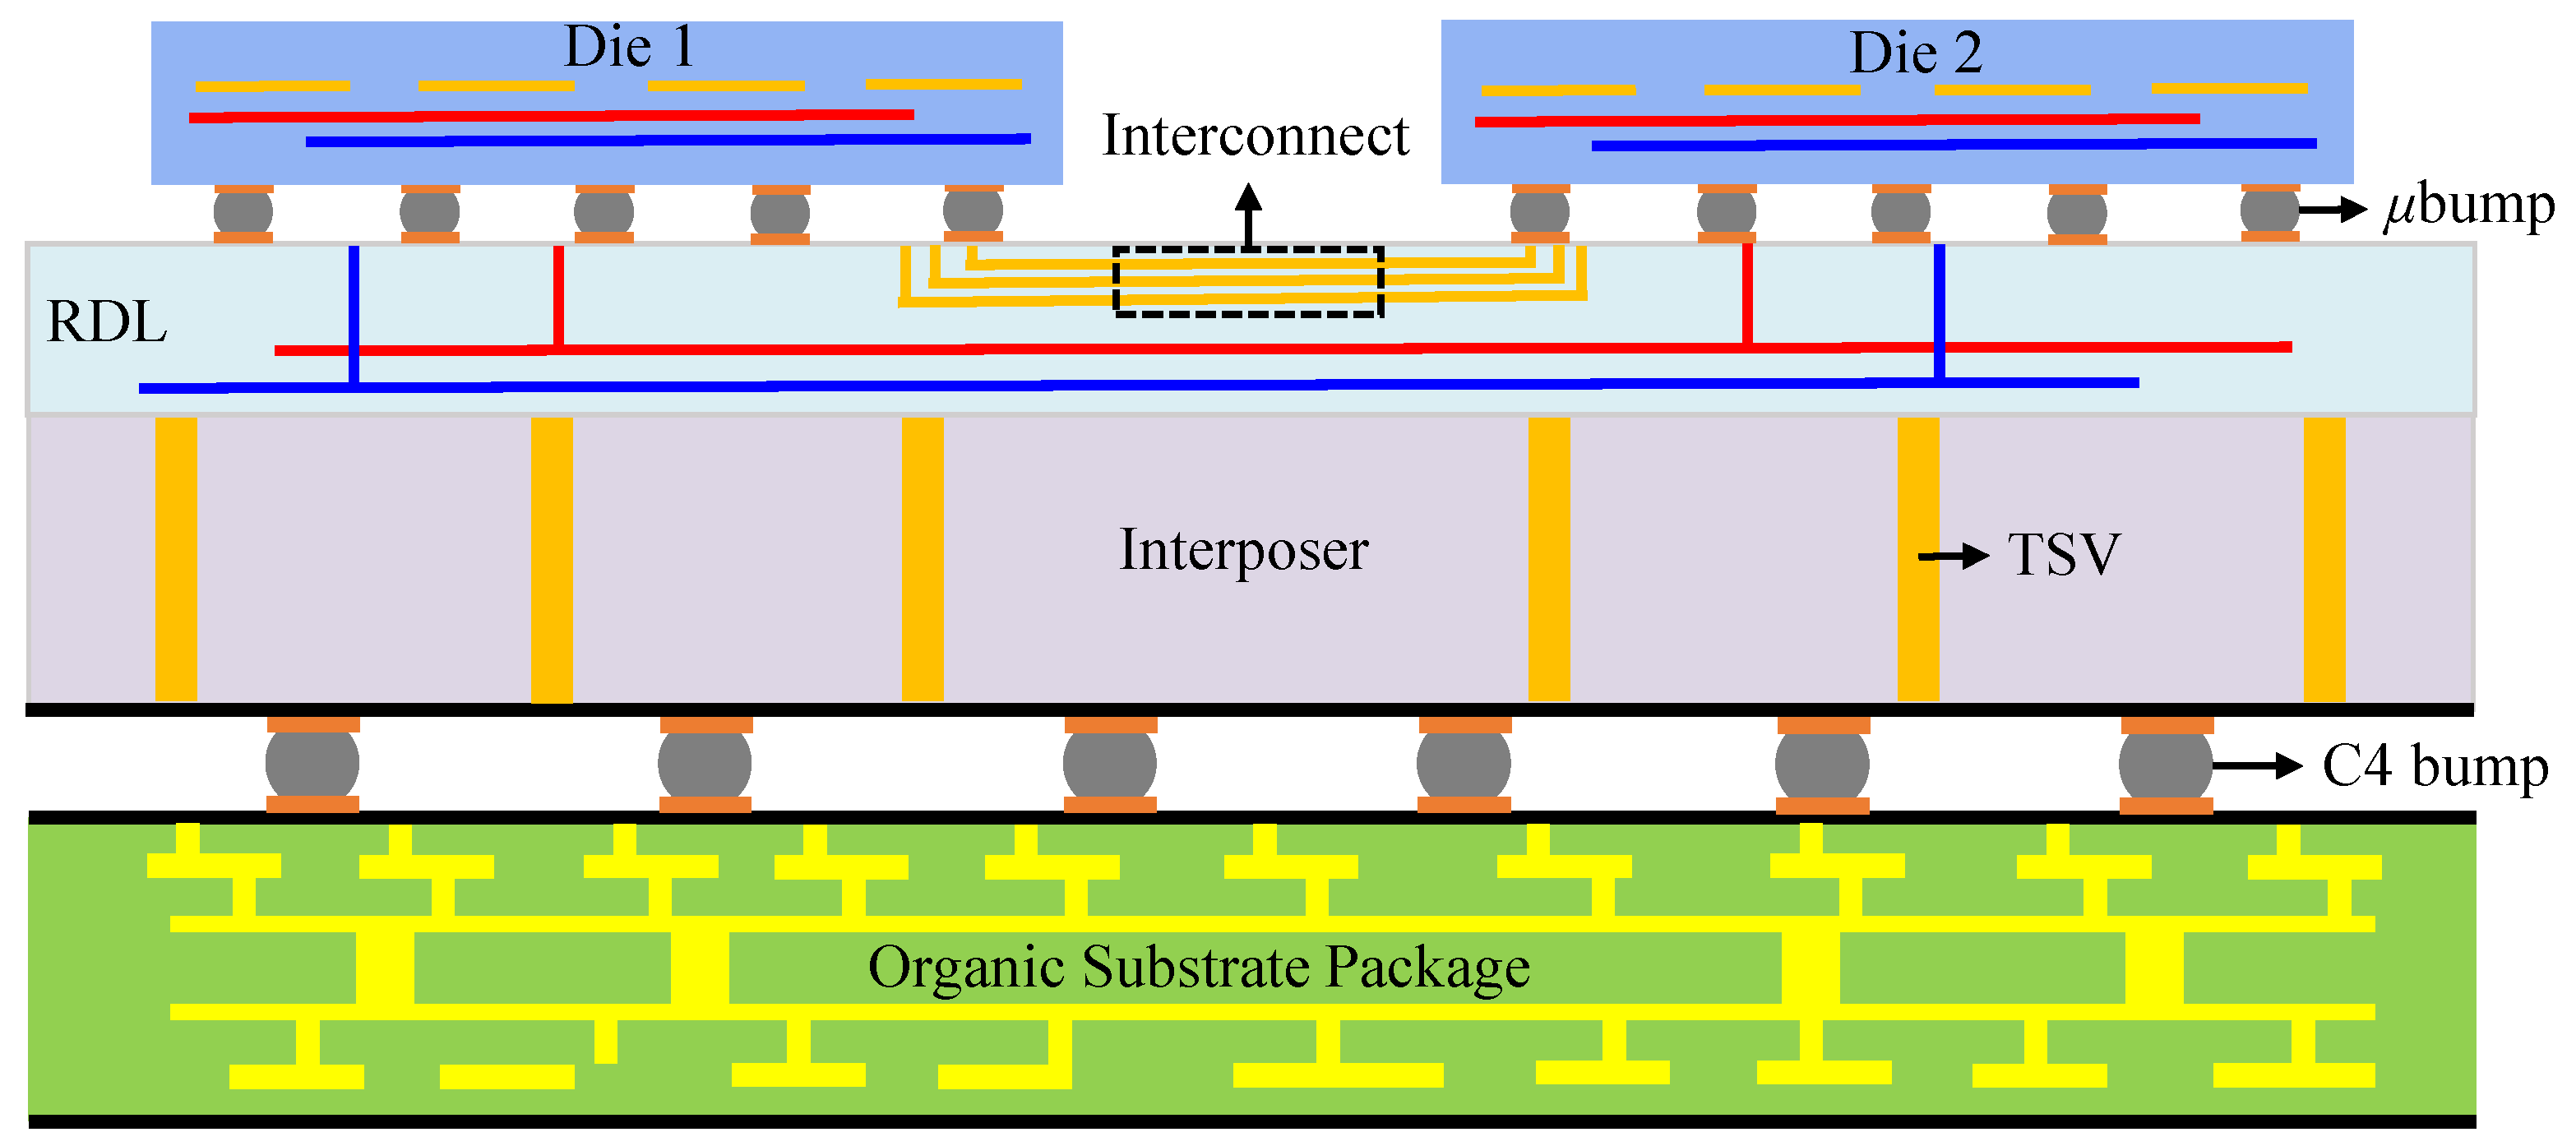
Integrated circuits (ICs) have advanced rapidly over the past half-century, with the number of transistors that can be integrated into a given area growing exponentially. The continuous miniaturization of transistors has reduced the gate delay and effectively decreased the overall area of ICs, thereby lowering both design and manufacturing costs. To meet the growing market demand for high-performance, low-cost, and low-power ICs, the semiconductor industry has increasingly focused on adopting advanced 3-dimensional (3D) integration technologies based on through-silicon vias (TSVs). This approach enables the stacking of circuits and dies with different functions, allowing interconnection between dies and substrates through TSVs. However, the widespread commercial application of 3D ICs remains limited due to unresolved challenges, such as thermal management, yield, and test cost. As a transitional solution, 2.5-dimensional (2.5D) packaging technology based on TSV-enabled passive silicon interposers has garnered significant attention [1]. In 2.5D ICs, multiple active dies are placed side by side on the interposer using micro-bumps ( μ bumps) rather than vertically stacked. An illustration of the general 2.5D IC structure is presented in Figure 1. The interposer acts as a bridging layer that enables communication both between individual dies and between the dies and the package. This communication is established through two types of interconnects. Horizontal interconnects include μ bumps and a redistribution layer (RDL), which is a multilayer metal structure for lateral signal routing. Vertical interconnects consist of μ bumps, TSVs, and C4 bumps, enabling vertical connections from the dies through the interposer to the package substrate. The technology of 2.5D IC offers advantages such as reduced manufacturing complexity and shorter production cycles, and it has been successfully applied to heterogeneous system integration [2,3].
Although advancements in integrated circuit manufacturing have improved performance, larger and more complex systems remain increasingly prone to defects. Thorough testing is therefore necessary to ensure acceptable yield. Defects in interposer interconnects can originate during interposer fabrication, die bonding, or assembly. Common defect types include hard shorts and opens, as well as resistive shorts and opens. These defects can degrade performance by increasing interconnect delay [4]. Interconnects are typically manufactured using mature process technologies. However, variations in fabrication can still cause actual electrical behavior to deviate from design specifications, leading to small-delay defects. Effective defect screening during production is thus essential to ensure interconnect reliability and performance [5].
The primary testing challenge for interposer interconnects of 2.5D ICs lies in the limited accessibility, as standard probe needles can only contact the interposer’s bottom side. To address this, the IEEE 1149.1 standard [6] test-access port (TAP) and boundary-scan architecture are widely used [7]. For example, Wang et al. [8] proposed a boundary-scan structure in which dedicated test loops are established between each pair of C4 bumps. Each loop spans from one C4 bump to another and can be efficiently implemented using scan-chain structures. However, as the number of dies on the interposer increases, the boundary-scan test path becomes excessively long. The time required to shift test patterns through such a path increases sharply, leading to prohibitively high test times. A common solution is to divide the single, lengthy scan path into multiple shorter, parallel paths. This reduces test duration but requires additional TSVs and μ bumps to route extra test access signals. The added interconnects increase test infrastructure costs. Therefore, efficient test path design for high-density 2.5D ICs requires a careful scheduling strategy that balances minimizing test time with controlling manufacturing complexity and cost.
The test scheduling problem of 2.5D ICs is a complex combinatorial optimization problem. It has been proven to be NP-hard [5,7,8]. As test scheduling models become more intricate and the problem scale grows, traditional exact methods—such as integer linear programming (ILP)—often become computationally intractable and fail to produce effective solutions. In contrast, evolutionary algorithms use population-based random search strategies and have shown strong capabilities in solving large-scale combinatorial optimization problems. Among them, the differential evolution (DE) algorithm is valued for its simple structure and robust performance, and it has been successfully applied to many engineering problems [9]. Applying DE to the 2.5D IC test scheduling problem can produce near-optimal scheduling schemes. This reduces test costs and provides an effective way to address the challenges of 2.5D IC test scheduling. Based on these considerations, we propose a new test-path scheduling strategy using an orthogonal learning-based DE algorithm with elites local search mechanism (OLELS-DE). The main contributions of this study can be summarized as follows:
  • An accurate and comprehensive mathematical model is established for the test-path scheduling problem in 2.5D ICs. The model simultaneously considers total test time and cumulative inter-die interconnect length, effectively capturing the trade-off between testing efficiency and interconnect overhead under practical design constraints.
  • Simple yet efficient encoding and decoding schemes are designed to transform the discrete test scheduling problem into a continuous optimization problem. This transformation allows a wide range of continuous meta-heuristic algorithms to be applied, significantly improving flexibility and scalability in solving large-scale scheduling instances.
  • An improved DE variant, termed OLELS-DE, is adopted by integrating an orthogonal learning strategy into the optimization framework of DE. Furthermore, a selective elite learning mechanism is incorporated to enhance the convergence speed and solution quality while preserving global search capabilities.
  • Comprehensive experiments on multiple benchmark instances demonstrate that the proposed method consistently outperforms five state-of-the-art metahueristic algorithms and CPLEX. The results confirm the superiority of OLELS-DE in terms of optimization quality, convergence stability, and adaptability to increasing problem scales.
The remainder of this paper is organized as follows. Section 2 introduces some related works including the test scheduling methods in ICs and the procedure of DE algorithms. Section 3 describes the test scheduling problem studied in this paper and provides its mathematical model; then, this section also presents the designed orthogonal learning-based DE algorithm to solve the test scheduling problem in 2.5D ICs in detail. Section 4 conducts experiments to validate the effectiveness of our proposed optimization method. Finally, Section 5 draws a conclusion of this paper and outlines the future directions.

2. Related Works

2.1. Test Scheduling Methods in ICs

To minimize test cost, it is essential to optimize the scheduling of test sequences in ICs. Early studies mainly focused on bus-based system-on-chip (SoC) architectures. For example, Chakrabarty [10] formulated test scheduling in core-based systems as a multiprocessor scheduling problem. The objective was to minimize test time under given tasks and resource constraints, using a mixed ILP method. Iyengar et al. [11] addressed the joint design of the test access mechanism (TAM) and wrapper optimization for SoCs. They proposed a packing algorithm and a new TAM enumeration method to further reduce core test time. Giri et al. [12] used a genetic algorithm to jointly optimize test scheduling and packaging design in core-based SoCs. They also proposed a locally optimal best-fit bin-packing heuristic to determine core placement and minimize test time. Harmanani and Farah [13] presented a simulated annealing algorithm that integrates wrapper design with TAM-optimized scheduling to reduce SoC test time. Zadegan et al. [14] described test scheduling methods under both session-based and session-free resource and power constraints in the IEEE P1687 environment [15].
With advances in IC manufacturing and the emergence of advanced packaging, research has increasingly turned to the test scheduling challenges of 2.5D and 3D ICs. For example, Noia et al. [16] used ILP to optimize two test architectures for 3D stacked ICs. Chi et al. [17] proposed a multi-access TAM to minimize interconnection cost in 2.5D ICs. Lu et al. [18] studied parallel TAM interconnection methods after 2.5D bonding and developed test designs that significantly reduce test length. Ko and Huang [19] introduced a two-stage memory built-in self-test (BIST) controller scheduling method for 3D IC synthesis, enabling parallel memory testing and reducing both test time and circuit area overhead. Krishnendu Chakrabarty’s team at Duke University has conducted extensive research on 2.5D ICs. In [5,8], they proposed interconnection test solutions for TSVs, RDL, and μ bumps to detect short, open, and delay faults in 2.5D ICs. They also introduced test path design and scheduling techniques to minimize total test cost, including both time and hardware overhead. In [20], they proposed a BIST architecture that can locate defects within chips and inter-chip interconnections, along with a power-aware test scheduling technique to reduce test cost under power constraints. In [21], they presented two ExTest scheduling strategies to handle pin constraints in 2.5D IC testing, enabling interconnection testing among tiles in a SoC. They also proposed optimization schemes and subgroup configurations to minimize testing time. In [22], Wang et al. developed an efficient multicast test architecture to reduce test time while satisfying power and fault coverage constraints, along with a tailored scheduling technique for multicast testing.
Due to the complexity and scale of IC test scheduling, traditional mathematical methods often require substantial computation time. As a result, researchers have explored advanced optimization algorithms. For example, Zhu et al. [23] proposed a metaheuristic algorithm that combines grey wolf optimization with DE. By integrating DE into the grey wolf optimizer to update the Alpha solution, they improved the ability to escape local optima and demonstrated effectiveness on 3D SoC test scheduling problems. Deng et al. [24] introduced an improved DE algorithm for TAM partitioning and test scheduling in SoCs. They incorporated a hybrid mutation mechanism based on probability estimation operators, significantly enhancing parallel testing and reducing test time. SenGupta et al. [25] addressed test cost minimization for both non-stacked and stacked core-based ICs under power constraints, proposing an algorithm comparable to simulated annealing. Chandrasekaran et al. [26] tested and optimized benchmark circuits with varying TAM widths using multiple intelligent optimization algorithms. Their results showed that an enhanced artificial bee colony algorithm outperformed other methods. Deng et al. [27] proposed an enhanced DE algorithm with dynamic subpopulations and adaptive search strategies to balance scan chain design for test encapsulation and solve the 2.5D IC test scheduling problem. Li et al. [28] developed a constrained multi-objective coevolutionary algorithm for the test-chain scheduling problem, aiming to optimize hardware cost and test time simultaneously. Yang et al. [29] proposed a constrained multi-objective evolutionary algorithm to optimize the BIST test chain configurations in 2.5D ICs.

2.2. Differential Evolution

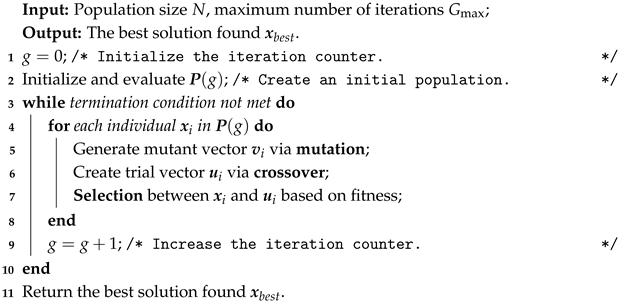
DE is a simple yet powerful evolutionary algorithm introduced by Storn and Price [30] for global optimization. It consists of four main components: initialization, mutation, crossover, and selection. The general procedure of DE is presented in Algorithm 1.
Algorithm 1: Differential evolution algorithm
Mathematics 13 02679 i001
Initialization: The population consists of N individuals x i 0 R D , initialized randomly within the bounds of the search space:
x i , j 0 = L j + rand ( 0 , 1 ) · ( U j L j ) , i = 1 , , N ; j = 1 , , D
where D is the problem dimension, and L j and U j are the lower and upper bounds for the j-th dimension, respectively.
Mutation: For each target vector x i g , a mutant vector v i g is generated by the commonly used DE/rand/1 strategy as follows:
v i g = x r 1 g + F · ( x r 2 g x r 3 g )
where r 1 , r 2 , r 3 { 1 , , N } are distinct and different from i, and F [ 0 , 2 ] is a scaling factor. Another common mutation strategy is DE/best/1, which generates the mutant vector as follows:
v i g = x b e s t g + F · ( x r 1 g x r 2 g )
where x b e s t g represents the best solution in the current population with the best fitness value.
Crossover: A trial vector u i g is created by combining the target and mutant vectors:
u i , j g = v i , j g if rand ( 0 , 1 ) < C R or j = j rand x i , j g otherwise
where C R [ 0 , 1 ] is the crossover rate, and j rand ensures at least one component comes from v i g .
Selection: The population for the next generation is determined by greedy selection:
x i g + 1 = u i g if f ( u i g ) f ( x i g ) x i g otherwise
These steps are iteratively executed until the termination criterion is met, and the best solution obtained during the process is returned.

2.3. Orthogonal Learning-Based Differential Evolution

In recent years, researchers have explored the integration of effective learning models from mathematics, machine learning, and related fields to improve the performance of DE. Notable examples include orthogonal learning [31,32,33], opposition-based learning [9,34,35], and Q-learning [36,37,38]. These approaches demonstrate that incorporating learning strategies can help DE more intelligently identify promising information during the evolutionary process. Among them, orthogonal learning—originating from the orthogonal experimental design methodology—stands out for its strong capabilities in efficient testing and predictive analysis. In our recent work, we proposed an enhanced DE variant, named OLELS-DE [39], which integrates the orthogonal learning mechanism with an elite local search strategy. The effectiveness of OLELS-DE has been validated on a range of complex optimization problems. In this study, we will adopt OLELS-DE to address the test-path scheduling problem in 2.5D ICs. A brief overview of its execution procedure is provided in this part.
OLELS-DE is built upon the well-known DE variant JADE [40], which introduces an external archive-based mutation strategy known as DE/current-to-pbest/1. This strategy generates mutant solutions according to the following formulation:
v i g = x i g + F · ( x p b e s t g x i g ) + F · ( x r 1 g x ˜ r 2 g )
The vector x p b e s t g is randomly selected from the top 100 p % of solutions in the current population P , where p ( 0 , 1 ) defines the size of the elite group. To enhance diversity, JADE incorporates an external archive A , which stores parent solutions that are outperformed by their offspring during the selection process. In the mutation operator, x r 1 g is a randomly selected individual from the current population P , while x ˜ r 2 g is drawn from the union of the population and the archive, i.e., P A . The greediness of this operator is regulated by the parameter p, which is typically set to 0.05 in JADE by default.
In OLELS-DE, the number of consecutive iterations during which the current best solution remains unchanged by the mutation operator is tracked by a counter parameter, denoted as T. When this value reaches the predefined threshold T max , the population is considered to have lost its vitality, indicating a risk of stagnation or premature convergence. To empirically distinguish between these two scenarios based on the population distribution, a population diversity estimation mechanism based on the Euclidean distance is employed as follows:
d i v = x b e s t x m i d 0.5 j = 1 D ( U j L j ) 2
where x b e s t and x m i d denote the current best individual and the median-ranking individual in the population, respectively. To perform the orthogonal learning mechanism, two solutions, denoted as x s 1 and x s 2 , are selected to undergo the orthogonal experimental design process, resulting in the generation of an orthogonal solution x o :
x o = x s 1 x s 2
If div > 0.5 , the population is likely distributed across diverse regions of the search space, indicating that diversity is still maintained and the algorithm may be facing a stagnation issue. In this case, x s 1 = x b e s t and x s 2 = x p b e s t are selected to make the orthogonal learning process more exploitative. Otherwise, the population is likely trapped in a local region, indicating premature convergence. Under such circumstances, x s 1 = x p b e s t 1 and x s 2 = x p b e s t 2 are used in the orthogonal learning to enhance exploration.
To fully leverage the information obtained from orthogonal learning, not only is the orthogonal solution x o preserved, but all the combined vectors generated according to the orthogonal array are also retained. These vectors form a combined group denoted as P c = ( x c 1 , , x c m ) , where m is the number of combinations. To further enhance the diversity of component-wise values, a disturbance mechanism is introduced to generate a perturbed group P c = ( x c 1 , , x c m ) . The disturbance model is defined as follows:
x c i = N ( x c i , σ i ) + 0.1 · ( r 1 · x s 1 r 2 · x c i ) , i = 1 , , m
Here, r 1 and r 2 are two independent random variables uniformly distributed in the interval ( 0 , 1 ) , and σ i denotes the standard deviation of the Gaussian distribution used for sampling. The value of σ i is calculated as:
σ i = x s 1 x c i max _ dist , i = 1 , , m
where m a x _ d i s t represents the maximum Euclidean distance between any two individuals within the group P c .
After the application of the orthogonal learning mechanism, if the best solution still fails to improve, a local search mechanism based on elite solutions is employed to further exploit valuable search information. Specifically, a subset of E p elite individuals with superior fitness values is selected to perform a Gaussian-based local search in their vicinity, defined as:
x i , j = N ( x i , j , σ ) , i = 1 , , E p ; j = 1 , , D
Here, σ denotes the standard deviation of the Gaussian distribution and is set to a constant value of 0.1. The number of elite solutions E p decreases linearly over iterations, from an initial value of N / 10 down to 3, in order to balance exploration and exploitation throughout the search process.

3. Proposed Method

3.1. Problem Description

The integration of multiple dies onto the passive silicon interposer, a hallmark of 2.5D IC technology, has achieved significant progress. Researchers are actively exploring both the feasibility and the challenges of stacking an increasing number of dies [41]. However, the number of possible test-path configurations grows exponentially with the number of dies. As shown in [20], the number of possible configurations N c for N d dies can be calculated using the following recursive equation:
N c ( N d ) = i = 1 N d N d 1 i 1 · i ! · N c ( N d i )
Based on this formulation, the total number of possible test-path configurations for 12 dies is 12,470,162,233. Using a single long test path usually leads to excessive test time. In contrast, multiple short test paths can greatly reduce test time but increase hardware overhead. Therefore, efficient optimization techniques are needed to find configurations that balance test time and hardware cost.
In this study, we focus on the boundary-scan architecture proposed in [8]. In this architecture, scan paths are divided into scan-in and scan-out paths. A test path with one or more scan-in chains is called an input test access mechanism (in-TAM). A path with one or more scan-out chains is called an output TAM (out-TAM). The optimization problem is defined as follows. Given a 2.5D IC with N d dies, let c a be the cost on the automatic test equipment (ATE) per unit length, i.e., per boundary scan cell. Let c b 1 be the cost of fabricating an additional in-TAM, and c b 2 be the cost of fabricating an additional out-TAM. The goal is to determine a test-path configuration and scheduling strategy that minimizes the total test cost C. The cost C includes both test application time and area overhead, capturing the trade-off between performance and hardware resource usage.

3.2. Mathematical Model

The variables used in the mathematical model are summarized in Table 1.
To formulate the model, we first define two integer decision variables: N p and N q , representing the number of in-TAMs and out-TAMs, respectively. These two variables are subject to the following constraints:
N p N d , N q N d
where N d denotes the total number of dies on the interposer. These constraints reflect the architectural limitations: each die provides at most one TDI and one TDO port, thus bounding the number of available in-TAMs and out-TAMs by the number of dies.
Next, we introduce two binary decision variables, y i , j and z i , k , which are used to determine the allocation of scan chains for each die. Specifically, y i , j = 1 if the scan-in chain of die i is assigned to in-TAM j, and 0 otherwise. Similarly, z i , k = 1 if the scan-out chain of die i is assigned to out-TAM k, and 0 otherwise. These variables are subject to the following constraints:
j = 1 N p y i , j = 1 , k = 1 N q z i , k = 1 , 1 i N d
i = 1 N d y i , j 1 , i = 1 N d z i , k 1 , 1 j N p , 1 k N q
Constraint (14) ensures that each die is connected to exactly one in-TAM and one out-TAM. Constraint (15) guarantees that every in-TAM and out-TAM is associated with at least one die on the interposer.
Then, we define two variables, L i n and L o u t , to represent the lengths of the longest test paths among all in-TAMs and out-TAMs, respectively. These values are computed using the following expressions:
L i n = max 1 j N p i = 1 N d y i , j · I i
L o u t = max 1 k N q i = 1 N d z i , k · O i
Here, I i and O i denote the number of μ bumps connected to the input and output ports of die i, respectively.
Furthermore, we take into account the ordering of dies within each in-TAM and out-TAM. The sequence in which dies are arranged significantly influences the routing complexity. If the dies are ordered arbitrarily, it can result in longer test wire lengths. It is important to distinguish between “test wire length” and “test length”. Specifically, test wire length refers to the physical routing length of a test path, while test length denotes the number of boundary scan cells in that path. Although the test length remains unaffected by the routing, excessively long test wires may introduce timing issues, degrade the test quality, and increase the routing congestion. The binary variable e i , h is introduced to represent the ordering of dies within in-TAMs and out-TAMs. Specifically, e i , h = 1 indicates that die h is directly placed after die i within the same in-TAM or out-TAM; otherwise, e i , h = 0 . The following constraints are applied to enforce a valid ordering:
e i , i = 0 , 1 i N d
e i , h + e h , i 1 , 1 i , h N d
h = 1 N d e i , h = 1 , 1 i N d
i = 1 N d e i , h = 1 , 1 h N d
Constraint (18) ensures that a die cannot be positioned directly after itself. Constraint (19) guarantees that the ordering between any two dies is unidirectional—if die h is directly behind die i, then die i cannot be directly behind die h. Constraints (20) and (21) enforce that each die has exactly one direct successor and one direct predecessor within the sequence.
We define two variables, W L i n and W L o u t , to denote the maximum test wire length among all in-TAMs and out-TAMs, respectively. The physical distance between die i and die j is denoted as d i , j . For a given in-TAM or out-TAM, the total test wire length is computed as the sum of the distances between all consecutive dies in that TAM. The values of W L i n and W L o u t are calculated as follows:
W L i n = max 1 j N p i = 1 N d h = 1 N d d i , h · e i , h · y i , j
W L o u t = max 1 k N q i = 1 N d h = 1 N d d i , h · e i , h · z i , k
In both equations, the inner summation h = 1 N d d i , h · e i , h captures the distance between die i and its direct successor die.
With the variables defined above, the total test cost C can be calculated as follows:
C = c a · max ( L i n , L o u t ) + c b 1 · N p + c b 2 · N q
The cost parameters c a , c b 1 , and c b 2 are defined as follows:
c a = c A T E f · 2 · log 2 ( N t + 2 ) + 1
c b 1 = a r e a T S V · c i n t e r p o s e r + a r e a μ b u m p · c d i e
c b 2 = a r e a T S V · c i n t e r p o s e r
Here, c A T E denotes the tester usage cost per second and f is the test frequency. N t represents the total number of interconnects being tested. The parameters a r e a T S V and a r e a μ b u m p represent the physical area of a TSV and a μ bump, respectively. c i n t e r p o s e r and c d i e refer to the cost per unit area of the interposer and die, respectively.
The optimization objective is to minimize the total test cost C. If multiple test-path configurations produce the same test cost, the one with the smaller maximum test wire length, i.e., max ( W L i n , W L o u t ) , is preferred due to its potential benefits in routing complexity and signal quality.

3.3. Encoding and Decoding Schemes

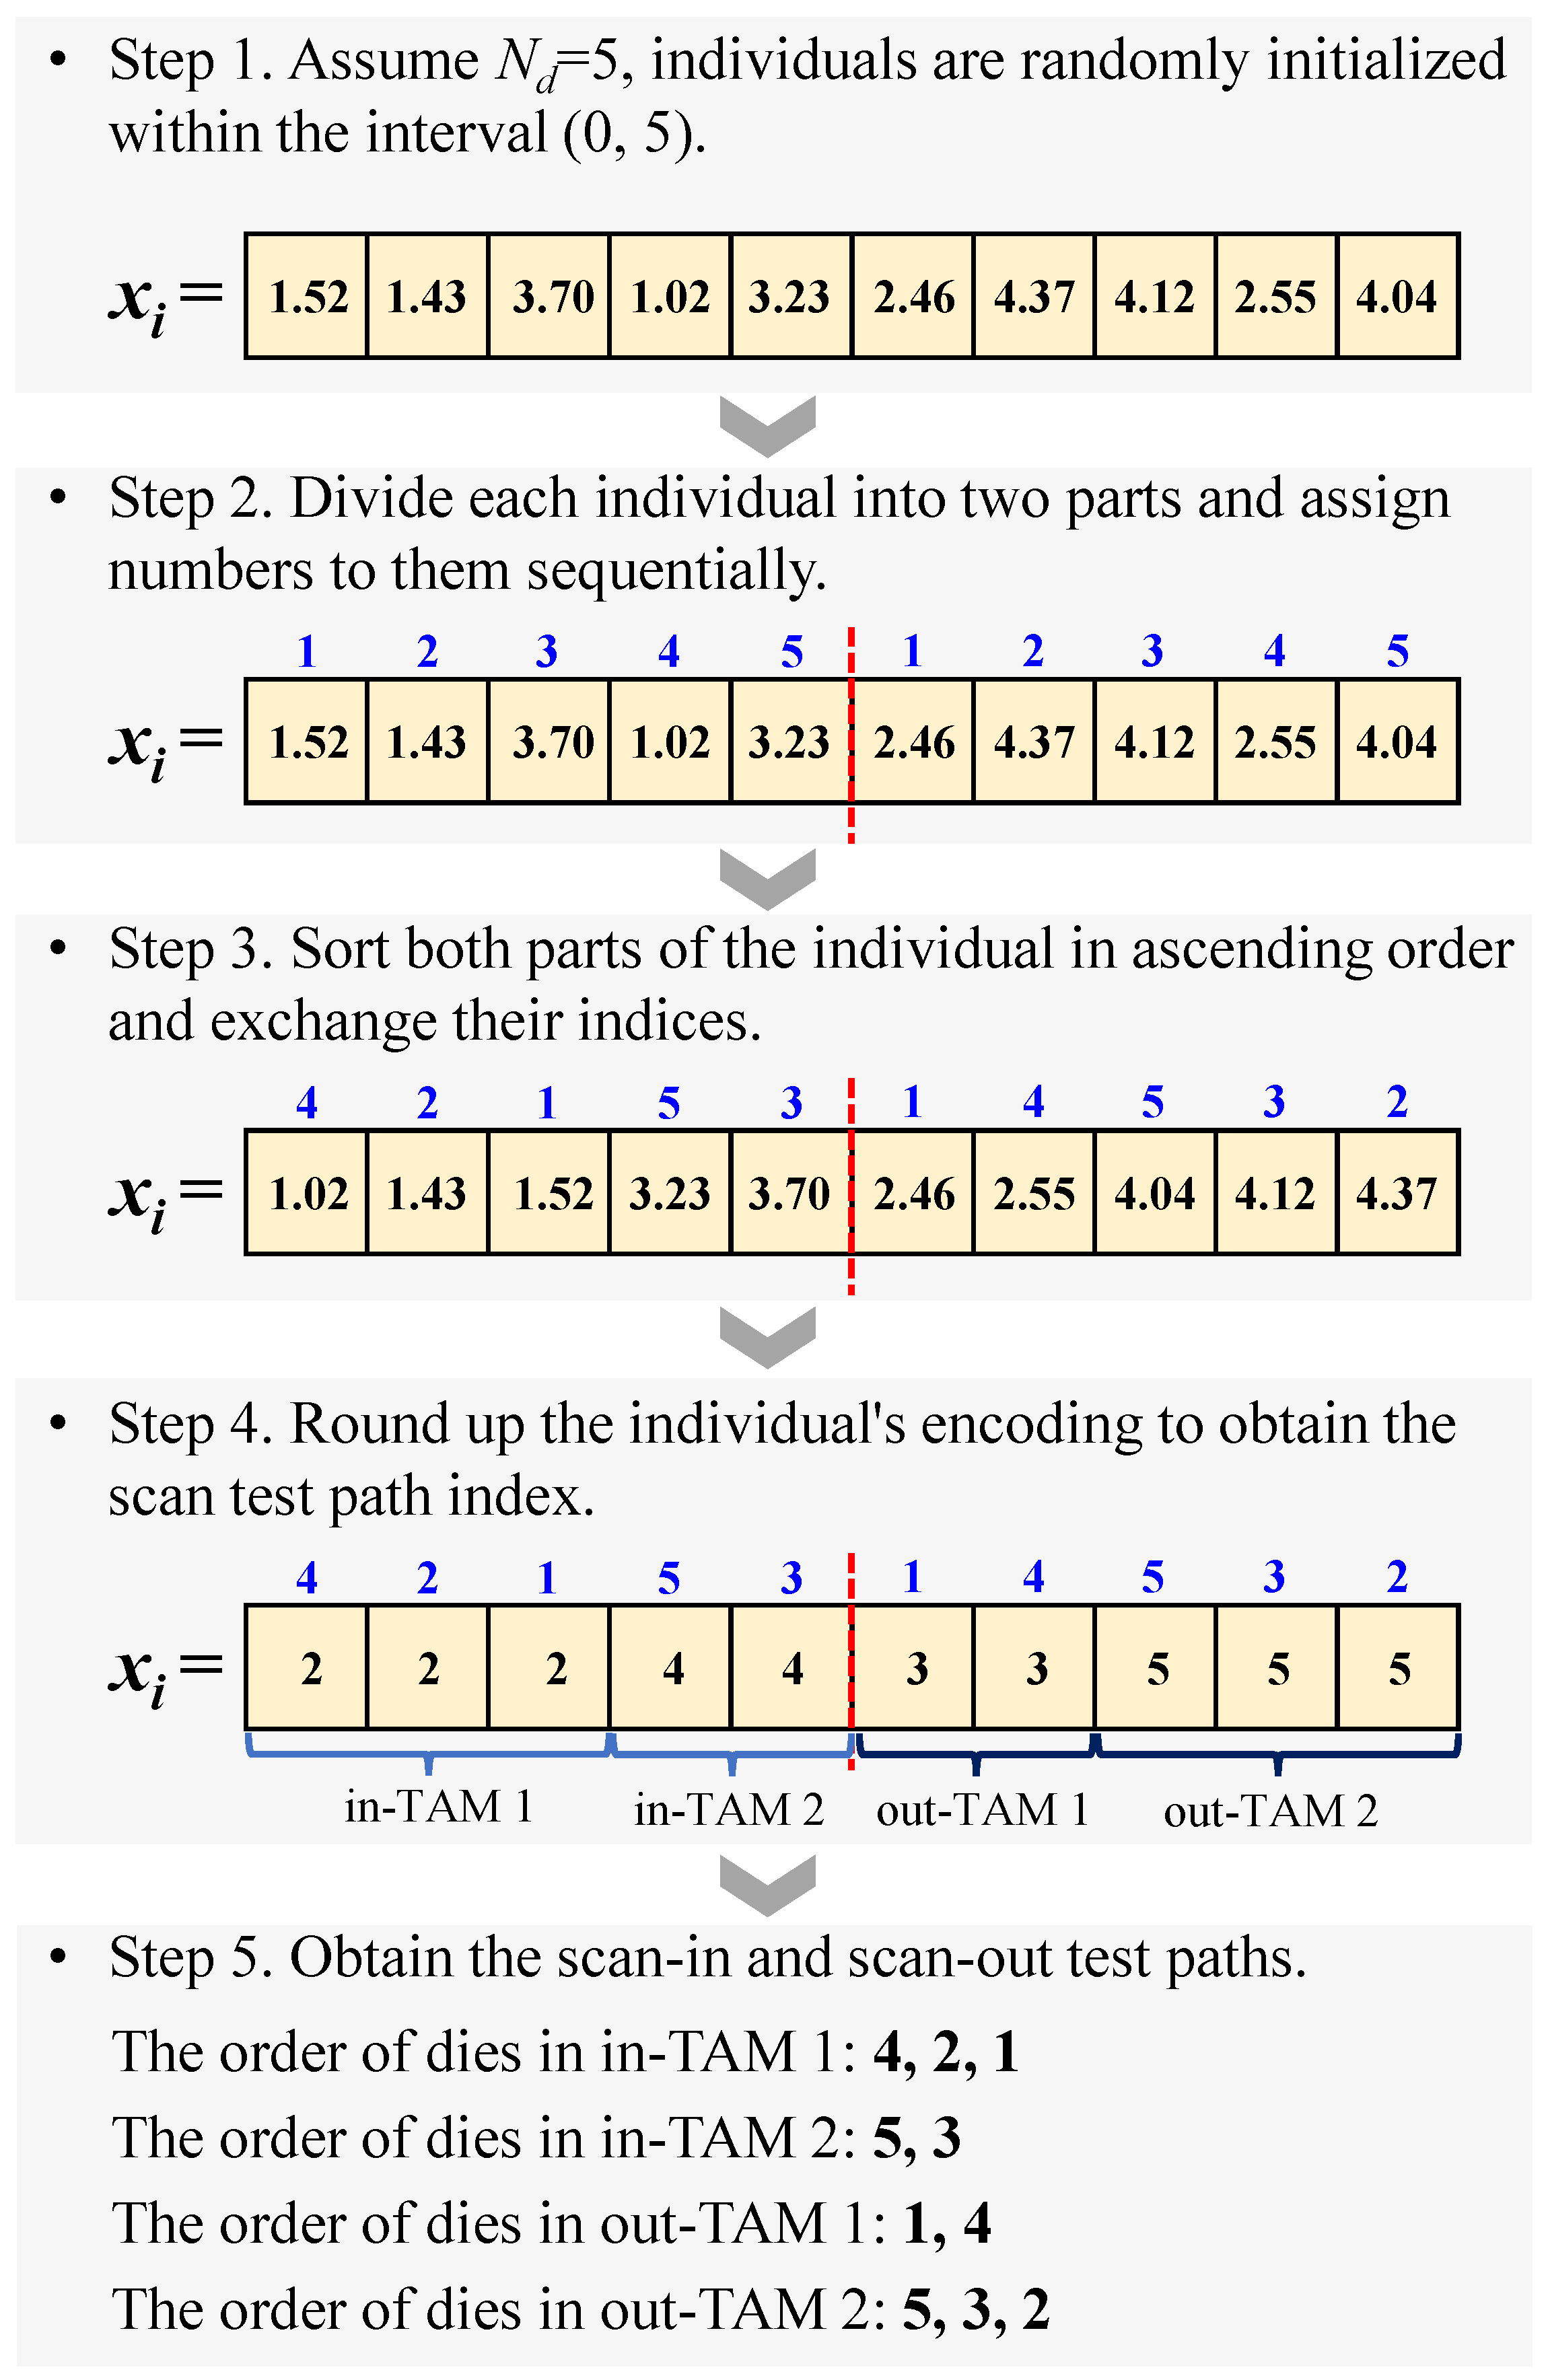
As introduced in Section 2.3, the population in OLELS-DE is represented using real-valued encoding. Therefore, specialized encoding and decoding schemes are needed to apply OLELS-DE to the test-path scheduling problem in 2.5D ICs. To address this, we have designed simple yet effective encoding and decoding mechanisms tailored for this context. An example illustrating these schemes is shown in Figure 2.
During encoding, each individual in the population represents a scheduling solution. For N d dies on the interposer, each individual is encoded as a 2 N d -dimensional vector. Each entry is initialized as a random real number within the range ( 0 , N d ) . The vector is then divided into two parts, each assigned sequential numbers. One part corresponds to the scan-in chains, and the other to the scan-out chains.
To evaluate solutions, a decoding method is applied corresponding to the encoding scheme. Each part of the vector is sorted in ascending order, and their assigned numbers are exchanged accordingly. Then, each dimension’s value is rounded up. Identical values indicate dies assigned to the same scan chain. For each group of equal values, the corresponding die identifiers are extracted to determine the test sequence within that scan chain. This procedure yields the interconnect test scheduling results.
Based on the derived test scheduling results, key parameters such as the number of in-TAMs ( N p ), the number of out-TAMs ( N q ), and the lengths of the longest scan-in and scan-out test paths ( L i n and L o u t , respectively) can be accurately determined. These parameters are further utilized to compute the total test cost associated with the specific test scheduling solution.

3.4. Scheduling with OLELS-DE

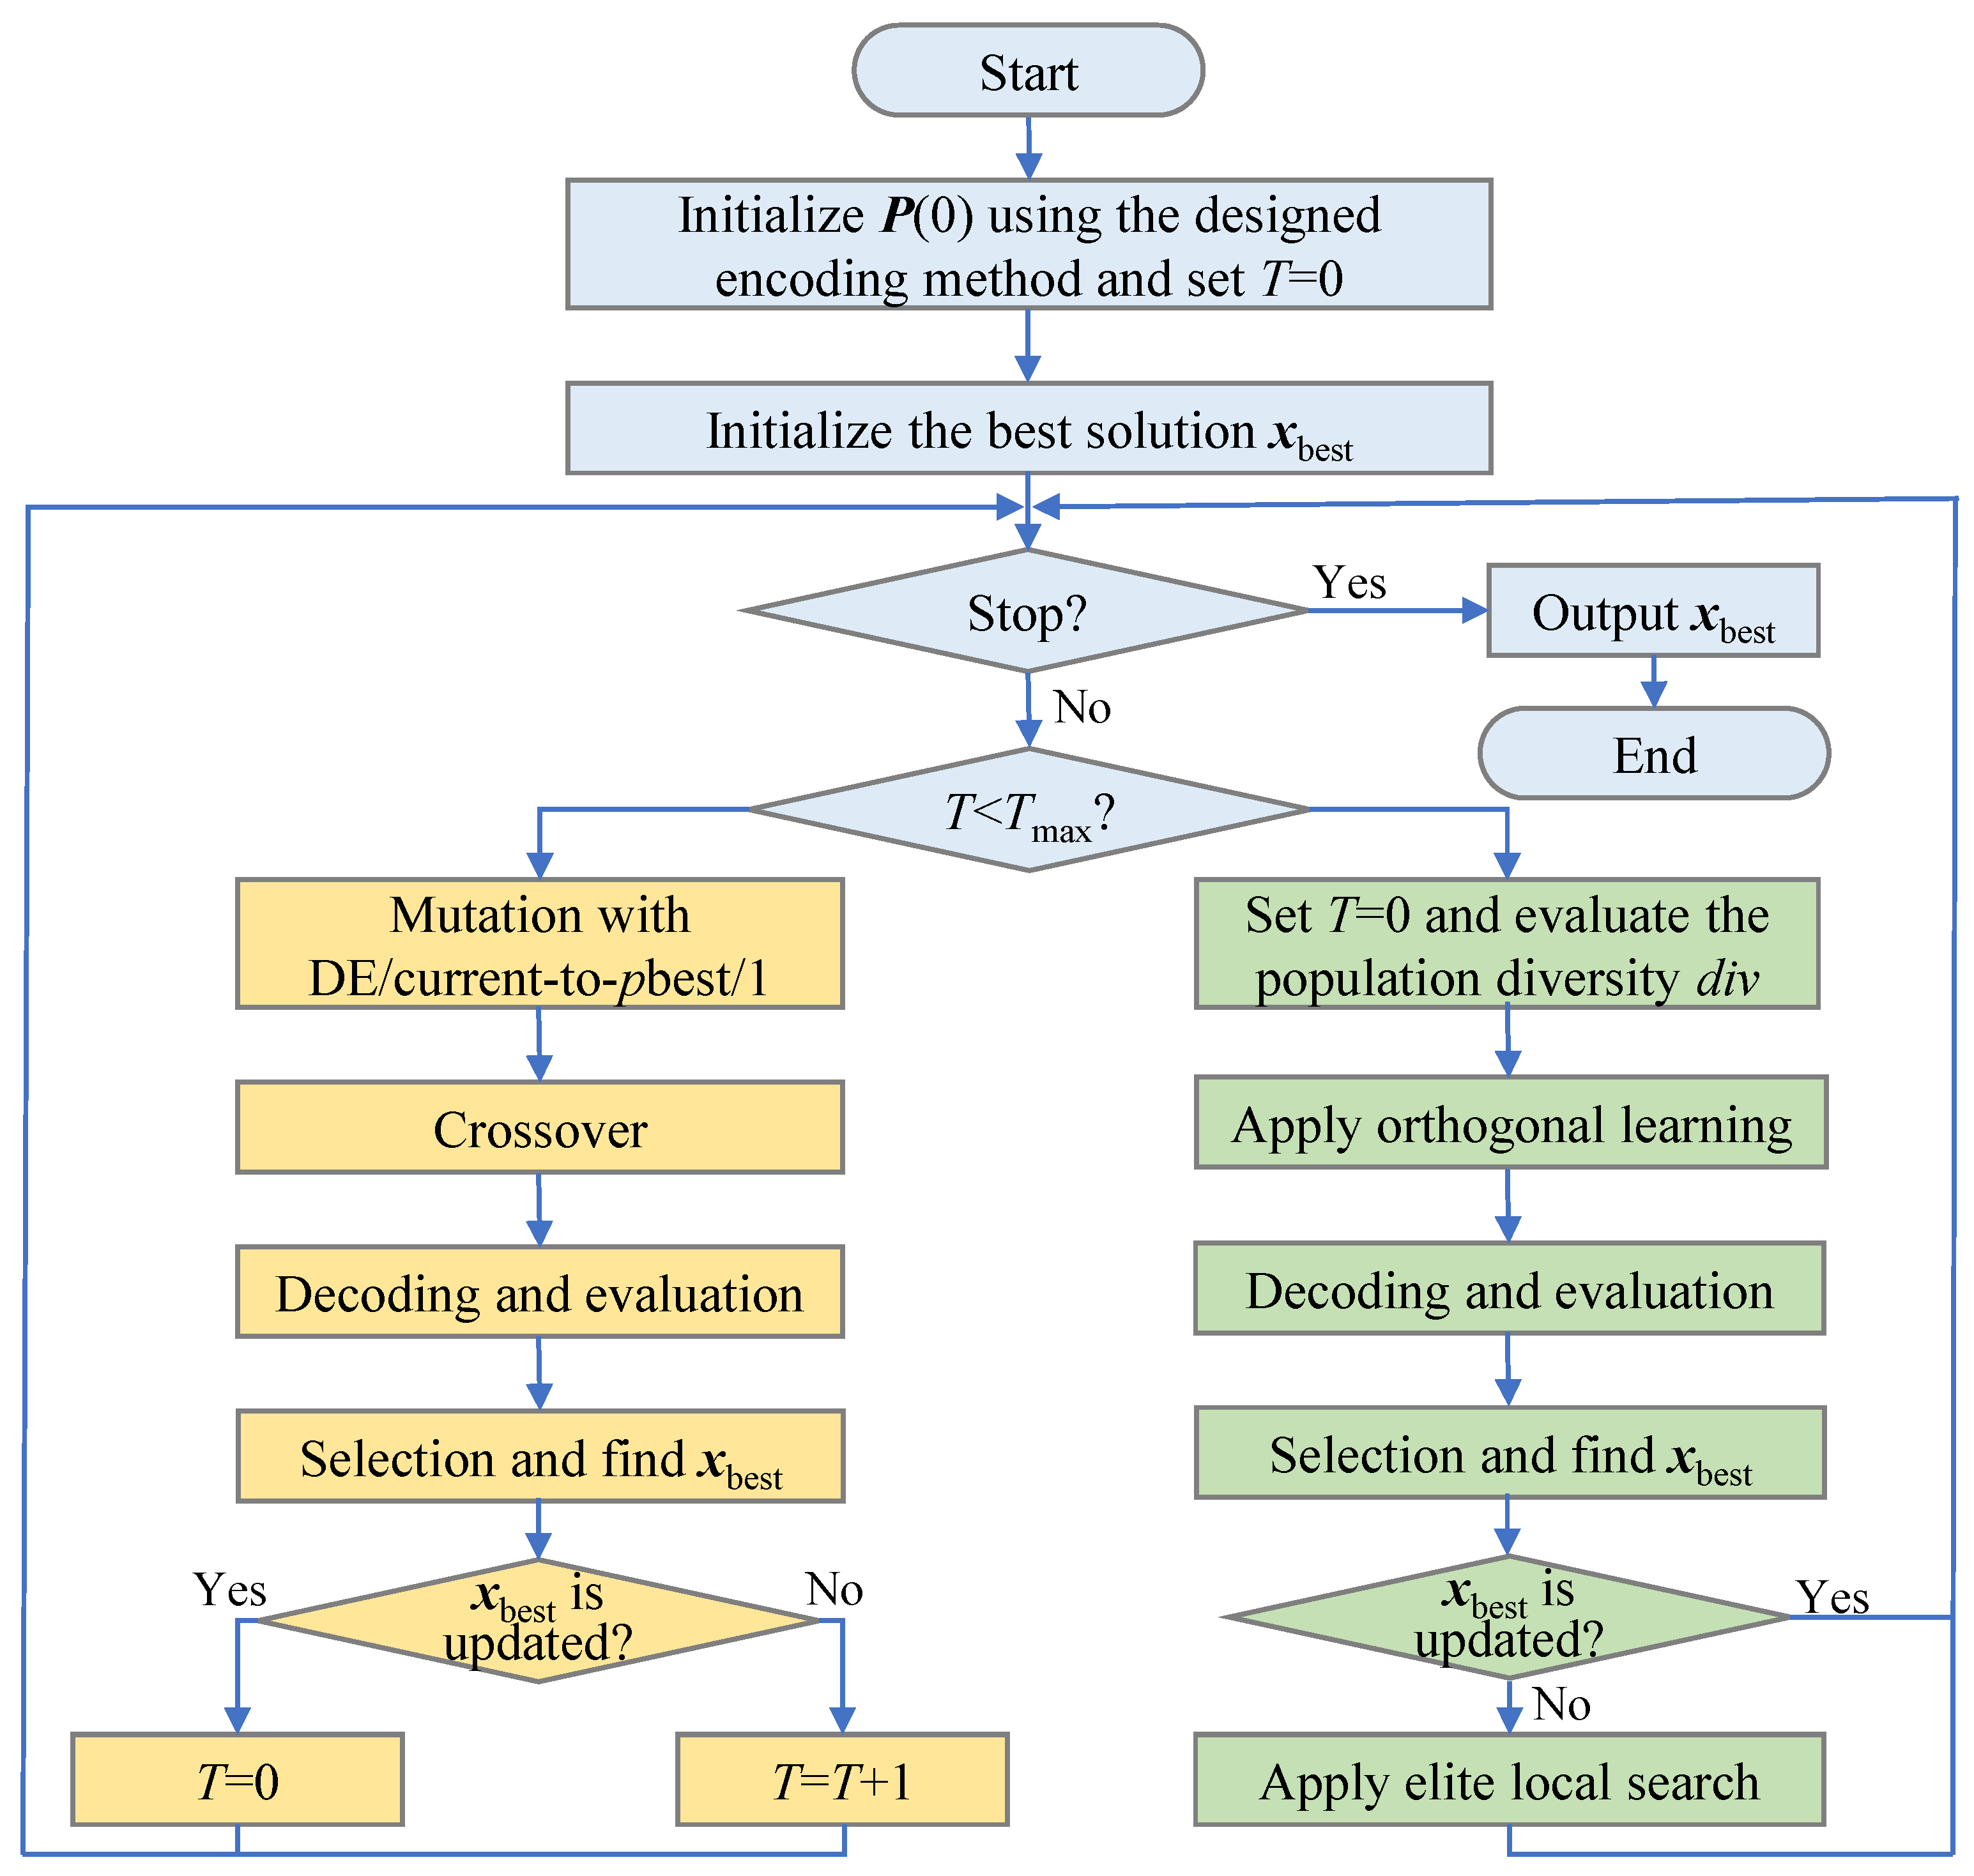
By employing the proposed encoding and decoding schemes, OLELS-DE can effectively address the test-path scheduling problem in 2.5D ICs. The flowchart illustrating this process is shown in Figure 3, and the detailed scheduling procedure is provided in Algorithm 2.
The main objective of this algorithm is to minimize the overall test cost while considering the routing complexity represented by the maximum test wire length. The algorithm begins by initializing the generation counter g = 0 and counter parameter T = 0 . An initial population P ( 0 ) consisting of N individuals is randomly generated using a specifically designed encoding scheme. After the initialization, each individual is decoded to derive its corresponding scheduling solution. The test cost and maximum wire length of each solution are evaluated, and the best individual in terms of test cost is recorded as x b e s t . The algorithm then enters the iterative optimization process.
Algorithm 2: Test scheduling with OLELS-DE
Mathematics 13 02679 i002
During each generation, if the counter T is less than the predefined threshold T max , the population is evolved using DE/current-to-pbest/1 mutation strategy. For each individual x i in the population, a mutant vector v i is generated. Through the crossover operation, a trial vector u i is created and decoded into a scheduling solution. The fitness of the trial vector is evaluated by calculating the associated test cost and maximum wire length. The selection operation is then performed between the original individual and the trial vector, and the one with better performance (lower cost or shorter wire length if cost is equal) is retained for the next generation. The best individual in the current population is updated accordingly, and the counter T is increased if no improvement is observed.
Once the stagnation threshold T max is reached, the algorithm invokes the orthogonal learning mechanism to enhance exploration. The population diversity is first evaluated. If the diversity is sufficiently high, the global best individual and a randomly selected p-best individual are used to construct a new candidate through orthogonal learning. Otherwise, two p-best individuals are selected to encourage broader search. The orthogonal learning mechanism generates a new solution x o along with a set of auxiliary combined solutions P c . These individuals are decoded and evaluated similarly. The current population is then updated by selecting the best N individuals from the union of the original population, the orthogonal solution, and the combined population. If no improvement in x b e s t is observed after the orthogonal learning phase, the algorithm activates a local search mechanism around the elite solutions to escape potential local optima. This elite local search performs fine-grained perturbations on elite solutions and replaces it if a better solution is found. This iterative process continues until the stopping criterion is satisfied. Finally, the best scheduling solution x b e s t and its associated test cost C are returned as the output of the algorithm.

4. Experimental Validation

In this section, we present a series of experiments to evaluate the effectiveness of the proposed optimization method for solving the test-path scheduling problem in 2.5D ICs. We begin by describing the experimental setup. Subsequently, small-scale experiments are performed to validate the accuracy of the formulated mathematical model and the effectiveness of the proposed optimization algorithm. Then, large-scale experiments are conducted to assess the performance of OLELS-DE through comprehensive comparative analysis with other state-of-the-art optimization methods. Finally, experiments are performed to analyze the sensitivity of the proposed algorithm to several critical parameters.

4.1. Experimental Setup

4.1.1. Instance Data

In the experiments, we consider a 2.5D IC design constructed using the ITC’02 SoC test benchmark [42], which includes 12 dies (labeled die 1 to die 12), as well as another 2.5D IC design from [43], comprising additional 12 dies (labeled die 13 to die 24). The number of I/O ports for each die is detailed in Table 2. These test cases, representing both current and emerging 2.5D IC technologies, provide a comprehensive platform for assessing testing methodologies. The results can effectively demonstrate the efficacy and scalability of different test-path scheduling approach for complex, multi-die architectures.
We assume that a production volume of 100,000 2.5D ICs, meaning that 100,000 chips are tested. According to the data reported in [42], the area of a typical μ bump ( a r e a μ b u m p ) is set to 1600 μm2, based on a μ bump pitch of 40 μm. The area of a typical TSV ( a r e a T S V ) is set to 10,000 μm2, assuming a TSV pitch of 100 μm. The test frequency (f) is fixed at 10 MHz. The cost-related parameters are set as follows: the cost of the interposer per unit area ( c i n t e r p o s e r ) is $1.4 × 10 9 /μm2, the cost of the die per unit area ( c d i e ) is $4.24 × 10 8 /μm2, and the tester usage cost ( c A T E ) is set to $0.028 per second.

4.1.2. Compared Methods

To comprehensively evaluate the performance of the proposed OLELS-DE algorithm, we compare it with six representative optimization methods: JADE [40], EFDE [44], MGDE [45], WOA [46], HHO [47], and CPLEX [48]. Among them, JADE, EFDE, and MGDE are three DE variants. Specifically, JADE serves as the baseline for OLELS-DE; EFDE integrates an efficient fitness-based dynamic mutation strategy with adaptive control parameters; and MGDE adopts a multi-individual guidance mechanism while evolving control parameters over time based on feedback information. WOA (Whale Optimization Algorithm) and HHO (Harris Hawks Optimization) are two swarm intelligence-based approaches: WOA is inspired by the bubble-net hunting strategy of humpback whales, whereas HHO models the cooperative hunting behavior of Harris’ hawks. Finally, CPLEX, a mathematical optimization solver developed by IBM, is employed in the experiments to solve the mathematical model described in Section 3.2 and to provide reference values for the scheduling solutions.
Unless otherwise specified, all parameters for the compared algorithms are configured according to their original publications. The population size N is uniformly set to 100 for the adopted three DE variants and two swarm intelligence-based algorithms. The maximum number of iterations G max is set to 500 for small-scale experiments in Section 4.2 and 2000 for large-scale experiments in Section 4.3. These algorithms terminate upon reaching the iteration limit G max or the maximum allowed CPU runtime. For OLELS-DE, the threshold parameter T max is set to 50. A sensitivity analysis of OLELS-DE with respect to N and T max will be presented in Section 4.4.

4.1.3. Evaluation Metrics

Since the DE variants and swarm intelligence-based algorithms adopted in this study are stochastic metaheuristic methods, each algorithm is independently executed 20 times on each test instance to ensure statistical robustness and reliability. In contrast, CPLEX, as an exact mathematical optimization solver, is executed only once per instance. To facilitate a fair and comprehensive comparison among different methods, the following evaluation metrics are employed:
  • Test cost values: For each algorithm, the best, worst, and mean test cost values obtained over multiple runs are reported. This metric directly reflects the optimization quality in terms of the primary objective—minimizing the overall testing cost. Reporting the best, worst, and mean values can assess not only the optimal performance but also the stability and consistency of each optimization method.
  • CPU runtime: The computational time required for each algorithm to complete the predetermined number of iterations is recorded. This metric reflects the time efficiency of the algorithm under identical iteration settings, enabling a fair comparison of their computational complexity.
  • Statistical test methods: To evaluate the statistical significance of performance differences among algorithms, two non-parametric test methods are conducted at a 0.05 significance level. The Wilcoxon signed-rank test is used for pairwise comparisons between OLELS-DE and each compared algorithm, as it does not require data normality and is well suited for paired sample analysis. The Friedman test is applied to assess the overall performance ranking of all algorithms across multiple instances, providing a global evaluation of whether observed differences are statistically significant.
The five adopted metaheuristic algorithms and the proposed OLELS-DE algorithm are implemented in MATLAB R2022a, and the CPLEX experiments are conducted using the MATLAB interface of CPLEX Optimization Studio V12.10. All experiments are performed on a computer equipped with a 12th Gen Intel® CoreTM i7-12700K CPU (Intel Corporation, Santa Clara, CA, USA) running at 3.61 GHz, 32 GB of RAM, and the 64-bit version of Windows 11.

4.2. Validation of Model and Algorithm’s Accuracy

In this subsection, a basic case study with small-scale experiments is conducted to validate the accuracy of both the mathematical model and the proposed optimization algorithm. Specifically, ten dies (die 1 to die 10) from Table 2 are selected as candidates to be placed on the interposer for testing. The test wire lengths between different die pairs are listed in Table 3. These values are non-dimensional and represent relative, rather than absolute, distances, which vary depending on the distribution of dies. The values are randomly generated within a reasonable range for the purpose of this study.
For comparison purposes, we employ the basic DE algorithm using both the DE/rand/1 and DE/best/1 mutation strategies to solve the test-path scheduling problem. We also include the results obtained by the ILP-based method as reported in [8] for reference. Additionally, two baseline methods are considered for validation. The first baseline (BL1) assigns an independent scan-in and scan-out chain to each die, enabling full parallel testing of all dies. The second baseline (BL2) uses a single scan-in and scan-out chain to test all dies sequentially. The scheduling results produced by OLELS-DE and other optimization methods for this basic case are summarized in Table 4.
As shown in the results, the proposed OLELS-DE algorithm achieves a competitive test cost of $63.33, which matches the cost obtained by the ILP method [8], demonstrating the accuracy and effectiveness of the optimization approach. In contrast, both DE/rand/1 and DE/best/1 result in higher costs, $66.76 and $65.26, respectively, due to suboptimal scheduling paths. Although DE/rand/1 and DE/best/1 achieve slightly shorter test lengths, they introduce more TAMs (e.g., DE/rand/1 uses 4 in-TAMs and 5 out-TAMs), which increases hardware resource consumption and associated cost. The test wire length obtained by OLELS-DE (247) is reasonably low, striking a balance between resource usage and routing complexity. Compared with the baseline methods, OLELS-DE significantly outperforms both BL1 and BL2 in terms of cost. BL1, which uses independent scan chains for each die, results in the highest cost ($122.76) due to excessive TAM usage. BL2, although using minimal TAMs, leads to the longest test length (13,658), resulting in a cost of $120.49.
These experimental results confirm that OLELS-DE not only achieves optimal or near-optimal cost efficiency comparable to the exact method ILP, but also significantly outperforms the basic DE algorithms and baseline strategies in balancing test time, TAM usage, and wire length.

4.3. Performance Comparison

In this subsetion, we rigorously evaluate the effectiveness of the proposed OLELS-DE algorithm through comprehensive comparative experiments against five state-of-the-art metaheuristic algorithms and CPLEX across nine specially designed test instances (labeled P1 to P9). The number of dies to be tested in these instances ranges from 20 to 100, increasing in increments of 10. For comparative analysis, Table 5 presents the best, worst, and average test costs achieved by each algorithm across multiple independent runs, along with their corresponding CPU runtimes and statistical results obtained by the Wilcoxon signed-rank test. It should be noted that, since CPLEX fails to solve most instances to optimality within a reasonable time limit, we report its results based on runs capped at 1800 s (0.5 h) of CPU time for P1–P4 and 3600 s (1 h) for P5–P9. For OLELS-DE and other metaheuristic algorithms, the reported runtime refers to the CPU time consumed after completing 2000 iterations.

4.3.1. General Performance

From the experimental results, it is immediately evident that OLELS-DE demonstrates superior or highly competitive performance across the majority of the nine test instances. In most cases, it ranks first in at least two of the three reported metrics (i.e., best, worst, and mean test costs) while maintaining competitive results in the remaining cases. Even when not achieving the lowest value, its mean test cost is consistently close to the best performer, indicating strong competitiveness. For example, in instance P1, the mean test cost of OLELS-DE is $104.26, which is better than those of JADE ($114.89), EFDE ($117.82), MGDE ($118.13), WOA ($111.24), and HHO ($119.34). In larger instances, such as P9 with 100 dies, OLELS-DE reaches a mean test cost of $236.86, notably outperforming all compared methods.
In terms of robustness, which is measured by the gap between the best and worst results across 20 runs, OLELS-DE again demonstrates remarkable consistency. Taking P6 as an example, the difference between its best and worst test cost is only $9.19, while the same range for JADE, EFDE, MGDE, WOA, and HHO is $38, $118.43, $44.33, $53.9 and $66.12, respectively. Even in large and complex instances like P8 and P9, OLELS-DE maintains a relatively tight variance, showcasing its reliability. This robustness is especially crucial in practical test scheduling scenarios, where deterministic performance is often preferred over erratic optimization behavior. The performance of the compared five metaheuristic algorithms varies noticeably with problem scale. Among them, JADE generally performs better than EFDE and MGDE due to its adaptive parameter mechanism, yet it still significantly trails behind OLELS-DE in both quality and stability. The other two algorithms, WOA and HHO, based on swarm intelligence heuristics, are more prone to stagnation and suboptimal convergence, particularly in larger instances. This is reflected by their steep increase in test costs from P5 to P9, suggesting weaker scalability. For instance, on P9, the worst test cost of HHO reaches $292.31, and EFDE and MGDE go as high as $563.80 and $480.73, respectively, which are more than double the cost of OLELS-DE. For CPLEX, although it can obtain competitive results for instances P1–P4, its applicability diminishes rapidly with problem size. Even with extended CPU time limits, it fails to solve most large-scale instances to optimality, and in some cases returns solutions inferior to those of OLELS-DE.
The consistently superior results of OLELS-DE can be attributed to its layered exploration and exploitation strategy, along with the elite learning mechanism, which together promote diversified search in the early stages and intensified refinement in the later stages. This balance allows the algorithm to avoid local optima while effectively converging toward global solutions. Compared to conventional DE variants that often lack adaptive control of exploration depth or elite knowledge reuse, OLELS-DE integrates these mechanisms in a structured and cooperative manner.

4.3.2. Statistical Analysis

Building upon the performance trends discussed in Section 4.3.1, a statistical analysis is further conducted to rigorously verify whether the observed differences among algorithms are significant. To this end, two widely accepted non-parametric statistical tests are employed: Wilcoxon signed-rank test and Friedman test with post hoc multiple comparisons.
The Wilcoxon signed-rank test results presented in Table 5 reveal that OLELS-DE consistently outperforms all five compared metaheuristic algorithms (JADE, EFDE, MGDE, WOA, and HHO) across nearly all test instances. This is evidenced by the predominance of “(−)” symbols, indicating that each competitor is significantly worse than OLELS-DE in terms of the test cost. No instance shows a metaheuristic algorithm significantly outperforming OLELS-DE (i.e., no “(+)” signs). In contrast, the comparison with the exact solver CPLEX shows a more nuanced picture: CPLEX significantly surpasses OLELS-DE on instances P1 and P5, performs equivalently on P2 and P3, but is significantly outperformed by OLELS-DE on larger instances from P4 onwards. These findings align with the expected computational limitations of exact solvers when facing large-scale, complex problems within reasonable time budgets.
Complementing the pairwise Wilcoxon analysis, the Friedman test is conducted to provide a global ranking of the algorithms based on their performance across all nine test instances. As summarized in Table 6, OLELS-DE achieves the lowest (best) average rank of 1.3333, closely followed by CPLEX at 1.6667, whereas the remaining algorithms exhibit considerably inferior rankings, with MGDE and EFDE occupying the bottom positions.
Subsequent post hoc multiple comparison procedures, including Bonferroni–Dunn, Holm, and Hochberg corrections, are applied to ascertain the statistical significance of OLELS-DE’s superiority over each competitor individually. Table 7 confirms that OLELS-DE significantly outperforms MGDE, EFDE, JADE, and HHO at a highly stringent significance level (adjusted p-values all below 0.01). The difference between OLELS-DE and WOA is also significant at a less strict threshold (unadjusted p = 0.043617 ), while no statistically significant difference is observed between OLELS-DE and CPLEX (unadjusted p > 0.7 ).
Collectively, these statistical test results substantiate the consistent and robust superiority of OLELS-DE over state-of-the-art metaheuristic approaches and demonstrate its competitiveness with exact optimization methods, especially on large-scale 2.5D IC test scheduling problems.

4.3.3. Convergence Performance

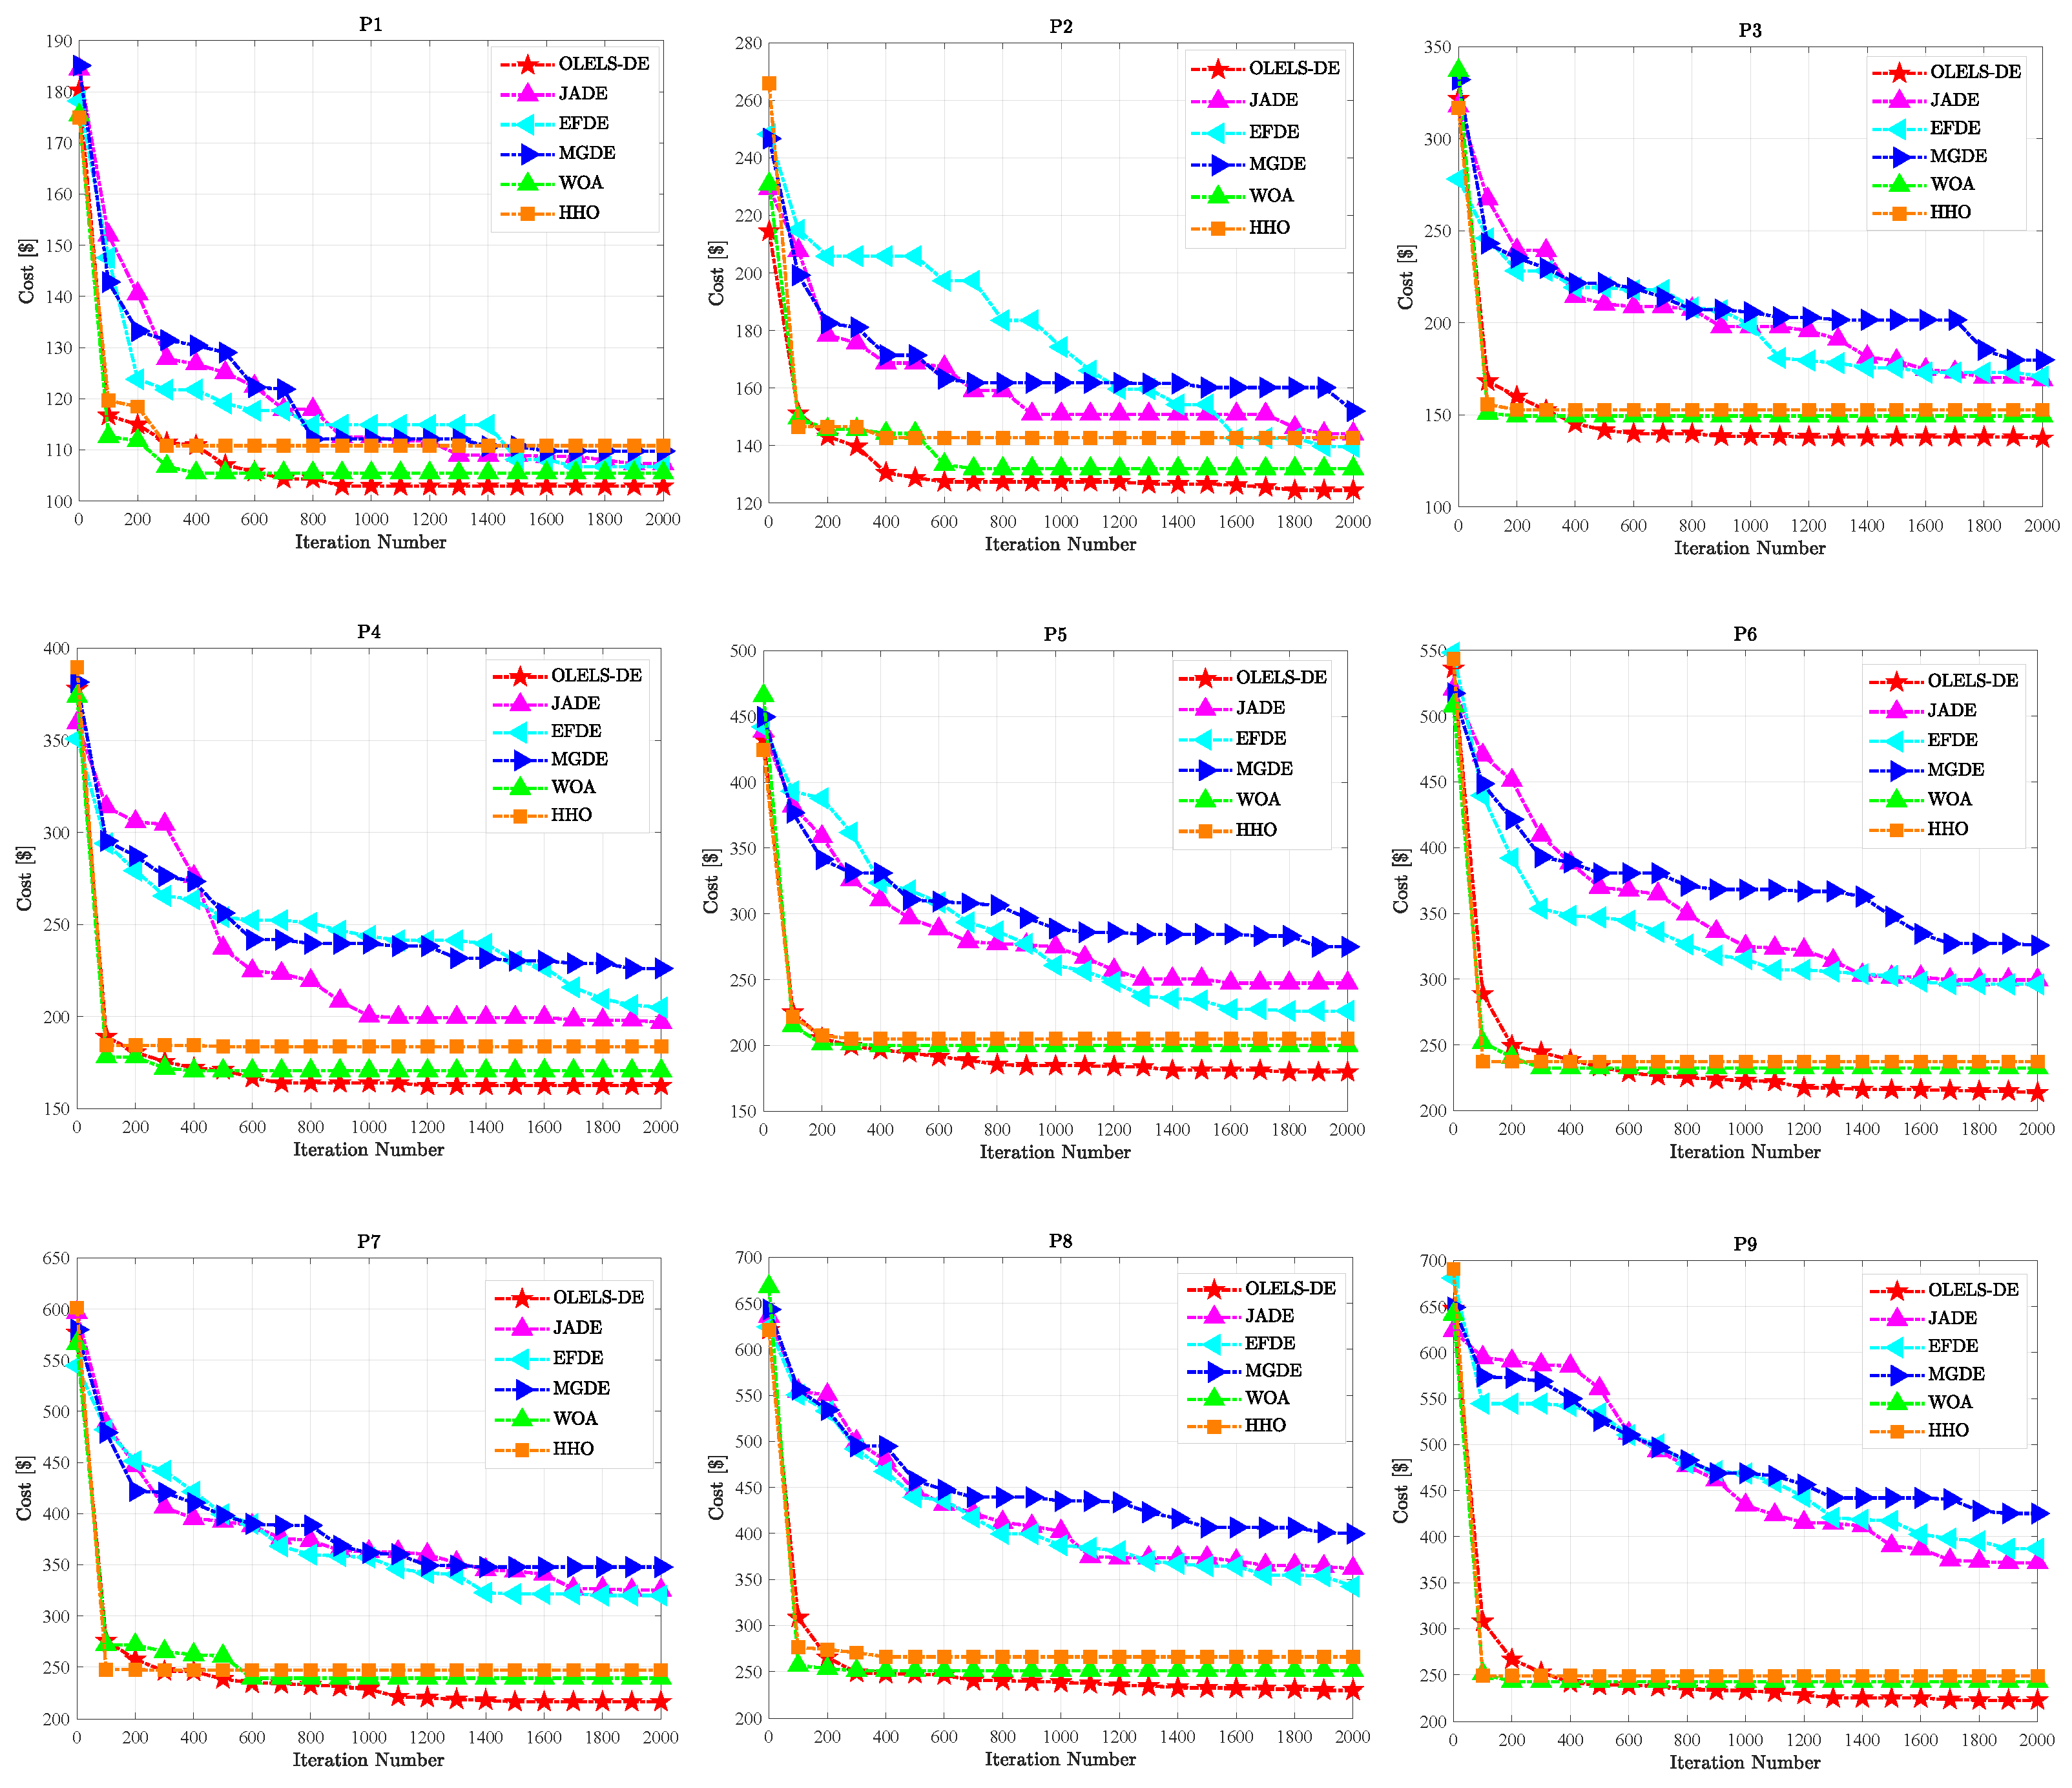
To further assess the optimization dynamics and stability of the compared algorithms, convergence curves are plotted to visualize the evolution of the test cost over iterations. Figure 4 depicts the convergence behavior of the proposed OLELS-DE algorithm compared with five other metaheuristic algorithms across nine test instances. Each curve corresponds to the run that achieves the best test cost among 20 independent runs, thereby reflecting the most efficient convergence process observed for each algorithm. It is evident that OLELS-DE consistently exhibits the most favorable convergence patterns across all instances, excelling in both convergence speed and final solution quality. In nearly every case, OLELS-DE rapidly reduces the test cost within the first few hundred iterations and then stabilizes at a near-optimal value with minimal oscillation. This behavior underscores the effectiveness of its orthogonal learning-based search mechanism and elite learning-based local search strategy, which together enable fast exploitation while preserving strong global search capability.
In contrast, the performance of other compared algorithms appears more volatile and often suboptimal. JADE and EFDE, although capable of early cost reduction, frequently stagnate at higher values, indicating premature convergence. MGDE shows slower and less stable descent, especially on larger instances (e.g., P6–P9), suggesting difficulty in escaping local optima and adjusting to increased problem complexity. WOA and HHO, while sometimes achieving rapid early progress, often exhibit oscillating or irregular convergence patterns, reflecting weak solution refinement and susceptibility to randomness in their search dynamics.
Importantly, the advantage of OLELS-DE becomes more obvious as the problem scale increases. On medium-scale instances (e.g., P1–P3), the gap in final test cost among some algorithms is relatively small. However, on larger instances (P6–P9), OLELS-DE maintains its performance with minimal degradation, while the compared methods suffer significant slowdowns or fail to reach competitive solutions even after 2000 iterations. This indicates that OLELS-DE not only achieves strong convergence but also scales effectively with problem complexity, which is an essential property for practical applications involving large-scale 2.5D ICs. Moreover, the convergence curves of OLELS-DE are notably smoother and more stable, revealing its inherent robustness and low variance. This stands in contrast to the jagged, fluctuating paths observed in HHO, MGDE, and EFDE, which are often affected by poor parameter control or excessive randomness. The elite learning mechanism in OLELS-DE ensures that high-quality solutions are retained and exploited efficiently, avoiding regression or instability in the optimization trajectory.

4.3.4. Computational Runtime Comparison

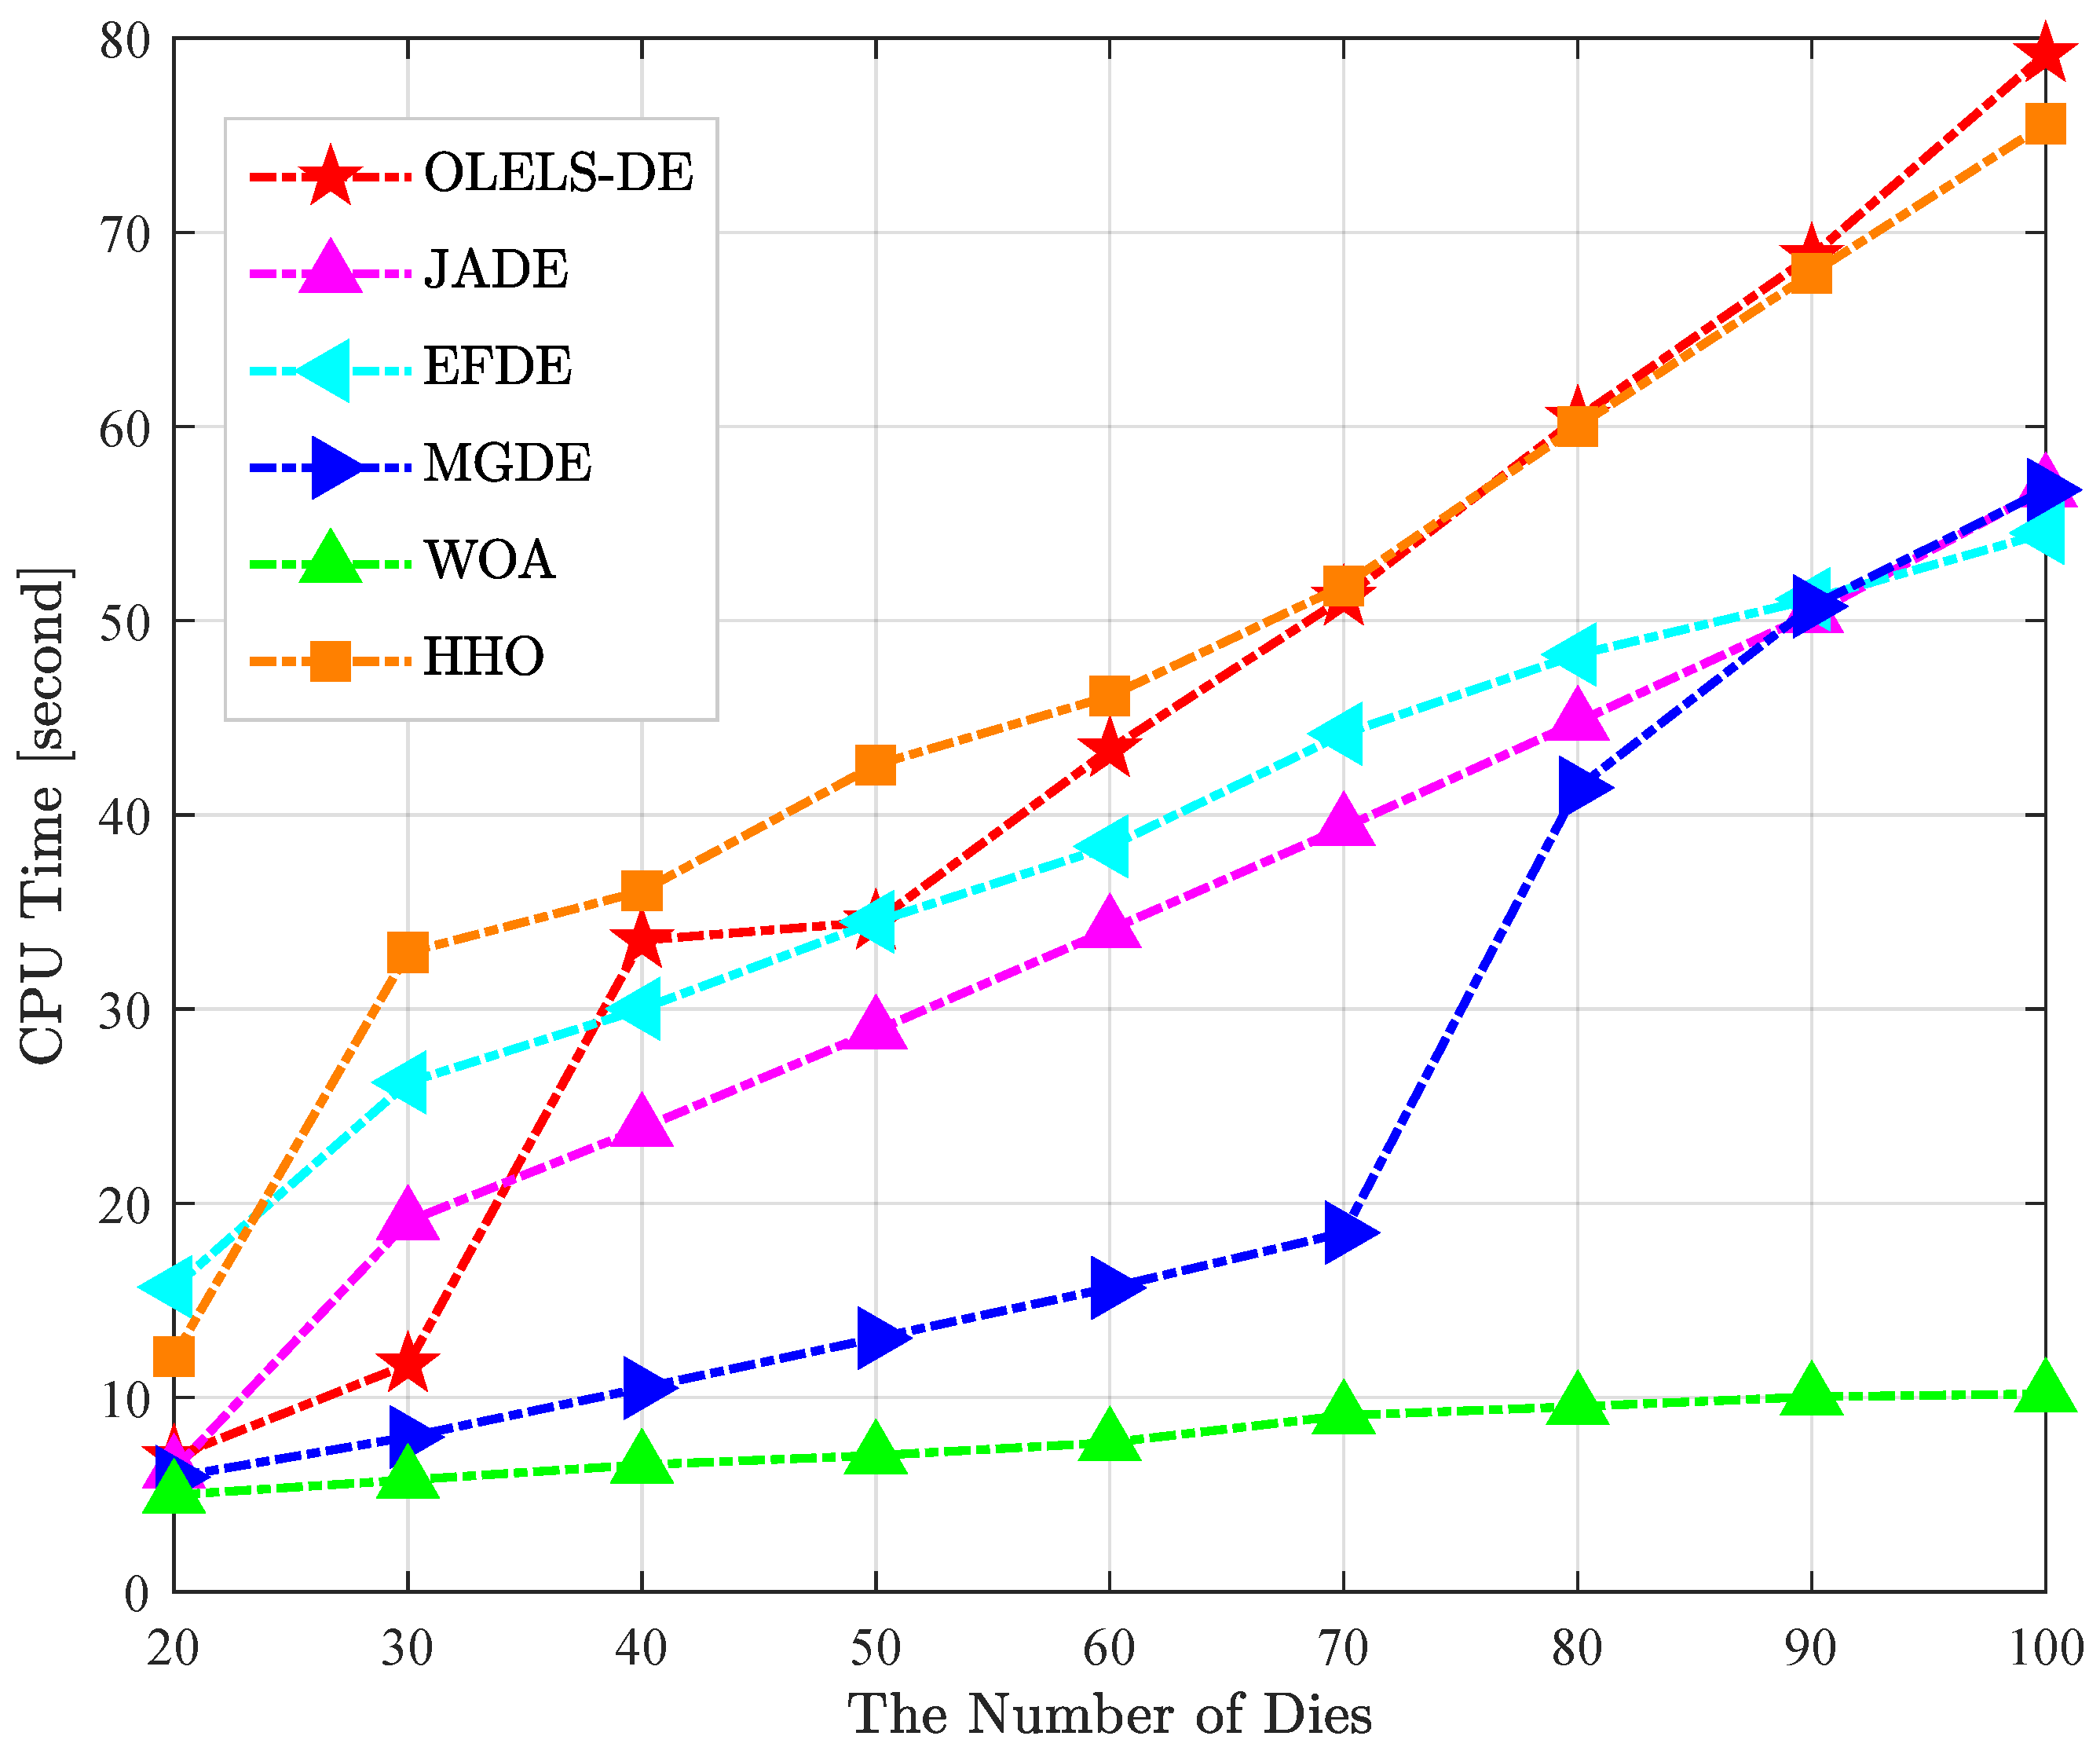
Figure 5 presents the CPU runtime of each algorithm after completing 2000 iterations as the number of dies increases, based on the “time” values reported in Table 5. The curves clearly illustrate how computational cost scales with problem size and reveal distinct runtime characteristics for different algorithms.
WOA consistently records the lowest runtime and the flattest growth trend: its CPU time rises only slightly from 4.99 s at 20 dies to 10.19 s at 100 dies. This reflects very low per-iteration overhead, making WOA the fastest method; however, its solution quality is comparatively poor as previously discussed. JADE and EFDE show moderate and stable runtime growth. JADE’s CPU time increases from 6.27 s to 56.80 s, while EFDE ranges from 15.69 s to 54.52 s. Both exhibit steady scaling behaviour, with balanced runtime–quality performance. OLELS-DE exhibits a predictable upward trend from 6.95 s at 20 dies to 79.17 s at 100 dies. Although its CPU runtime is higher than WOA and somewhat higher than JADE/EFDE, it remains within practical limits. Crucially, this additional computational cost is offset by significantly better solution quality, as demonstrated in the earlier cost and statistical analyses. HHO follows a similar trajectory to OLELS-DE but with slightly higher average runtime and inferior cost performance. MGDE runs quickly on medium instances but shows a sudden runtime surge for larger cases (notably P7–P9), likely due to algorithm-specific overhead that becomes prominent at higher complexity, undermining its scalability.

4.3.5. Results Evaluation with Runtime-Based Stopping Criterion

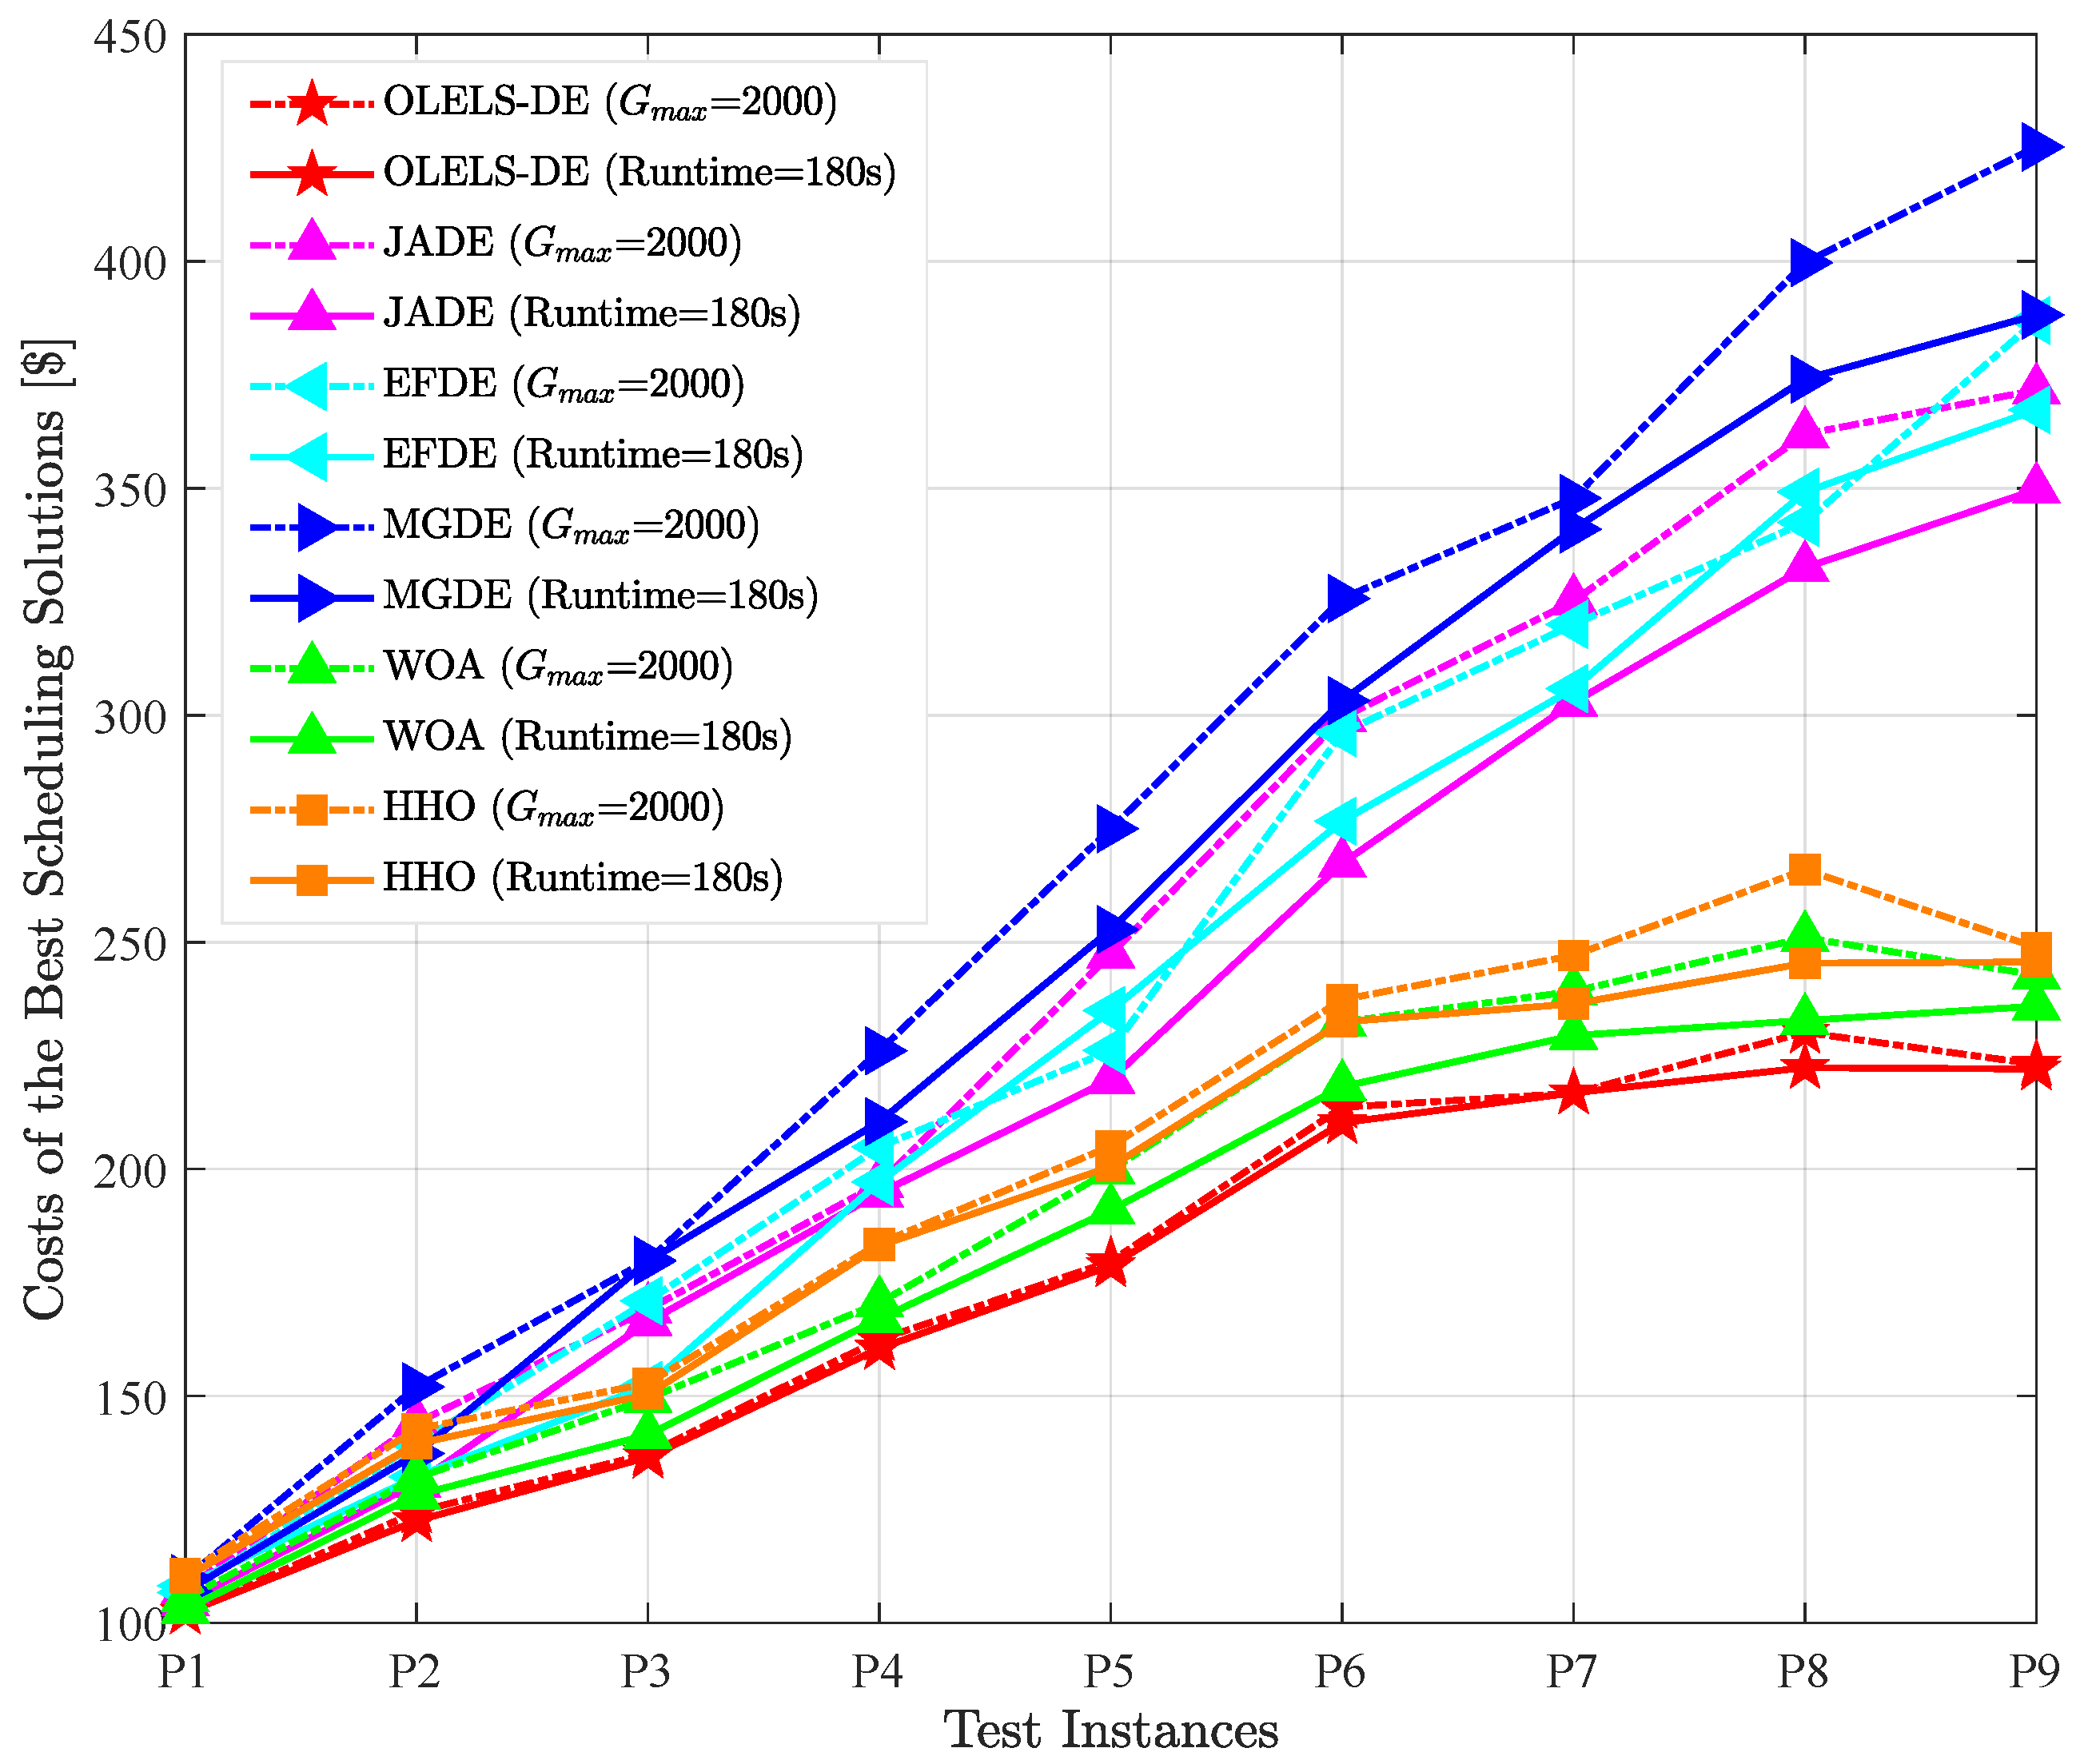
To further evaluate the practical efficiency of the proposed OLELS-DE algorithm under different termination strategies, an additional set of experiments is conducted in which the maximum CPU runtime is used as the stopping criterion instead of a fixed number of iterations. Specifically, the metaheuristic algorithms are terminated after a fixed 180 s CPU budget, and CPLEX is stopped after the same time allowed previously (1800 s for P1–P4, 3600 s for P5–P9). This setting ensures that metaheuristic algorithms are provided with an equal computational budget in real time, thereby enabling a fair evaluation of their search efficiency and solution improvement potential over extended runs. Comprehensive results are presented in Table 8, and Figure 6 visually contrasts the best test cost obtained by each algorithm under iteration-limited ( G max = 2000) and time-limited (Runtime = 180 s) conditions. This setup evaluates each method’s efficiency in utilizing a constrained computational budget.
Compared with the iteration-limited results, OLELS-DE maintains its leading performance under the time cap, consistently achieving the lowest or near-lowest scheduling cost across all problem instances. This robustness indicates that OLELS-DE’s search process is both fast and effective, enabling it to reach even higher-quality solutions when granted additional runtime beyond the fixed-iteration setting.
Notably, several algorithms exhibit improved relative performance under the time-based stopping condition. In particular, JADE, MGDE and HHO show smaller performance gaps to OLELS-DE than in the iteration-limited case, suggesting that their solution quality benefits substantially from the extended computational time and that they can converge to competitive solutions when allowed to run longer. WOA also benefits moderately from the time limit, as its lightweight search operations allow more iterations to be executed within the extended runtime, partially compensating for its lower per-iteration effectiveness. In contrast, EFDE exhibit a decline in relative performance under the time cap in some test instances (e.g., P5 and P8). This can be attributed to its higher per-iteration computational overhead and slower convergence speed, which limit the ability to fully exploit the additional runtime and refine solutions effectively.
From a broader perspective, the results demonstrate that algorithms capable of sustaining improvement throughout extended runs can gain a comparative advantage when more runtime is available. OLELS-DE’s combination of effective local search and balanced exploration–exploitation still ensures that it outperforms all other metaheuristics in most instances, while also remaining competitive with CPLEX for larger problems where the latter cannot complete an exhaustive search within its own time budget.

4.4. Sensitivity Analysis

In this subsection, we conduct experiments to analyze the sensitivity of the proposed OLELS-DE algorithm to two critical parameters when solving the test scheduling problems in 2.5D ICs. The first is the population size N, which directly affects the diversity of search directions and search efficiency. The second is the threshold parameter T max , which determines the execution frequency of the designed orthogonal learning-based search mechanism and elite-based local search strategy.

4.4.1. Sensitivity Analysis of Population Size N

The population size N plays a crucial role in determining the search behavior of OLELS-DE. Generally speaking, a small N may lead to insufficient diversity in the population, thereby increasing the risk of premature convergence or stagnation to suboptimal solutions. Conversely, an excessively large N can enhance diversity but often dilutes the selective pressure, potentially slowing down convergence. Moreover, a larger population size inevitably increases the number of fitness evaluations required in each iteration, which results in longer CPU runtime for the same number of iterations. Therefore, it is necessary to determine an appropriate N that balances solution quality and computational efficiency.
In the experiments, we select five candidate values of N, i.e., N { 50 , 100 , 150 , 200 , 250 } . The scheduling results of OLELS-DE with different settings of N are presented in Table 9. The results show that N = 100 achieves competitive or superior mean costs across most instances while keeping the runtime within a reasonable range. In contrast, smaller populations such as N = 50 tend to produce worse solutions, as confirmed by the Wilcoxon signed-rank test indicating significant performance degradation in most cases. Larger populations ( N 150 ) occasionally yield marginally better best-case results, but these gains are inconsistent and come at the expense of substantially increased runtime, which is often more than double that of N = 100. Considering both solution quality and computational efficiency, N = 100 is identified as the most suitable population size for OLELS-DE.

4.4.2. Sensitivity Analysis of Parameter T max

In the OLELS-DE algorithm, the parameter T max controls the detection frequency of premature convergence and stagnation, thereby determining how often the orthogonal learning-based search mechanism and elite-based local search strategy are activated. A smaller T max triggers these strategies more frequently, which can enhance exploitation capability and improve solution quality by helping the search escape from local optima. However, this also increases computational overhead due to the additional search operations. Conversely, a larger T max reduces the activation frequency, lowering the runtime but potentially compromising solution quality because of insufficient exploitation.
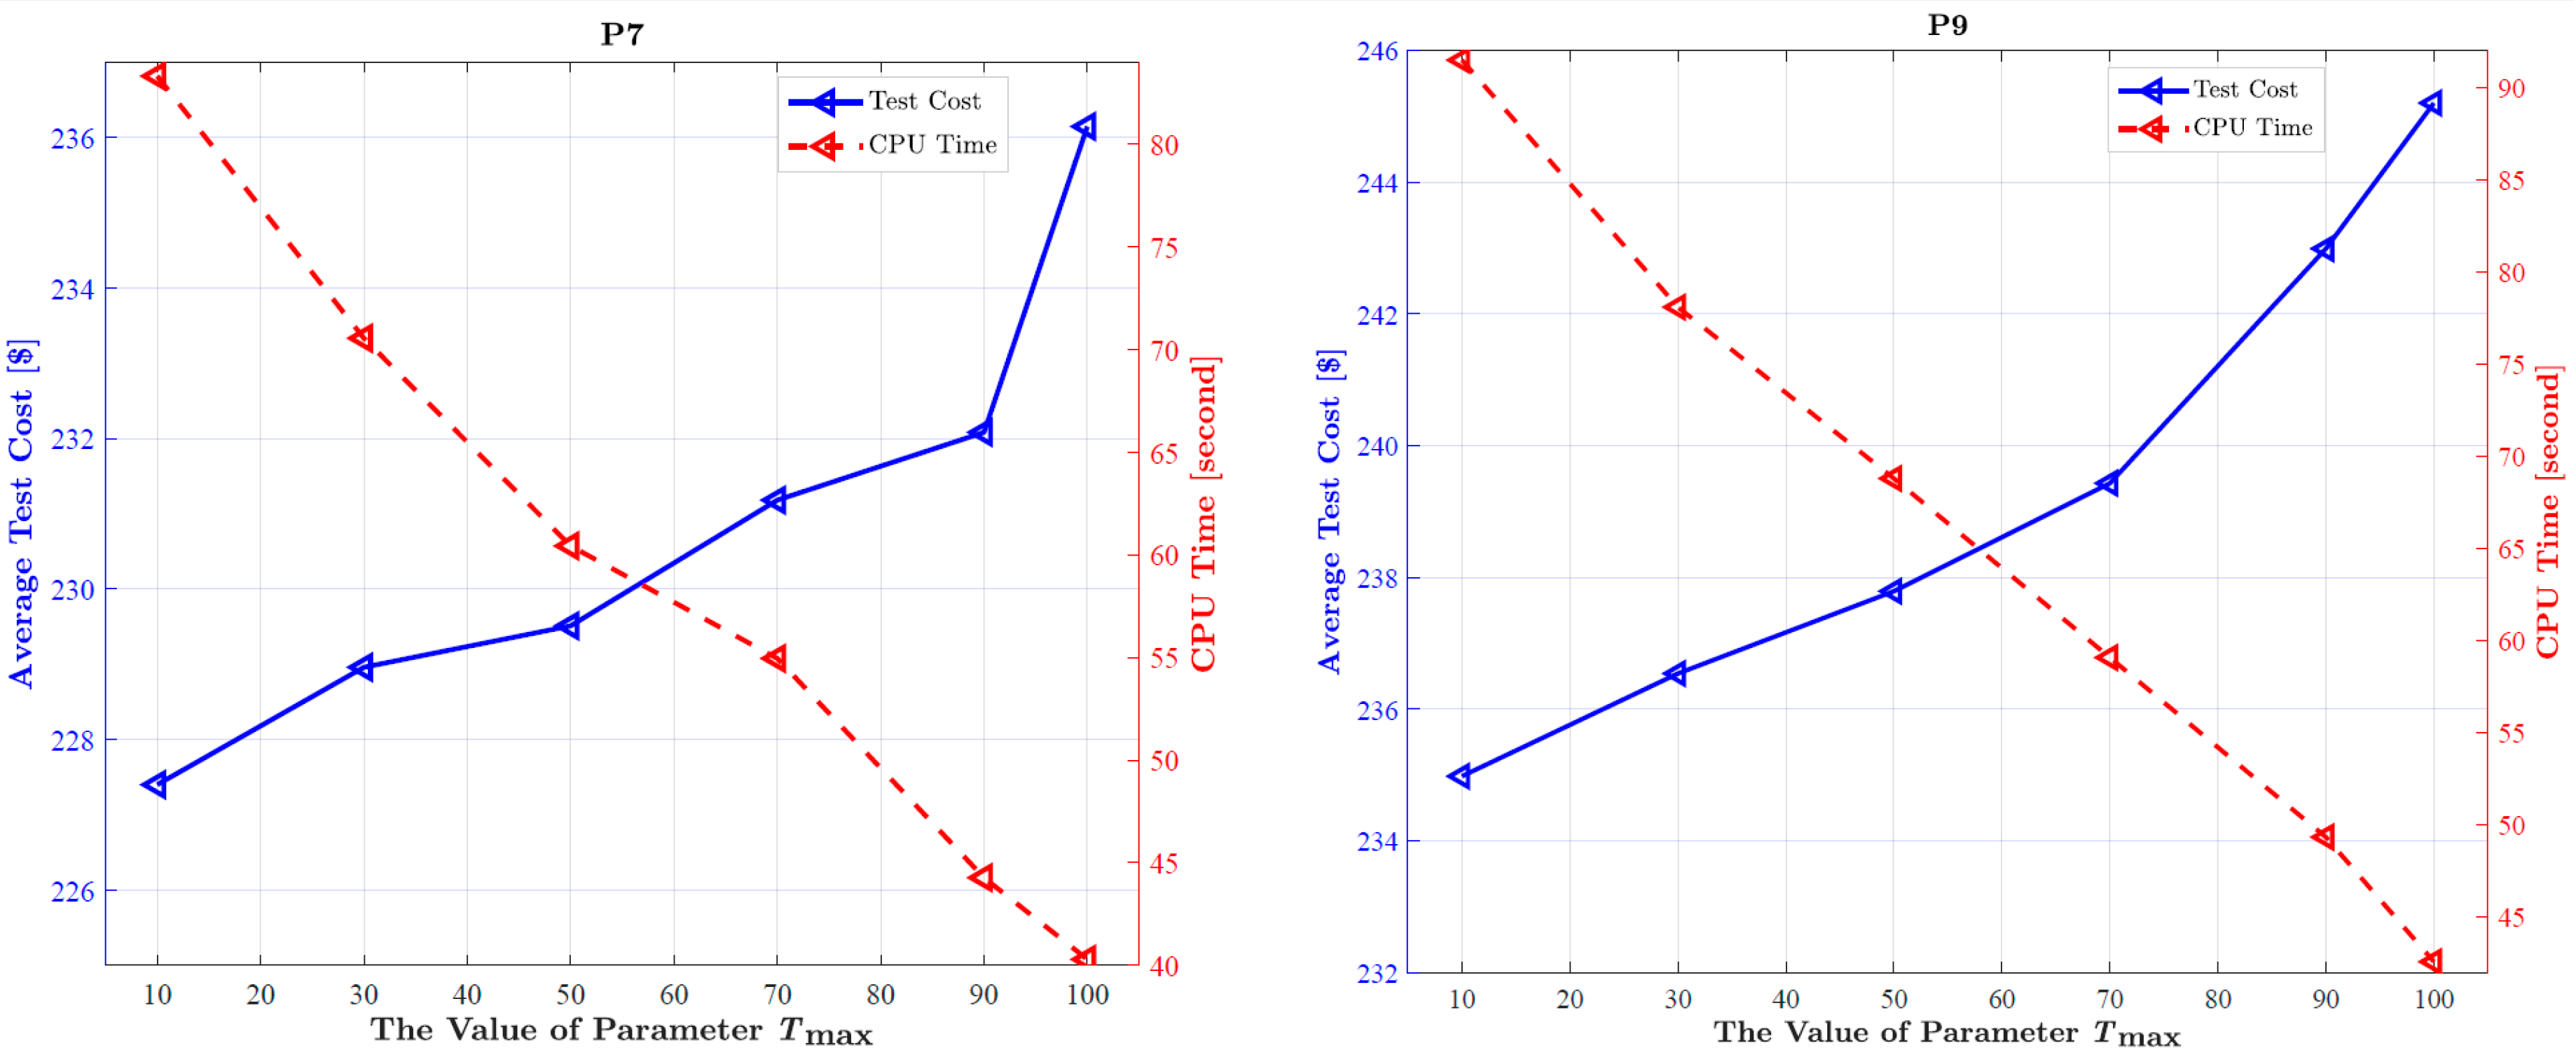
To examine its impact, experiments are conducted with T max { 10 , 30 , 50 , 70 , 90 , 100 } on the P1–P9 instances, and the results are summarized in Table 10. The results show that when T max is small (e.g., T max = 10 or 30), the algorithm often achieves competitive or even best results in terms of mean and best scheduling cost across multiple instances, confirming the benefit of frequent execution of the orthogonal learning-based search mechanism and elite-based local search strategy. However, excessively large values of T max (≥90) generally lead to notable degradation in solution quality, as the algorithm becomes less responsive to premature convergence and stagnation. In contrast, the runtime consistently decreases as T max increases, with reductions of over 50% observed in some large-scale instances when moving from T max = 10 to T max = 100, primarily due to the reduced number of additional search activations. Statistical analysis further indicates that T max = 30 and T max = 50 deliver similar performance without significant differences, while T max 90 performs significantly worse in most cases. As illustrated in Figure 7, which takes instances P7 and P9 as representative examples, the average test cost (blue curve) remains low for smaller T max values but increases noticeably when T max exceeds 70, while the CPU runtime (red dashed curve) exhibits a clear decreasing trend with increasing T max —a pattern that fully aligns with the above observations.
Based on these observations, T max = 10 offers slightly better solution quality in certain cases but at a substantial runtime cost, whereas T max = 50 provides a more favorable trade-off between solution quality and computational efficiency. Therefore, T max = 50 is adopted as the default parameter setting for OLELS-DE in this study.
5. Conclusions

This paper presents an effective solution to the test-path scheduling problem in interposer-based 2.5D ICs by introducing an orthogonal learning-based differential evolution algorithm, termed OLELS-DE. The proposed method augments traditional differential evolution with an orthogonal learning-based search strategy and an elite learning mechanism, jointly improving convergence speed and solution quality. A cost mathematical model is formulated to simultaneously minimize total test time and cumulative interconnect length, enabling a balanced and practical optimization framework under real-world design constraints. Extensive experiments on nine benchmark test instances demonstrate that OLELS-DE consistently outperforms five state-of-the-art metaheuristic algorithms and CPLEX in both solution quality and convergence behavior. Furthermore, the algorithm exhibits strong scalability, maintaining robustness and efficiency as the number of dies increases. These results highlight the potential of OLELS-DE as a reliable and scalable optimization method for complex test scheduling tasks in advanced multi-die integration.
Future research will focus on several directions to further enhance the applicability and performance of OLELS-DE. First, adaptive parameter control strategies will be investigated to dynamically adjust search behavior according to the problem landscape. Second, the current scheduling model adopts a simplified formulation without explicit power and thermal constraints, enabling a controlled setting for fair algorithm comparisons. However, in practical 2.5D IC testing, excessive parallel testing can cause power delivery issues and thermal hotspots. Future work will extend the model to incorporate dynamic power budgets and temperature-aware constraints, improving its realism and applicability in industrial environments. Third, the methodology will be generalized to other integration scenarios, such as chiplet-based and 3D-stacked systems. Finally, to verify its industrial practicality, OLELS-DE will be applied to real industrial test cases, ensuring its effectiveness beyond synthetic benchmarks.

Author Contributions

Conceptualization, C.L., L.D. and G.Y.; methodology, C.L., L.D. and G.Y.; software, L.Z.; investigation, C.L. and C.C.; writing—original draft preparation, C.L., L.D., G.Y. and C.C.; writing—review and editing, C.L., L.D., G.Y. and L.Q.; supervision, L.D. and L.Q.; funding acquisition, L.D. All authors have read and agreed to the published version of the manuscript.

Funding

This work was supported in part by the National Natural Science Foundation of China under Grant 62176075, in part by the National Key R&D Program of China under Grant 2022YFB3304000, and in part by Shandong Provincial Natural Science Foundation under Grant ZR2021MF063.

Data Availability Statement

The original contributions presented in this study are included in the article, further inquiries can be directed to the corresponding author.

Conflicts of Interest

The authors declare no conflicts of interest.

References

  1. Sheikh, F.; Nagisetty, R.; Karnik, T.; Kehlet, D. 2.5D and 3D Heterogeneous Integration: Emerging applications. IEEE Solid-State Circuits Mag. 2021, 13, 77–87. [Google Scholar] [CrossRef]
  2. Burd, T.; Li, W.; Pistole, J.; Venkataraman, S.; McCabe, M.; Johnson, T.; Vinh, J.; Yiu, T.; Wasio, M.; Wong, H.H.; et al. Zen3: The AMD 2nd-Generation 7nm x86-64 Microprocessor Core. In Proceedings of the 2022 IEEE International Solid-State Circuits Conference (ISSCC), San Francisco, CA, USA, 20–26 February 2022; Volume 65, pp. 1–3. [Google Scholar] [CrossRef]
  3. Langhammer, M.; Nurvitadhi, E.; Gribok, S.; Pasca, B. Stratix 10 NX Architecture. ACM Trans. Reconfigurable Technol. Syst. 2022, 15, 1–32. [Google Scholar] [CrossRef]
  4. Song, R.; Zhang, J.; Zhu, Z.; Shan, G.; Yang, Y. Fault and self-repair for high reliability in die-to-die interconnection of 2.5D/3D IC. Microelectron. Reliab. 2024, 158, 115429. [Google Scholar] [CrossRef]
  5. Wang, R.; Chakrabarty, K.; Bhawmik, S. At-speed interconnect testing and test-path optimization for 2.5 D ICs. In Proceedings of the 2014 IEEE 32nd VLSI Test Symposium, Napa, CA, USA, 13–17 April 2014; pp. 1–6. [Google Scholar] [CrossRef]
  6. IEEE 1149.1-2013; IEEE Standard for Test Access Port and Boundary-Scan Architecture. IEEE: New York, NY, USA, 2013. [CrossRef]
  7. Deng, L.; Sun, N.; Fu, N. Boundary scan based interconnect testing design for silicon interposer in 2.5D ICs. Integr. Vlsi J. 2020, 72, 171–182. [Google Scholar] [CrossRef]
  8. Wang, R.; Chakrabarty, K.; Bhawmik, S. Interconnect testing and test-path scheduling for interposer-based 2.5-D ICs. IEEE Trans. Comput.-Aided Des. Integr. Circuits Syst. 2014, 34, 136–149. [Google Scholar] [CrossRef]
  9. Li, C.; Deng, L.; Gong, W.; Qiao, L. An ensemble local search framework for population-based metaheuristic algorithms on single-objective optimization. Appl. Soft Comput. 2025, 181, 113462. [Google Scholar] [CrossRef]
  10. Chakrabarty, K. Test scheduling for core-based systems using mixed-integer linear programming. IEEE Trans. Comput.-Aided Des. Integr. Circuits Syst. 2000, 19, 1163–1174. [Google Scholar] [CrossRef]
  11. Iyengar, V.; Chakrabarty, K.; Marinissen, E.J. Test wrapper and test access mechanism co-optimization for system-on-chip. J. Electron. Test. 2002, 18, 213–230. [Google Scholar] [CrossRef]
  12. Giri, C.; Sarkar, S.; Chattopadhyay, S. A genetic algorithm based heuristic technique for power constrained test scheduling in core-based SOCs. In Proceedings of the 2007 IFIP International Conference on Very Large Scale Integration, Atlanta, GA, USA, 15–17 October 2007; pp. 320–323. [Google Scholar] [CrossRef]
  13. Harmanani, H.M.; Farah, R. Integrating wrapper design, TAM assignment, and test scheduling for SOC test optimization. In Proceedings of the 2008 Joint 6th International IEEE Northeast Workshop on Circuits and Systems and TAISA Conference, Montreal, QC, Canada, 22–25 June 2008; pp. 149–152. [Google Scholar] [CrossRef]
  14. Zadegan, F.G.; Ingelsson, U.; Asani, G.; Carlsson, G.; Larsson, E. Test scheduling in an IEEE P1687 environment with resource and power constraints. In Proceedings of the 2011 Asian Test Symposium, New Delhi, India, 20–23 November 2011; pp. 525–531. [Google Scholar] [CrossRef]
  15. IEEE 1687-2014; IEEE Standard for Access and Control of Instrumentation Embedded Within a Semiconductor Device. IEEE: New York, NY, USA, 2014. [CrossRef]
  16. Noia, B.; Chakrabarty, K.; Goel, S.K.; Marinissen, E.J.; Verbree, J. Test-architecture optimization and test scheduling for TSV-based 3-D stacked ICs. IEEE Trans. Comput.-Aided Des. Integr. Circuits Syst. 2011, 30, 1705–1718. [Google Scholar] [CrossRef]
  17. Chi, C.C.; Marinissen, E.J.; Goel, S.K.; Wu, C.W. Multi-visit TAMs to reduce the post-bond test length of 2.5 D-SICs with a passive silicon interposer base. In Proceedings of the 2011 Asian Test Symposium, New Delhi, India, 20–23 November 2011; pp. 451–456. [Google Scholar] [CrossRef]
  18. Lu, S.K.; Li, H.M.; Hashizume, M.; Hong, J.H.; Tsai, Z.R. Efficient test length reduction techniques for interposer-based 2.5 D ICs. In Proceedings of the Technical Papers of 2014 International Symposium on VLSI Design, Automation and Test, Hsinchu, Taiwan, 28–30 April 2014; pp. 1–4. [Google Scholar] [CrossRef]
  19. Ko, Y.C.; Huang, S.H. 3D IC memory BIST controller allocation for test time minimization under power constraints. In Proceedings of the 2017 IEEE 26th Asian Test Symposium, Taipei, Taiwan, 27–30 November 2017; pp. 260–265. [Google Scholar] [CrossRef]
  20. Wang, R.; Chakrabarty, K.; Bhawmik, S. Built-in self-test and test scheduling for interposer-based 2.5D IC. ACM Trans. Des. Autom. Electron. Syst. 2015, 20, 1–24. [Google Scholar] [CrossRef]
  21. Wang, R.; Li, G.; Li, R.; Qian, J.; Chakrabarty, K. ExTest scheduling for 2.5 D system-on-chip integrated circuits. In Proceedings of the 2015 IEEE 33rd VLSI Test Symposium, Napa, CA, USA, 27–29 April 2015; pp. 1–6. [Google Scholar] [CrossRef]
  22. Wang, S.; Wang, R.; Chakrabarty, K.; Tahoori, M.B. Multicast test architecture and test scheduling for interposer-based 2.5 D ICs. In Proceedings of the 2016 IEEE 25th Asian Test Symposium, Hiroshima, Japan, 21–24 November 2016; pp. 86–91. [Google Scholar] [CrossRef]
  23. Zhu, A.; Xu, C.; Li, Z.; Wu, J.; Liu, Z. Hybridizing grey wolf optimization with differential evolution for global optimization and test scheduling for 3D stacked SoC. J. Syst. Eng. Electron. 2015, 26, 317–328. [Google Scholar] [CrossRef]
  24. Deng, L.; Wei, D.; Qiao, L.; Bian, X.; Zhang, B. Optimization of core-based SOC test scheduling based on modified differential evolution algorithm. In Proceedings of the 2016 IEEE AUTOTESTCON, Anaheim, CA, USA, 12–15 September 2016; pp. 1–6. [Google Scholar] [CrossRef]
  25. SenGupta, B.; Nikolov, D.; Ingelsson, U.; Larsson, E. Test planning for core-based integrated circuits under power constraints. J. Electron. Test. 2017, 33, 7–23. [Google Scholar] [CrossRef]
  26. Chandrasekaran, G.; Periyasamy, S.; Karthikeyan, P. Test scheduling for system on chip using modified firefly and modified ABC algorithms. SN Appl. Sci. 2019, 1, 1079. [Google Scholar] [CrossRef]
  27. Deng, L.; Sun, N.; Fu, N. Test scheduling of interposer-based 2.5-D ICs using enhanced differential evolution algorithm. In Proceedings of the Wireless and Satellite Systems: 10th EAI International Conference, WiSATS 2019, Harbin, China, 12–13 January 2019; Proceedings, Part I 10. Springer: Cham, Switzerland, 2019; pp. 537–549. [Google Scholar] [CrossRef]
  28. Li, C.; Deng, L.; Qiao, L.; Zhang, L. A constrained multi-objective coevolutionary algorithm with adaptive operator selection for efficient test scheduling in interposer-based 2.5D ICs. Swarm Evol. Comput. 2025, 98, 102085. [Google Scholar] [CrossRef]
  29. Yang, Z.; Deng, L.; Li, C.; Zhang, L. Optimization of Built-In Self-Test test chain configuration in 2.5D Integrated Circuits Using Constrained Multi-Objective Evolutionary Algorithm. Eng. Appl. Artif. Intell. 2025, 143, 109876. [Google Scholar] [CrossRef]
  30. Storn, R.; Price, K. Differential evolution–a simple and efficient heuristic for global optimization over continuous spaces. J. Glob. Optim. 1997, 11, 341–359. [Google Scholar] [CrossRef]
  31. Lei, Y.X.; Gou, J.; Wang, C.; Luo, W.; Cai, Y.Q. Improved differential evolution with a modified orthogonal learning strategy. IEEE Access 2017, 5, 9699–9716. [Google Scholar] [CrossRef]
  32. Bai, W.; Meng, F.; Sun, M.; Qin, H.; Allmendinger, R.; Lee, K.Y. Differential evolutionary particle swarm optimization with orthogonal learning for wind integrated optimal power flow. Appl. Soft Comput. 2024, 160, 111662. [Google Scholar] [CrossRef]
  33. Dai, Z.; Zhou, A.; Zhang, G.; Jiang, S. A differential evolution with an orthogonal local search. In Proceedings of the 2013 IEEE Congress on Evolutionary Computation, Cancun, Mexico, 20–23 June 2013; pp. 2329–2336. [Google Scholar] [CrossRef]
  34. Liu, Q.; Zhang, C.; Li, Z.; Peng, T.; Zhang, Z.; Du, D.; Nazir, M.S. Multi-strategy adaptive guidance differential evolution algorithm using fitness-distance balance and opposition-based learning for constrained global optimization of photovoltaic cells and modules. Appl. Energy 2024, 353, 122032. [Google Scholar] [CrossRef]
  35. Deng, W.; Ni, H.; Liu, Y.; Chen, H.; Zhao, H. An adaptive differential evolution algorithm based on belief space and generalized opposition-based learning for resource allocation. Appl. Soft Comput. 2022, 127, 109419. [Google Scholar] [CrossRef]
  36. Huynh, T.N.; Do, D.T.; Lee, J. Q-Learning-based parameter control in differential evolution for structural optimization. Appl. Soft Comput. 2021, 107, 107464. [Google Scholar] [CrossRef]
  37. Han, O.; Ding, T.; Bai, L.; He, Y.; Li, F.; Shahidehpour, M. Evolutionary game based demand response bidding strategy for end-users using Q-Learning and compound differential evolution. IEEE Trans. Cloud Comput. 2022, 10, 97–110. [Google Scholar] [CrossRef]
  38. Xu, Z.; Han, G.; Liu, L.; Martínez-García, M.; Wang, Z. Multi-energy scheduling of an industrial integrated energy system by reinforcement learning-based differential evolution. IEEE Trans. Green Commun. Netw. 2021, 5, 1077–1090. [Google Scholar] [CrossRef]
  39. Li, C.; Deng, L.; Qiao, L.; Zhang, L. An efficient differential evolution algorithm based on orthogonal learning and elites local search mechanisms for numerical optimization. Knowl.-Based Syst. 2022, 235, 107636. [Google Scholar] [CrossRef]
  40. Zhang, J.; Sanderson, A.C. JADE: Adaptive differential evolution with optional external archive. IEEE Trans. Evol. Comput. 2009, 13, 945–958. [Google Scholar] [CrossRef]
  41. Lau, J.H. Recent advances and trends in multiple system and heterogeneous integration with TSV-less interposers. IEEE Trans. Compon. Packag. Manuf. Technol. 2022, 12, 1271–1281. [Google Scholar] [CrossRef]
  42. Marinissen, E.; Iyengar, V.; Chakrabarty, K. A set of benchmarks for modular testing of SOCs. In Proceedings of the Proceedings. International Test Conference, Baltimore, MD, USA, 10 October 2002; pp. 519–528. [Google Scholar] [CrossRef]
  43. Kumagai, K.; Yoneda, Y.; Izumino, H.; Shimojo, H.; Sunohara, M.; Kurihara, T.; Higashi, M.; Mabuchi, Y. A Silicon interposer BGA package with Cu-filled TSV and multi-layer Cu-plating interconnect. In Proceedings of the 2008 58th Electronic Components and Technology Conference, Baltimore, MD, USA, 10 October 2008; pp. 571–576. [Google Scholar] [CrossRef]
  44. Gupta, S.; Su, R. An efficient differential evolution with fitness-based dynamic mutation strategy and control parameters. Knowl.-Based Syst. 2022, 251, 109280. [Google Scholar] [CrossRef]
  45. Gupta, S.; Su, R. Multiple individual guided differential evolution with time varying and feedback information-based control parameters. Knowl.-Based Syst. 2023, 259, 110091. [Google Scholar] [CrossRef]
  46. Mirjalili, S.; Lewis, A. The Whale Optimization Algorithm. Adv. Eng. Softw. 2016, 95, 51–67. [Google Scholar] [CrossRef]
  47. Heidari, A.A.; Mirjalili, S.; Faris, H.; Aljarah, I.; Mafarja, M.; Chen, H. Harris hawks optimization: Algorithm and applications. Future Gener. Comput. Syst. 2019, 97, 849–872. [Google Scholar] [CrossRef]
  48. Nickel, S.; Steinhardt, C.; Schlenker, H.; Burkart, W. Decision Optimization with IBM ILOG CPLEX Optimization Studio. In Angewandte Optimierung mit IBM ILOG CPLEX Optimization Studio; Springer: Berlin/Heidelberg, Germany, 2022. [Google Scholar] [CrossRef]
Figure 1. Conceptual view of the general 2.5D IC structure.
Mathematics 13 02679 g001
Figure 2. Illustration of the designed encoding and decoding schemes.
Mathematics 13 02679 g002
Figure 3. Flowchart of the test-path scheduling process using the OLELS-DE algorithm.
Mathematics 13 02679 g003
Figure 4. Convergence process of OLELS-DE and five compared metaheuristics on P1–P9 instances.
Mathematics 13 02679 g004
Figure 5. Changing process of CPU runtime with increasing number of dies for different algorithms.
Mathematics 13 02679 g005
Figure 6. Best scheduling costs obtained by different algorithms under the iteration-limited ( G max = 2000) and time-limited (Runtime = 180 s) stopping conditions.
Mathematics 13 02679 g006
Figure 7. Changing processes of average test cost and CPU runtime when T max is set to different values for OLELS-DE in solving P7 and P9 test instances.
Mathematics 13 02679 g007
Table 1. Variable notations used in the mathematical model.
NotationDescription
N d Number of dies.
N p Number of in-TAMs.
N q Number of out-TAMs.
N t Number of interconnects being tested.
I i Number of μ bumps connected to the input ports of die i.
O i Number of μ bumps connected to the output ports of die i.
i , h Index of dies, i , h { 1 , 2 , , N d } .
jIndex of in-TAMs, j { 1 , 2 , , N p } .
kIndex of out-TAMs, k { 1 , 2 , , N q } .
y i , j Binary variable whose value equals to 1 if the scan-in chain of die i is in
in-TAM j, and 0 otherwise.
z i , k Binary variable whose value equals to 1 if the scan-out chain of die i is in
out-TAM k, and 0 otherwise.
e i , h Binary variable whose value equals to 1 if die h is placed directly after die i
within the same in-TAM or out-TAM, and 0 otherwise.
L i n Length of the longest test paths among all in-TAMs.
L o u t Length of the longest test paths among all out-TAMs.
W L i n Maximum test wire length among all in-TAMs.
W L o u t Maximum test wire length among all out-TAMs.
d i , h Physical distance between die i and die h.
a r e a T S V Physical area of a TSV.
a r e a μ b u m p Physical area of a μ bump.
fTest frequency.
c A T E Tester usage cost per second.
c i n t e r p o s e r Test cost per unit area of the interposer.
c d i e Test cost per unit area of the die.
c a Test cost incurred on the ATE per unit length.
c b 1 Test cost of fabricating an additional in-TAM.
c b 2 Test cost of fabricating an additional out-TAM.
CTotal test cost.
Table 2. The design data of the dies on the interposer for cost optimization.
Die index123456789101112
No. inputs1751523584438169355319999193846192848126379
No. outputs201140812614911961848146210241997157237196788
Die index131415161718192021222324
No. inputs117818468117546781326485537914123013651487
No. outputs1768276912171132101719897288051371184520472231
Table 3. The test wire length between different pairs of dies in the basic case study. These non-dimensional values are randomly generated within a reasonable range to represent relative distances.
d i , h die 1die 2die 3die 4die 5die 6die 7die 8die 9die 10
die 10488218991119929020
die 24809848787147226696
die 38298097352973227850
die 41848970813447834162
die 59978358105414463447
die 61171293454058259131
die 71947734714580944892
die 89222228346259409762
die 99066784134914897010
die 102096506247319262100
Table 4. Scheduling results obtained by different methods in the basic test case study with 10 dies. In this table, “Test Wire Length” is dimensionless, and “Test Cost” is expressed in dollars.
MethodsOLELS-DEDE/Rand/1DE/Best/1ILPBL1BL2
In-TAM paths9, 6, 1 ‖ 10, 3, 7 ‖ 2, 4, 5, 81, 2, 5 ‖ 9 ‖ 3, 6, 10 ‖ 4, 7, 81, 2, 10 ‖ 9 ‖ 7, 6 ‖ 3, 4, 5, 81, 6, 9 ‖ 2, 4, 5, 8 ‖ 3, 7, 101 ‖ 2 ‖ 3 ‖ 4 ‖ 5 ‖ 6 ‖ 7 ‖ 8 ‖ 9 ‖ 101, 2, 3, 4, 5, 6, 7, 8, 9, 10
Out-TAM paths8, 5, 2 ‖ 1, 3, 7, 10 ‖ 4, 6, 93, 8 ‖ 7 ‖ 10 ‖ 5, 2, 4 ‖ 1, 6, 96, 10 ‖ 3, 9 ‖ 5, 7 ‖ 2, 1, 4, 85, 10 ‖ 1, 2, 3, 7 ‖ 4, 6, 8, 91 ‖ 2 ‖ 3 ‖ 4 ‖ 5 ‖ 6 ‖ 7 ‖ 8 ‖ 9 ‖ 101, 2, 3, 4, 5, 6, 7, 8, 9, 10
No. In-TAM (p)3443101
No. Out-TAM (q)3543101
Test Length (L)4574386038464574384613,658
Test Wire Length2471412242190637
Test Cost (C)63.3366.7665.2663.33122.76120.49
Table 5. Scheduling performance of OLELS-DE and six compared methods on P1–P9 instances, including cost metrics, CPU runtime, and Wilcoxon signed-rank test results (Wilc.). The units for the metrics “best”, “worst”, and “mean” are in dollars, and the unit for the “time” metric is in seconds.
InstanceMetricOLELS-DEJADEEFDEMGDEWOAHHOCPLEX
P1best102.19 1107.30106.71109.76105.45110.81102.19
worst105.31122.63124.03127.21123.32127.75102.19
mean104.26114.89117.82118.13111.24119.34102.19
time6.956.2715.695.914.9912.111800
Wilc. (−) 2(−)(−)(−)(−)(+)
P2best124.47144.06139.53152.00131.98142.72125.32
worst129.82166.33166.48171.44163.34170.53125.32
mean126.03152.32151.98163.28145.71156.47125.32
time11.7119.0826.237.975.7632.921800
Wilc. (−)(−)(−)(−)(−)(=)
P3best137.26169.05170.96179.89149.41152.78138.85
worst140.61203.26203.26218.41168.95186.33138.85
mean138.66182.84185.42197.92158.37167.40138.85
time33.5523.8730.0210.496.5436.081800
Wilc. (−)(−)(−)(−)(−)(=)
P4best162.43196.85204.88226.05170.53183.62171.37
worst170.23245.80250.00258.02203.09210.71171.37
mean164.99223.95225.59242.58186.91194.91171.37
time34.5028.8934.5013.067.0242.581800
Wilc. (−)(−)(−)(−)(−)(−)
P5best179.65247.35226.14274.99199.79205.04181.12
worst186.72280.76353.94318.61252.69237.23181.12
mean182.72262.92276.88296.10217.15219.77181.12
time43.3834.0938.3815.657.6846.123600
Wilc. (−)(−)(−)(−)(−)(+)
P6best213.60299.47296.13325.72232.41237.32224.84
worst222.79337.47414.56370.05286.31303.44224.84
mean217.26315.47321.45346.80250.53258.68224.84
time51.1839.3544.1818.499.0851.803600
Wilc. (−)(−)(−)(−)(−)(−)
P7best216.73325.16320.01347.81239.15247.07240.41
worst233.77371.24468.80411.59308.12283.71240.41
mean227.51341.86385.99389.32261.79263.36240.41
time60.4344.7948.2641.409.5460.013600
Wilc. (−)(−)(−)(−)(−)(−)
P8best230.11361.97342.49399.73250.99265.98271.57
worst245.60425.02520.39467.24349.10299.35271.57
mean236.54386.86391.88438.72285.89281.40271.57
time68.7950.3451.1150.7410.0467.883600
Wilc. (−)(−)(−)(−)(−)(−)
P9best223.09371.63387.00425.22242.74248.83253.06
worst249.64496.11563.80480.73306.40292.31253.06
mean236.86410.42464.17448.83278.80271.19253.06
time79.1756.8054.5256.7410.1975.593600
Wilc. (−)(−)(−)(−)(−)(−)
1 The best value in each row is highlighted in bold. 2 (+) indicates that the compared algorithm is significantly better than OLELS-DE; (=) indicates no significant difference; (−) indicates that the compared algorithm is significantly worse.
Table 6. Average ranking of algorithms based on Friedman test across all test instances.
AlgorithmsOLELS-DEJADEEFDEMGDEWOAHHOCPLEX
Average Ranking1.3333 14.88895.77786.77783.22224.33331.6667
1 Values in bold indicate the best average ranking value.
Table 7. p-values obtained through post hoc methods include Bonferroni–Dunn, Holm, and Hochberg.
OLELS-DE v.s.zUnadjusted pBonferroni–Dunn pHolm pHochberg p
MGDE5.3460 10.0000010.0000010.000001
EFDE4.3640.0000130.0000760.0000640.000064
JADE3.4910.000480.0028820.0019210.001921
HHO2.9460.003220.0093180.0096590.009659
WOA1.8550.0436170.3817040.1272350.127235
CPLEX0.3270.7434210.4605240.7434210.743421
1 Values in bold indicate statistically significant differences with p-values below the significance level of 0.05.
Table 8. Scheduling performance of OLELS-DE and six compared methods on P1–P9 instances with a time-based stopping criterion, including cost metrics, CPU runtime, and Wilcoxon signed-rank test results (Wilc.). The units for the metrics “best”, “worst”, and “mean” are in dollars, and the unit for the “time” metric is in seconds.
InstanceMetricOLELS-DEJADEEFDEMGDEWOAHHOCPLEX
P1best102.19 1104.58108.18106.91102.19109.98102.19
worst104.98114.45115.85119.95116.06125.03102.19
mean103.79109.62113.32114.49108.03117.15102.19
time1801801801801801801800
Wilc. (−) 2(−)(−)(−)(−)(+)
P2best122.51130.79132.19137.30128.14139.48125.32
worst126.99158.14160.94167.84166.38166.54125.32
mean124.60146.47147.85153.38139.22152.28125.32
time1801801801801801801800
Wilc. (−)(−)(−)(−)(−)(−)
P3best136.51166.33152.33179.68141.46150.34138.85
worst139.58188.29196.48203.10178.78173.86138.85
mean137.95177.14176.01189.05155.24161.52138.85
time1801801801801801801800
Wilc. (−)(−)(−)(−)(−)(−)
P4best160.46194.68197.16210.44167.02183.09171.37
worst164.58226.63272.78242.50207.17198.69171.37
mean163.09212.57217.54223.83181.46189.33171.37
time1801801801801801801800
Wilc. (−)(−)(−)(−)(−)(−)
P5best178.67219.72234.93252.76190.95200.52181.12
worst184.64266.37271.31300.12217.29232.05181.12
mean180.26247.54251.03276.52201.98212.04181.12
time1801801801801801803600
Wilc. (−)(−)(−)(−)(−)(−)
P6best210.20267.38276.65303.20218.14232.41224.84
worst218.20314.19355.56345.45284.00288.56224.84
mean213.49292.08312.75325.75242.50256.79224.84
time1801801801801801803600
Wilc. (−)(−)(−)(−)(−)(−)
P7best216.80302.81305.87340.99229.43236.41240.41
worst230.65338.46467.32383.99279.39282.14240.41
mean224.13322.67338.49363.95251.28263.68240.41
time1801801801801801803600
Wilc. (−)(−)(−)(−)(−)(−)
P8best222.33332.50349.19374.07232.74245.37271.57
worst239.61370.42520.25447.49319.04301.38271.57
mean230.32354.36396.59410.16277.01273.71271.57
time1801801801801801803600
Wilc. (−)(−)(−)(−)(−)(−)
P9best222.05349.73367.29388.19235.89245.63253.06
worst237.99402.69556.54457.17305.85285.82253.06
mean229.37378.26454.98432.71264.13266.00253.06
time1801801801801801803600
Wilc. (−)(−)(−)(−)(−)(−)
1 The best value in each row is highlighted in bold. 2 (+) indicates that the compared algorithm is significantly better than OLELS-DE; (−) indicates that the compared algorithm is significantly worse.
Table 9. Scheduling performance of OLELS-DE with different population sizes N on P1–P9 instances. The results including cost metrics, CPU runtime, and Wilcoxon signed-rank test results (Wilc.). The units for the metrics “best”, “worst”, and “mean” are in dollars, and the unit for the “time” metric is in seconds.
InstanceMetricN = 50N = 100N = 150N = 200N = 250
P1best102.19 1102.19102.72103.13103.62
worst105.90105.31104.82105.31105.31
mean104.45104.26104.06104.05104.38
time5.026.9522.8843.9855.28
Wilc.(=) 2 (=)(=)(=)
P2best125.58124.47123.52125.10125.41
worst134.02129.82129.61130.14131.21
mean128.02126.03126.20127.21127.58
time7.5711.7139.8753.9768.60
Wilc.(−) (=)(−)(−)
P3best137.00137.26136.93136.87137.72
worst149.96140.61142.01141.44141.77
mean141.40138.66139.35139.35139.57
time16.9433.5545.2161.1977.20
Wilc.(−) (=)(=)(−)
P4best165.66162.43160.86160.52161.87
worst178.95170.23168.81167.09168.30
mean169.42164.99164.60164.63164.68
time19.6234.5051.8570.2889.03
Wilc.(−) (=)(=)(=)
P5best182.40179.65179.35177.72180.71
worst198.23186.72185.10185.90185.53
mean189.67182.72182.82182.59183.58
time22.1543.3857.9778.2599.59
Wilc.(−) (=)(=)(−)
P6best220.23213.60210.70213.00212.38
worst252.99222.79221.17224.40222.96
mean231.28217.26217.84218.13218.41
time25.8151.1876.1889.51113.35
Wilc.(−) (=)(=)(=)
P7best230.65216.73222.31223.16220.62
worst257.27233.77231.49232.85231.84
mean244.56227.51227.15226.90227.06
time28.1460.4381.1596.29134.02
Wilc.(−) (=)(−)(−)
P8best236.59230.11228.53227.48227.84
worst281.23245.60237.08237.11242.73
mean254.20236.54232.76233.48234.44
time30.4968.7991.18103.55151.82
Wilc.(−) (=)(=)(=)
P9best233.40223.09225.90224.19227.11
worst275.91249.64236.48231.82236.68
mean258.83236.86230.32228.66230.75
time29.3379.17110.07137.63179.98
Wilc.(−) (=)(=)(=)
1 The best value in each row is highlighted in bold. 2 (=) indicates no significant difference between N = 100 with other settings; (−) indicates that other settings of N are significantly worse than N = 100.
Table 10. Scheduling performance of OLELS-DE with different T max settings on P1–P9 instances. The results including cost metrics, CPU runtime, and Wilcoxon signed-rank test results (Wilc.). The units for the metrics “best”, “worst”, and “mean” are in dollars, and the unit for the “time” metric is in seconds.
InstanceMetric T max = 10 T max = 30 T max = 50 T max = 70 T max = 90 T max = 100
P1best102.19 1103.59102.19103.04103.62103.62
worst105.31104.82105.31106.71106.71108.00
mean104.24104.19104.26104.73104.70105.43
time13.279.596.956.196.135.15
Wilc.(=) 2(=) (−)(=)(−)
P2best124.89124.07124.47124.24124.84127.41
worst128.42127.08129.82130.21131.03135.25
mean126.36125.92126.03127.07127.19130.11
time22.9619.9811.7110.499.477.49
Wilc.(=)(=) (−)(−)(−)
P3best137.00136.69137.26137.96138.39137.90
worst140.80140.62140.61141.57142.01143.90
mean138.96139.08138.66139.69140.49141.14
time42.0837.6933.5524.3520.2417.22
Wilc.(=)(=) (−)(−)(−)
P4best162.20162.60162.43162.96164.03165.57
worst167.10168.43170.23169.32169.79174.16
mean164.63164.57164.99165.94166.32168.97
time48.7240.7834.5029.0723.7920.96
Wilc.(=)(=) (=)(−)(−)
P5best181.65179.17179.65181.65181.96183.98
worst187.81186.82186.72187.79191.58194.76
mean183.63182.49182.72184.91186.30190.36
time59.9748.9343.3836.8433.5928.54
Wilc.(=)(=) (−)(−)(−)
P6best212.19212.57213.60216.43213.72220.35
worst222.20221.61222.79225.24226.25232.17
mean217.92216.44217.26220.55220.86226.24
time73.7764.2551.1839.7532.2530.21
Wilc.(=)(=) (−)(−)(−)
P7best220.44223.29216.73225.00224.37228.76
worst238.60238.16233.77235.62242.73242.68
mean227.40228.96229.51231.18232.08236.14
time83.3070.5460.4354.9544.2740.29
Wilc.(=)(=) (−)(−)(−)
P8best227.59228.45230.11231.57228.41235.81
worst242.94246.04245.60247.92249.28257.33
mean234.98236.54237.79239.43242.99245.20
time91.4778.0868.7959.0849.3442.58
Wilc.(=)(=) (−)(−)(−)
P9best225.51222.71223.09229.56228.95230.58
worst242.04243.28249.64250.67249.88250.22
mean234.37234.80237.86239.86239.45246.38
time109.3389.0379.1756.4548.6443.60
Wilc.(=)(=) (=)(=)(−)
1 The best value in each row is highlighted in bold. 2 (=) indicates no significant difference between Tmax = 50 with other settings; (−) indicates that other settings of Tmax are significantly worse than Tmax = 50.
Disclaimer/Publisher’s Note: The statements, opinions and data contained in all publications are solely those of the individual author(s) and contributor(s) and not of MDPI and/or the editor(s). MDPI and/or the editor(s) disclaim responsibility for any injury to people or property resulting from any ideas, methods, instructions or products referred to in the content.