Abstract
This study presents a method for evaluating and optimizing the service network capacity of Urban Rail Transit Networks (URTNs) based on existing infrastructure conditions. By integrating passenger route choice behavior, the method assesses the network’s potential maximum capacity through the actual utilization rates of throughput capacity across various sections and routes. Furthermore, by incorporating route design and Transit-Oriented Development (TOD) strategies, the approach achieves a dual enhancement of network capacity and service quality. An optimization model was developed to maximize the network capacity while minimizing passenger travel costs, and it was solved using Adaptive Large Neighborhood Search (ALNS) and the Method of Successive Averages (MSA) algorithms. A case study of the Chongqing URTN demonstrated the model’s effectiveness. The results indicate that integrating route design and TOD strategies can significantly enhance the service capacity of urban rail networks. This method will assist decision-makers in understanding the current utilization status of the network’s capacity and evaluating its potential capacity. During TOD planning at stations, it simultaneously assesses changes in network capacity, thereby achieving a balance between land development, passenger demand, and the transportation system.
MSC:
90B06; 49Q22
1. Introduction
As Urban Rail Transit Networks (URTNs) in China transition from infrastructure expansion to networked operation phases, the operator’s primary focus has shifted from designing new lines to optimizing capacity utilization within existing networks [1]. Theoretically, maximizing network capacity requires dual alignment between train service supply and passenger demand in both quantitative dimensions and structural dimensions. However, in actual operations, most lines operate independently, with trains adhering to a model that stops at every station along its route. While capacity is allocated uniformly, the actual passenger demand between stations is uneven, often due to factors like urban job–housing separation [2].
Taking Chongqing’s URTN as an example, Figure 1 illustrates the section passenger flows observed on the Jiangtiao Suburban Railway Line (JTL) and urban metro line 5 (M5) during the morning peak period [3]. On the JTL, the highest flow is recorded in the inbound section between Shilinsi and Tiaodian at 1400 persons/h—more than twice the lowest section’s flow. Tiaodian Station, which functions as both the terminal and a transfer station for the JTL, handles about 46% of the line’s total passenger flow, with 93% of these passengers transferring to central city rail lines. M5 typically sees passenger flows originating in various residential clusters along the line and converging toward the central urban area. The highest inbound flows, reaching up to 10,000 persons/h, occur between Xietaizi and Xingfu Plaza, an area dominated by dense commercial and office buildings and strong employment demand, while several sections in the northern part record less than 2000 persons/h. Moreover, M5 exhibits a notable directional imbalance, with an imbalance coefficient of 1.92.
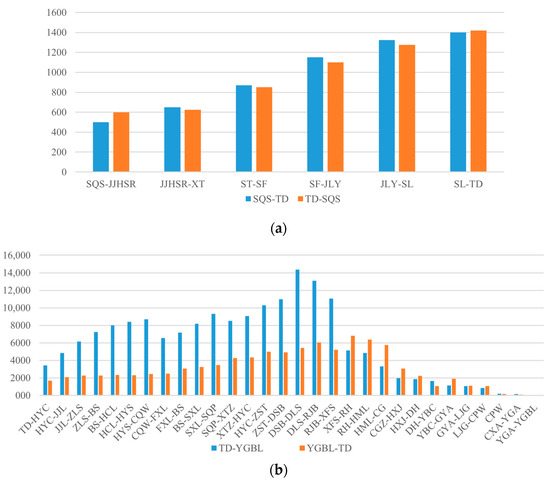
Figure 1.
Weekday peak section passenger flow in Chongqing’s URTN: (a) Metro Line 5; (b) Jiangtiao Line.
Long-distance commuters on the JTL demand faster routes that minimize both travel time and transfers, while operators seek to boost network capacity to attract more passengers, aiming to enhance quality and capacity simultaneously rather than sacrificing quality for sheer capacity. This study will explore two core questions:
1. Multi-strategy service designs. Integrating local, express/through, and short-turn operations can enhance operational flexibility and better address heterogeneous passenger demand [4,5]. However, in scenarios with spatially imbalanced ridership, these strategies risk reducing system-wide capacity utilization efficiency [6]. How can the service route design (SRD) enhance service network capacity (SNC) while simultaneously improving service quality under existing infrastructure conditions?
2. Transit-Oriented Development (TOD). Along the JTL, the relatively low concentration of residents (76,000) and jobs (47,000) within a 1 km radius of stations limits the potential for attracting passengers. TOD promotes mixed-use land development around railway stations to boost ridership and land value, gaining increasing attention in integrated rail network optimization research [7]. However, the relationship between TOD intensity and transportation capacity alignment deserves further investigation. How can the coordinated optimization of SRD and TOD achieve the best match between passenger demand and network capacity, thereby maximizing SNC?
To address these questions, scholars have conducted extensive research on evaluating and enhancing the SNC of URTNs. However, there is limited research that simultaneously considers the impact of changes in supply and demand on service capacity enhancement. The specific contributions of this study are as follows:
- Novel Approach and Strategy Integration: A novel method is proposed to enhance network service capacity, taking into account both the changes in capacity allocation caused by service route design and the changes in passenger demand brought about by TOD along suburban railway lines. By integrating SRD and TOD strategies, a multidimensional solution is provided, aimed at improving the overall service quality and capacity utilization efficiency of urban rail transit.
- Integrated Model and Algorithm: An integrated model is constructed, and an iterative solution algorithm combining Adaptive Large Neighborhood Search (ALNS), Simulated Annealing (SA), and Method of Successive Averages (MSA) is developed to solve it.
- Empirical Validation: The model and the algorithm are validated through a case study of the Chongqing rail transit network.
The remainder of this paper is organized as follows: Section 2 reviews the related literature; Section 3 defines and describes the research problem and presents the integrated model; Section 4 introduces the comprehensive solving strategy for the integrated optimization model; Section 5 validates the effectiveness of the model and algorithm through the Chongqing rail transit network case study; and the paper concludes with a summary of the research findings and suggestions for future research directions.
2. Literature Review
This section reviews the existing literature on the integration of rail network optimization and TOD planning.
In the context of rail network capacity enhancement, there are generally two main approaches to capacity enhancement: physical network upgrades and service network optimization [8]. Ye et al. [9] developed a bi-level model that simultaneously determines the location and capacity of the transfer infrastructure to be built considering the elastic demand in a multimodal transport network. Zhang [10] proposed a capacity optimization method for a high-speed rail line, focusing on balancing heterogeneity, running time, and reliability to enhance infrastructure efficiency. Liang et al. [11] developed a state-dependent dispatching optimization algorithm to systematically evaluate the impact of dispatching on capacity and operational quality, aiming to optimize infrastructure utilization and reduce redundant investments. In recent years, research trends have gradually shifted toward integrated approaches, such as combining physical network optimization with service network adjustments [12] and integrating timetable and stop pattern optimization to enhance overall network capacity [13]. Luo et al. [5] proposed a model to minimize passenger travel time by optimizing train stopping schedules for express and local services. Ulusoy et al. [14] proposed an integrated model combining all-stop, short-turn, and express services to address heterogeneous demand and optimize total costs. Feng et al. [15] developed an urban rail operation model incorporating short-turn and express services to minimize operator and passenger costs, validated through a case study in Chengdu. Cao et al. [16] introduced a timetabling model incorporating marshaling, skip-stop patterns, and robustness to minimize operator and user costs, validated using Beijing rail data. Cao et al. [17] established a model with three objectives: minimizing the waiting times and trip times of all passengers, as well as the travel times of trains, while analyzing the mechanism through which the skip-stop operation strategy affects the trip times of all passengers.
Capacity enhancement should focus not only on increasing supply but also on attracting passenger demand through integrated planning approaches. Rail transit and TOD exhibit a mutually reinforcing relationship. Rail transit’s high speed and reliable services influence residential location choices, while TOD layout around stations affects ridership patterns and network capacity utilization, particularly during peak periods. This bidirectional interaction has led to studies focusing on the relationship between land use and transportation capacity utilization. Caset et al. [12] combined the node-place model and trip-end modeling to analyze ridership in Flanders, highlighting the spatial and temporal factors affecting station development and TOD planning. Cervero [18] demonstrated that transit-based housing supply and mixed land use patterns positively impact ridership. Peng et al. [19] proposed a TOD investment model that incorporates TOD investments into the urban system equilibrium framework. Lin et al. [20] developed a multi-objective TOD planning model to optimize ridership, environmental quality, and social equity, revealing that ridership growth plateaus when the floor space ratio exceeds 70%. Chen et al. [21] proposed an integrated programming model for suburban rail network design and TOD zone planning within metropolitan areas, with the model determining physical routes, service frequencies, and station-area TOD plans simultaneously.
To better analyze the interrelationships among TOD, passenger flow, and rail transit systems, many recent studies have incorporated demand analysis and passenger behavior into their works. In terms of passenger flow prediction, Travel Demand Modeling (TDM) has been widely applied for predicting the demand in a study area or traffic analysis zone [22]. Lin [20] estimated rail station ridership by utilizing trip generation rates for various land use types and subway modal split rates. Tian et al. [23] analyzed the impact of land categories and mixed-use land on trip generation rates to estimate the demand for a transit system. Regarding passenger flow assignment, logit models are widely used to analyze passenger choice behavior in rail transit. Luo et al. [5] incorporated a logit model to analyze passenger choice behavior and evaluate transport capacity and energy efficiency. Cats et al. [24] used a multinomial logit model to assign passenger trips across different paths during service disruptions. Comfort-related indexes have also been applied to assess passenger transport service quality [25]. Additionally, Liu et al. [26] evaluated changes in service quality by considering factors such as vehicle crowding, seat availability, and transfers when calculating passengers’ trip costs.
In large-scale combinatorial and multi-objective optimization problems, exhaustive enumeration (e.g., the Exhaustive Search Algorithm (ESA) [14]) becomes infeasible as the solution space grows exponentially; hence, metaheuristic algorithms have become indispensable for such hybrid problems (Shadkam et al. [27]; Borhanifar et al. [28]). Table 1 summarizes previous work on objective functions, constraint designs, and algorithmic strategies for railway network optimization. To efficiently explore these high-dimensional search spaces, researchers have adopted metaheuristic techniques such as Genetic Algorithm (GA) [7,9], Exhaustive Search Algorithm (ESA) [14], Iterative Search Algorithm (ISA) [15], multi-objective GA [20], and Adaptive Large Neighborhood Search (ALNS) [21]. However, they still need to be adapted and extended to the integrated rail transit network and TOD planning context, incorporating explicit passenger flow assignment and capacity-constraint enforcement. I have repositioned the text to ensure Table 1 appears after its first citation.

Table 1.
Comparison of this study with previous work.
While prior research has established a theoretical foundation for capacity evaluation, the following critical gaps remain:
- Most studies focus on capacity calculations for individual lines or nodes, lacking granular analysis of dynamic capacity allocation mechanisms—such as turnback strategies and uneven demand distribution—within fully networked operations.
- Most studies focus on either supply-side optimization or demand-side planning, but few integrate both perspectives to maximize network service capacity.
- While some studies recognize the bidirectional relationship between rail transit and TOD, they fail to incorporate dynamic feedback loops into their optimization frameworks.
When viewing transportation through a supply–demand lens, congestion arises when demand outweighs supply [29]. This study addresses these gaps by proposing an integrated capacity enhancement framework that simultaneously optimizes service route design (supply-side) and TOD planning (demand-side), capturing their synergistic effects on network capacity improvement.
3. Problem Description and Model Construction
3.1. Problem Description
Our problem consists of three interconnected subproblems, as illustrated in Figure 2: the service network capacity (SNC) subproblem, the service network capacity enhancement (SNCE) subproblem, and the passenger assignment (PA) subproblem.
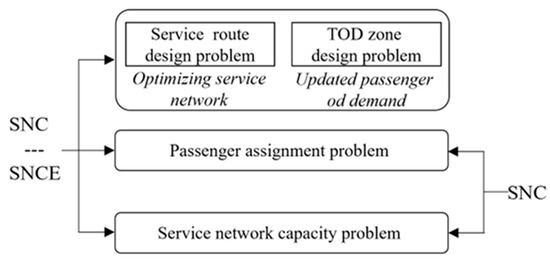
Figure 2.
The structure of the integrated problem.
- 1.
- SNC subproblem.
Railway capacity has been defined in various ways, but most studies agree that it reflects the maximum number of train services—or, more broadly, passengers—that a network can accommodate under given physical and operational conditions [30,31]. Passenger behavior, however, critically shapes service utilization and must be incorporated into any realistic capacity assessment [32]. In general, capacity emerges from the interplay of infrastructure characteristics, operational rules, and demand patterns. Accordingly, we define the service network capacity (SNC) of an Urban Rail Transit Network (URTN) as the maximum passenger throughput per unit time, given a fixed network layout, demand profile, and operational scheme. To evaluate SNC, our subproblem simultaneously accounts for train frequencies, vehicle capacities, and passenger path-choice behavior: a logit model quantifies travelers’ route preferences and generates flow distributions over the network. By extracting the k-shortest paths for each origin–destination pair, we pinpoint the most heavily loaded bottleneck links and compute the peak passenger flow they can sustain. The smallest of these link-flow limits then determines the network’s overall SNC.
- 2.
- SNCE subproblem.
SNC is influenced by two critical factors: passenger demand and the service network. To address the service network, this study tackles the SRD problem by designing multi-strategy service modes and allocating train frequencies reasonably under existing infrastructure conditions. On the other hand, TOD is introduced to enhance the attractiveness of stations, thereby influencing passenger demand by altering station catchment areas and increasing passenger flow. Specifically, TOD at suburban rail stations modifies the surrounding land use characteristics, which subsequently impacts passenger origin–destination (OD) demand. By integrating SRD and TOD strategies, this study aims to identify the optimal approach to enhancing SNC.
Taking the URTN shown in Figure 3 as an example, the physical network comprises six stations, two urban railways, and one suburban railway. The existing service network consists of service routes 1, 2, and 3: route 1 is a local service route for a suburban railway, and routes 2 and 3 are local service routes for an urban railway. Route 4 is an alternative route for a through-service line, and stations 5 and 8 are considered as alternative TOD stations. This study aims to evaluate the network’s service capacity and explore strategies to enhance its performance.
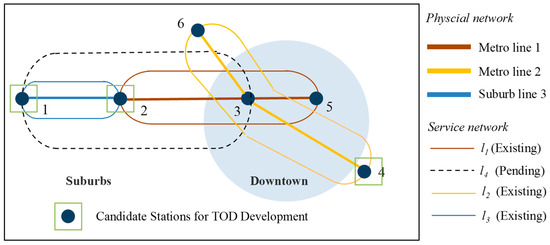
Figure 3.
An example network of a URTN.
- 3.
- PA subproblem.
Before optimizing passenger assignments, the service network must be constructed based on the operational plan. Figure 4 illustrates the complete service network, depicting a passenger’s journey during rail transit travel; passengers go through several stages, including entry, waiting, boarding, transfer, and alighting. We quantify passenger service quality on different feasible paths using passengers’ generalized travel costs (GTCs). Different weights are assigned to various components of the entire travel process, including travel time, number of transfers, and train crowding. For each path, the generalized travel cost is calculated in Section 3.4.2.
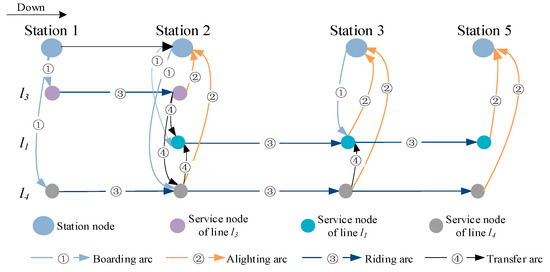
Figure 4.
Representation of directed service network.
3.2. Assumption
The following assumptions are made for our problem:
- For service route design, suburban railway lines permit through operations, while urban railway lines do not. Operational parameters for through services, such as train type, composition, average speed, passenger capacity, and unit operating costs, are predefined. The service frequencies for inbound and outbound directions are determined independently based on passenger demand, and the stop patterns are categorized into major-station stops and all-station stops.
- For TOD design, land use development occurs within a certain radius R around or above the selected stations. Key boundary conditions include that the available property types for each candidate station are predetermined through comprehensive assessment involving local planning standards and market analysis by industry experts. The maximum development capacity for each property type is determined in accordance with land use planning documents and regulatory frameworks, and all development plans are subject to a predefined budget, ensuring optimization within financial constraints.
- For passenger assignment, k-shortest paths are generated for each OD pair based on the candidate service network. Passengers prioritize paths with the lowest generalized travel cost. If the optimal path has insufficient capacity, the next best alternative will be selected.
3.3. Symbol Definition
The definitions of relevant sets, parameters, and variables are shown in Table 2 below.
Table 2.
Definition of sets, sets, indices, parameters, and variables.
3.4. Integrated Model
The aim is to reflect the goals and decision-making processes of two main stakeholders: rail transit operators and rail transit users (passengers). Specifically, rail transit operators aim to enhance the SNC without increasing the number of trains or other infrastructure investments. They achieve this by making decisions on the service network optimization plan, which includes the routes for through and express services, , and the frequency allocation, , of suburban trains across local, through, and express lines. Additionally, planners develop the TOD plan for stations, specifying station locations , urban function development types , and development volumes . On the other hand, rail transit users strive to maximize their travel utility by considering factors such as travel time, cost, transfer times, and comfort in order to select the optimal travel path.
3.4.1. Objective Function
The integrated model incorporates two primary objective functions: maximizing SNC and minimizing passengers’ total GTC.
- 1.
- Maximizing SNC of the URTN.
The calculation approach for SNC of the URTN based on the utilization rate is as follows:
Step 1: For each section in the network, calculate the section capacity based on train operation frequency () and train capacity of all services passing through that section.
Step 2: Obtain the passenger flow for each OD pair on each feasible path based on the passenger flow distribution results and calculate the actual passenger flow for each section .
Step 3: Calculate the capacity utilization rate for each section .
Step 4: For each feasible path of every OD pair, identify the bottleneck segment with the highest capacity utilization rate along the path and, accordingly, calculate the potential maximum transport capacity of that path.
Step 5: The network’s maximum SNC is obtained by summing the potential maximum capacities of all feasible paths between each OD pair.
- 2.
- Minimizing passengers’ total GTC.
To comprehensively evaluate these factors, the GTC of a passenger’s travel path can be used to quantify the travel utility. The travel path utility is then converted into a selection probability using the probability distribution mechanism of the logit model, determining the passenger’s choice among different travel paths.
In Equation (7), represents the total travel cost for all passengers; is the generalized travel cost of path from station to station ; and the decision variable is the passenger flow allocated to path for the OD pair.
- 3.
- Multi-Objective Optimization Strategy
Indeed, there can be a conflict between maximizing network throughput and minimizing passengers’ total travel cost—increasing passenger flow may lead to higher total travel costs. Lexicographic optimization methods have proven effective in multi-objective optimization problems within the transportation domain. Olusina et al. [33] applied lexicographic goal programming to urban transportation systems’ minimum cost multi-commodity network flow problems, successfully reducing travel time by 50%. Zhang et al. [34] employed lexicographic optimization for container terminal berth scheduling recovery problems, effectively balancing different customer demands and stakeholder interests. To systematically address the aforementioned objective conflicts, this study adopts a lexicographic optimization approach: network capacity maximization is assigned absolute priority, while passenger cost minimization serves as a secondary objective optimized within acceptable capacity constraints. This strategy eliminates the need for subjective weight assignment between conflicting objectives.
3.4.2. Constraints
The constraints are associated with three key aspects within the integrated model: service route design, TOD at stations, and the passenger assignment problem.
- 1.
- Constraints related to service route design.
Equation (8) restricts the number of new train routes. Equation (9) ensures that at least one direct train service must pass through and stop at the newly planned TOD station. Equation (10) enforces the following departure frequency constraint: For any section on the line, the number of trains passing through this section must not exceed the maximum frequency for that section. At the same time, to prevent passengers from waiting too long at certain stations, the logarithm of the number of trains running on each section must not be lower than the specified number of train pairs per unit time . Equation (11) imposes a turnback capacity constraint. Equation (12) represents the fleet size constraint, which limits the number of available trains for each type. This constraint ensures that the total transport capacity meets passenger demand using the minimum number of trains, and that the number of operated trains does not exceed the fleet size.
- 2.
- Constraints related to TOD plans at stations.
Equation (13) imposes a constraint on the total number of stations for planned TOD projects, while Equation (14) limits the available investment budget for TOD at stations. Equation (15) requires any station selected for TOD to establish at least one type of urban function. According to Equation (16), the development volume of a TOD project at station must satisfy the floor area ratio (FAR) constraint. Equation (17) further regulates the distribution of urban functions at stations by ensuring that for any alternative station , the development volume allocated to each urban function type remains within a specified range between and of the station’s total urban function volume. Equation (18) restricts the road traffic capacity around TOD stations, where represents the road traffic share ratio.
Moreover, OD passenger demand is updated when conducting TOD at suburban rail stations. The process involves two main steps: estimating additional travel demand from TOD and determining the passenger flow distribution.
First, a Travel Demand Model (TDM) based on land use characteristics is utilized to estimate the additional passenger attraction and passenger generation resulting from TOD [22], as shown in Equations (19) and (20).
where is the mode share of rail transit, and and represent the travel generation and attraction rates for property types. In practice, planners typically refer to the ITE Trip Generation Handbook [35] to estimate trip generation.
Subsequently, the classical gravity model is employed to predict the distribution of passenger flows across the entire railway network:
where is a calibration parameter, and is the impedance function that accounts for travel cost between stations.
- 3.
- Constraints related to passenger assignment problem.
In Equation (22), each feasible path is assigned the possibility of being selected. Equation (23) is the passenger count constraint for selecting path . Equation (24) is the non-negativity constraint: the allocated passenger flow must be non-negative. Equation (25) is the segment flow constraint; for any segment , the passenger flow passing through the segment must not exceed the total capacity of all trains. In Equation (26), factors reflecting the train’s crowding level and seat availability are taken into account by assigning different weights to in-vehicle time while also introducing a transfer penalty to capture the additional time required for transfers [36]. In this context, denotes the set of transfer stations on path from station o to station d; represents the total number of transfers on path . is the weight factor that accounts for passenger comfort (standing or seated) based on varying load coefficients, according to the findings from surveys by Wardman and Whelan [37]. and are the transfer penalty time parameters, with values based on the literature [26]. Equation (27) ensures that the probability that a passenger chooses path , represented by , lies between 0 and 1; here, is a parameter within the logit probability model utilized for this calculation.
4. Solving Strategy
This paper integrates the ALNS algorithm and the MSA algorithm to propose a heuristic iterative approach. The ALNS algorithm, developed by Ropke and Pisinger [38], combines large neighborhood search with an adaptive mechanism, enabling the dynamic selection of optimal neighborhood structures based on prior search outcomes [39]. In the context of rail transit, Canca [40] and Chen [21] have successfully applied ALNS to optimize network designs, demonstrating its ability to achieve high-quality solutions within practical timeframes. The MSA algorithm, an iterative method widely used in traffic assignment and network optimization problems, is particularly effective for addressing stochastic user equilibrium issues [41]. It iteratively updates flow distributions using a successive averaging approach, gradually converging to an equilibrium state by employing the reciprocal of the iteration count as the step size.
4.1. Input Data
The proposed integrated optimization algorithm requires several key input components to effectively solve the rail transit service network and TOD planning problem. These components provide the foundational data and constraints necessary for the optimization process. The main input components include the following:
- 1.
- The existing service network.
The existing service network consists of the service routes of local services for existing urban and suburban railways.
- 2.
- The set of candidate service routes for through/express lines.
Train schedules are composed of intervals between nodes and connecting nodes, with each node corresponding to a station in the physical network. Based on the direction, location, and capacity limitations of the turning stations in the physical network, turning stations with available directions for suburban through trains can be used as the starting or terminating stations for the schedules. By altering the combinations of starting and ending stations, a set of candidate service routes for through/express service lines is generated.
- 3.
- The set of candidate TOD station schemes.
Based on expert analysis and urban planning, combined with the current land use status, location characteristics, and development plans within the study scope of TOD candidate stations, a set of potential TOD rail transit stations i∈I is identified, along with the types and scale ranges of urban functions available for development. The specific steps include the following:
- Identifying TOD candidate stations within the study area.
- Utilizing the Gaode API platform and Python to obtain POI (Point of Interest) data around the stations.
- Assessing the current transportation and urban functions of the candidate TOD stations by analyzing the POI data.
- Assessing whether there is a need for land redevelopment or new functions and, based on the evaluation results, determining the available urban functional types and the development scope for each candidate station.
4.2. Upper-Level ALNS-SA Algorithm
The ALNS algorithm employs an adaptive weight adjustment mechanism based on operator performance. At each iteration, the operator is selected through a roulette wheel mechanism with probability , where represents the weight of operator . The weight is updated according to Equation (28) based on solution quality: operators receive update scores of for new global optima, for improvements over the current solution, and for non-improving solutions accepted by Simulated Annealing rules.
where is the reaction factor; represents the number of times operator is used in the current segment ; and indicates the scores awarded to the operator during iterations.
To generate neighboring solutions, the following 10 operators are designed based on the decision variables of the service network and TOD in the model:
Service Network Operators:
Each operator modifies the current service network by either adding new routes from candidate sets or adjusting service frequencies between different line types while ensuring capacity constraints and minimum service requirements are maintained:
- Randomly select a through-service route.
- Randomly select an express service route.
- Increase suburban local service frequency; decrease through/express service frequency.
- Increase through-service frequency; decrease local/express service frequency.
- Increase express service frequency; decrease through/local service frequency.
TOD Operators:
Each operator modifies the current TOD plan by changing station selection, adjusting development scale, or altering property configurations while maintaining feasibility constraints and development limits:
- Randomly change a candidate station for a TOD project.
- Randomly add a station for a TOD project.
- Randomly remove a station for a TOD project.
- Randomly change a property’s type in a TOD project.
- Randomly change a property’s development volume in a TOD project.
According to the neighborhood search rules, the new TOD design scheme and train operation scheme constructed using the operators must undergo feasibility checks to ensure that the new solution satisfies the constraint conditions.
The detailed procedure for the solution approach is given in Algorithm 1, as shown below.
| Algorithm 1: ALNS-SA Procedure | |
| Input: Algorithm parameters: Maximum Computation Time , Annealing End Temperature , Annealing Rate , Maximum Iteration Count , etc. | |
| Set of operators: | |
| Output: Optimal service routes, operation frequency, Tod plan, maximum service capacity. | |
| 1 | Initialization |
| 2 | Initial Temperature: ; |
| 3 | ALNS Iteration Count: ; |
| 4 | Generate the initial solutions and of the service network and Tod planning scheme. The initial solution for the service network includes the set of service routes of the through-service line and operation frequency of the through-service line and local service line . The initial solution for the TOD planning scheme includes station selection , development type , and development scale . The passenger flow demand matrix set and the initial effective transport capacity of the service network are also defined. |
| 5 | Neighborhood Search Iteration Loop |
| 6 | While and |
| 7 | Search for a new optimized solution for the service network or TOD planning scheme. |
| 8 | Randomly select a neighborhood search operator to generate a new solution or . Conduct repetitiveness and feasibility checks for the solution. If the solution has been previously generated, retrieve the corresponding result from the historical records and proceed directly to step 14. If the solution is new, continue to the next step. |
| 9 | If the TOD planning scheme has been updated, then generate a new OD distribution. |
| 10 | Passenger flow distribution based on MSA algorithm |
| 11 | Allocate passenger flow according to Algorithm 1, obtaining a new passenger flow on each section . |
| 12 | Calculate the new maximum service capacity . |
| 13 | Acceptance of solution and operator weight update |
| 14 | Compare the new objective value with the current objective value to decide whether to accept the new solution. |
| 15 | Based on whether the new solution is accepted, update the operator’s score and weight. |
| 16 | Update the temperature and iteration count. |
| 17 | |
| 18 | |
4.3. Lower-Level MSA Algorithm
When the number of passengers exceeds the available capacity of the train, it is necessary to design a reasonable loading order strategy to improve system efficiency and passenger experience [42]. For each OD pair, passengers are divided into groups, and each group is loaded according to the available remaining vehicle capacity. If a vehicle is full, passengers who are unable to board need to wait for the next one.
In complex rail transit networks, each OD pair usually has multiple feasible paths. Using a single-threaded mode to traverse all OD pairs and their paths, as well as calculate the generalized travel cost for each path, would be very time-consuming. Therefore, we adopt multi-threading technology to parallelize path generation for each OD pair, thereby significantly enhancing computational efficiency. The passenger flow distribution based on the MSA algorithm is shown in Algorithm 2 below.
| Algorithm 2: MSA Procedure | |
| Input: The updated rail service network set , the updated OD demand matrix , and the set of train service frequencies in the current service network. | |
| Output: The passenger flow in each section of the current rail service network is represented by . | |
| 1 | Initialization |
| 2 | Generate the valid path set for each OD pair: |
| 3 | Initialize all arc flows to 0 and calculate the arcs’ impedance under the condition of free flow. The generalized costs of all paths are calculated. |
| 4 | Use the PAP model to allocate passenger flow on the zero-flow network, obtaining the initial path flow . Then update the section flow and generalized costs of all paths . |
| 5 | Set the number of iterations and the convergence threshold cc > 0. |
| 6 | Iterative process |
| 7 | While do |
| 8 | Calculate the probability of selecting each feasible path for each OD pair based on the updated path costs. |
| 9 | Distribute the passenger flow for each OD pair across the feasible path , according to the selection probabilities. , |
| 10 | Update section passenger flow based on the current path flows. |
| 11 | Check for congestion: If the pre-allocated passenger flow exceeds the capacity of any section, disable the paths that contain the congested section and redistribute the passenger flow. |
| 12 | Update generalized travel cost for each path , and recalculate the passenger flow in each section. |
| 13 | Calculate algorithm parameters and update iteration step size |
| 14 | Calculate the current iteration step: . |
| 15 | Update section flow using successive averaging, determining the new starting point for the next iteration: . |
| 16 | Increase in iterations: . |
4.4. Stopping Criterion
The convergence and termination mechanisms of our bi-level optimization framework are critical for ensuring computational efficiency and solution quality. This section details the stopping criteria and theoretical guarantees for both algorithmic levels.
1. Upper-level ALNS-SA Algorithm
Termination Strategy: Multiple termination criteria, including computational time , maximum iteration limit , and annealing temperature threshold , ensure finite termination and prevent infinite loops.
Theoretical Guarantee: Under ideal slow annealing conditions, the algorithm can probabilistically converge to the global optimum. However, a strict convergence guarantee is challenging due to influences of initial temperature, decay rate, and perturbation operators. To address this, we implement adaptive temperature decay and dynamic perturbation operators, retain candidate optimal/suboptimal solutions during iterations, and incorporate local search to enhance solution diversity and stability.
2. Lower-level MSA Algorithm
Convergence and Efficiency: We employ multi-threaded parallel generation of feasible OD path sets and use relative root mean square error as a convergence criterion, where is the precision parameter determined by monitoring link-flow changes between consecutive iterations.
Theoretical Guarantee and Acceleration: Under monotonic continuous (convex) cost functions, the algorithm converges to equilibrium solutions satisfying Wardrop’s first principle, with unique solutions under strictly convex conditions. We implement step size with successive averaging update to enhance convergence speed and stability.
4.5. Integrated Solution Framework
The proposed bi-level optimization framework decomposes into strategic network design and TOD design decisions (upper level) and operational passenger flow assignment (lower level). As illustrated in Figure 5, the integration of ALNS-SA and MSA algorithms effectively addresses the complexity of repeated iterations between the upper and lower layers while overcoming the inefficiency of exact algorithms in large-scale instances.
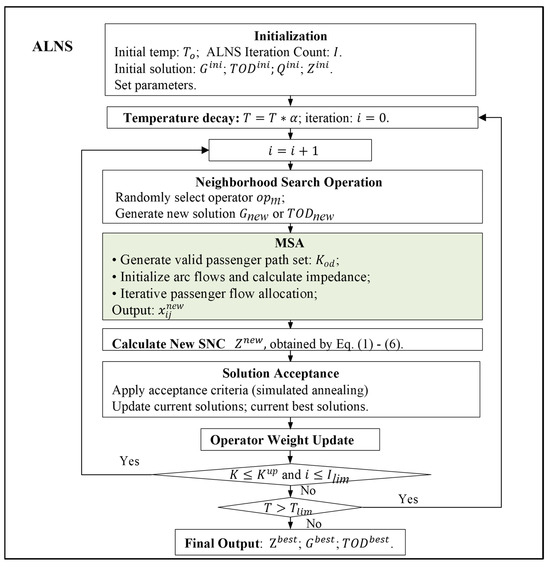
Figure 5.
Solution procedure for the integrated model.
During each iteration, the upper-level ALNS operators dynamically select and combine different neighborhood structures, adaptively adjusting the search strategy to generate new service network schemes or TOD plans. Based on the current service network optimization plan and passenger flow demand updated through TOD planning, the lower-level MSA algorithm applies logit model allocation rules to distribute passenger flows across the service network and calculate the network’s SNC.
This iterative process continues until multi-criteria termination conditions are satisfied, ensuring both numerical convergence at the lower level and adequate solution space exploration at the upper level. The convergence framework provides theoretical guarantees for traffic assignment equilibrium while maintaining practical computational efficiency for network design optimization.
5. Numerical Studies
We conducted multiple experiments to verify the effectiveness and performance of our model and algorithm. First, we designed small-scale test cases based on an example network (Section 5.1) to validate the algorithmic correctness and computational efficiency. Subsequently, we developed practical case studies (Section 5.2) by integrating the actual network conditions of the Chongqing metropolitan area rail transit system, as well as the current land use status and related planning along the Jiang-Tiao intercity railway, demonstrating the real-world applicability of our approach. Additionally, we performed comprehensive sensitivity analysis examining various parameters influencing the results, including variations in TOD planning parameters, passenger demand scenarios, and network configuration factors. The optimization results of the model and algorithm coded in Python 3.7 are obtained by invoking Gurobi 10.0 on a Lenovo Legion Y7000P (Lenovo Group Ltd., Beijing, China) with an Intel Core i7-12700H 2.70 GHz CPU and 32GB RAM.
5.1. Case Study
5.1.1. Instance Generation
We conducted experiments based on the example rail network shown in Figure 3 of Section 3.1. In this network, Stations 3, 4, and 5 are designated as turnaround stations, which can serve as terminal stations for through services. Both through-service (TS) routes and local service (LS) routes on the intercity mainline use the same type of rolling stock, with a total available fleet size of four trainsets per hour.
The candidate TOD stations are Stations 1, 2, and 4, with four representative property development types considered: hotel (H), business (B), office (O), and housing (HO). To account for passenger movement within stations, we specify the average walking times for boarding, alighting, and transfer activities at each station, as detailed in Table 3. The initial OD passenger demand distribution is shown in Figure 6. Model and algorithm parameters were separately calibrated and debugged, with final values listed in Table 4.
Table 3.
Average walking times within stations (min).
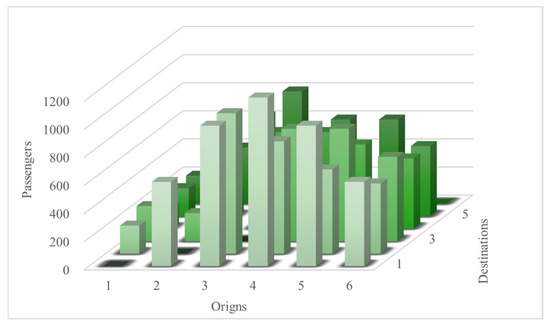
Figure 6.
Initial OD passenger demand matrix.
Table 4.
Value of parameters.
5.1.2. Algorithm Parameter Tuning
To ensure the algorithm’s stability and convergence during instance calculations, we systematically tested its key parameters while maintaining high computational efficiency. For the algorithm designed in this paper, the parameters affecting solving performance include the following: the parameter φ for adjusting operator weights, the operator update scores (τ1, τ2, τ3), and the iteration interval rr for operator score updates. Tests were conducted using different values for these parameters, with parameter ranges shown in Table 5. Various combinations of the three parameters were tested, with each parameter configuration evaluated through several runs.
Table 5.
Parameter values.
As shown in Figure 7 and Figure 8, under different parameter values, the test instances can achieve good optimal solutions across various parameter combinations, though with variations in computation time, demonstrating the effectiveness of the algorithm. Based on comparative experiments, this section selects , , and (10, 5, 2) for test instance calculations.
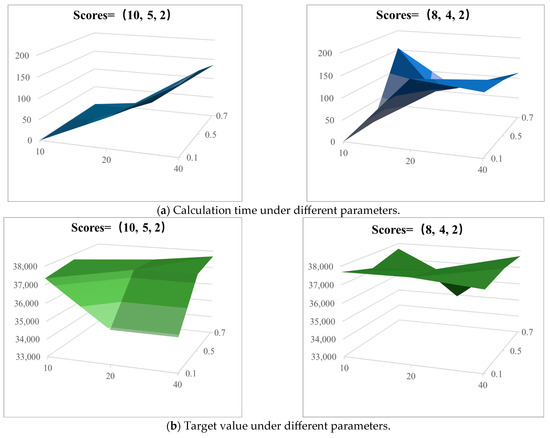
Figure 7.
Results under different algorithm parameters.
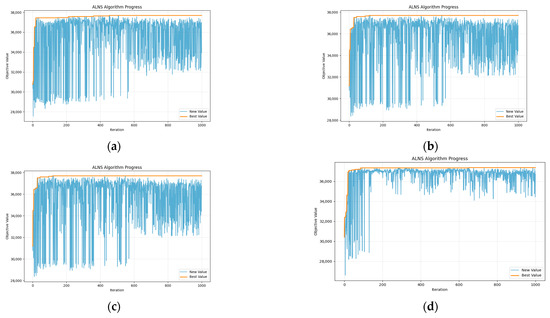
Figure 8.
Calculation process under different algorithm parameters: (a) , , (10, 5, 2); (b) , , (10, 5, 2); (c) , , (8, 4, 2); (d) , , (8, 4, 2).
5.1.3. Computational Results
We designed multiple test scenarios by varying relevant parameters, including the number of candidate paths for through-service routes, the number of candidate stations for TOD projects, and the scale of development. To facilitate analysis, we use the notation “TLTOD” to describe each case. For example, “NL1TOD2” indicates a case where the number of additional through-service routes and local service routes is limited to 1, and the number of stations eligible for new TOD is limited to 2. The optimal results for scenario TL1TOD2 are illustrated in Figure 9.
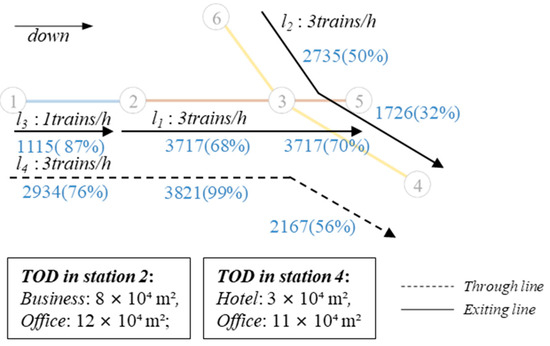
Figure 9.
Optimal results for scenario TL1TOD2.
Furthermore, the computational results across different scenarios are presented in Table 6. Based on the existing service network, scenario TL0TOD1, a reasonable TOD plan for stations enabled the network to achieve a 4.9% increase in passenger demand and a 5% increase in maximum service capacity. However, the passenger coverage rate decreased from 95% to 89%, leaving 2044 passengers (11% of total demand) unable to complete their trips. This indicates that the current service network design requires further optimization.
Table 6.
Multi-scenario computational results.
Under optimized service network conditions with limited capacity resources, scenario TL1TOD0 achieved 100% passenger coverage and a 26.3% increase in maximum service capacity. However, since passenger demand remained unchanged while service capacity increased, the overall capacity utilization rate decreased from 55.5% to 46%.
Under integrated optimization of the service network and TOD, scenarios TL1TOD1 and TL1TOD2 realized increases in passenger demand of 14.8% and 25%, respectively, along with overall service capacity improvements of 30% and 28.8%. Specifically, the NL1TOD1 optimization plan maximized network service capacity by operating through-service train : 1-2-3-5, with frequencies of 1 pair per hour for the local regional line and 3 pairs per hour for the through-service trains. Station 2 was selected for TOD project development, with a recommended retail commercial area of 60,000 m2 and an office area of 120,000 m2. In scenario NL1TOD2, adding two TOD projects resulted in more significant induced passenger demand, achieving a 25% increase in completed trips and an overall service capacity utilization rate of 56%. This indicates that the service network design aligns more effectively with passenger demand structure after TOD, demonstrating the superior performance of the integrated optimization approach.
We analyze the section flow (SF) and capacity utilization ratio (CR) under different scenarios. By comparing the passenger flow volumes in the sections, the relationship between changes in the service network, TOD, and the network capacity utilization can be understood.
The section flow in the existing scenario TL0TOD0 and the optimized scenario TL1TOD2 are denoted as CSF and OSF. Similarly, the service capacity is denoted as CSC and OSC, while the section capacity utilization rate is referred to as CCR and OCR. As shown in Figure 10, under limited capacity resources, the OSF in the optimized scenario is higher than the CSF in the existing scenario across all sections. The operation of the through-service line 1-2-3-4 enhances the service capacity of intervals (2, 3) and (3, 4). Additionally, the TOD at stations 2 and 4 increases the ridership attraction of these stations. In the existing scenario, the capacity utilization rate (CCR) of Section (2, 3), which has the highest upstream section flow, approaches 100%. However, in the optimized scenario, this rate decreases to 81%, alleviating the capacity strain. For Section (3, 4), although the passenger flow increases, the service capacity of this section also improves after the service network changes, resulting in a decrease in the capacity utilization rate (OCR) as both the numerator (passenger flow) and the denominator (service capacity) increase.
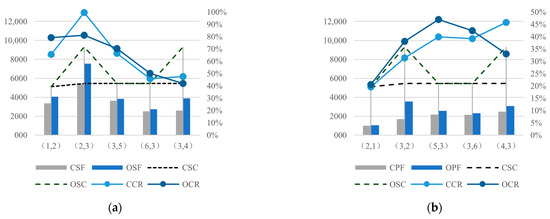
Figure 10.
Section flow and capacity utilization ratio: (a) inbound direction; (b) outbound direction.
5.2. Real-World Case Study
5.2.1. Instance Generation and Parameter Setting
To assist decision-makers in optimizing the service network and formulating station TOD strategies aimed at enhancing network capacity and service quality, this study focuses on two transit lines within Chongqing’s URTN: Line 5 (blue solid line) and the Jiangtiao Suburban Railway (green solid line), as shown in Figure 11. The JTL, with stations 1-2-3-4-5-6-7, is China’s first intercity railway to adopt dual-voltage technology, enabling automatic switching between 25 kV AC and 1.5 kV DC. This enables through-service compatibility with Metro Lines 4, 5, and the Circle Line, allowing trains to run directly between these lines. The M5 Line, with stations 7-8-9-...-38, comprises 32 stations and connects multiple major residential and employment districts in Chongqing’s main urban area.
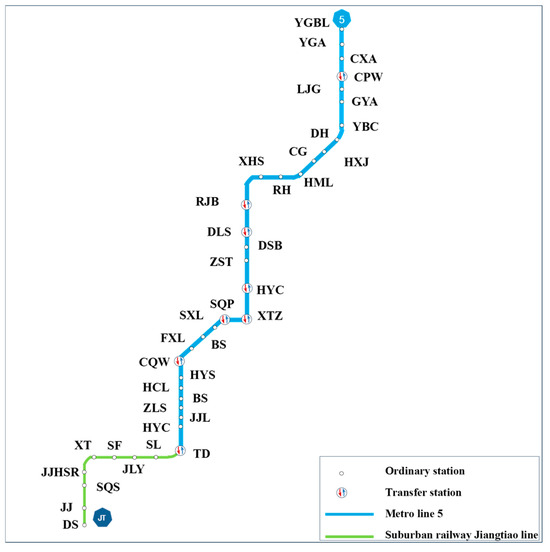
Figure 11.
Line 5 and the JT Line in Chongqing’s URTN.
Currently, both the JTL and M5 operate independently, utilizing a local service (LS) strategy with stops at every station. Based on the analysis of current passenger flow in Figure 1 and Section 1, there is a strong demand for through operation between the two lines. By adopting express service (ES) and through-service (TS) modes, capacity utilization efficiency can be improved, and passenger travel experiences can be enhanced. Considering the conditions for turnaround stations, Chongqing West Station (14), Shiqiaopu Station (18), and Yuanbo Center Station (31) are recommended as terminal stations for through operation. Under sufficient capacity conditions, both “all-stop” and “express” service modes can be implemented, optimizing operational efficiency and service quality.
Figure 12 illustrates the current land use conditions around selected stations along the JTL. At present, land development along the JTL remains incomplete. To maximize the JT Line’s role in guiding land development along its corridor, efforts should focus on optimizing land use around stations and enhancing the concentration of residential and employment functions. Based on current regional conditions and planning, Jiangjin High-Speed Railway Station (2), Shuangfu Station (4), Jiulongyuan Station (45), and Shilinsi Station (6) are identified as priority candidate stations for TOD.
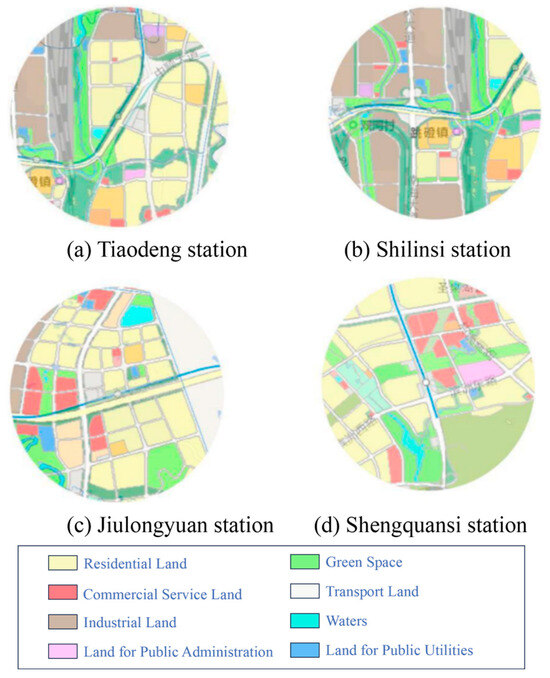
Figure 12.
Land use conditions around selected stations of the JT Line.
The key parameters are set as follows:
- Study Period: 1 h (morning peak).
- Total Train Fleet: A total of six trains, including local services on the JT Line, through services, and express services.
- Train Capacity: Local services on urban metro (Urban): 1820 passengers per train; local services on the intercity railway (Suburban) and through/express services: 1280 passengers per train.
- Turnback Capacity: Maximum turnback capacity at each station: 20 trains/hour; turnback time per train (unidirectional): 3 min/train.
- Section Capacity: Both the intercity railway and urban metro have a section capacity of 30 trains per hour (single direction).
- Operating Frequency: Maximum departure frequency: 20 trains/hour; minimum departure frequency: 2 trains/hour.
- Number of TOD Stations: One to three stations can be selected for TOD projects.
- Initial Passenger Demand Data: The calculation is based on the passenger demand during the morning peak, as shown in Figure 13.
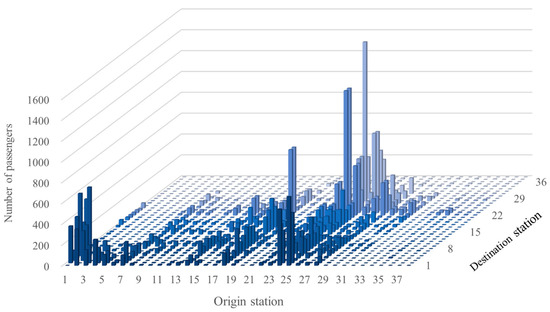 Figure 13. Passenger OD matrices in morning peak hour.
 - Trip Generation and Attraction Rates for Different Property Types: These rates are obtained from the ITE Trip Generation Manual.
For this instance, following the procedure in Section 5.1.2, we tuned key parameters by running the ALNS algorithm 20 times and plotted selected convergence curves in Figure 14. Based on these results, we adopted the optimal parameter settings for all subsequent computations.
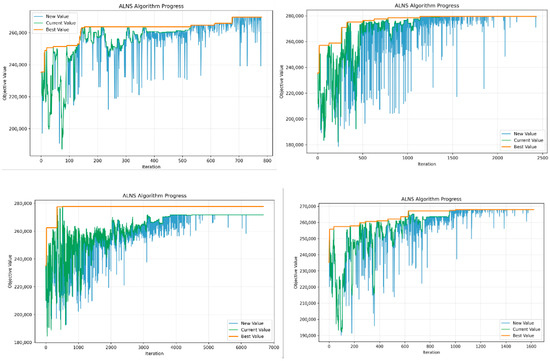
Figure 14.
Calculation process under different algorithm parameters.
5.2.2. Computational Results
The intercity railway JT Line consists of seven stations, with an average station spacing of 4.3 km, while rail transit Line 5 has 32 stations, with an average station spacing of only 1.6 km. In comparison, metro lines have more stations with shorter intervals between them. As a rapid transit line connecting the urban core to suburban towns, adopting an all-stop pattern for through services increases travel time and reduces the average operating speed of the line. Implementing an express service with fewer stops can more efficiently serve long-distance suburban commuters.
To further evaluate the impact of different stopping patterns on network capacity, various scenarios were generated based on optimized service network conditions. For example, T1E1TOD3 represents a scenario where one route of through service and express service is operated, with the number of TOD stations ranging from 1 to 3. The results are shown in Table 4. The details of T1E1TOD3 are obtained as follows:
- Network service capacity: 276,504 (passengers/h).
- Optimal service routes and frequency setting:Existing service route: M5 (TD to YGB), : 7-8-9-…-37-38, 13 trains/hour; JT Line (SQ to TD), : 1-2-3-4-5-6-7, 1 train/hour.Through-service route: (SQ to YB), : 1-2-3-4-…-30-31, 5 trains/hour;Express service route: (SQ to YB), : 1-2-4-7-14-18-34-31, 1 train/hour.
- TOD plans: The TOD around Station 2 consists of residential and office buildings, each with a volume of 30 (104 m2).
- Computation time: 4684 s.
The operational plan for T1E1TOD3 includes four service routes, comprising two express service routes and two local service routes. Notably, the route from SQ to YB offers both through and express services. On service route , the express trains stop at only 8 stations, while the through route stops at all 31 stations along its path. The difference in stop counts between the two express routes may be due to passenger demand for medium- to long-distance travel. Skipping stops allows the routes to provide capacity while still meeting passenger needs.
As shown in Table 7, compared with the existing scenario T0E0TOD0, under T1E1TOD3, the actual completed passenger trips increased by 5.2%, and the network service capacity improved by 54.3%. Scenario T0E0TOD3 tested the impact of TOD project development on network service capacity. From the operator’s perspective, developing TOD projects improves passenger flow structure and enhances network service capacity. However, from the passengers’ perspective, nearly 20% of trips during the peak hour were not completed, making it an evidently suboptimal solution. Additionally, T1E0TOD3 represents the optimized scenario without requiring express trains to operate. The results indicate that express trains were not assigned to the rapid line, and the service capacity further increased to 280,523. A plausible explanation is that mixed operations of express and regular trains reduce overall network capacity.
Table 7.
Results under different scenarios.
5.2.3. Multiple Scenarios for Changing the TOD Constraints
To further analyze the impact of TOD scale and property types on network service capacity and passenger flow, various scenarios were generated by modifying the constraints of TOD design. The relevant parameters and results of the tests are listed in Table 8. For instance, T4V30TOD3 indicates that there are four candidate property types, the developable volume for each type is 30 (104 m2), and TOD projects are allowed at a maximum of three stations.
Table 8.
Results for changing the TOD constraints.
The calculation results show that under different TOD constraints, the proposed model and algorithm successfully identified the corresponding optimized service network and TOD plans, achieving the goal of improving network service capacity. Under the current operational resource conditions, the expansion of the developable scale does not lead to a significant improvement in network service capacity. This indicates that the service networks and passenger flow structures corresponding to the optimized solutions are already approaching the upper limit of service capacity. Taking T4V10TOD3 and T4V30 TOD3 as examples, the latter expands the development scale limit from 10 (104 m2) to 30 for each type. However, calculation results show no significant improvement in network service capacity or passenger coverage. This suggests that excessive TOD requires further upgrades to the service network, such as increasing train frequency, to support larger development scales effectively.
In summary, the current results are significant in two main aspects. First, the proposed model and algorithm effectively quantify the impact of different service network plans and passenger demand changes on network service capacity. The case study demonstrates that integrating the optimization of service networks and station-based TOD can enhance network service capacity without requiring additional vehicle procurement. Second, this study provides decision-makers with a scientific basis for formulating rational TOD plans, enabling them to make more informed planning decisions in practice. Particularly under resource-constrained conditions, the approach aids in effectively balancing the property development scale with the capacity demands of the rail transit system.
6. Conclusions
This research proposes an innovative method for enhancing rail transit network capacity through the integration of service network optimization and Transit-Oriented Development (TOD) planning, making significant contributions to the field of urban transportation planning. The comprehensive model effectively quantifies the impact of various service strategies, including through and express services connecting suburban areas to city centers, train frequency allocation, and TOD planning encompassing site selection, functional planning, and development scale. An iterative solution algorithm combining ALNS, SA, and MSA was developed. The model’s effectiveness was validated through a case study of Chongqing’s URTN, with results demonstrating that this integrated approach can significantly enhance network service capacity and service quality under limited resource conditions. This integrated approach provides urban planners and transportation authorities with a robust tool to balance transportation functions, urban development, and passenger travel needs, thereby promoting sustainable urban development.
However, several areas require further investigation in future research. First, further investigation into TOD decision-making mechanisms and ridership clustering characteristics could enhance passenger demand forecasting accuracy. Second, research on network capacity enhancement under disruption scenarios and dynamic conditions will provide crucial support for improving system resilience [43]. Finally, algorithm scalability and speed can be enhanced through warm-start and decomposition techniques, the development of more efficient algorithms, high-performance C++ implementations, intermediate-result caching, and GPU acceleration—enabling the model to handle larger, more diverse metropolitan networks.
Author Contributions
Conceptualization, L.W. and Q.P.; methodology, L.W. and Q.P.; software, L.W.; validation, L.W. and Z.P.; formal analysis, L.W. and Z.P.; investigation, Z.P.; resources, Z.P.; data curation, L.W.; writing—original draft preparation, L.W.; writing—review and editing, L.W. and Z.P.; visualization, Z.P.; supervision, Q.P. and L.L.; project administration, L.L.; funding acquisition, L.L. All authors have read and agreed to the published version of the manuscript.
Funding
This work was supported by the National Key Research and Development Program of China (Grant No. 2022YFB4300502) funded by the Ministry of Science and Technology of China (Recipient: Prof. Qiyuan Peng).
Data Availability Statement
The datasets presented in this article are not readily available because the data are part of an ongoing study. Requests to access the datasets should be directed to liwenwang@my.swjtu.edu.cn.
Acknowledgments
Thank you to Yang for helping the authors in the process of data collection. Their contributions are not sufficiently direct for them to be included among the authors of this article.
Conflicts of Interest
The authors declare no conflicts of interest. The authors have identified and declared that there are no personal circumstances or interests that may be perceived as inappropriately influencing the representation or interpretation of the reported research results. The funders had no role in the design of the study; in the collection, analyses, or interpretation of data; in the writing of the manuscript; or in the decision to publish the results.
References
- Wang, B.; Huang, J.; Xu, J. Capacity Optimization and Allocation of an Urban Rail Transit Network Based on Multi-Source Data. J. Ambient Intell. Humaniz. Comput. 2019, 10, 373–383. [Google Scholar] [CrossRef]
- Zhang, M.; Wang, Y.; Su, S.; Tang, T.; Ning, B. A Short Turning Strategy for Train Scheduling Optimization in an Urban Rail Transit Line: The Case of Beijing Subway Line 4. J. Adv. Transp. 2018, 2018, 5367295. [Google Scholar] [CrossRef]
- Wu, X.; Zhai, C.; Zhang, J. Analysis of Spatial-Temporal Characteristics of Passenger Flow in Chongqing Based on Suburban Railway Jiangtiao Line. Railw. Transp. Econ. 2024, 46, 192–200. [Google Scholar] [CrossRef]
- Gao, Y.; Yang, L.; Gao, Z. Energy Consumption and Travel Time Analysis for Metro Lines with Express/Local Mode. Transp. Res. Part D Transp. Environ. 2018, 60, 7–27. [Google Scholar] [CrossRef]
- Luo, Q.; Hou, Y.; Li, W.; Zhang, X. Stop Plan of Express and Local Train for Regional Rail Transit Line. J. Adv. Transp. 2018, 2018, 3179321. [Google Scholar] [CrossRef]
- Zhu, Y.; Mao, B.; Bai, Y.; Chen, S. A Bi-Level Model for Single-Line Rail Timetable Design with Consideration of Demand and Capacity. Transp. Res. Part C Emerg. Technol. 2017, 85, 211–233. [Google Scholar] [CrossRef]
- Huang, X.; Liang, Q.; Feng, Z.; Chai, S. A TOD Planning Model Integrating Transport and Land Use in Urban Rail Transit Station Areas. IEEE Access 2020, 9, 1103–1115. [Google Scholar] [CrossRef]
- Lai, Y.-C.; Barkan, C.P.L. Comprehensive Decision Support Framework for Strategic Railway Capacity Planning. J. Transp. Eng. 2011, 137, 738–749. [Google Scholar] [CrossRef]
- Ye, J.; Jiang, Y.; Chen, J.; Liu, Z.; Guo, R. Joint Optimisation of Transfer Location and Capacity for a Capacitated Multimodal Transport Network with Elastic Demand: A Bi-Level Programming Model and Paradoxes. Transp. Res. Part E Logist. Transp. Rev. 2021, 156, 102540. [Google Scholar] [CrossRef]
- Zhang, J. Analysis on Line Capacity Usage for China High Speed Railway with Optimization Approach. Transp. Res. Part Policy Pract. 2015, 77, 336–349. [Google Scholar] [CrossRef]
- Liang, J.; Martin, U.; Cui, Y. Increasing Performance of Railway Systems by Exploitation of the Relationship between Capacity and Operation Quality. J. Rail Transp. Plan. Manag. 2017, 7, 127–140. [Google Scholar] [CrossRef]
- Caset, F.; Blainey, S.; Derudder, B.; Boussauw, K.; Witlox, F. Integrating Node-Place and Trip End Models to Explore Drivers of Rail Ridership in Flanders, Belgium. J. Transp. Geogr. 2020, 87, 102796. [Google Scholar] [CrossRef]
- Lordieck, J.; Nold, M.; Corman, F. Microscopic Railway Capacity Assessment of Heterogeneous Traffic under Real-Life Operational Conditions. J. Rail Transp. Plan. Manag. 2024, 30, 100446. [Google Scholar] [CrossRef]
- Ulusoy, Y.Y.; Chien, S.I.-J.; Wei, C.-H. Optimal All-Stop, Short-Turn, and Express Transit Services under Heterogeneous Demand. Transp. Res. Rec. 2010, 2197, 8–18. [Google Scholar] [CrossRef]
- Feng, T.; Tao, S.; Li, Z. Optimal Operation Scheme with Short-Turn, Express, and Local Services in an Urban Rail Transit Line. J. Adv. Transp. 2020, 2020, 5830593. [Google Scholar] [CrossRef]
- Cao, Z.; Ceder, A.; Li, D.; Zhang, S. Robust and Optimized Urban Rail Timetabling Using a Marshaling Plan and Skip-Stop Operation. Transp. Transp. Sci. 2020, 16, 1217–1249. [Google Scholar] [CrossRef]
- Cao, Z.; Yuan, Z.; Li, D. Estimation Method for a Skip-Stop Operation Strategy for Urban Rail Transit in China. J. Mod. Transp. 2014, 22, 174–182. [Google Scholar] [CrossRef]
- Cervero, R. Transit-Oriented Development’s Ridership Bonus: A Product of Self-Selection and Public Policies. Environ. Plan. Econ. Space 2007, 39, 2068–2085. [Google Scholar] [CrossRef]
- Peng, Y.-T.; Li, Z.-C.; Choi, K. Transit-Oriented Development in an Urban Rail Transportation Corridor. Transp. Res. Part B Methodol. 2017, 103, 269–290. [Google Scholar] [CrossRef]
- Lin, J.J.; Gau, C.C. A TOD Planning Model to Review the Regulation of Allowable Development Densities around Subway Stations. Land Use Policy 2006, 23, 353–360. [Google Scholar] [CrossRef]
- Chen, X.; Dong, C.; Tao, S.; Peng, Q.; Liu, J. Integrated Transit-Oriented Development (TOD) with Suburban Rail Network Design Problem for Maximizing Profits. Transp. Lett. 2024, 13, 1318–1337. [Google Scholar] [CrossRef]
- Mukherjee, J.; Raghuram Kadali, B. A Comprehensive Review of Trip Generation Models Based on Land Use Characteristics. Transp. Res. Part Transp. Environ. 2022, 109, 103340. [Google Scholar] [CrossRef]
- Tian, G.; Park, K.; Ewing, R.; Watten, M.; Walters, J. Traffic Generated by Mixed-Use Developments—A Follow-Up 31-Region Study. Transp. Res. Part Transp. Environ. 2020, 78, 102205. [Google Scholar] [CrossRef]
- Cats, O.; Koppenol, G.-J.; Warnier, M. Robustness Assessment of Link Capacity Reduction for Complex Networks: Application for Public Transport Systems. Reliab. Eng. Syst. Saf. 2017, 167, 544–553. [Google Scholar] [CrossRef]
- Huang, W.; Shuai, B. A Methodology for Calculating the Passenger Comfort Benefits of Railway Travel. J. Mod. Transp. 2018, 26, 107–118. [Google Scholar] [CrossRef]
- Liu, J.; Schonfeld, P.M.; Zhan, S.; Du, B.; He, M.; Wang, K.C.P.; Yin, Y. The Economic Value of Reserve Capacity Considering the Reliability and Robustness of a Rail Transit Network. J. Transp. Eng. Part Syst. 2023, 149, 04023046. [Google Scholar] [CrossRef]
- Shadkam, E.; Khajooei, S.; Rajabi, R. The New TOPCO Hybrid Algorithm to Solve Multi-Objective Optimisation Problems: The Integrated Stochastic Problem of Production-Distribution Planning in the Supply Chain. Int. J. Comput. Syst. Eng. 2021, 6, 143. [Google Scholar] [CrossRef]
- Borhanifar, Z.; Shadkam, E. The New Hybrid COAW Method for Solving Multi-Objective Problems. Int. J. Found. Comput. Sci. Technol. 2015, 5, 15–22. [Google Scholar] [CrossRef]
- Bagloee, S.A.; Sarvi, M. A Modern Congestion Pricing Policy for Urban Traffic: Subsidy plus Toll. J. Mod. Transp. 2017, 25, 133–149. [Google Scholar] [CrossRef]
- Khadem Sameni, M.; Moradi, A. Railway Capacity: A Review of Analysis Methods. J. Rail Transp. Plan. Manag. 2022, 24, 100357. [Google Scholar] [CrossRef]
- Pouryousef, H.; Lautala, P.; White, T. Railroad Capacity Tools and Methodologies in the U.S. and Europe. J. Mod. Transp. 2015, 23, 30–42. [Google Scholar] [CrossRef]
- Jia, F.; Jiang, X.; Li, H.; Yu, X.; Xu, X.; Jiang, M. Passenger-Oriented Subway Network Capacity Calculation and Analysis Based on Simulation. Transp. Lett. 2021, 13, 555–567. [Google Scholar] [CrossRef]
- Olusina, J.O.; Nse, O.U. Solving Minimum Cost Multi-Commodity Network Flow Problem Using Lexicographic Goal Programming Approach. J. Appl. Sci. Environ. Manag. 2018, 22, 414–420. [Google Scholar] [CrossRef][Green Version]
- Zhang, Q.; Zeng, Q.; Yang, H. A Lexicographic Optimization Approach for Berth Schedule Recovery Problem in Container Terminals. Transport 2016, 31, 76–83. [Google Scholar] [CrossRef]
- ITE. ITE Trip Generation Handbook, 3rd ed.; Institute of Transportation Engineers: Washington, DC, USA, 2017. [Google Scholar]
- Garcia-Martinez, A.; Cascajo, R.; Jara-Diaz, S.R.; Chowdhury, S.; Monzon, A. Transfer Penalties in Multimodal Public Transport Networks. Transp. Res. Part Policy Pract. 2018, 114, 52–66. [Google Scholar] [CrossRef]
- Wardman, M.; Whelan, G. Twenty Years of Rail Crowding Valuation Studies: Evidence and Lessons from British Experience. Transp. Rev. 2011, 31, 379–398. [Google Scholar] [CrossRef]
- Ropke, S.; Pisinger, D. An Adaptive Large Neighborhood Search Heuristic for the Pickup and Delivery Problem with Time Windows. Transp. Sci. 2006, 40, 455–472. [Google Scholar] [CrossRef]
- Sun, M.; Xu, Y.; Xiao, F.; Ji, H.; Su, B.; Bu, F. Optimizing Multi-Echelon Delivery Routes for Perishable Goods with Time Constraints. Mathematics 2024, 12, 3845. [Google Scholar] [CrossRef]
- Canca, D.; De-Los-Santos, A.; Laporte, G.; Mesa, J.A. An Adaptive Neighborhood Search Metaheuristic for the Integrated Railway Rapid Transit Network Design and Line Planning Problem. Comput. Oper. Res. 2017, 78, 1–14. [Google Scholar] [CrossRef]
- Hamdouch, Y.; Ho, H.W.; Sumalee, A.; Wang, G. Schedule-Based Transit Assignment Model with Vehicle Capacity and Seat Availability. Transp. Res. Part B Methodol. 2011, 45, 1805–1830. [Google Scholar] [CrossRef]
- Binder, S.; Maknoon, Y.; Bierlaire, M. Exogenous Priority Rules for the Capacitated Passenger Assignment Problem. Transp. Res. Part B Methodol. 2017, 105, 19–42. [Google Scholar] [CrossRef]
- Liu, X.; Chen, J.; Du, B.; Yan, X.; Peng, Q.; Shen, J. Resilience Assessment of Urban Rail Transit Stations Considering Disturbance and Time-varying Passenger Flow. Comput.-Aided Civ. Infrastruct. Eng. 2025, 40, 1627–1651. [Google Scholar] [CrossRef]
Disclaimer/Publisher’s Note: The statements, opinions and data contained in all publications are solely those of the individual author(s) and contributor(s) and not of MDPI and/or the editor(s). MDPI and/or the editor(s) disclaim responsibility for any injury to people or property resulting from any ideas, methods, instructions or products referred to in the content. |
© 2025 by the authors. Licensee MDPI, Basel, Switzerland. This article is an open access article distributed under the terms and conditions of the Creative Commons Attribution (CC BY) license (https://creativecommons.org/licenses/by/4.0/).