Abstract
Hepatitis C is an infectious liver disease which contributes to an estimated 400,000 deaths each year. The disease is caused by the hepatitis C virus (HCV) and is spread by direct blood contact between infected and susceptible individuals. While the magnitude of its impact on human populations has prompted a growing body of scientific work, the current epidemiological models of HCV transmission among injecting drug users treat risk behaviors as fixed parameters rather than as outcomes of a dynamic, decision-making process. Our study addresses this gap by constructing a game-theoretic model to investigate the implications of voluntary participation in clean needle exchange programs on the spread of HCV among this high-risk population. Individual drug users weigh the (perceived) cost of clean equipment usage relative to the (perceived) cost of infection, as well as the strategies adopted by the rest of the population, and look for a selfishly optimal level of protection. We find that the spread of HCV in this population can theoretically be eliminated if individuals use sterile equipment approximately two-thirds of the time. Achieving this level of compliance, however, requires that the real and perceived costs of obtaining sterile equipment are essentially zero. Our study demonstrates a robust method for integrating game theory with epidemiological models to analyze voluntary health interventions. It provides a quantitative justification for public health policies that eliminate all barriers—both monetary and social—to comprehensive harm-reduction services.
Keywords:
game theory; hepatitis C; injecting drug use; Nash equilibrium; public health; sensitivity analysis MSC:
91A22; 92D30
1. Introduction
An estimated 71 million people worldwide are infected with hepatitis C, and most of them do not know [1], which makes combating the spread of the disease quite a challenge. There are a number of factors contributing to this lack of awareness. Hepatitis C is primarily a long-term, chronic disease that lacks acute symptoms; unless individuals proactively seek diagnosis and treatment, they may remain unaware of their infection status for many years. Furthermore, the virus is most commonly spread through the sharing of contaminated equipment for drug injection. As a result, the global distribution of disease is uneven, being more highly concentrated in areas with a large drug-using population. The high prevalence of hepatitis C among injecting drug users presents a unique opportunity for targeted intervention. Can needle exchange programs halt the spread of hepatitis? Will individual drug users, acting in their own self-interest, voluntarily use clean needles at a high enough rate to make a difference?
Hepatitis C is an infectious liver disease caused by the hepatitis C virus (HCV), a single-strand RNA virus in the family flaviviridae [2]. HCV is one of several types of viral hepatitis that affect human populations and are a leading cause of death worldwide [3]. Infection causes acute symptoms in a small percentage of cases, but approximately 80% of individuals progress to chronic infection and are subsequently at higher risk for liver disease, cirrhosis, hepatocellular carcinoma and other liver cancers, and general liver failure [2,4,5,6,7]. Infection with HCV is indicated in 40% of chronic liver disease and the majority of liver transplants in the United States and much of Europe [2]. Unlike hepatitis A and B, there is currently no effective vaccine for HCV [3,4]. Moreover, HCV rapidly mutates and occurs in six known genotypes with dozens of subtypes, so the future development of a vaccine remains challenging and unlikely [2]. Recent developments in antiviral treatments have made curing HCV infections possible, yet such treatments remain cost-prohibitive [7], are ineffective in up to 30–50% of patients, and are known to cause severe side effects [4,8]. As a result, prevention of virus transmission is a key factor in controlling the disease and thus merits further study.
Viral hepatitis killed 1.45 million people in 2013, and HCV in particular has become increasingly deadly in the past two decades, killing between 350 and 400 thousand people each year [1]. Despite contributing to more human deaths annually than tuberculosis, HIV, and malaria, hepatitis has historically received less funding and study than other epidemic diseases [3,9]. Data from the expansive Global Burden of Disease study show an estimated increase of 63% in deaths attributable to viral hepatitis from 1990 to 2013, making it the seventh leading cause of death worldwide. Among the various strains of hepatitis, more than 90% of reported deaths are attributable to either hepatitis B or C [3]. The slow progression of the disease may contribute to its relatively low prioritization; the occurrence of serious complications and steep health-care costs due to HCV-induced disease is often several decades removed from the time of infection [6,7].
Until its relatively recent discovery in 1989, the hepatitis C virus spread throughout human populations unchecked [2,7,10]. Studies of infected individuals indicate that prior to its formal identification, HCV was most commonly transmitted through unknowingly contaminated blood and blood components in healthcare settings [8,11]. Widespread testing of blood supplies for HCV was implemented in the United States and other developed nations in 1992, and consequently this source of infection is no longer a significant threat [8], although therapeutic injections and transfusions of contaminated blood remain a cause of HCV transmission in the developing world [7]. Due to the low incidence of acute symptoms, however, most individuals infected with hepatitis C are unlikely to receive testing, counseling, or treatment [10,11]. These individuals may be unaware that they are carrying the disease, thereby increasing the chance that they will pass the infection to others. Currently, the primary means of transmission is through the sharing of needles and other drug paraphernalia by injecting drug users (IDUs) [7,8,11], among whom disease prevalence is estimated at up to 90% [2,8,12,13]. Individuals entering the drug-using population for the first time are thus at particularly high risk for infection. As such, pre-infection interventions such as low- or no-cost needle exchange programs have the potential to disrupt the transmission of HCV within high-risk populations.
Since HCV can only be transmitted through blood, the most common means of infection is the use of contaminated needles, a frequent occurrence among IDUs. Upwards of 90% of people who have been injecting drugs for more than 5 years are infected with HCV [14]. There are a number of less prevalent routes of transmission that account for a small portion of the HCV-infected population. For example, an infant born to an HCV-positive mother has a 5% chance of becoming infected [14]. Other possible ways of contracting HCV include contact with infected equipment while getting tattoos or body piercings, as well as accidental contact with infected needles in a healthcare setting. The risk of infection in all of these situations is low because a single instance of contact with infected equipment carries an infection risk of 1.8% [14]. The repeated use of needles by injecting drug users, however, places this population at a significantly higher risk of infection.
Egypt has the highest rate of HCV prevalence that has ever been reported, at 22% of the general population [7]. This rate is unusually high compared to the worldwide estimate of HCV-infected individuals of roughly 2% [7]. The high prevalence of HCV in Egypt can be explained by the long-term use of IV needles that have not been properly sterilized [15]. Egypt has a large population afflicted with Schistosomiasis, a disease caused by parasitic worms. A treatment for Schistosomiasis is parenteral antischistosomal therapy (PAT), which involves the administration of 12 to 16 intravenous injections of potassium antimony tartrate [15]. From the 1920s to the 1980s, many people were treated by PAT, during which the sterilization of needles was either omitted or not performed thoroughly, and as a result the rate of HCV infections increased significantly [15]. This suggests that repeated use of injecting equipment that has not been cleaned properly can greatly increase the spread of HCV.
Since patterns of injecting drug use and levels of HCV prevalence vary widely in different regions around the world, we selected the city of Vancouver, British Columbia, Canada as a case study for our model. Vancouver has an estimated injecting drug-user population of 7000, or about 1.6% of individuals between the ages of 15 and 64 [16]. Among Canadian provinces, British Columbia reports the highest HCV prevalence in the general population, by a margin of about 50% over the second-highest-reporting province [17]. This suggests an elevated threat of the spread of HCV in Vancouver as compared to other regions, but also presents an opportunity to interrupt the cycle of the disease, as injecting drug use accounts for at least 60% of all new HCV transmissions across Canada [17]. The city of Vancouver has operated a high-volume needle exchange program since 1988—initially as a response to growing HIV concerns—and in the intervening years has been collecting data about drug use, equipment sharing, and disease incidence, including data about HCV [18]. Official reporting of HCV began in British Columbia in 1992, earlier than in many other provinces [17], and in 1996 a city-wide cohort study of drug users was initialized [18]. The Vancouver Injection Drug User Study (VIDUS) systematically collected health data, disease test results, and demographic and behavioral information for more than 1300 injecting drug users over several years [19]. Many of the parameter values we use in our epidemiological model for HCV are sourced from VIDUS and subsequent analyses, especially those of Bayoumi and Zaric [16].
Recent years have seen an increased body of mathematical models addressing HCV transmission dynamics among people who inject drugs. These approaches largely consist of dynamic compartmental models, which project the long-term epidemiological impact of public health interventions [20,21,22,23,24], and agent-based or network models, which simulate transmission across social structures to evaluate the effectiveness of targeted strategies [25,26,27]. Some studies incorporate detailed economic evaluations to assess the programmatic cost-effectiveness of scaling up testing and treatment [28,29]. However, all these studies treat individual risk behaviors and intervention uptake as fixed parameters or externally determined scenarios rather than as outcomes of a dynamic decision-making process. These models do not consider how an individual’s strategic choices—driven by a personal weighing of the perceived costs and benefits of protection—influence the overall transmission landscape.
In the present paper, we address this gap by investigating the potential implications of voluntary participation by injecting drug users in clean needle exchange programs for the spread of hepatitis C. We assume that these individuals make strategic choices regarding the level of clean equipment usage that provides maximal personal benefit. These choices result in strategic interactions among the entire susceptible population because the behavior of the population affects the prevalence of the disease and, consequently, the risk of infection. Such strategic interactions, where the best course of action of a given individual depends on what others do, can be modeled using methods of game theory.
Game theory, with its origins in economics [30], proved valuable in mathematical biology [31,32,33]. Its capacity to model the influence of human behavior on complex systems makes it a powerful tool for epidemiology [34]. A seminal contribution in this area is the “vaccination games” framework, introduced by Bauch and Earn for childhood diseases [35]. This foundational approach has been widely adopted and extended, and the field has undergone a significant conceptual evolution, particularly catalyzed by the global COVID-19 pandemic.
The flexibility of this framework is demonstrated by its application to a vast spectrum of diseases and protective measures. Examples include studies on smallpox [36], chickenpox [37], influenza [38,39], measles [40], rubella [41], toxoplasmosis [42], Ebola [43], cholera [44], meningitis [45], hepatitis B [46,47], monkeypox [48,49], poliomyelitis [50], typhoid fever [51], yellow fever [52], rabies [53,54], Schistosomiasis [55], and COVID-19 [56,57]. Moreover, the utility of game-theoretic modeling extends beyond vaccination to encompass a variety of other personal protective measures. Studies have investigated optimal behaviors related to insecticide-treated cattle [58], the use of mosquito repellents [59,60,61,62], insecticide-treated bed nets [63,64,65,66], access to clean water [44], condoms [67], maintaining facial cleanliness [68], and adherence to non-pharmaceutical interventions like school closures and isolation [69]. These diverse applications highlight the flexibility of game theory in public health decision-making; for a comprehensive review focused on behavior-linked vaccination models, see [70].
The game-theoretic approach is now routinely used to model a wide array of voluntary protective behaviors beyond vaccination, most notably non-pharmaceutical interventions (NPIs) like social distancing and mask-wearing [71]. Data-driven models have explored how risk perception and NPI adherence dynamically shape epidemic trajectories and influence optimal public health strategies, such as vaccine prioritization [72]. Contemporary models increasingly frame public health compliance within the context of cooperative theory, formalizing it as a public goods game. In this view, non-compliance is characterized as a “free-riding” strategy that externalizes risk onto the community [73]. This has led to new theoretical frameworks, such as viewing vaccination and other protective measures as a “social contract,” where compliance is driven not just by individual risk assessment but also by social norms and the potential for peer-driven enforcement [74]. This work has also provided crucial insights into the psychology of policy, particularly the phenomenon of motivational “crowding-out,” where coercive mandates can paradoxically undermine the intrinsic, prosocial motivations that drive voluntary compliance [75].
We use an existing epidemiological model of hepatitis C [76] to determine the level of clean equipment usage in the at-risk population that is necessary to eradicate the disease (herd immunity threshold). We also used the epidemiological model to compute the probability of infection given the prevalence of the disease. This probability depends on the level of clean equipment usage by the population, and it is used by at-risk individuals to inform their strategic choice of the optimal protection level. We solve the game where individuals choose the proportion of clean equipment used and find the Nash equilibrium usage level for the entire at-risk population. We then compare this Nash equilibrium value with the herd immunity threshold to see if it is feasible to reach herd immunity if all at-risk individuals only act rationally in their own self-interest. We also perform uncertainty and sensitivity analyses to investigate how the outcomes of our model depend on the model parameter values.
2. Methods
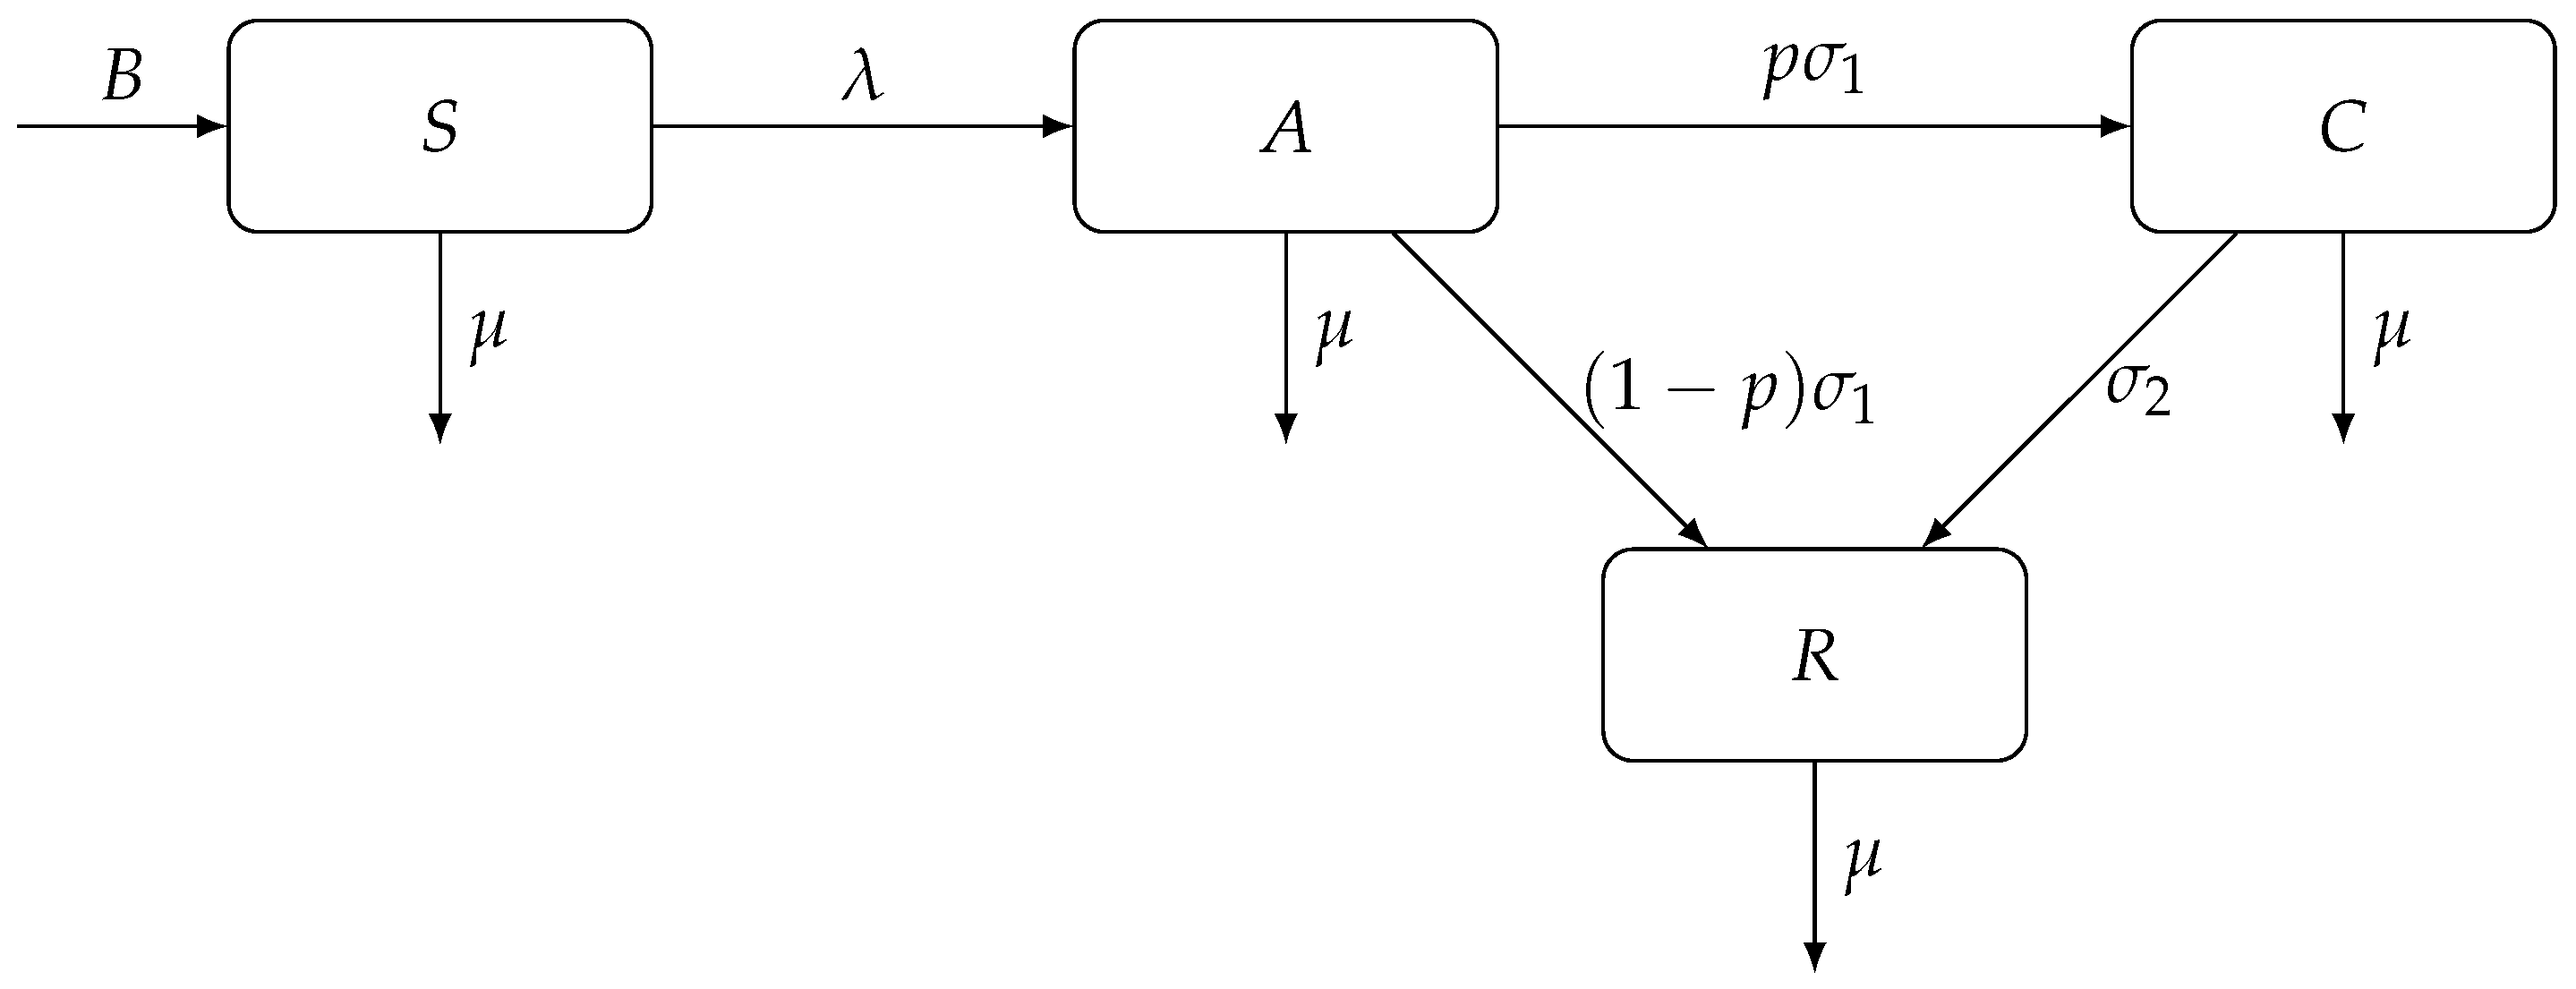
We adopt an epidemiological model of Kretzschmar and Wiessing [76] which models the transmission dynamics of hepatitis C among injecting drug users. The population of injecting drug users N (in a certain region) is divided into four homogeneous compartments: (1) susceptible individuals are those who are actively injecting drugs but have not yet been infected with HCV (S); (2) acutely infected individuals (A); (3) chronically infected individuals (C); and (4) individuals who have recovered from HCV infection, either due to spontaneous clearance of the virus or by seeking medical treatment (R).
There is constant recruitment rate B of individuals who become injecting drug users; these individuals become susceptible to the disease. Individuals leave the population at per capita rate , either through death or through voluntary cessation of drug use. Susceptible individuals become acutely infected at rate , the force of infection, given by
where is a base contact rate, and and are transmission risks due to exposure to acute HCV and chronic HCV, respectively. Acutely infected individuals are removed from the A compartment at rate ; a proportion p of them become chronically infected and a proportion of them recover from the infection. Finally, chronically infected individuals recover at rate . Figure 1 shows a diagram for the compartmental model of hepatitis C transmission dynamics among injecting drug users, adopted from [76].
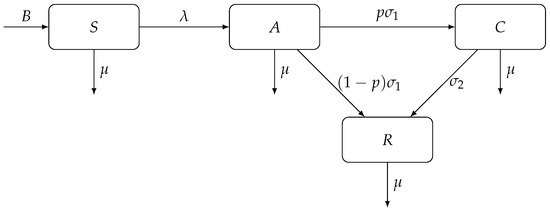
Figure 1.
A compartmental model of hepatitis C transmission dynamics among injecting drug users. The population is divided into four compartments: susceptible (S), acutely infected (A), chronically infected (C), and recovered (R) individuals.
The epidemiological model parameters are summarized in Table 1.

Table 1.
Summary of the model parameters.
The following system of ordinary differential equations describes the dynamics of the model presented in Figure 1:
The disease-free equilibrium (DFE) of this system is given by
and the basic reproduction number from [76] is
When , the system converges to the endemic equilibrium (EE), given by
In the game-theoretic model of clean needle usage, we will be assuming that the dynamics of hepatitis C transmission have reached the above endemic equilibrium, and we will use these values of the corresponding compartment sizes. This assumption is based on the established endemic state of hepatitis C among injecting drug users.
3. Results
3.1. Optimal Levels of Clean Needle Usage
In this section, we construct and solve a game-theoretic model of voluntary clean equipment usage in the at-risk population to prevent hepatitis C. To construct a game, we must specify three components: (1) the players, who are the individual decision-makers; (2) the strategies available to each player; and (3) the payoff function, which quantifies the outcome for each player based on their own choice and the choices of all other players. The players in the game are injecting drug users in Vancouver susceptible to hepatitis C. The strategy of each such individual is the proportion of clean equipment (such as clean needles) used to inject drugs. The payoff function is based on the (perceived) costs of clean equipment and infection; this will be defined explicitly later. The goal of our analysis is to find the Nash equilibrium of this game. A Nash equilibrium is a set of strategies where no individual player can achieve a better payoff by unilaterally changing their own strategy, assuming all other players’ strategies are held constant. It therefore represents a stable, self-sustaining outcome of the strategic interaction. In the context of our game, the Nash equilibrium corresponds to the population-level clean equipment usage rate that balances the cost of protective measures with the risk of infection.
The proportion of clean equipment used directly affects the contact rate between infected and susceptible individuals because it reduces the use of shared injection equipment. If susceptible individuals do not use any clean equipment (), then the contact rate is at its base value . On the other hand, if susceptible individuals use clean equipment all the time (), then the contact rate becomes 0. We model the contact rate as a linear function of the clean equipment usage level r:
In turn, the basic reproduction number (4) becomes a function of r if we replace the base contact rate with (6):
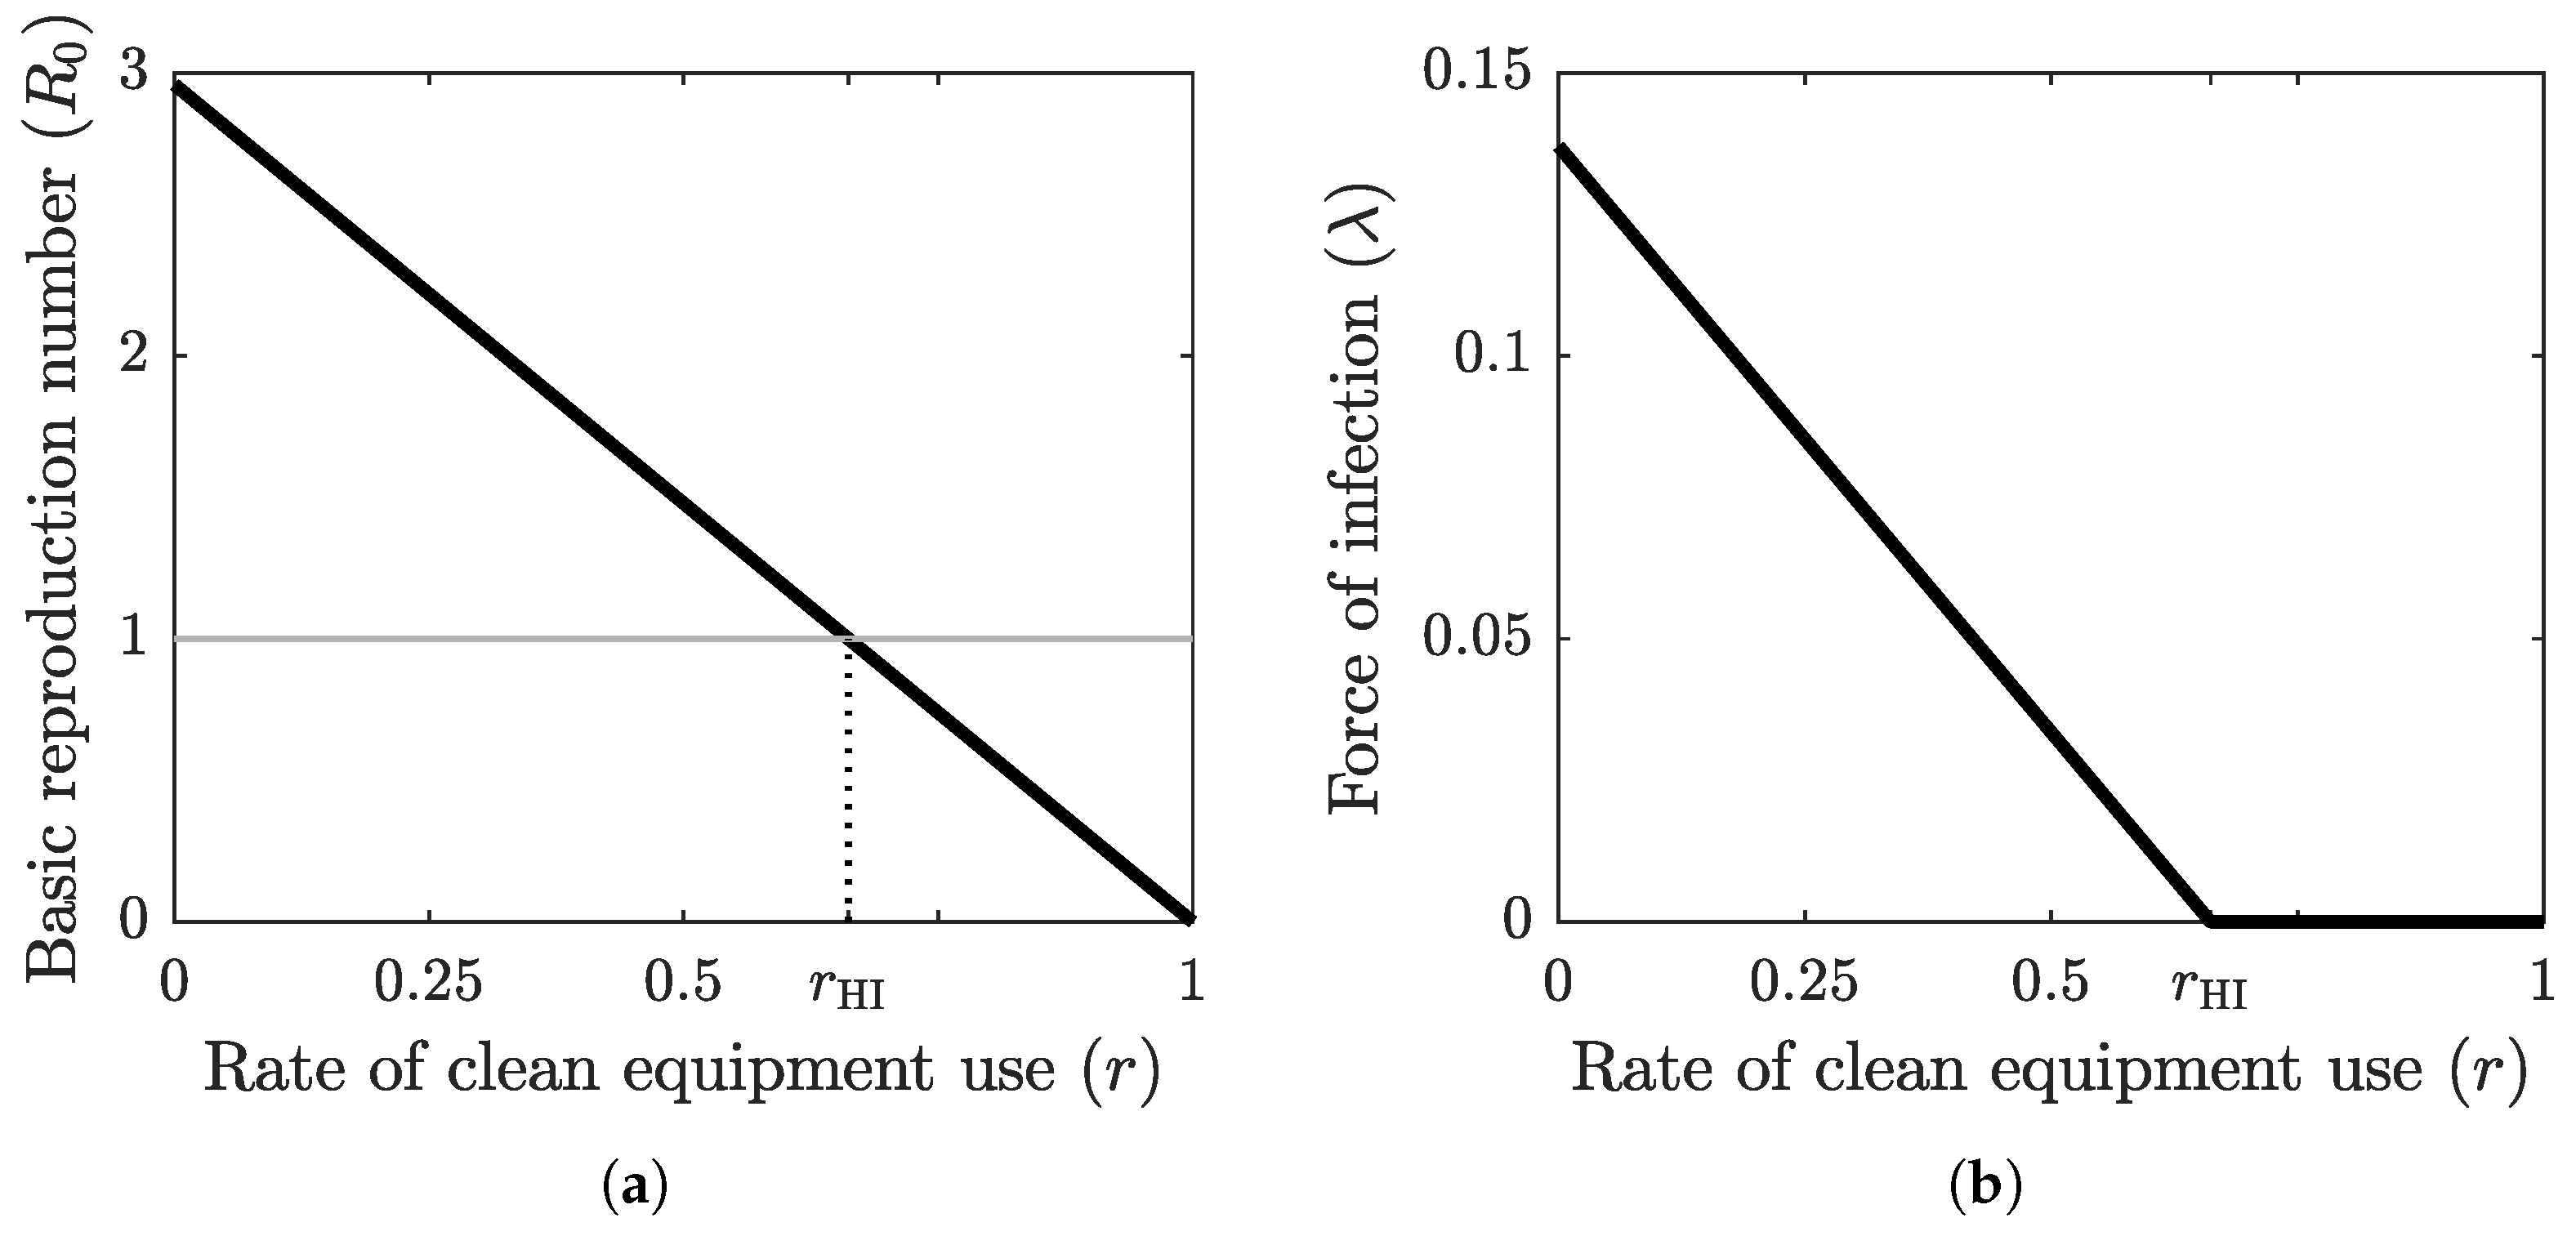
The threshold for disease eradication is , and by setting the right-hand side of (7) equal to 1 and solving for r, we find the threshold clean equipment usage level necessary to reach herd immunity:
The graph of the basic reproduction number as a function of the clean equipment usage rate is shown in Figure 2a. The basic reproduction number is at its maximum value when no clean equipment is being used () and at its minimum value when clean equipment is being used exclusively (). The threshold value , which separates the disease-free equilibrium case from the endemic equilibrium case, is achieved at the herd-immunity clean equipment usage rate . Figure 2b shows the graph of the force of infection as a function of r when the system (2) has reached an equilibrium, which is obtained by substituting (6) into (1) for . The base values of the epidemiological parameter values used in these computations are shown in Table 2.
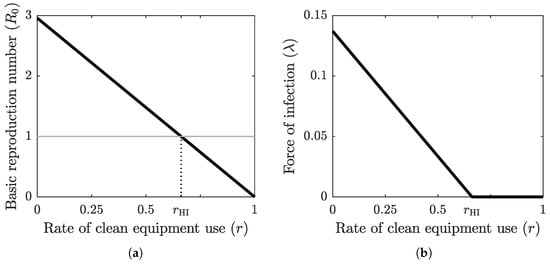
Figure 2.
(a) The graph of the basic reproduction number as a function of the clean equipment usage rate r. The grey horizontal line marks the critical threshold of . The intersection of the graph of with this horizontal line defines the herd immunity threshold . (b) The graph of the force of infection at equilibrium as a function of clean equipment usage rate r. When , the equilibrium is endemic, with positive force of infection, and when , the equilibrium is disease-free, with zero force of infection.
Table 2.
Parameter values and ranges for sensitivity analysis.
Finally, to set up a payoff function for a focal individual who uses strategy r in a population adopting strategy , we follow the general framework of Bauch and Earn [35]. The payoff depends on the perceived cost of using protection, the perceived cost of infection, and the probability of getting infected . The payoff function for a focal individual is defined as
Here, represents the total perceived cost of protection. This is a broad concept encompassing not only the direct monetary price of clean equipment but also crucial non-monetary and social costs. These can include the time and travel required to access a needle exchange program, the fear of legal repercussions, and the social stigma associated with being identified as a drug user. Correspondingly, is the perceived cost of infection. This term includes direct medical costs for treating chronic hepatitis C and its eventual complications, but it also accounts for indirect and intangible costs like lost productivity, diminished quality of life, and the potential for social discrimination resulting from the disease. Because quantifying indirect costs is challenging, we replace the payoff function in (9) with
where the dimensionless parameter is the relative cost of complete protection. Note that by scaling the payoff function we did not affect the outcome of the game.
We compute the probability of infection as the transition probability from the S compartment to the A compartment:
The individual force of infection depends on the individual-specific contact rate , which is determined by the proportion r of clean equipment used by the individual, and the prevalence of the disease, which in turn depends on the population-level adoption of clean equipment :
Here, and are the endemic equilibria values of the acutely infected and chronically infected compartment, respectively, given the population adoption rate of clean equipment . These values are obtained by substituting for r into (7) and then substituting the resulting value of into (5):
We will now solve the game we just set up by finding the Nash equlibrium population clean equipment usage rate. We begin by trying to maximize the payoff of a focal individual. Letting
which depends only on the population-level clean equipment usage rate, we have
and hence
Because and all parameter values are positive, the second partial derivative is always positive. It follows that is a convex function of r, and hence it attains its maximum value (as a function of r) at either or . The payoffs to a focal individual corresponding to these two extreme strategies are given by
If , then it is best for any given individual to stop using clean equipment; consequently, the population adoption rate will go down. If , then it is best for any given individual to use clean equipment all the time; consequently, the population adoption rate will go up. It follows that the population-level proportion of clean equipment usage will settle at the equilibrium rate satisfying
The population-level proportion of clean equipment is the Nash equilibrium solution to the game; if everyone adopts this strategy, then nobody can improve their payoff by unilaterally deviating from this strategy. This is therefore the optimal proportion of clean equipment usage in the at-risk population when all individuals act in their own best interest only. Solving the Equation (18) for , we obtain
The equilibrium usage rate is determined by a trade-off between two key factors: the risk of getting infected, captured by the basic reproduction number (the transmission potential when no one uses clean equipment), and the relative cost of clean equipment D. To understand this trade-off, it is helpful to consider the case where protection has zero cost (i.e., ). In this scenario, the equation simplifies to . This is precisely the expression in Equation (8) for the herd immunity threshold . This is a critical insight: when there is no cost associated with using clean equipment, the rational choice for a self-interested individual perfectly aligns with the collective action needed to eradicate the disease. As the cost D increases from zero, this alignment breaks down. The Equation (19) shows that any positive cost will cause the individually optimal level of protection to fall below the community-optimal level, highlighting the conflict between individual and group interests when personal sacrifice is required.
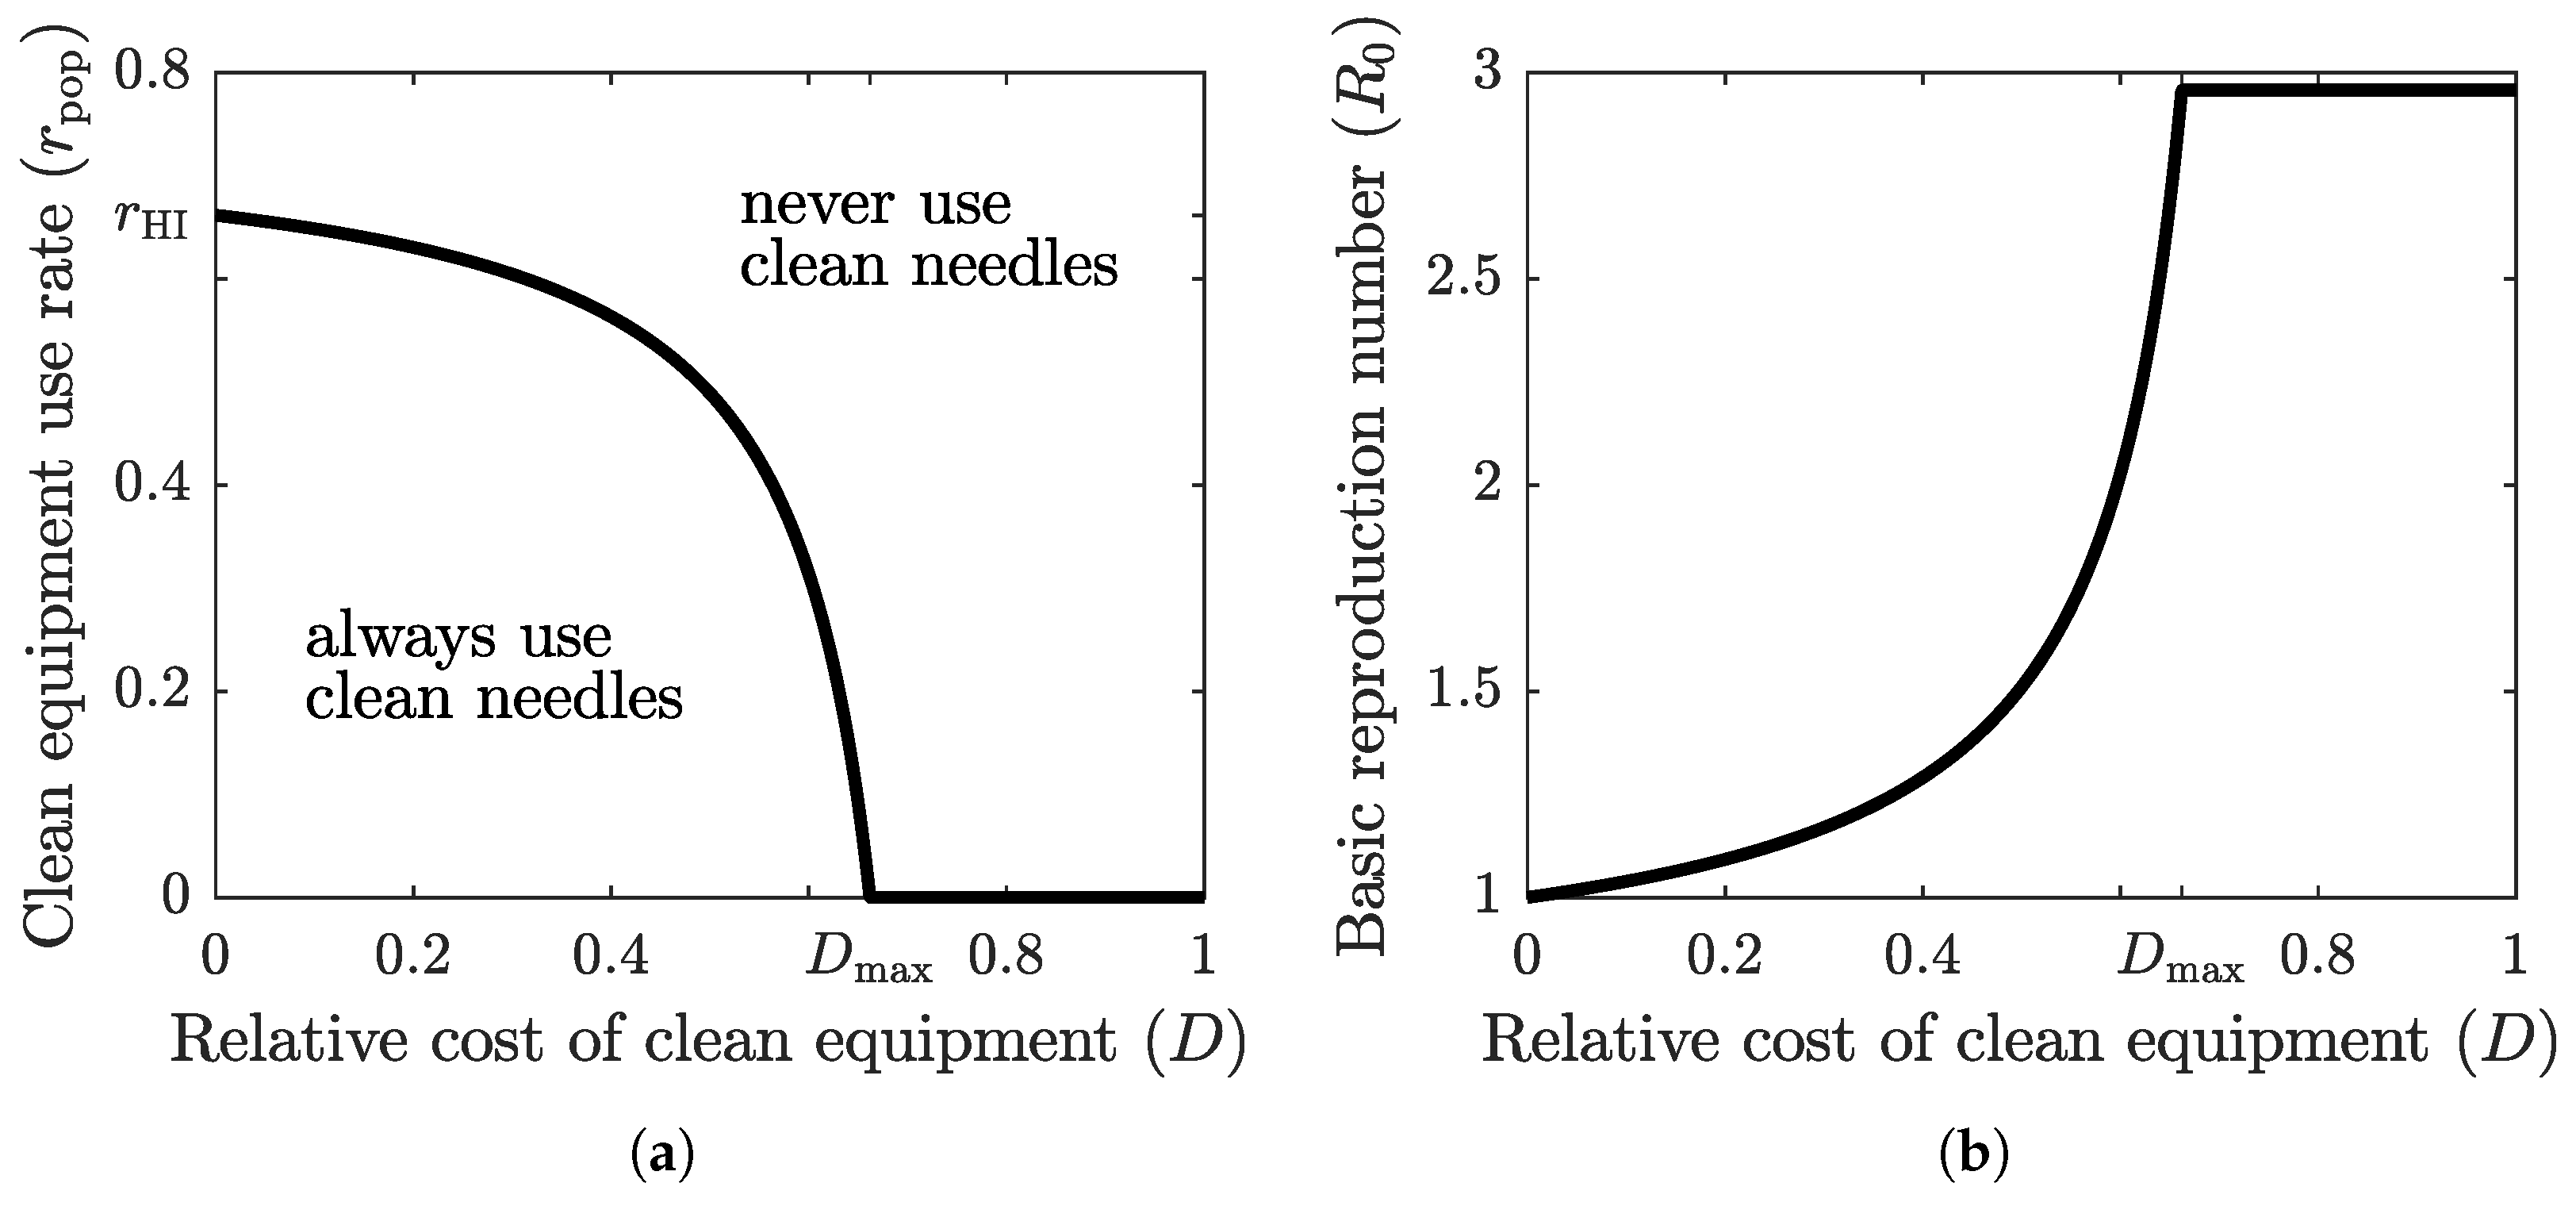
The graph of the optimal clean equipment usage rate as a function of the relative cost D is shown in Figure 3a. The parameter region below the graph corresponds to scenario , where the population tends to adopt a higher protection rate; the parameter region above the graph corresponds to scenario , where the population tends to adopt a lower protection rate. The optimal rate of clean equipment (such as needles) usage in the population, , is equal to the rate of clean equipment usage required to achieve herd immunity, , only when the relative cost of using clean equipment is zero. When the relative cost is positive, is less than , and it reaches zero once the relative cost exceeds a threshold value . If the cost of protection relative to the cost of infection becomes too large, then the population prefers to forgo the costly protective measure altogether and face the risk of infection. However, when the relative cost of clean equipment is low, the population-level compliance is very close to the herd immunity threshold.
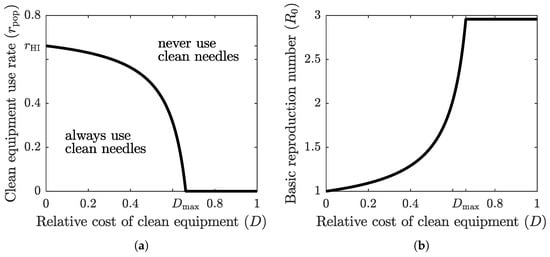
Figure 3.
(a) The graph of optimal (Nash equilibrium) clean equipment use as a function of the relative cost D. The Nash equilibrium usage rate reaches the required herd immunity threshold () only when the cost of protection relative to the cost of the disease is zero (). The optimal strategy of a focal individual outside Nash equilibrium population adoption is to either always use clean equipment (when both relative cost and population usage rate are low) or never use clean equipment (when relative cost or population usage rate are high). (b) The graph of at the optimal clean equipment use rate as a function of the relative cost D. Herd immunity () is achieved only when . For any positive cost, the self-serving behavior of the population results in an endemic disease state where .
Figure 3b shows the graph of the basic reproduction number at as a function of the relative cost of clean equipment. When , we have , and hence . As the relative cost grows, so does the corresponding basic reproduction number. Eventually, when the relative cost becomes too large (), the population stops using the protective measure (), and the basic reproduction number takes its maximum base value, given by (4).
3.2. Uncertainty and Sensitivity Analysis
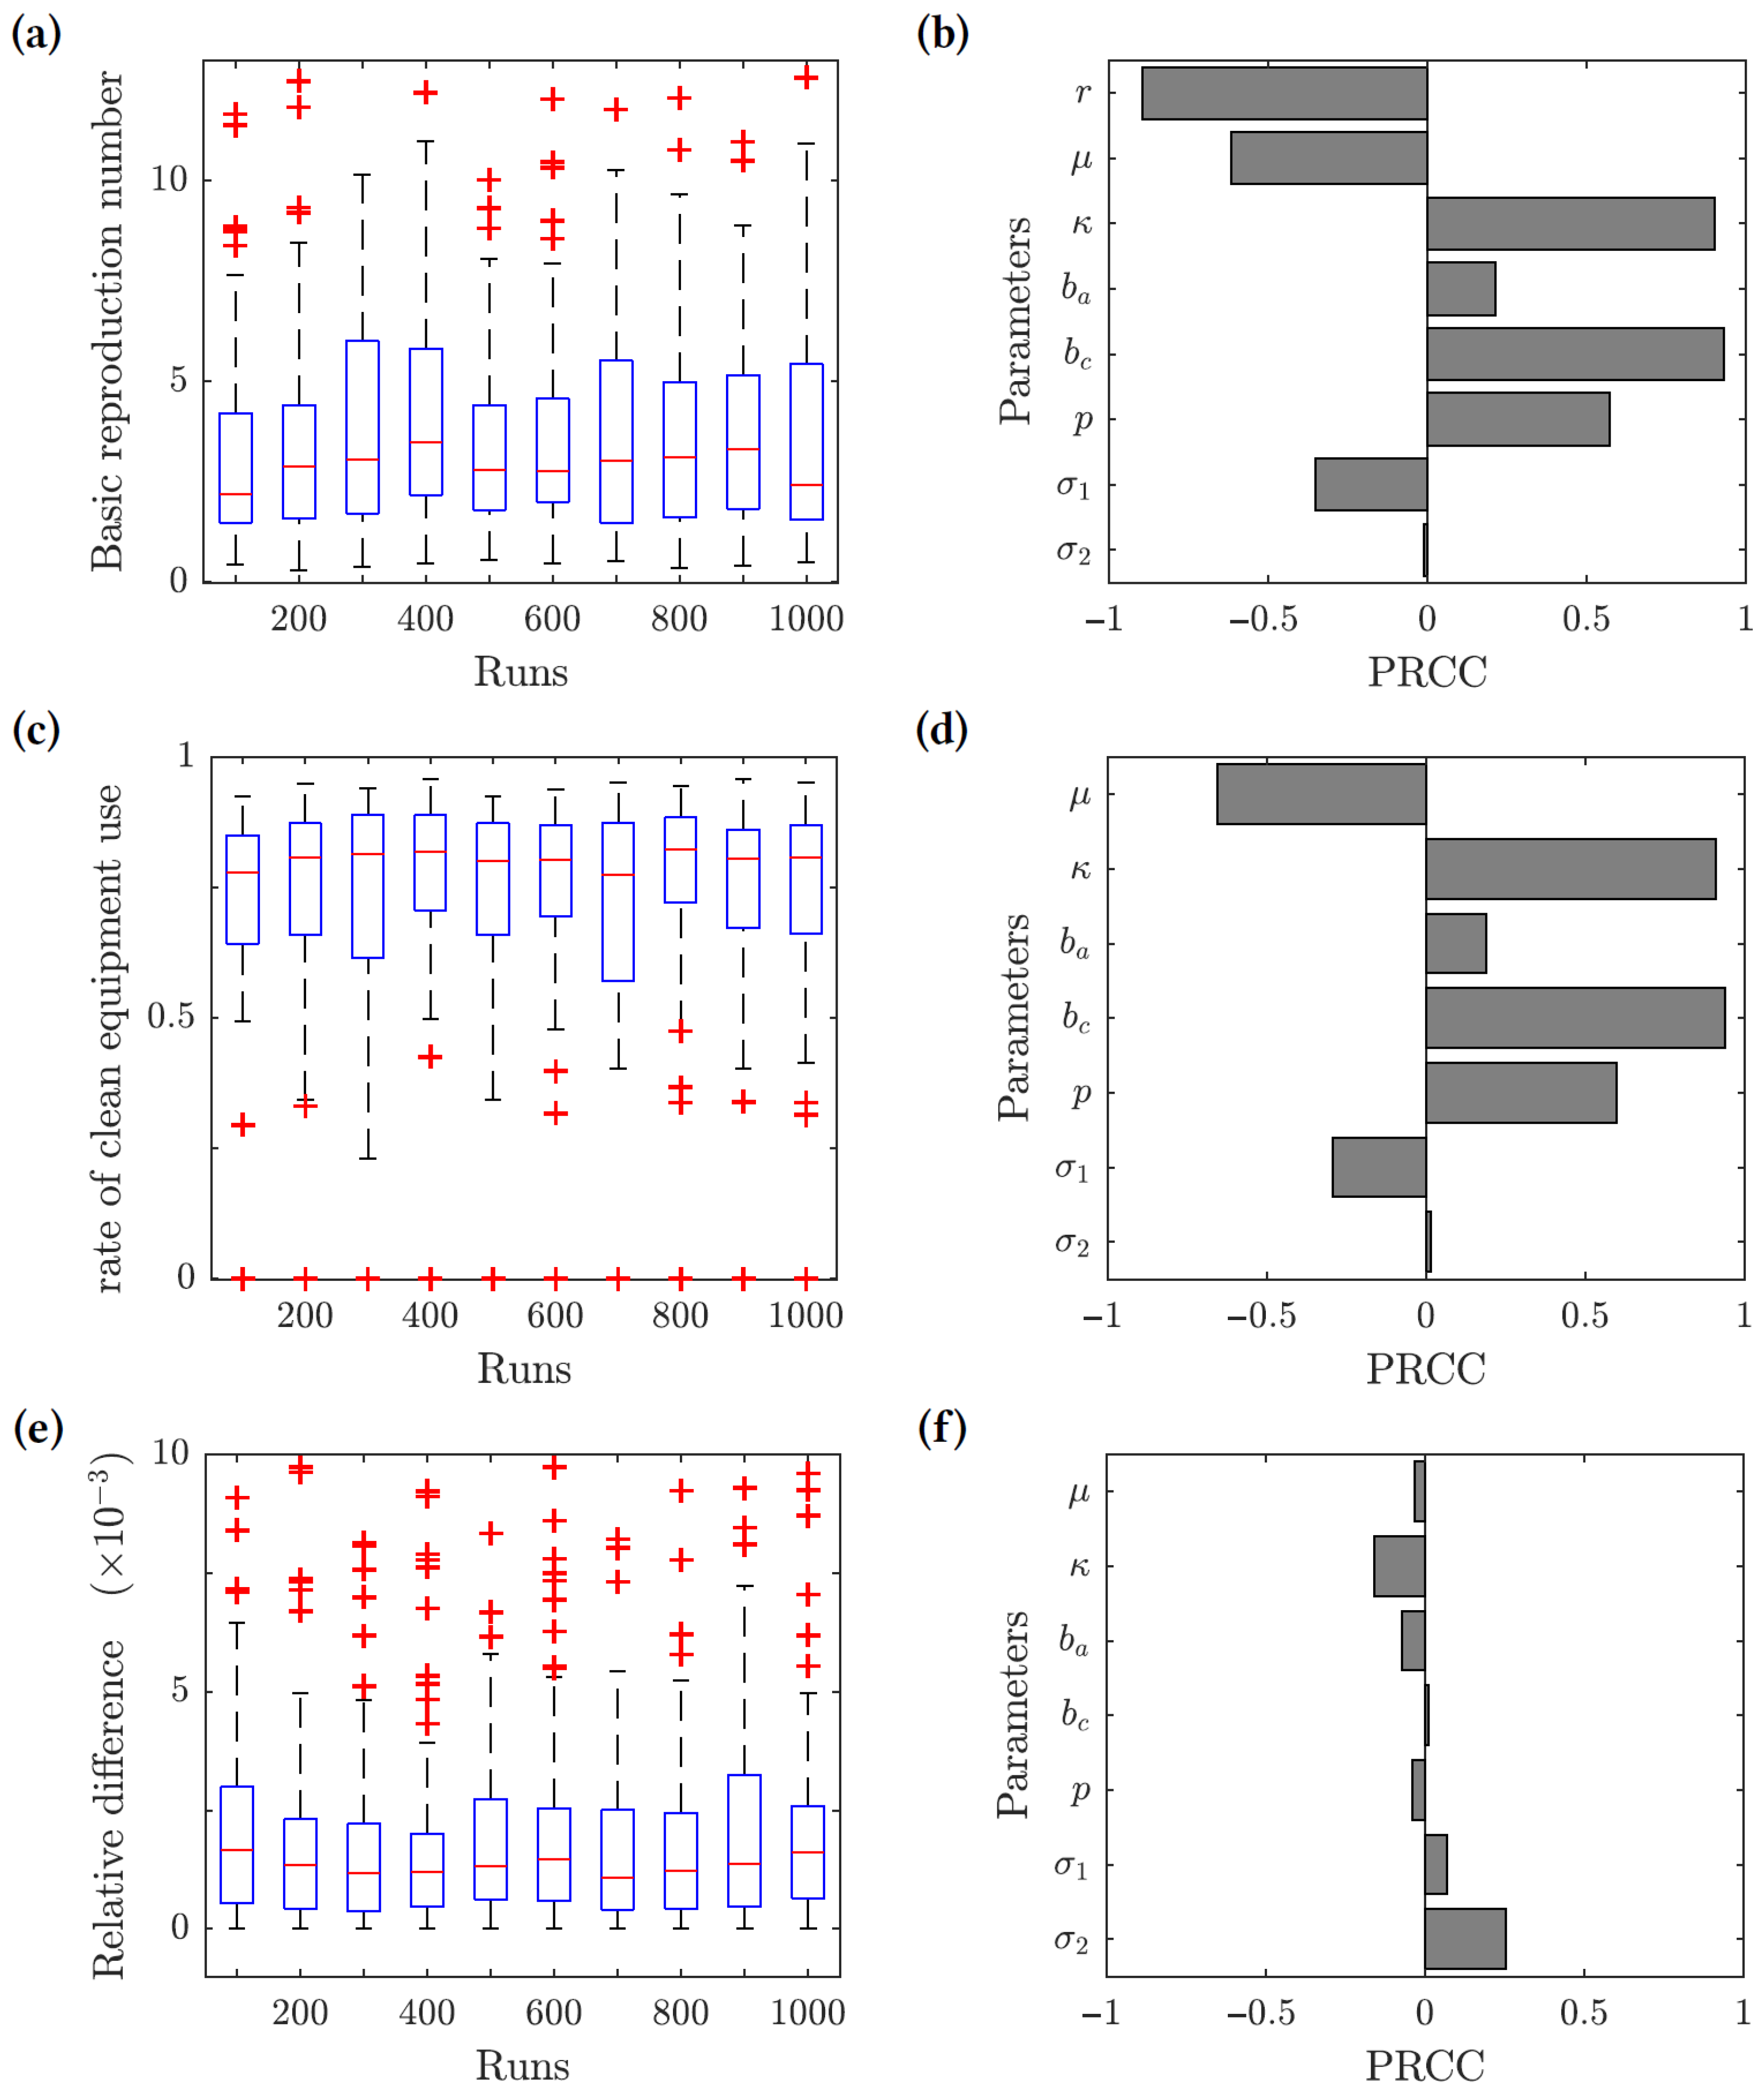
We performed uncertainty and sensitivity analyses [79,80] of the model outcomes. We chose three response functions: (1) the basic reproduction number given by (7); (2) the optimal rate of clean equipment usage given by (19); and (3) the relative difference between the herd immunity clean equipment usage and the optimal clean equipment usage . The ranges of the parameter values used in this analysis are given in Table 2, and the results are presented in Figure 4. The uncertainty analysis (left panels) measures how the value of each response function changes based on the uncertainty in the parameter values. The sensitivity analysis (right panels) gives the partial rank correlation coefficients (PRCC), which show how sensitive each response function is to changes in the various parameter values. We uniformly sampled 1000 values for each parameter from the intervals listed in Table 2, and we used the Latin hypercube sampling (LHS) method to generate 1000 sample data points from the entire parameter space.
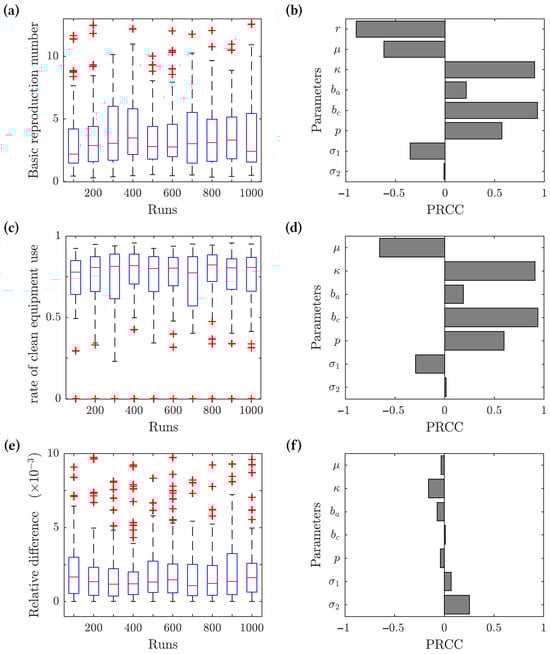
Figure 4.
Results of the uncertainty (left-hand side panels) and sensitivity (right-hand side panels) analysis. Three response functions were considered: (1) the basic reproduction number (panels (a,b)); (2) the optimal clean equipment usage rate (panels (c,d)); and (3) the relative difference between the herd immunity clean equipment usage rate and the optimal clean equipment usage rate (panels (e,f)). The value was used for the response functions (2) and (3).
For the basic reproduction number () response function, we found that the contact rate (), transmission risk from chronic infections (), and the proportion of acute infections progressing to chronic (p) are all positively correlated with the value of . The basic reproduction number is linearly related to the contact rate, and increasing the contact rate increases . Increasing the transmission risk from chronic infections would also increase , considering that most infected individuals in the population become chronically infected in a relatively short time period rather than remaining acutely infected or recovering. Similarly, if a greater proportion of acute infections progress to chronic infections, then would increase. The clean equipment usage (r) and the removal rate () have the greatest negative correlation with . This is expected, since increasing the use of clean equipment decreases the force of infection and reducing the size of the injecting drug user population reduces the number of individuals available to become infected.
The results of the sensitivity analysis for the optimal rate of clean equipment use response function are similar to the ones for the basic reproduction number. The contact rate (), transmission risk from chronic infections (), and proportion of acute infections progressing to chronic (p) all show a positive correlation, while the removal rate () shows the greatest negative correlation with .
For the relative difference function, all of the epidemiological model parameters have little effect on the value of the function. It follows that our main conclusion (that the value of is very close to the herd immunity threshold provided the relative cost of protection is low) is robust; it does not depend on the uncertainty in the epidemiological model parameter values.
4. Discussion
Using the framework of Bauch and Earn [35], we constructed a game-theoretic model of individual drug users’ decisions to use clean injecting equipment as a personal protective measure against hepatitis C. We used an existing epidemiological model of the spread of hepatitis C among injecting drug users [76] to inform the game-theoretic model payoffs and to compute the population-level usage of clean equipment necessary to reach herd immunity. The model parameters were selected from research specific to intravenous drug use in Vancouver, B.C., Canada, though many of these parameters are similar to those used in models for HCV in other regions [4,10,77]. Our results show that herd immunity against HCV among injecting drug users can be achieved when approximately 2/3 of injections are performed using new or sterile equipment. However, the optimal (Nash equilibrium) population-level adoption rate falls short of that threshold if the (perceived) cost of clean equipment is greater than zero. On the other hand, the lower the cost of clean equipment is relative to the cost of infection, the closer the optimal clean equipment usage is to the herd immunity threshold (cf. Figure 3a). This demonstrates a clear benefit to human health when governments and other organizations provide no-cost services to IDUs.
The divergence between the rational individual usage rate and the societally optimal herd immunity threshold carries direct and actionable implications for public health policy. Our model shows that the fundamental policy goal must be to close this gap by implementing interventions that drive the perceived relative cost of protection as close to zero as possible. This provides a compelling justification for distributing a comprehensive range of clean injecting equipment at no monetary cost, as this is a foundational step in minimizing the cost of protection. However, because the cost parameter D also incorporates perceived barriers, addressing only monetary costs is insufficient. Policy must therefore also target the non-monetary components of this cost through public health campaigns that destigmatize harm-reduction services and program designs that make them safe and easily accessible. The risks of inaction are clear: our model demonstrates that allowing the population to settle at the selfishly optimal Nash equilibrium with a non-negligible perceived cost of obtaining clean injecting equipment guarantees the continued endemic transmission of HCV and its associated long-term health burdens.
Access to clean injecting equipment has previously been identified as an important factor in reducing the spread of HCV [81], and a number of harm-reduction programs with this stated goal exist, particularly in Europe and Canada. Needle exchange programs, such as the one operated in the city of Vancouver since the late 1980s, generally offer clean syringes at zero cost. However, most harm-reduction programs do not provide other items used for injecting, such as cookers, rinse water, and filter material, which are commonly shared and reused [12,13]. This suggests that needle exchange programs should be expanded to offer IDUs access to a broader range of injecting equipment in order to better reduce the spread of HCV. In addition, destigmatization of needle exchange programs may improve participation rates, as there are perceived costs and barriers to obtaining clean equipment aside from purely monetary concerns.
A crucial parameter in our game-theoretic model is the relative cost of protection D, which represents the ratio of the perceived cost of using clean equipment to the perceived cost of infection . Quantifying this parameter is challenging, as both costs include non-monetary factors. The cost of protection encompasses not just the price of sterile equipment but also practical barriers like the time and travel required to access a needle exchange program, and significant psychosocial costs, such as the fear of legal repercussions and social stigma. Similarly, the cost of infection includes not only the direct medical expenses for treating chronic hepatitis C—which can be substantial—but also indirect costs, like lost productivity and diminished quality of life. In Vancouver, where harm reduction programs provide syringes at no monetary charge, the non-monetary aspects of are dominant. Given that the perceived cost of infection is high, the resulting ratio D is likely to be very small, but always greater than zero. Therefore, our analysis focuses on small positive values of D, as this represents the realistic tension between policy efforts to reduce barriers and the persistent individual costs that prevent optimal collective behavior.
A key assumption in our model is the linear relationship between the rate of clean equipment use r and the effective contact rate . We selected this linear form for its parsimony, as it represents the simplest approximation: that each instance of using sterile equipment independently and equally reduces the total number of risky transmission events. We acknowledge that the true relationship may be nonlinear. For example, a scenario with diminishing returns (a concave relationship) is plausible, where the initial adoption of clean needles has a disproportionately large effect on reducing transmission. In such a case, the herd immunity threshold would be lower than our estimate of approximately two-thirds. Conversely, if there were accelerating returns (a convex relationship), a higher level of compliance would be required to halt transmission. While the specific numerical value of is sensitive to this assumption, our central policy conclusion is robust. The fundamental result of our game-theoretic analysis is the emergence of a gap between the individually optimal Nash Equilibrium () and the socially optimal herd immunity threshold () whenever the relative cost of protection (D) is greater than zero. This gap, and the consequent policy imperative to minimize D by eliminating all perceived barriers to harm reduction, persists regardless of the precise value of . Therefore, our main conclusion—that voluntary compliance can only align with the goal of disease eradication if clean equipment is essentially free of all actual and perceived costs—remains valid even if the exact herd immunity target were different.
Due to the nature of the population under study, accurate data on the transmissibility of HCV via different types of injecting equipment is scarce. Our results apply to Vancouver, and likely extend to other cities with similar demographics, but they may not immediately apply to other regions with endemic HCV. Our model is scaled to the point estimate of given by [78] for HCV subtype 1a—the subtype most commonly associated with intravenous drug use in North America—and thus would need to be modified to fit other subtypes of HCV and their respective values.
The accuracy of this modeling is also dependent upon the accuracy of the parameters used in the analysis. Tracking the population of IDUs in order to determine their migration into and out of the susceptible population is challenging, since drug users are unlikely to self-report. The available statistics regarding IDUs are therefore somewhat incomplete and subject to error. Furthermore, the population of IDUs is not a homogeneous population. People are more likely to share injecting equipment with individuals who are physically or socially close to them, so this research could be furthered by analyzing smaller local populations or those that form a social group resulting in island population models. Finally, a major limitation of our approach is that the game-theoretic model assumes perfectly rational individuals who act in their best interest, which can hardly be said about injecting drug users. A future iteration of this model could incorporate a “trembling hand” approach, where individuals may choose suboptimal strategies by chance. These considerations were outside the scope of the current project, but they present potential extensions of this research.
In conclusion, this study offers both scientific and practical contributions. Scientifically, we applied a game-theoretic framework to model the strategic choices of individuals in a public health context, demonstrating its utility for predicting the effectiveness of voluntary interventions. This work serves as a case study for how rational behavior can be coupled with epidemiological dynamics to explore the gap between individual self-interest and community-optimal outcomes. From a practical and policy perspective, our findings provide quantitative support for expanding harm-reduction services. The conclusion that voluntary compliance aligns with the goal of disease eradication only when clean equipment is essentially free of actual and perceived costs delivers a strong argument for policymakers to invest in comprehensive, no-barrier programs for at-risk populations.
Author Contributions
Conceptualization, I.V.E.; Methodology, I.V.E.; Formal analysis, K.S., A.E. and I.V.E.; Investigation, K.S., A.E. and I.V.E.; Writing—original draft, K.S., A.E. and I.V.E.; Writing—review & editing, I.V.E.; Visualization, K.S., A.E. and I.V.E.; Supervision, I.V.E.; Funding acquisition, I.V.E. All authors have read and agreed to the published version of the manuscript.
Funding
This research was funded by a Center for Undergraduate Research in Mathematics mini-grant.
Data Availability Statement
The original contributions presented in this study are included in the article. Further inquiries can be directed to the corresponding author.
Acknowledgments
This research was conducted at the University of North Carolina at Greensboro as a 2018–2019 academic year project, sponsored by a Center for Undergraduate Research in Mathematics (CURM) mini-grant. K.S. and A.E. were undergraduate student participants, and I.V.E. was a faculty mentor in this project.
Conflicts of Interest
The authors declare no conflicts of interest.
References
- World Health Organization. Hepatitis C Fact Sheet. 2018. Available online: https://www.who.int/en/news-room/fact-sheets/detail/hepatitis-c (accessed on 1 May 2025).
- Chen, S.; Morgan, T. The natural history of hepatitis C virus (HCV) infection. Int. J. Med. Sci. 2006, 3, 47–52. [Google Scholar] [CrossRef] [PubMed]
- Stanaway, J. The global burden of viral hepatitis from 1990 to 2013: Findings from the Global Burden of Disease Study 2013. Lancet 2016, 388, 1081–1088. [Google Scholar] [CrossRef] [PubMed]
- Elbasha, E. Model for hepatitis C virus transmissions. Math. Biosci. Eng. 2013, 10, 1045–1065. [Google Scholar] [CrossRef] [PubMed]
- Massad, E.; Coutinho, F.A.B.; Chaib, E.; Burattini, M.N. Cost-effectiveness analysis of a hypothetical hepatitis C vaccine compared to antiviral therapy. Epidemiol. Infect. 2009, 137, 241–249. [Google Scholar] [CrossRef]
- Seeff, L. Natural history of hepatitis C. Am. J. Med. 1999, 107, 10–15. [Google Scholar] [CrossRef]
- Shepard, C.; Finelli, L.; Alter, M. Global epidemiology of hepatitis C virus infection. Lancet Infect. Dis. 2005, 5, 558–567. [Google Scholar] [CrossRef]
- Ghany, M.; Strader, D.; Thomas, D.; Seeff, L. Diagnosis, management, and treatment of hepatitis C: An update. Hepatology 2009, 49, 1335–1374. [Google Scholar] [CrossRef]
- Wiktor, S.Z.; Hutin, Y.J.-F. The global burden of viral hepatitis: Better estimates to guide hepatitis elimination efforts. The Lancet 2016, 388, 1030–1031. [Google Scholar] [CrossRef]
- Zhang, S.; Zhou, Y. Dynamics and application of an epidemiological model for hepatitis C. Math. Comput. Model. 2012, 56, 36–42. [Google Scholar] [CrossRef]
- Armstrong, G.; Wasley, A.; Simard, E.; McQuillan, G.; Kuhnert, W.; Alter, M. The prevalence of hepatitis C virus infection in the United States, 1999 through 2002. Ann. Intern. Med. 2006, 144, 705–714. [Google Scholar] [CrossRef]
- Hagan, H.; Thiede, H.; Weiss, N.; Hopkins, S.; Duchin, J.; Alexander, E. Sharing of drug preparation equipment as a risk factor for hepatitis C. Am. J. Public Health 2001, 91, 42–46. [Google Scholar] [PubMed]
- Thorpe, L.; Ouellet, L.; Hershow, R.; Bailey, S.; Williams, I.; Williamson, J.; Monterroso, E.; Garfein, R. Risk of hepatitis C virus infection among young adult injection drug users who share injection equipment. Am. J. Epidemiol. 2002, 155, 645–653. [Google Scholar] [CrossRef] [PubMed]
- Alter, M.; Margolis, H. Recommendations for prevention and control of hepatitis C virus (HCV) infection and HCV-related chronic disease. Morb. Mortal. Wkly. Rep. 1998, 47, 1. [Google Scholar]
- Frank, C.; Mohamed, M.; Strickland, G.; Lavanchy, D.; Arthur, R.; Magder, L.; El Khoby, T.; Abdel-Wahab, Y.; Aly Ohn, E.; Anwar, W.; et al. The role of parenteral antischistosomal therapy in the spread of hepatitis C virus in Egypt. Lancet 2000, 355, 887–891. [Google Scholar] [CrossRef]
- Bayoumi, A.; Zaric, G. The cost-effectiveness of Vancouver’s supervised injection facility. CMAJ 2008, 179, 1143–1151. [Google Scholar] [CrossRef]
- Zou, S.; Tepper, M.; Giulivi, A. Current status of hepatitis C in Canada. Can. J. Public Health 2000, 91, S10–S15. [Google Scholar] [CrossRef]
- Strathdee, S.; Patrick, D.; Currie, S.; Cornelisse, P.; Rekart, M.; Montaner, J.; Schechter, M.; O’Shaughnessy, M. Needle exchange is not enough: Lessons from the Vancouver injecting drug use study. AIDS Online 1997, 11, F59–F65. [Google Scholar] [CrossRef]
- Patrick, D.; Tyndall, M.; Cornelisse, P.; Li, K.; Sherlock, C.; Rekart, M.; Strathdee, S.; Currie, S.; Schechter, M.; O’Shaughnessy, M. Incidence of hepatitis C virus infection among injection drug users during an outbreak of HIV infection. CMAJ 2001, 165, 889–895. [Google Scholar]
- Cui, J.A.; Zhao, S.; Guo, S.; Bai, Y.; Wang, X.; Chen, T. Global dynamics of an epidemiological model with acute and chronic HCV infections. Appl. Math. Lett. 2020, 103, 106203. [Google Scholar] [CrossRef]
- Woyesa, S.; Amente, K. Hepatitis C virus dynamic transmission models among people who inject drugs. Infect. Drug Resist. 2023, 16, 1061–1068. [Google Scholar] [CrossRef]
- Rivera Saldana, C.; Abramovitz, D.; Beletsky, L.; Borquez, A.; Kiene, S.; Marquez, L.; Patton, T.; Strathdee, S.; Zúñiga, M.; Martin, N.; et al. Estimating the impact of a police education program on hepatitis C virus transmission and disease burden among people who inject drugs in Tijuana, Mexico: A dynamic modeling analysis. Addiction 2023, 118, 1763–1774. [Google Scholar] [CrossRef] [PubMed]
- Astley, J.; Saralamba, S.; Poovorawan, K.; White, L.; Aguas, R.; Pan-Ngum, W. Population and transmission dynamics model to determine WHO targets for eliminating Hepatitis C virus in Thailand. PLoS ONE 2024, 19, e0309313. [Google Scholar] [CrossRef] [PubMed]
- Whittaker, R.; Midtbø, J.; Kløvstad, H. Monitoring progress towards the elimination of hepatitis C as a public health threat in Norway: A modelling study among people who inject drugs and immigrants. J. Infect. Dis. 2024, 230, e700–e711. [Google Scholar] [CrossRef] [PubMed]
- Zhu, L.; Thompson, W.; Hagan, L.; Randall, L.; Rudolph, A.; Young, A.; Havens, J.; Salomon, J.; Linas, B. Potential impact of curative and preventive interventions toward hepatitis C elimination in people who inject drugs—A network modeling study. Int. J. Drug Policy 2024, 130, 104539. [Google Scholar] [CrossRef]
- Zhu, L.; Havens, J.; Rudolph, A.; Young, A.; Yazdi, G.; Thompson, W.; Hagan, L.; Randall, L.; Wang, J.; Earnest, R.; et al. Hepatitis C virus transmission among people who inject drugs in rural United States: Mathematical modeling study using stochastic agent-based network simulation. Am. J. Epidemiol. 2025, kwaf052. [Google Scholar] [CrossRef]
- Chen, Y.; Bao, Y.; Yan, M.; Jin, H.; Yao, K.; Zhang, C.; Li, W.; Wu, B. Achieving Hepatitis C Micro-Elimination in Chinese Injecting Drug Users: A Dynamic Network Modeling Study. Infect. Dis. Ther. 2025, 14, 181–197. [Google Scholar] [CrossRef]
- Ward, Z.; Simmons, R.; Fraser, H.; Trickey, A.; Kesten, J.; Gibson, A.; Reid, L.; Cox, S.; Gordon, F.; Mc Pherson, S.; et al. Impact and cost-effectiveness of scaling up HCV testing and treatment strategies for achieving HCV elimination among people who inject drugs in England: A mathematical modelling study. Lancet Reg. Health–Eur. 2025, 49, 101176. [Google Scholar] [CrossRef]
- Trickey, A.; Walker, J.; Khue, P.; Hong, T.; Binh, N.; Quillet, C.; Vallo, R.; Bivegete, S.; Oanh, K.; Fraser, H.; et al. Impact and cost-effectiveness of interventions to eliminate hepatitis C virus among people who inject drugs in Haiphong, Vietnam. Int. J. Drug Policy 2025, 143, 104898. [Google Scholar] [CrossRef]
- von Neumann, J.; Morgenstern, O. Theory of Games and Economic Behavior; Princeton University Press: Princeton, NJ, USA, 1944. [Google Scholar]
- Maynard Smith, J. Evolution and the Theory of Games; Cambridge University Press: Cambridge, UK, 1982. [Google Scholar]
- Hofbauer, J.; Sigmund, K. Evolutionary Games and Population Dynamics; Cambridge University Press: Cambridge, UK, 1998. [Google Scholar]
- Broom, M.; Rychtář, J. Game-Theoretical Models in Biology; Chapman and Hall/CRC: Boca Raton, FL, USA, 2022. [Google Scholar]
- Manfredi, P.; D’Onofrio, A. Modeling the Interplay Between Human Behavior and the Spread of Infectious Diseases; Springer: Berlin/Heidelberg, Germany, 2013. [Google Scholar] [CrossRef]
- Bauch, C.; Earn, D. Vaccination and the theory of games. Proc. Natl. Acad. Sci. USA 2004, 101, 13391–13394. [Google Scholar] [CrossRef]
- Bauch, C.; Galvani, A.; Earn, D. Group interest versus self-interest in smallpox vaccination policy. Proc. Natl. Acad. Sci. USA 2003, 100, 10564–10567. [Google Scholar] [CrossRef]
- Liu, J.; Kochin, B.; Tekle, Y.; Galvani, A. Epidemiological game-theory dynamics of chickenpox vaccination in the USA and Israel. J. R. Soc. Interface 2012, 9, 68–76. [Google Scholar] [CrossRef] [PubMed]
- Galvani, A.; Reluga, T.; Chapman, G. Long-standing influenza vaccination policy is in accord with individual self-interest but not with the utilitarian optimum. Proc. Natl. Acad. Sci. USA 2007, 104, 5692–5697. [Google Scholar] [CrossRef] [PubMed]
- Shim, E.; Chapman, G.; Townsend, J.; Galvani, A. The influence of altruism on influenza vaccination decisions. J. R. Soc. Interface 2012, 9, 2234–2243. [Google Scholar] [CrossRef] [PubMed]
- Shim, E.; Grefenstette, J.; Albert, S.; Cakouros, B.; Burke, D. A game dynamic model for vaccine skeptics and vaccine believers: Measles as an example. J. Theor. Biol. 2012, 295, 194–203. [Google Scholar] [CrossRef]
- Shim, E.; Kochin, B.; Galvani, A. Insights from epidemiological game theory into gender-specific vaccination against rubella. Math. Biosci. Eng. 2009, 6, 839–854. [Google Scholar] [CrossRef]
- Sykes, D.; Rychtář, J. A game-theoretic approach to valuating toxoplasmosis vaccination strategies. Theor. Popul. Biol. 2015, 105, 33–38. [Google Scholar] [CrossRef]
- Brettin, A.; Rossi-Goldthorpe, R.; Weishaar, K.; Erovenko, I. Ebola could be eradicated through voluntary vaccination. R. Soc. Open Sci. 2018, 5, 171591. [Google Scholar] [CrossRef]
- Kobe, J.; Pritchard, N.; Short, Z.; Erovenko, I.; Rychtář, J.; Rowell, J. A Game-Theoretic Model of Cholera with Optimal Personal Protection Strategies. Bull. Math. Biol. 2018, 80, 2580–2599. [Google Scholar] [CrossRef]
- Martinez, A.; Machado, J.; Sanchez, E.; Erovenko, I. Optimal vaccination strategies to reduce endemic levels of meningitis in Africa. Preprint 2019. [Google Scholar]
- Chouhan, A.; Maiwand, S.; Ngo, M.; Putalapattu, V.; Rychtář, J.; Taylor, D. Game-theoretical model of retroactive Hepatitis B vaccination in China. Bull. Math. Biol. 2020, 82, 80. [Google Scholar] [CrossRef]
- Scheckelhoff, K.; Ejaz, A.; Erovenko, I.; Rychtář, J.; Taylor, D. Optimal Voluntary Vaccination of Adults and Adolescents Can Help Eradicate Hepatitis B in China. Games 2021, 12, 82. [Google Scholar] [CrossRef]
- Bankuru, S.; Kossol, S.; Hou, W.; Mahmoudi, P.; Rychtář, J.; Taylor, D. A game-theoretic model of Monkeypox to assess vaccination strategies. PeerJ 2020, 8, e9272. [Google Scholar] [CrossRef]
- Augsburger, I.; Galanthay, G.; Tarosky, J.; Rychtář, J.; Taylor, D. Voluntary vaccination may not stop monkeypox outbreak: A game-theoretic model. PLoS Negl. Trop. Dis. 2022, 16, e0010970. [Google Scholar] [CrossRef]
- Cheng, E.; Gambhirrao, N.; Patel, R.; Zhowandai, A.; Rychtář, J.; Taylor, D. A game-theoretical analysis of Poliomyelitis vaccination. J. Theor. Biol. 2020, 499, 110298. [Google Scholar] [CrossRef]
- Acosta-Alonzo, C.; Erovenko, I.; Lancaster, A.; Oh, H.; Rychtář, J.; Taylor, D. High endemic levels of typhoid fever in rural areas of Ghana may stem from optimal voluntary vaccination behaviour. Proc. R. Soc. A 2020, 476, 20200354. [Google Scholar] [CrossRef]
- Caasi, J.; Joseph, B.; Kodiyamplakkal, H.; Manibusan, J.; Aquino, L.; Oh, H.; Rychtář, J.; Taylor, D. A game-theoretic model of voluntary yellow fever vaccination to prevent urban outbreaks. Games 2022, 13, 55. [Google Scholar] [CrossRef]
- Campo, V.; Palacios, J.; Nagahashi, H.; Oh, H.; Rychtář, J.; Taylor, D. A game-theoretic model of rabies in domestic dogs with multiple voluntary preventive measures. J. Math. Biol. 2022, 85, 57. [Google Scholar] [CrossRef]
- Hassan, A.; Tapp, Z.; Tran, D.; Rychtář, J.; Taylor, D. Mathematical model of rabies vaccination in the United States. Theor. Popul. Biol. 2024, 157, 47–54. [Google Scholar] [CrossRef]
- Lopez, S.; Majid, S.; Syed, R.; Rychtář, J.; Taylor, D. Mathematical model of voluntary vaccination against Schistosomiasis. PeerJ 2024, 12, e16869. [Google Scholar] [CrossRef]
- Marquez, R.; Minas, M.; Santos, J.; Yoon, K.; Campo, V.; Oh, H.; Rychtář, J.; Taylor, D. Game-theoretical model of COVID-19 vaccination in the endemic equilibrium. J. Biol. Syst. 2024, 32, 349–370. [Google Scholar] [CrossRef]
- Agusto, F.; Erovenko, I.; Gribovskii, G. A Game-Theoretic Analysis of COVID-19 Dynamics with Self-Isolation and Vaccination Behavior. 2023. Available online: https://ir.library.illinoisstate.edu/cgi/viewcontent.cgi?article=1740&context=beer (accessed on 7 July 2025).
- Crawford, K.; Lancaster, A.; Oh, H.; Rychtář, J. A voluntary use of insecticide-treated cattle can eliminate African sleeping sickness. Lett. Biomath. 2015, 2, 91–101. [Google Scholar] [CrossRef]
- Dorsett, C.; Oh, H.; Paulemond, M.; Rychtář, J. Optimal Repellent Usage to Combat Dengue Fever. Bull. Math. Biol. 2016, 78, 916–922. [Google Scholar] [CrossRef] [PubMed]
- Klein, S.; Foster, A.; Feagins, D.; Rowell, J.; Erovenko, I. Optimal voluntary and mandatory insect repellent usage and emigration strategies to control the chikungunya outbreak on Reunion Island. PeerJ 2020, 8, e10151. [Google Scholar] [CrossRef] [PubMed]
- Angina, J.; Bachhu, A.; Talati, E.; Talati, R.; Rychtář, J.; Taylor, D. Game-theoretical model of the voluntary use of insect repellents to prevent Zika fever. Dyn. Games Appl. 2022, 12, 133–146. [Google Scholar] [CrossRef]
- Rychtář, J.; Taylor, D. A game-theoretic model of lymphatic filariasis prevention. PLoS Negl. Trop. Dis. 2022, 16, e0010765. [Google Scholar] [CrossRef]
- Broom, M.; Rychtář, J.; Spears-Gill, T. The game-theoretical model of using insecticide-treated bed-nets to fight malaria. Appl. Math. 2016, 7, 852–860. [Google Scholar] [CrossRef]
- Han, C.; Issa, H.; Rychtář, J.; Taylor, D.; Umana, N. A voluntary use of insecticide treated nets can stop the vector transmission of Chagas disease. PLoS Negl. Trop. Dis. 2020, 14, e0008833. [Google Scholar] [CrossRef]
- Fortunato, A.; Glasser, C.; Watson, J.; Lu, Y.; Rychtář, J.; Taylor, D. Mathematical modelling of the use of insecticide-treated nets for elimination of visceral leishmaniasis in Bihar, India. R. Soc. Open Sci. 2021, 8, 201960. [Google Scholar] [CrossRef]
- Onifade, A.; Rychtář, J.; Taylor, D. A dynamic game of lymphatic filariasis prevention by voluntary use of insecticide treated nets. J. Theor. Biol. 2024, 585, 111796. [Google Scholar] [CrossRef]
- Gribovskii, G.; Erovenko, I. A game-theoretical model of optimal condom usage to prevent chlamydia infection. J. Dyn. Games 2025. [Google Scholar] [CrossRef]
- Barazanji, M.; Ngo, J.; Powe, J.; Schneider, K.P.; Rychtář, J.; Taylor, D. Modeling the “F” in “SAFE”: The dynamic game of facial cleanliness in trachoma prevention. PLoS ONE 2023, 18, e0287464. [Google Scholar] [CrossRef]
- Agusto, F.; Erovenko, I.; Fulk, A.; Abu-Saymeh, Q.; Romero-Alvarez, D.; Ponce, J.; Sindi, S.; Ortega, O.; Saint Onge, J.; Peterson, A.T. To isolate or not to isolate: The impact of changing behavior on COVID-19 transmission. BMC Public Health 2022, 22, 138. [Google Scholar]
- Wang, Z.; Bauch, C.; Bhattacharyya, S.; d’Onofrio, A.; Manfredi, P.; Perc, M.; Perra, N.; Salathé, M.; Zhao, D. Statistical physics of vaccination. Phys. Rep. 2016, 664, 1–113. [Google Scholar] [CrossRef]
- Chang, S.; Piraveenan, M.; Pattison, P.; Prokopenko, M. Game theoretic modelling of infectious disease dynamics and intervention methods: A review. J. Biol. Dyn. 2020, 14, 57–89. [Google Scholar] [CrossRef] [PubMed]
- Jentsch, P.; Anand, M.; Bauch, C. Prioritising COVID-19 vaccination in changing social and epidemiological landscapes: A mathematical modelling study. Lancet Infect. Dis. 2021, 21, 1097–1106. [Google Scholar] [CrossRef]
- Yong, J.; Choy, B. Noncompliance with safety guidelines as a free-riding strategy: An evolutionary game-theoretic approach to cooperation during the COVID-19 pandemic. Front. Psychol. 2021, 12, 646892. [Google Scholar] [CrossRef]
- Korn, L.; Böhm, R.; Meier, N.; Betsch, C. Vaccination as a social contract. Proc. Natl. Acad. Sci. USA 2020, 117, 14890–14899. [Google Scholar] [CrossRef]
- Schmelz, K.; Bowles, S. Overcoming COVID-19 vaccination resistance when alternative policies affect the dynamics of conformism, social norms, and crowding out. Proc. Natl. Acad. Sci. USA 2021, 118, e2104912118. [Google Scholar] [CrossRef]
- Kretzschmar, M.; Wiessing, L. Modelling the transmission of Hepatitis C in injecting drug users. In Hepatitis C and Injecting Drug Use: Impact, Costs and Policy Options; Jager, J., Limburg, W., Kretzschmar, M., Postma, M., Wiessing, L., Eds.; European Monitoring Centre for Drugs and Drug Addiction: Luxembourg, 2004; Chapter 5; pp. 143–159. [Google Scholar]
- Martin, N.; Vickerman, P.; Foster, G.; Hutchinson, S.; Goldberg, D.; Hickman, M. Can antiviral therapy for hepatitis C reduce the prevalence of HCV among injecting drug user populations? A modeling analysis of its prevention utility. J. Hepatol. 2011, 54, 1137–1144. [Google Scholar] [CrossRef]
- Pybus, O.; Charleston, M.; Gupta, S.; Rambaut, A.; Holmes, E.; Harvey, P. The epidemic behavior of the hepatitis C virus. Science 2001, 292, 2323–2325. [Google Scholar] [CrossRef]
- Blower, S.; Dowlatabadi, H. Sensitivity and uncertainty analysis of complex models of disease transmission: An HIV model, as an example. Int. Stat. Rev. 1994, 62, 229–243. [Google Scholar] [CrossRef]
- Marino, S.; Hogue, I.; Ray, C.; Kirschner, D. A methodology for performing global uncertainty and sensitivity analysis in systems biology. J. Theor. Biol. 2008, 254, 178–196. [Google Scholar] [CrossRef] [PubMed]
- Cox, J.; Morissette, C.; De, P.; Tremblay, C.; Allard, R.; Graves, L.; Stephenson, R.; Roy, E. Access to sterile injecting equipment is more important than awareness of HCV status for injection risk behaviors among drug users. Subst. Use Misuse 2009, 44, 548–568. [Google Scholar] [CrossRef] [PubMed]
Disclaimer/Publisher’s Note: The statements, opinions and data contained in all publications are solely those of the individual author(s) and contributor(s) and not of MDPI and/or the editor(s). MDPI and/or the editor(s) disclaim responsibility for any injury to people or property resulting from any ideas, methods, instructions or products referred to in the content. |
© 2025 by the authors. Licensee MDPI, Basel, Switzerland. This article is an open access article distributed under the terms and conditions of the Creative Commons Attribution (CC BY) license (https://creativecommons.org/licenses/by/4.0/).