1. Introduction
In recent years, epidemic diseases such as severe acute respiratory syndromes (SARS) and influenza A subtype hemagglutinin 1 neuraminidase 1 (H1N1) have occurred frequently. With the increasing population mobility, the spread speed and impact intensity of infectious diseases have accelerated and the prevention and control of infectious diseases have become a key task for government departments [
1]. The impact of infectious diseases manifests as production stagnation and economic downturn, posing a threat to people’s lives and health. At the same time, infectious diseases are prone to spread to surrounding cities. If not controlled in a timely manner, this can cause great losses to the entire country and society. Sudden infectious disease outbreaks make it difficult to coordinate epidemic prevention materials and human resources, and hasty measures will reduce the efficiency of prevention and control. Due to the varying prevalence of infectious diseases and prevention and control capabilities in different regions, each region faces different levels of risk for infectious diseases. Therefore, it is necessary to carry out targeted infectious disease prevention and control work to achieve the goal of scientific prevention and precise implementation [
2]. One of the difficulties in this issue is how to balance the importance of different regions in infectious disease prevention and control in order to improve resource utilization and infectious disease prevention and control efficiency.
However, there is currently no consensus on an evaluation method for determining regional importance in infectious disease prevention and control, and decision makers often judge based on experience. In the prevention and control of infectious diseases, the factors influencing the importance of cities are multifaceted. The construction of an evaluation system and the determination of the relative importance of various indicators are important aspects of urban importance assessment and also a research focus for scholars. The following is an analysis of the research results in these two areas.
- (1)
Construction of evaluation system
When constructing an evaluation system, it is necessary to consider the operability, sensitivity, efficiency, and timeliness of the evaluation indicators [
3]. There is currently no unified standard for determining evaluation indicators in infectious disease prevention and control work either domestically or internationally, but many scholars have conducted research on this. The Delphi method, also known as the expert consultation method, is used by some authors [
4,
5,
6] to determine evaluation indicators. Although there are differences in the research perspectives and backgrounds of these studies from the literature, the research results all indicate that the epidemiological characteristics of infectious diseases, social resources, natural environment, etc., are important evaluation indicators. It can be seen that social environment and prevention and control capabilities are important factors affecting the level of infectious disease prevention and control.
The evaluation system constructed in the above literature covers multidimensional indicators, but these indicators belong to the inherent attributes of the evaluation object and lack research on external influence. Infectious diseases rely on social networks for transmission. Some scholars believe that cities are nodes in the transmission network of infectious diseases, and the strength of urban network connections will affect the risk of disease transmission [
7]. Therefore, it is necessary to incorporate the network connectivity strength of cities into the evaluation system.
Regarding the existing network connection strength indicators, although local indicators such as degree centrality are easy to calculate, they cannot reflect the role of cities in the global network [
8,
9]. The PageRank algorithm measures the importance of nodes from a global perspective. Initially, it was an algorithm that calculated the influence of web pages based on their link relationships. The higher the PageRank value of a web page, the more important it is [
10]. In fact, the essence of the PageRank algorithm is in forming a complex network of web pages and links. Many scholars have utilized this feature to apply the PageRank algorithm to node importance ranking. The PageRank algorithm has been proven as feasible and important for evaluating nodes in urban rail transit topology networks and product knowledge diffusion networks [
11,
12]. Therefore, this article chooses the PageRank algorithm to quantify the global influence of cities in the population mobility network.
Based on the above analysis, it can be concluded that scholars have conducted in-depth research on evaluation systems for infectious disease prevention and control, but there is still no research incorporating the external influence of a region into such evaluation systems. The strength of population connections reflects the external influence of a region. The PageRank algorithm considers the global importance of nodes and is suitable for analyzing the connectivity of cities in population mobility networks, which can supplement the shortcomings of existing evaluation systems.
- (2)
Determination of indicator weights
The analytic hierarchy process (AHP) is a common method for determining the weights of indicators. Many scholars use the AHP to determine the weights of indicators in infectious disease evaluation systems [
4,
5,
6], but this method is prone to subjective bias. Unlike the AHP, the entropy weight method is a method that relies on data itself to determine objective weights. In its application, the entropy weight method has problems such as differences in information entropy and contradictions between entropy weights, as well as significant differences in the entropy weights of various indicators [
13,
14,
15]. Some scholars have linearly weighted the AHP and entropy weight method to obtain combined weights, which have been applied in fields such as power business evaluation [
16], project evaluation [
17], and transportation company evaluation [
18], making the evaluation results more practically valuable.
After determining the indicator weights, most infectious disease prevention and control evaluation methods directly linearly weight the attribute values of each sample with the indicator weights. Obviously, the results obtained from this calculation method represent the final scores of samples in isolation, and cannot reflect the evaluation gap between samples. Technique for Order Preference by Similarity to an Ideal Solution (TOPSIS) is a comprehensive evaluation method based on the distance between samples and ideal solutions [
19]. Different methods can be used to determine the weights of indicators based on the evaluation objectives, achieving the optimization of the ranking method for approaching ideal solutions [
20,
21].
In summary, the combination of the AHP and entropy weight method has been widely used to determine the weights of indicators. However, in research on evaluation systems for infectious disease prevention and control, scholars generally use the AHP to obtain indicator weights and linearly weight attribute values, resulting in indicator weights relying only on expert experience and evaluation results that cannot accurately reflect the evaluation objectives. In addition, assessing the importance of cities in infectious disease prevention and control requires not only the consideration of economic and medical levels, but also needs to pay attention to the impact of cities on population mobility. There is no scientifically unified measurement method for the indicator of the impact of cities on population mobility. TOPSIS can determine the correlations between the importance of urban epidemic prevention and multiple influencing factors. Therefore, this paper integrates the PageRank algorithm in complex networks into an index system for infectious disease prevention and control and constructs a city importance evaluation model based on TOPSIS, providing a more scientific decision-making reference for the evaluation of urban epidemic prevention importance.
This article comprehensively evaluates the importance of cities in infectious disease prevention and control, and carries out the following work:
- (1)
In the context of infectious disease prevention and control, we establish a comprehensive evaluation index system for the importance of cities based on economic level, population situation, medical level, and the spread of infectious diseases. This indicator system aims to implement precise measures and achieve the graded prevention and control of infectious diseases, laying the foundation for a comprehensive evaluation of the importance of cities in the precise prevention and control of infectious diseases.
- (2)
In an urban population mobility network, the PageRank algorithm is used to comprehensively examine the population aggregation ability of cities in local communities and the overall network. We establish a new indicator to measure the importance of urban population mobility and use this indicator as a secondary indicator of the evaluation system. This indicator overcomes the deficiency of previous indicator systems lacking the global attribute of population agglomeration ability, enriches the dimensions of the urban importance evaluation system, and enables decision makers to comprehensively consider the impact of a city on the overall network, making the decision results more practically valuable.
- (3)
We analyze the characteristics of urban importance evaluation, improve the entropy weight method based on its shortcomings, determine the weights of indicators in the evaluation system using the AHP, obtain the influence of various factors on urban importance, and construct an urban importance evaluation model based on community division and TOPSIS. We use this evaluation model to assess the importance of 297 cities in China and identify key cities for prevention and control. This article quantifies the importance of cities using a systematic comprehensive evaluation method, providing decision support for the precise prevention and control of infectious diseases, reducing the subjectivity of empirical decision making, and making the evaluation results both scientific and targeted.
The innovations of this article can be summarized as follows:
- (1)
We construct an evaluation index system that integrates the topological features of population mobility networks, propose the importance of population mobility based on the PageRank algorithm and community division, and quantify the role of cities as communication hubs in local communities and overall networks. We overcome the deficiency of previous indicator systems lacking the global attribute of population agglomeration ability, enrich the dimensions of the urban importance evaluation system, and enable decision makers to comprehensively consider the impact of cities on the overall network.
- (2)
We combine the improved entropy weight method with the AHP to form a weight model. By introducing community structure weighting and subjective experience correction, we solve the problem of excessive weight in epidemic data in the traditional entropy weight method while reducing the subjectivity of empirical decision making.
- (3)
We establish a city epidemic prevention importance evaluation model, named city importance evaluation, based on the division of communities and TOPSIS (CICT), to achieve comprehensive evaluation in multiple dimensions such as economy, healthcare, population, and mobile networks and accurately identify high-risk cities.
These innovations break through the limitations of existing research, which places more emphasis on the indicators themselves and does not focus on network connections, providing new methodological support for optimizing resource allocation in infectious disease prevention and control.
The prevention and control of infectious diseases are related to people’s basic interests. The comprehensive evaluation method constructed in this article can help implement differentiated prevention and control strategies, provide scientific reference methods for decision makers to carry out infectious disease urban governance, and promote the development of infectious disease prevention and control work towards refinement and standardization.
2. Methods
The TOPSIS method, which combines the AHP and entropy weight method, is a scientifically effective comprehensive evaluation method for assessing the importance of infectious disease prevention and control. In addition, the PageRank algorithm, as a method for measuring the global importance of nodes in complex networks, can enrich the dimensions of the evaluation system. This section summarizes and organizes these methods and their calculation processes.
2.1. Technique for Order Preference by Similarity to Ideal Solution
The Technique for Order Preference by Similarity to Ideal Solution method (TOPSIS), which approximates the ideal solution ranking, is a multi-criteria evaluation method [
22]. TOPSIS first normalizes the original data matrix and then calculates the distance between each evaluation object and the optimal and worst solutions to obtain the relative closeness between each evaluation object and the optimal solution. The evaluation steps are as follows.
Step 1: Obtain
evaluation indicators for
evaluation objects
. The value corresponding to the indicator sorted as
of the object sorted as
is
. The evaluation indicator matrix is denoted as
, as shown in Equation (1), as follows:
Step 2: Standardize and weight the evaluation index matrix. The standardized evaluation index matrix
is obtained from the evaluation index matrix
and the weights of each index
, as shown in Equation (2). Among them,
,
.
Step 3: Determine the positive and negative ideal solutions for each indicator. Calculate the positive ideal solution and negative ideal solution of indicator .
Step 4: Calculate the closeness of each sample to the positive and negative ideal solutions. The Euclidean distances between sample
and the positive and negative ideal solutions are
and
, respectively, as follows:
Step 5: Calculate the relative closeness degree
of sample
. Relative closeness reflects the degree of closeness between the sample and the optimal sample. The larger the value of
, the closer the sample
is to the positive ideal sample, indicating that the sample is better. The calculation method for
is as follows:
2.2. Weight Determination Method
2.2.1. Analytic Hierarchy Process Method
The principle of the AHP is to stratify each indicator according to its impact relationship, and then experts compare the importance of each indicator in each layer pairwise. Finally, the weight of each indicator in each layer is determined by the weight relationship between each level [
23]. The specific steps are as follows:
Step 1: Establish a hierarchical relationship diagram of indicators. Based on the evaluation objectives, summarize the hierarchical relationship of each evaluation indicator. The indicators at each level are influenced by the indicators at the next level.
Step 2: Construct a judgment matrix based on the indicator hierarchy diagram and expert experience. Experts compare the evaluation indicators of the same level pairwise, based on the influence of the evaluation indicators on the indicators of the previous level. Calculate the weights for n indicators.
Construct a judgment matrix based on the comparison results using the 1–9 scaling method shown in
Table 1,
represents the importance of indicator
relative to indicator
, and
,
.
Step 3: Determine the weights of each layer’s indicators based on the judgment matrix. Calculate the maximum eigenvalue and corresponding eigenvector of the judgment matrix, and perform consistency checks on the maximum eigenvalue. The consistency check is carried out according to the following process:
- (1)
From the calculation formula of matrix eigenvalues and eigenvectors, obtain the maximum eigenvalue of the judgment matrix and the eigenvector corresponding to the maximum eigenvalue, satisfying the following equation:
- (2)
Calculate the consistency index using the maximum eigenvalue
and find the corresponding
order average random consistency index
in the table. The 5–15th-order average random consistency index is shown in the
Table 2.
- (3)
Calculate the consistency ratio using the consistency index and the -order average random consistency index . When the consistency ratio , it is considered that the judgment matrix has passed the consistency test.
Step 4: Calculate the final weight of each layer’s indicators. The feature vectors obtained through consistency testing represent the importance of the indicators relative to the indicators at the previous level, and are normalized accordingly. Then, for each level of indicators, multiply the weights step by step from bottom to top to obtain the impact of each indicator on the evaluation objectives.
In the AHP, the establishment of hierarchical structures and the scoring of indicators heavily rely on the subjective experience of experts. Therefore, in the process of applying the AHP, there is a high demand for decision makers’ experience, and the results are highly subjective.
2.2.2. Entropy Weight Method
In statistics, entropy is an indicator that measures the disorder of a dataset, and the entropy value depends on the degree of dispersion of the data itself. The greater the degree of dispersion of the dataset, the greater the entropy [
24]. The entropy weight method utilizes the basic principle of entropy to measure the amount of information provided by an indicator, that is, the degree of variation of the indicator, by evaluating the differences between the evaluation objects in the same indicator. The greater the differences in the indicator values of each evaluation object, the greater the degree of variation of the indicator, the more information it can provide, and the greater its weight. The process of calculating indicator weights using the entropy weight method is as follows:
Step 1: Construct an indicator evaluation matrix. Select indicators that affect the evaluation objectives, construct an evaluation matrix, and take the evaluation matrix established in Equation (1) as an example. According to the type of impact of indicators on the evaluation objectives, evaluation indicators can be divided into positive evaluation indicators (i.e., extremely large indicators that have a positive impact on the objectives) and negative evaluation indicators (i.e., extremely small indicators that have a negative impact on the objectives).
Step 2: Normalize each indicator. For the maximum index
, normalization is performed using Equation (7). For extremely small indicators
, as shown in Equation (8), they should be normalized and also subjected to forward normalization.
Step 3: Calculate the entropy values of each indicator. The formula for calculating the entropy value
of indicator
is shown in Equation (9).
Step 4: Calculate the entropy weight of each indicator. The entropy weight coefficient
of indicator
is defined as Equation (10), which represents that the greater the degree of variation of the indicator, the greater its entropy value, and the stronger the influence of the indicator on the evaluation objective.
From the calculation steps of the entropy weight method mentioned above, it can be seen that Equation (10) will result in significant differences in entropy weights when the entropy values of different indicators are close to 1 and the difference is small, which contradicts the principle of entropy weight [
13]. In addition, using the above calculation method often leads to a high entropy weight of a certain indicator, which can easily affect the evaluation results and fail to fully consider the importance of all indicators [
14].
2.3. PageRank Algorithm and Its Improvement on Weighted Networks
The basic idea of the PageRank algorithm is that when page
has a link pointing to page
, it is considered that page
has received the score contributed by page
. The greater the importance of page
, the higher the contribution value received by page
[
25]. The PageRank algorithm expresses the importance of page
, PageRank (
), as shown in Equation (11), as follows:
Among them, PageRank () is the importance of page , is the output of page , and is the number of all pages. is the damping coefficient, which represents the probability of a user reaching a certain page and continuing to browse backwards at any time. Its value is usually taken as 0.85.
The calculation formula for PageRank value shows that (1) the more pages pointing to page , the higher the PageRank value of page , and, therefore, page is more important; (2) the higher the importance of page , the higher the PageRank value of its linked page ; and (3) the more pages that page points to, the lower the PageRank value of page . The calculation process for PageRank value is based on Markov random chain, and after multiple iterations, the PageRank value tends to stabilize.
Due to the fact that the PageRank algorithm is designed for unweighted networks, the importance of links between nodes varies in real-world networks. There have been studies that have made weighted improvements to the formula for PageRank values [
26,
27]. During each iteration, the PageRank value of each node is iteratively assigned to the object it points to based on the edge weights between nodes. The link weight ratio from node
to node
is represented by
, which is the link weight value assigned by node
to node
. The calculation formula for
is as follows:
In the formula,
is the link weight from node
to node
and
is the sum of the weights of all outbound links from node
. Therefore, the calculation formula for the PageRank value
of the improved weighted network node
is as follows:
It can be seen that the improved PageRank algorithm not only has the properties of the original PageRank algorithm, but also indicates that the greater the link weight between node
and node
, the greater the PageRank value obtained by node
from node
. The improved PageRank algorithm can be applied to node importance calculation in directed weighted networks and adapt to different evaluation environments [
28,
29].
3. City Importance Evaluation Model Based on Community Division and TOPSIS
Based on the characteristics of the methods and the needs of infectious disease prevention and control scenarios, the evaluation model constructed in this article integrates and improves the following methods. The PageRank algorithm focuses on the linkage relationships between nodes, which is consistent with the population mobility relationship between cities, and is a feasible algorithm for measuring the importance of population mobility. This article first uses an improved PageRank algorithm to comprehensively examine the population mobility status of cities from both local and global perspectives based on the community division results in the population mobility network, in order to solve the problem of the lack of a unified calculation method for this indicator. Secondly, the AHP and entropy weight method establish the weights of each indicator from subjective and objective perspectives, respectively. This article improves the entropy weight method and combines it with the AHP to determine the weights of indicators. The obtained weights are based on the degree of dispersion of the data itself, taking into account the decision-making experience of experts and overcoming the shortcomings of the entropy weight method in urban importance assessment, which can improve the credibility of subsequent evaluations. TOPSIS uses the difference between the sample and the optimal sample to represent the importance of the sample. This article applies TOPSIS to the importance evaluation of infectious disease prevention and control in cities, and the evaluation results focus on a city’s position in the entire system, rather than limited to its own attributes, which can provide intuitive references for differentiated prevention and control.
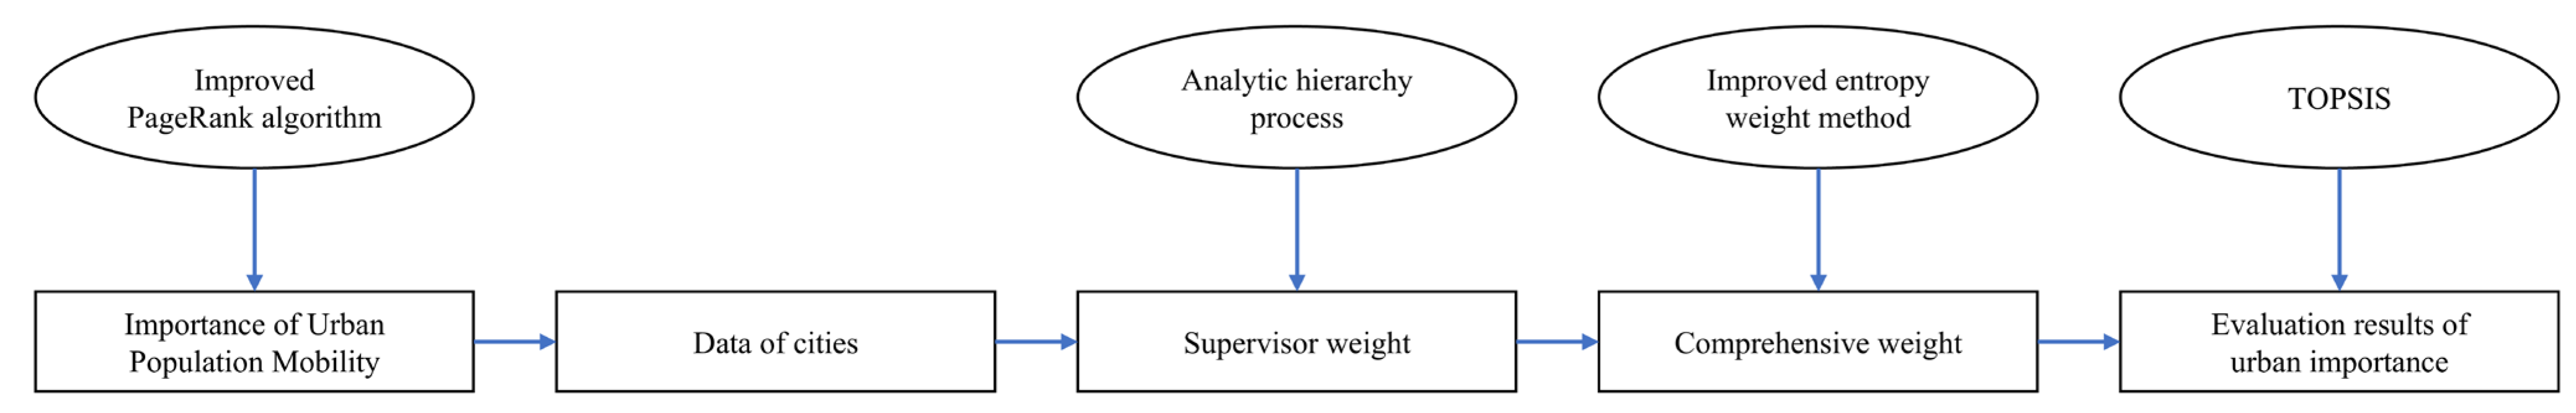
Based on the above methods, this article establishes a city importance evaluation model named city importance evaluation based on the division of communities, TOPSIS (CICT). It ranks the indicators that affect the importance of cities in infectious disease prevention and control and identifies key prevention and control cities in infectious disease prevention and control. The advantage of the CICT evaluation model is that the construction of the evaluation system comprehensively considers the factors that affect the importance of urban epidemic prevention, enriching the research dimensions of urban epidemic prevention. The comprehensive evaluation results are both scientific and targeted, making urban epidemic prevention decisions more reasonable and effective. The specific process of the CICT evaluation model is shown in
Figure 1, where rectangular text boxes represent data and elliptical text boxes represent specific methods.
The process of the CICT evaluation method is as follows:
- (1)
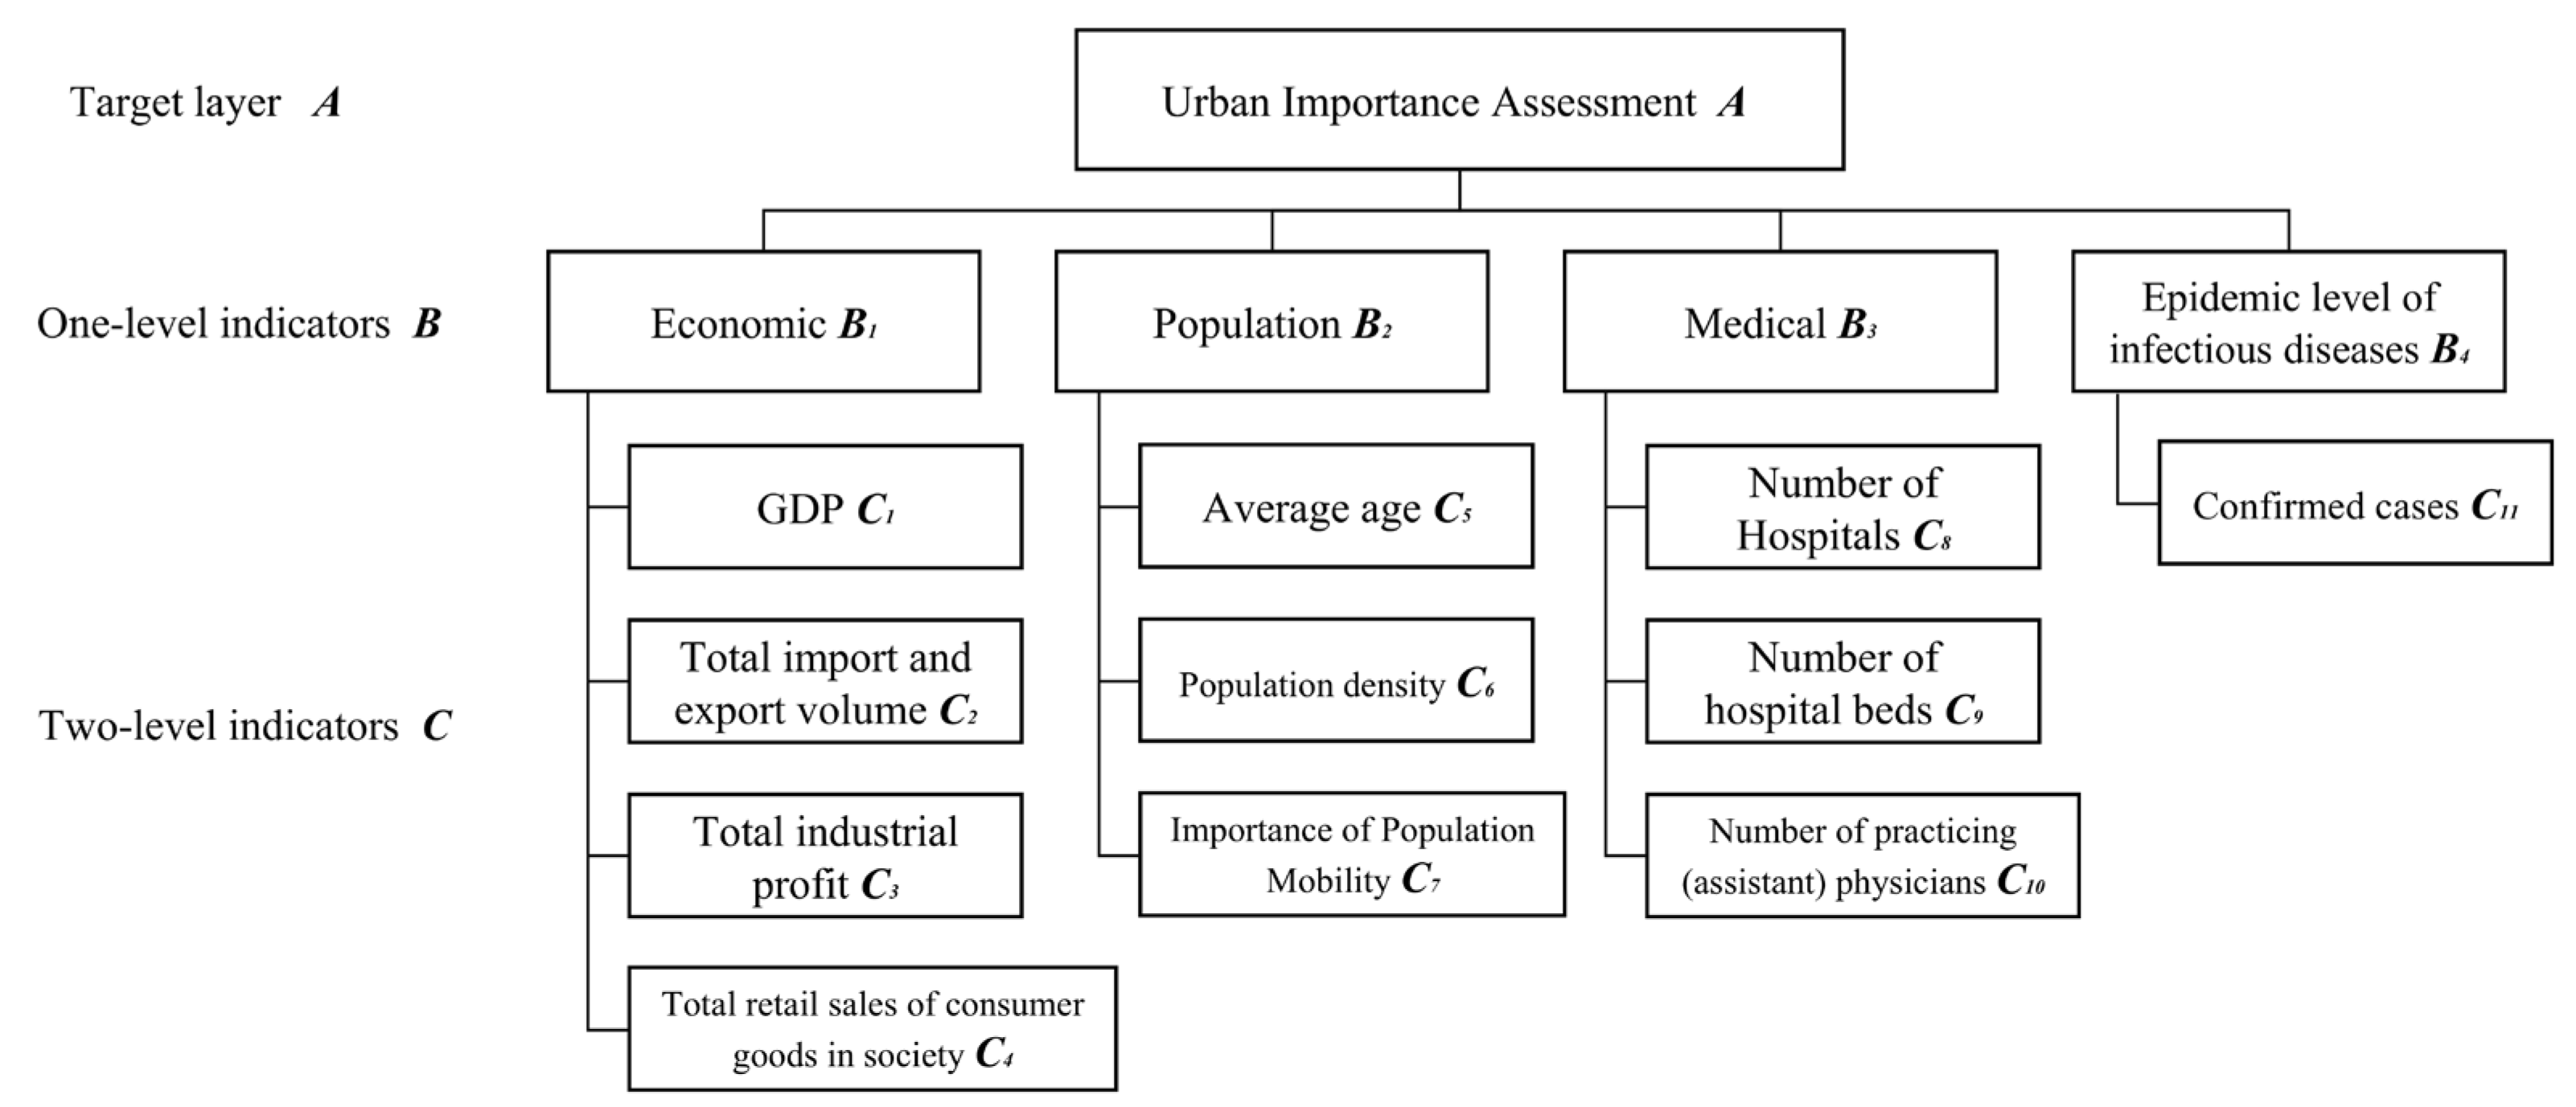
We develop an evaluation index system and categorize the factors influencing the significance of urban prevention and control into two tiers of indicators. The tier-one indicators directly impact the importance of urban epidemic prevention, yet they are often challenging to quantify directly with numerical values. By dissecting these primary indicators, we can further delineate the influencing factors. Tier-two indicators materialize the primary indicators and facilitate measurement. Taking the epidemiological traits of infectious diseases, social resources, and other pertinent factors as crucial evaluation indicators, as well as the feasibility and promptness of the evaluation indicators, this article constructs an indicator system covering the core dimensions of infectious disease prevention and control. This system mirrors social resources through economic impact, the transmission risks of infectious diseases via population density and mobility, the prevention and control capacities of the social system through medical resources, and the epidemic’s current state through confirmed cases, as depicted in
Figure 2. Within the CICT evaluation model, the tier-one indicators encompass economic indicators, population indicators, medical indicators, and infectious disease prevalence indicators, whereas the tier-two indicators represent specific indicators reflective of the tier-one indicators.
Figure 3 illustrates the impact of the indicator system on the importance of urban epidemic prevention. Specifically, economic indicators comprise the following four tier-two indicators: GDP, total import and export volume, total industrial profits, and the total retail sales of consumer goods, which mirror the economic standing of each city. The higher the economic level of a city, the greater the economic threat posed by infectious disease outbreaks within the city to the entire society. Population indicators include average age, population density, and the importance of population mobility. Generally speaking, older populations require more attention, and population density and population mobility, respectively, affect the speed of infectious disease spread within and outside cities. Medical indicators include the number of health institutions, the number of beds in health institutions, and the number of health technicians, reflecting the ability of each city to independently prevent and control infectious diseases. The prevalence of infectious diseases is indicated by the number of confirmed cases.
- (2)
We calculate the importance of the secondary indicator called population mobility. Currently, there is no consensus on the measurement criteria for the importance indicators of population mobility. This article concentrates on the urban agglomeration within population mobility networks, taking into account the population aggregation capacity of both communities and cities. It proposes a novel method for assessing the influence of cities within population mobility networks, utilizing the PageRank algorithm adapted for weighted networks.
The population mobility intensity
is defined as the scale of population outflow from city
to city
within
days. The specific calculation formula is as follows:
Among them, refers to the proportion of the population flowing from city to city to the total outflow population of city on date , and refers to the proportion of the outflow population of city to the total outflow population of all cities on date . Therefore, the outflow intensity represents the proportion of the total population flowing from city to city to the total outflow population of all cities.
Based on the daily migration scale and population outflow ratio distribution of n cities, a spatial relationship matrix of the population flow network is constructed, with the vertical-axis city as the outflow city and the horizontal-axis city as the inflow city. We reconstruct a directed weighted network
, with the city as the network node
, the direction of population flow as the directed edge
, and the strength of population outflow
as the edge weight. The population flow network is represented in the form of the following adjacency matrix:
Next, we use the Louvain algorithm to divide cities into communities in the population mobility network. By comprehensively examining the importance and overall importance of urban communities, the importance of city
in the population mobility network is represented by the formula
, as shown in Equation (16), as follows:
In Equation (16),
represents the PageRank value of city
belonging to community
within the community,
represents the PageRank value of community
in the community network
, and
represents the PageRank value of city
in the population mobility network
. The calculation methods for each indicator are shown in
Table 3.
According to the above method, represents the PageRank value of city in the entire population mobility network, focusing on the overall connectivity of the city. represents the PageRank value of city belonging to community after introducing community weights, focusing on the regional connectivity of the city. Parameter is the distribution coefficient of population mobility intensity, representing the contribution of overall connectivity and regional connectivity to the importance indicators of urban population mobility. When , it represents that the importance of urban population mobility is completely determined by the importance of the community in which the city is located and the importance of the city in the community, and is independent of the importance of the city in the overall network. When , the situation is completely opposite.
- (3)
An enhanced entropy weight method, when integrated with the AHP, is employed to ascertain the weights of each indicator. The AHP serves to discern the varying degrees of importance among different indicators. However, its outcomes are inherently subjective and susceptible to considerable human influence. Conversely, the entropy weight method yields objective weights, yet it may lack specificity tailored to distinct evaluation objectives and overlooks the decision preferences of the evaluators. Consequently, the weights derived from the exclusive application of either method are constrained by their respective limitations. In order to obtain more practical and objective results, this article combines the AHP and improved entropy weight method to define the comprehensive weight of indicator in Equation (17), as follows:
In Equation (17),
is the subjective weight obtained using the AHP and
is the entropy value of indicator
. Considering the shortcomings of the entropy weight method, this article improves the formula for calculating entropy values, as shown in Equation (18). Specifically, due to the absence of confirmed cases in some cities, a parameter
is introduced into the formula for calculating the entropy value of confirmed cases, ensuring that the entropy value remains meaningful. The entropy value is adjusted to the weighted average of the entropy values of confirmed cases within each community and the overall network, with a weighting coefficient
, which is the distribution coefficient of population mobility intensity.
It can be seen that the CICT evaluation model adopts the improved entropy weight method for calculating indicator weights, which can enhance the adaptability of the entropy weight method in evaluating the importance of urban epidemic prevention. Specifically, the improved entropy weight method has the following advantages:
Firstly, the enhanced entropy weight method accounts for the influence of population mobility on fluctuations in the incidence of confirmed cases. By linking the weight of confirmed cases to urban communities within the population mobility network, this approach ensures that the comprehensive weighting of indicators more accurately reflects the evaluative objectives of the study.
Secondly, this methodology incorporates the subjective weights derived from the AHP into the conventional entropy weight calculation formula. By amalgamating the subjective insights of experts with objective attribute values, a more comprehensive weighting system is established. This integration helps to produce both practical and actionable evaluation results.
Thirdly, in traditional entropy-weighting methods, when the entropy values of indicators tend toward 1, there will be a problem where the entropy values of different indicators differ very little, but the resulting entropy weights have significant differences. Furthermore, the entropy weight method frequently exhibits an issue where the weightage of a particular indicator becomes disproportionately large, thereby causing the evaluation outcomes to hinge excessively on that singular indicator. The delineation of comprehensive weights posited in this article circumvents this issue, ensuring that the weight discrepancies among indicators remain within a reasonable boundary.
- (4)
Based on the comprehensive weight calculation method proposed in Step (3), the importance of each city is evaluated using TOPSIS.
Traditional evaluation methods for infectious disease prevention and control often directly weight the attribute values and weights of indicators linearly, which calculates sample scores in isolation and cannot reflect the relative importance differences between cities. TOPSIS, by measuring the distance between each city and the ideal and negative ideal solutions, can reflect the relative position of samples in the system and perform multi-factor correlation analysis. The specific principle and process of this are shown in
Section 2.1.
4. Empirical Analysis
This article selects secondary evaluation indicators from the following four dimensions: the city’s economic level, population situation, medical level, and the prevalence of infectious diseases. Among the 11 secondary indicators adopted in this paper, the impact of cities in the national population flow is relatively abstract, lacking a unified measurement standard. To address this issue, the improved PageRank algorithm in the population mobility network is used to calculate the importance of population mobility, followed by the adoption of the CICT evaluation model to measure the importance of population mobility in each city.
4.1. Calculation of Importance Indicators for Urban Population Mobility
The exchange of population and other factors between cities forms a complex and diverse network. As communication between cities becomes increasingly close, the risk of local area networks being impacted by emergencies also increases, and in some cases, this can lead to cascading failures of the entire network. The flow of population inevitably affects the transmission trend of infectious diseases. This section analyzes the urban population flow network in China and uses an improved PageRank algorithm to measure the importance of cities in the population flow network.
4.1.1. Construction of Population Mobility Network
Baidu Migration uses Location-Based Service (LBS) technology [
30] to dynamically record the real-time population flow trajectory between cities, which is suitable for analyzing the daily flow of people using smart devices. This article uses the Baidu Migration platform to obtain the daily migration population relationship between 297 prefecture-level cities and municipalities directly under the central government in China from 1 March 2022 to 31 May 2022, amounting to a total of 92 days. Migration data with a population outflow intensity below one is excluded, and the population flow between these 297 cities is calculated accordingly.
Using the network analysis tool in ArcGIS10.8 software, the adjacency matrix of the population mobility network is reflected in the real map and a population mobility map is drawn, as shown in
Figure 4. The lines on the map represent the population mobility.
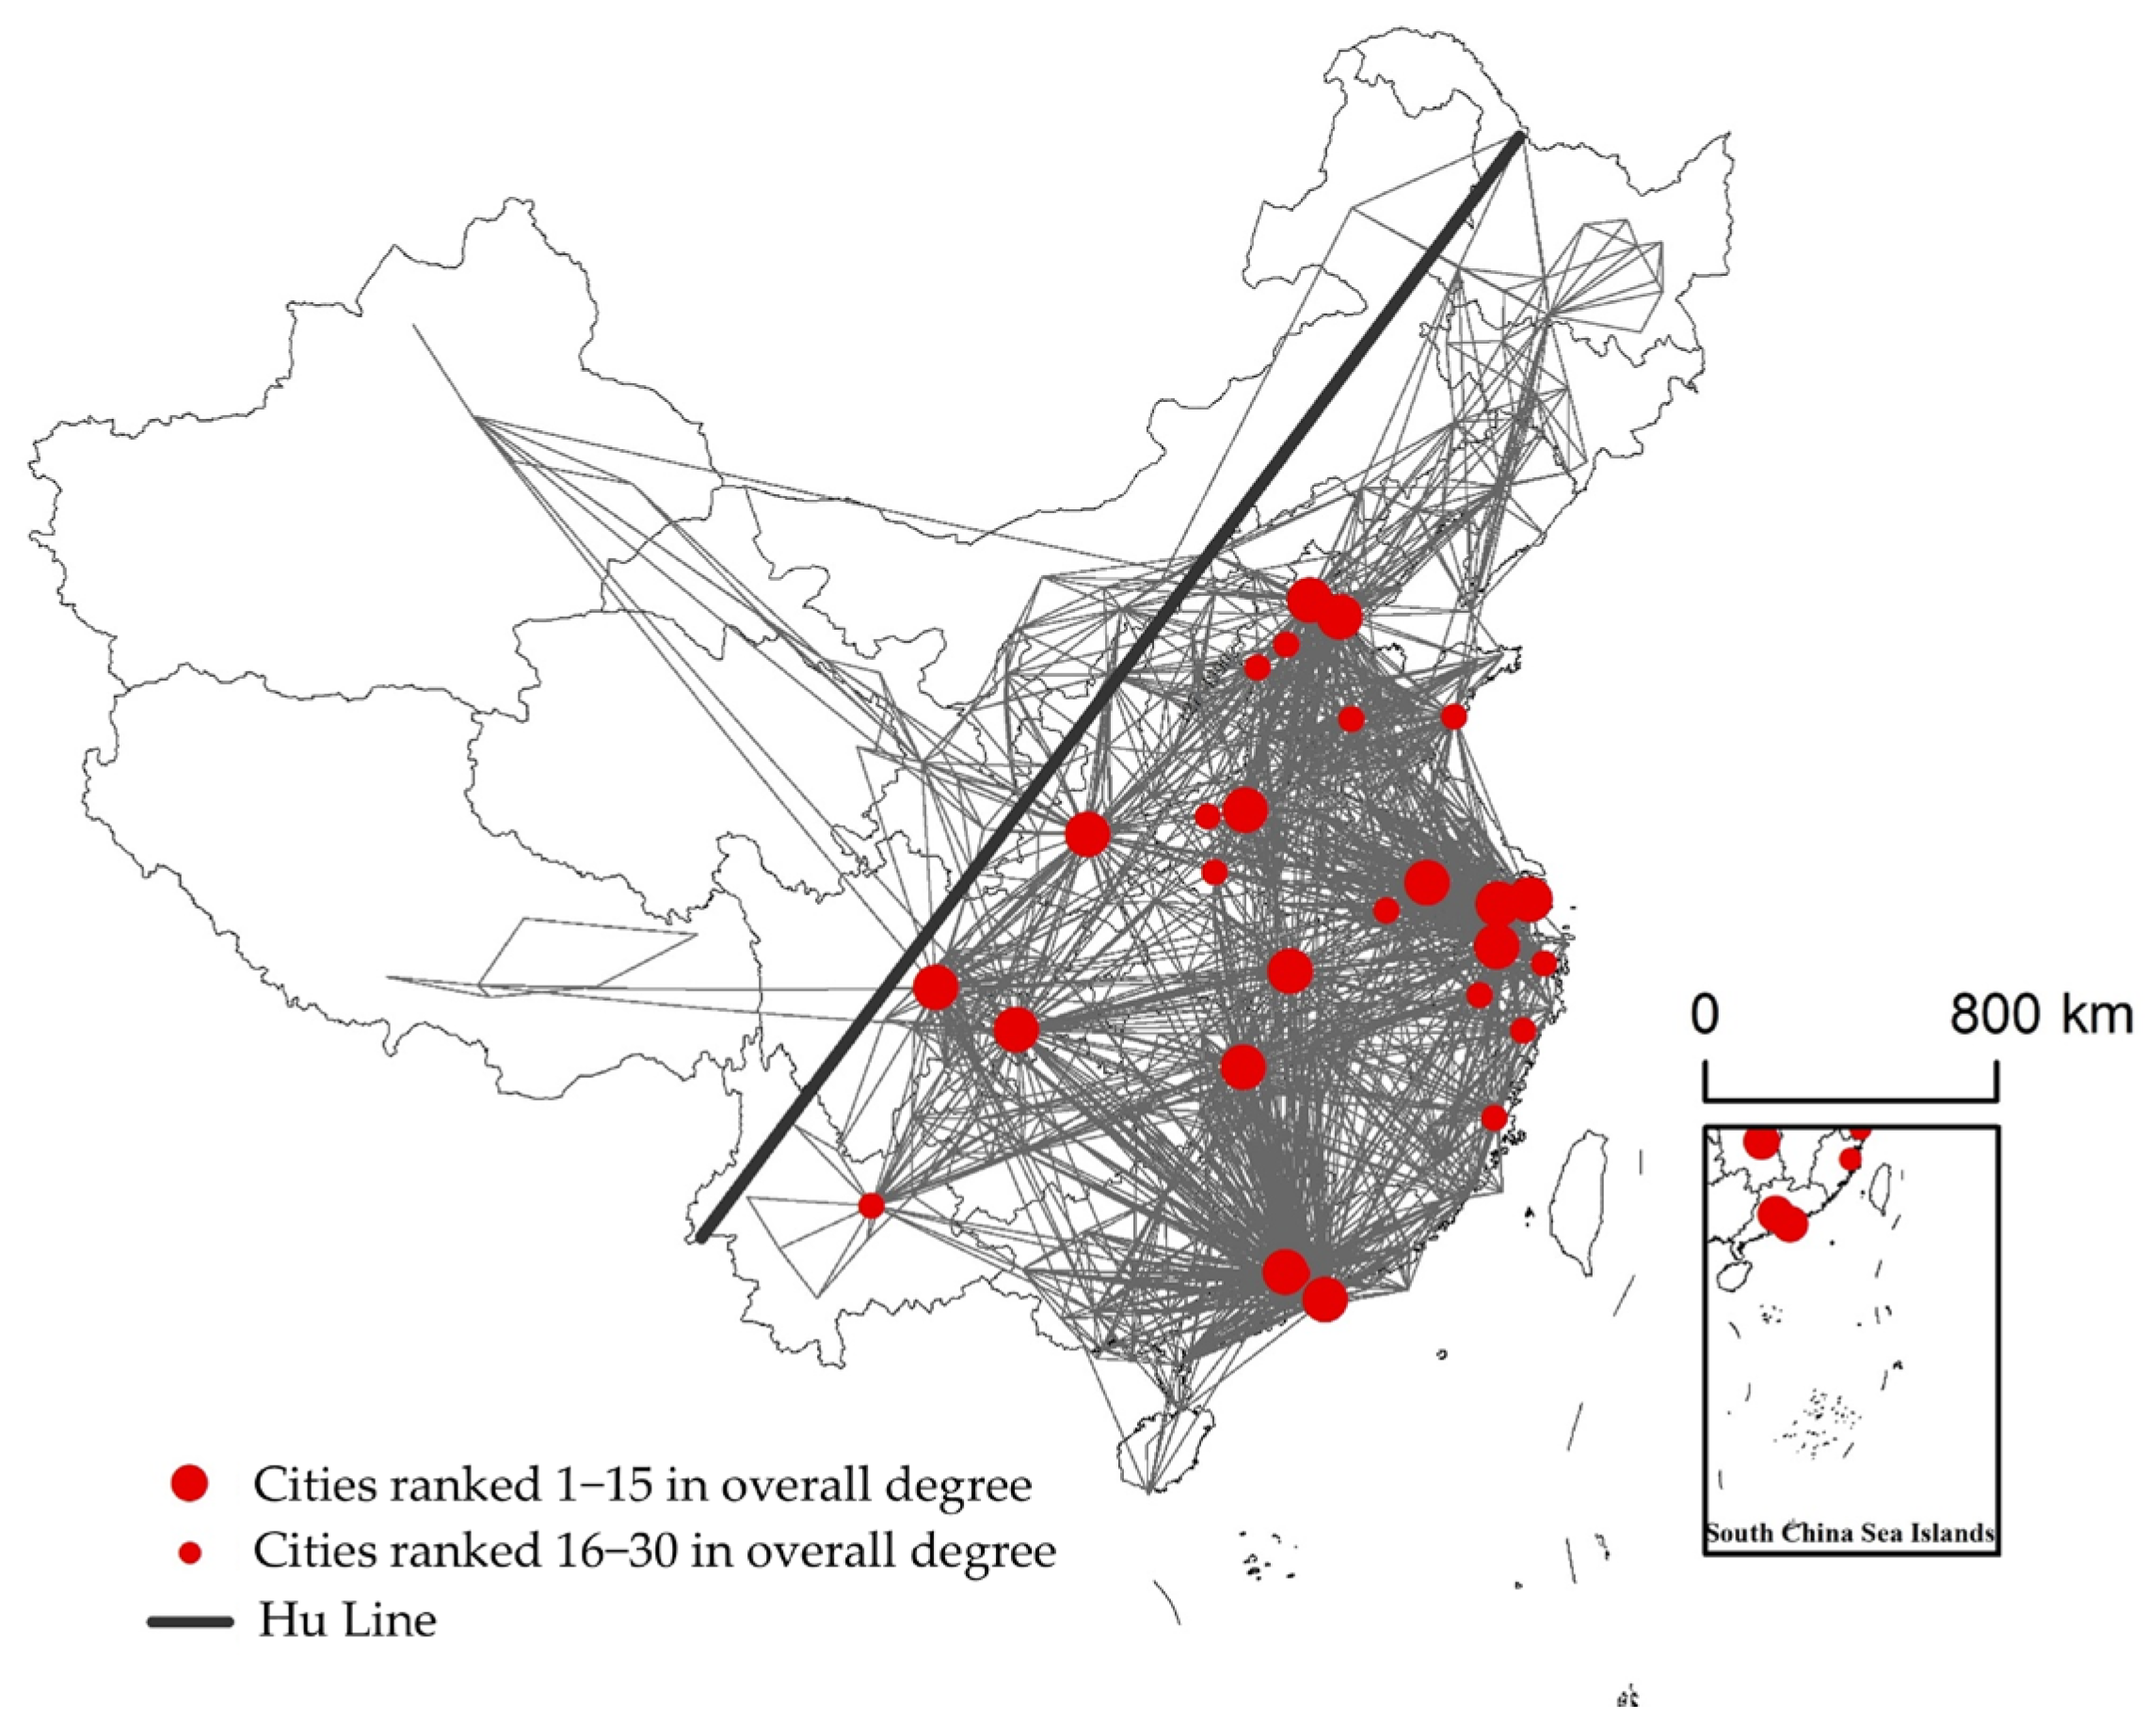
Using the complex network analysis method, we found that China’s population flow network has the following characteristics:
Firstly, there are significant differences in degree values between cities, and cities with higher administrative levels have a larger overall degree value, indicating stronger attractiveness and radiation to the population. The city with the highest total degree value is Beijing, which has significantly higher in and out degrees than other cities. The total degree values of other provincial-level municipalities and provincial capital cities (such as Xi’an, Zhengzhou, Shanghai, and Chongqing) are also significantly higher than those of other cities, giving them a clear advantage in the population mobility network. By overlaying the Hu Huanyong Line, it was found that cities with high total degree values are distributed on the southeast side of the Hu Huanyong Line, while cities with low total degree values, such as Sansha City, Nagqu City, and Shigatse City, are all smaller border areas. The spatial pattern reflecting population mobility has geographical characteristics, and the ability of cities to gather population is influenced by geographical location and environment.
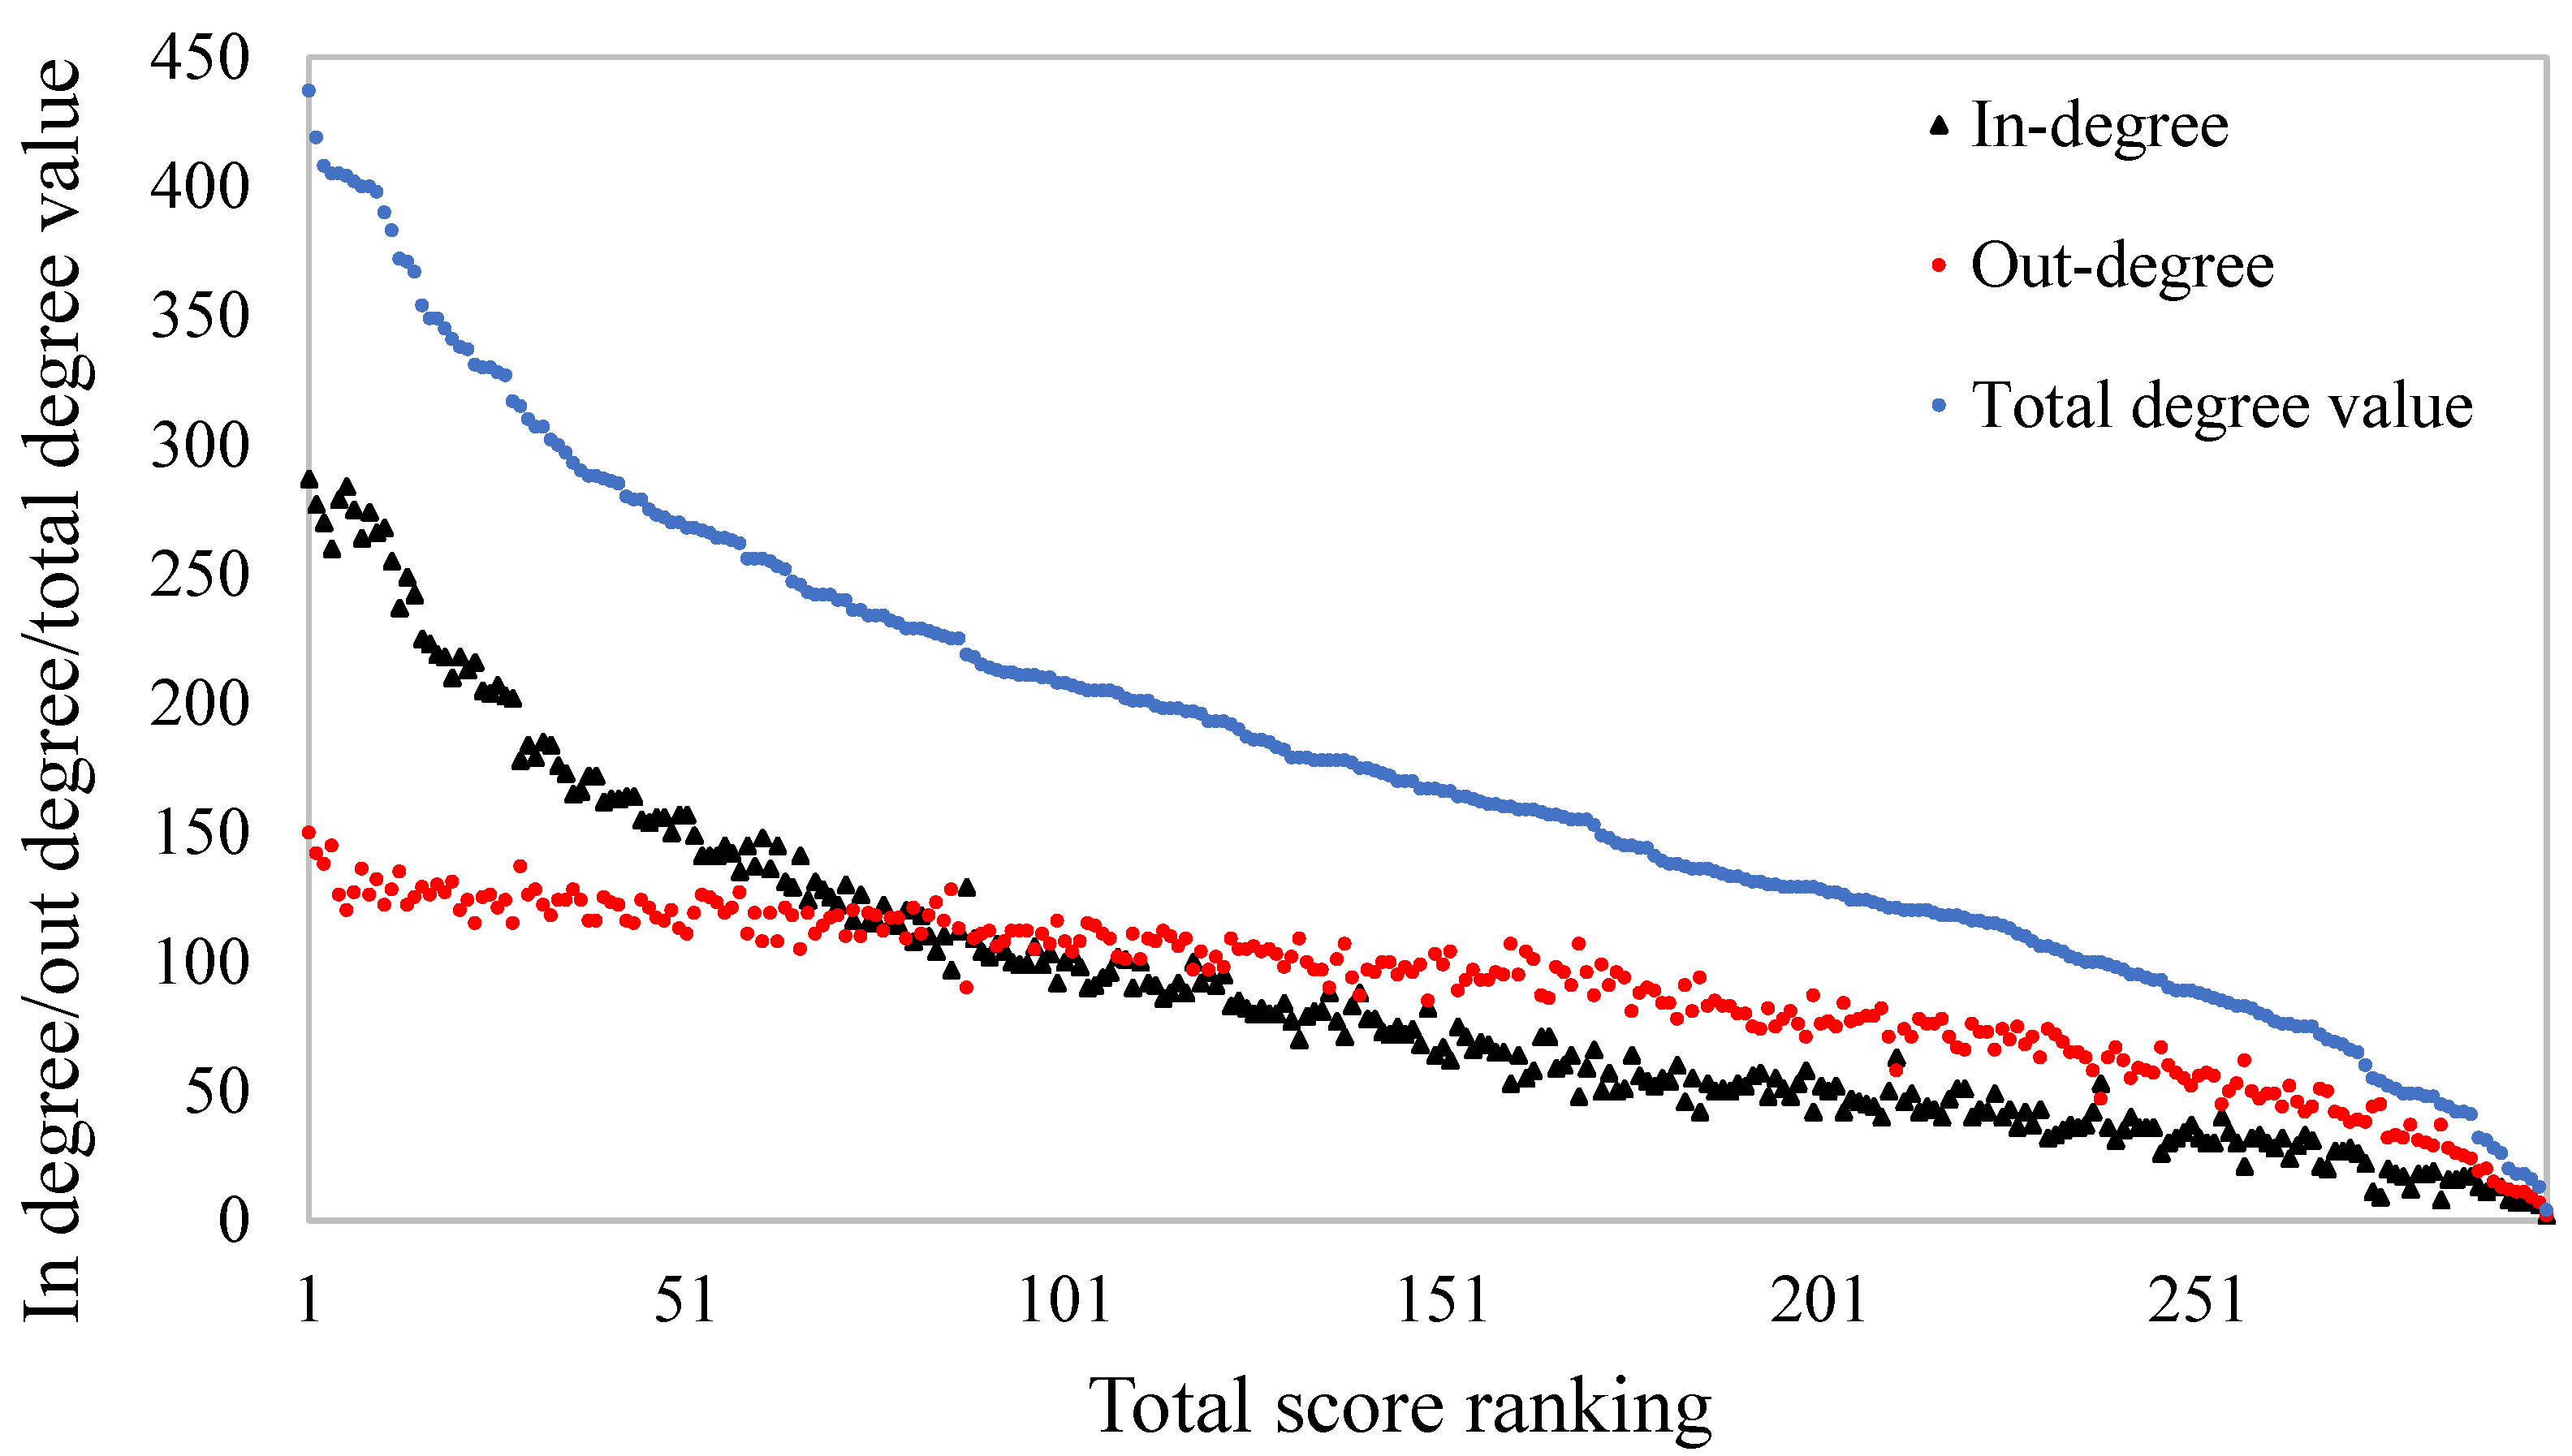
Secondly, there is a high correlation between the degree of entry and exit of each city. A correlation test is conducted on the in degree and out degree values, and the Pearson correlation coefficient reaches 0.989, indicating a significant positive correlation between in degree and out degree values at the 0.01 level. However, the entry and exit values of most cities are unbalanced, and the characteristics of population flow are highly correlated with the total degree value, as shown in
Figure 5. Specifically, cities with low total degree values generally have a lower degree of inflow than outflow, indicating that the intensity of population outflow is greater than that of inflow. Most of these cities are ordinary prefecture-level cities with low attractiveness to the population, leading to population outflow; cities with a high total degree have a significantly higher degree of entry than exit. Most of these cities are at the sub-provincial level or above, with developed economies and transportation, and are major centers for population mobility and distribution.
Thirdly, according to
Table 4, it can be seen that the average cohesion coefficient of nodes in the population mobility network is 0.7386, which is much higher than the clustering coefficient of 0.1972 for random networks with the same number of nodes. The average path length of the network is 1.7845, which is smaller than the average path length of the random network, which is 1.7979. The average path of the population mobility network is short and highly clustered, indicating the existence of a small-world phenomenon in the population mobility network, where local networks can form community structures.
4.1.2. Community Detection
The above population mobility network shows an uneven geographic distribution of population mobility. The southeastern region plays an important role in the population mobility network, with a significantly higher density of population mobility between cities than that in the northwestern region. In the population mobility network, there is strong urban agglomeration in population mobility. Therefore, this section will divide cities into communities and further analyze the phenomenon of population mobility and agglomeration between cities.
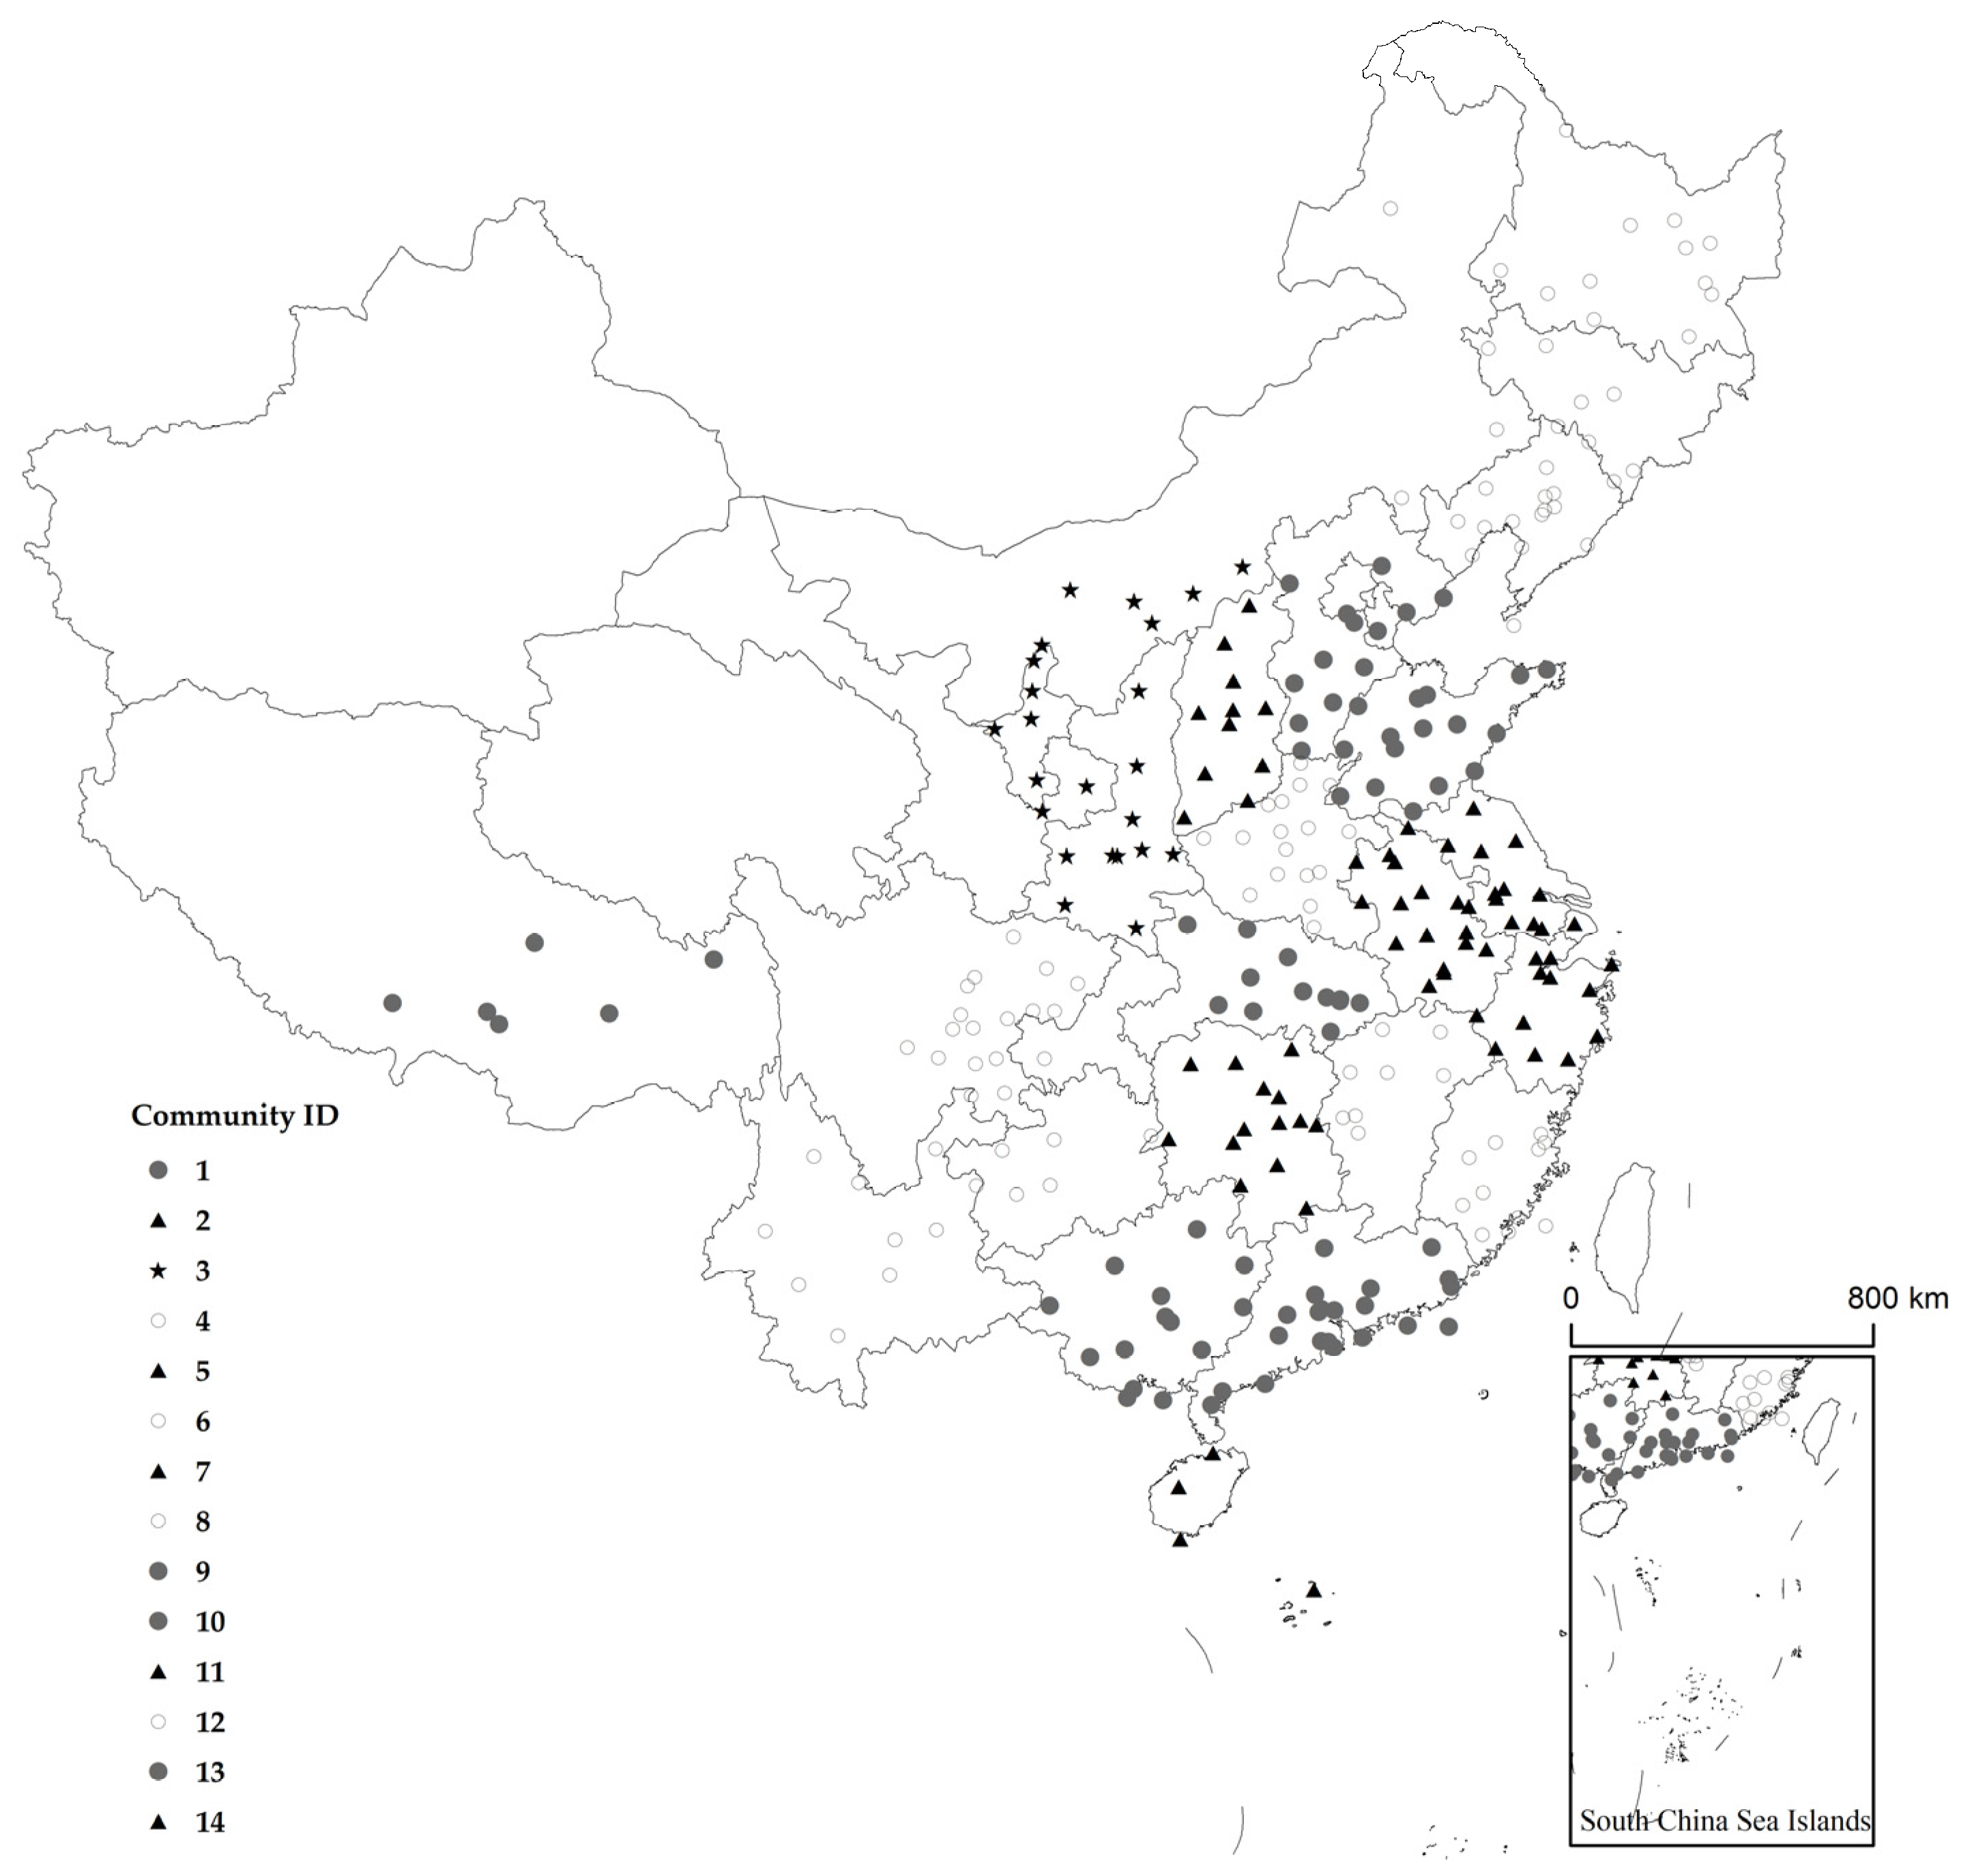
The Louvain algorithm is a modular-based community-partitioning method. This article uses the Louvain algorithm to divide the 297 cities in the population mobility network into 14 communities. The population mobility within these communities is relatively frequent, while the population mobility connections between cities in different communities are weak.
Figure 6 shows the distribution of various communities on the map, using different markers to distinguish cities within different communities.
We abstract the 14 communities into nodes, forming a node set
, add up the edge weights of all nodes within the community and nodes within other communities as the weights of inter-community edges, forming an edge set
, and construct an inter-community population mobility network
based on this. Furthermore, the PageRank values for each community within the inter-community connectivity network are computed to assess the relative importance of these communities within the broader context of population mobility. Communities with higher PageRank values have a stronger ability to gather people. The outcomes of segmenting the population mobility network into distinct communities and subsequently determining their PageRank values are presented in
Table 5. Notably, there exist considerable disparities among the PageRank values of the various communities. The communities with the highest PageRank values predominantly encompass regions situated in Shanxi Province and the Inner Mongolia Autonomous Region, as well as those centered around Beijing, Tianjin, and Hebei Province. Subsequently, communities comprising various prefecture-level cities in Hubei Province also demonstrate significant PageRank values.
According to the geographical distribution of communities shown in
Figure 6 and the importance evaluation results of communities shown in
Table 5, it can be found that in terms of population mobility and accumulation, the urban population mobility network has the following two characteristics.
Firstly, the affiliation of urban communities is highly correlated with their respective provinces. Generally speaking, cities within the same province belong to the same community, which means that the population flow within the province is close, while the mutual flow intensity with cities outside the province is relatively weak. For example, provinces such as Shanxi, Hubei, and Henan have their internal cities separately divided into a community.
Secondly, the division of population mobility between cities is also influenced by geographical location. Different provinces which are geographically adjacent are often grouped into the same community, such as the Beijing, Tianjin, and Hebei provinces, with Beijing as the center, which are grouped into the same community. Although cities located in the same province are generally classified as the same community, there are still exceptions. Pingxiang City, belonging to Jiangxi Province, and cities belonging to Hunan Province are classified as the same community, while other cities in Jiangxi Province and cities in Fujian Province are classified as the same community. The reason for this may be that Pingxiang City is geographically closer to cities in Hunan Province, so its mobility flow with people in Hunan Province is closer. The same applies to Pingliang City and Qingyang City, belonging to Gansu Province.
4.1.3. Importance Evaluation Index of Population Mobility Based on PageRank
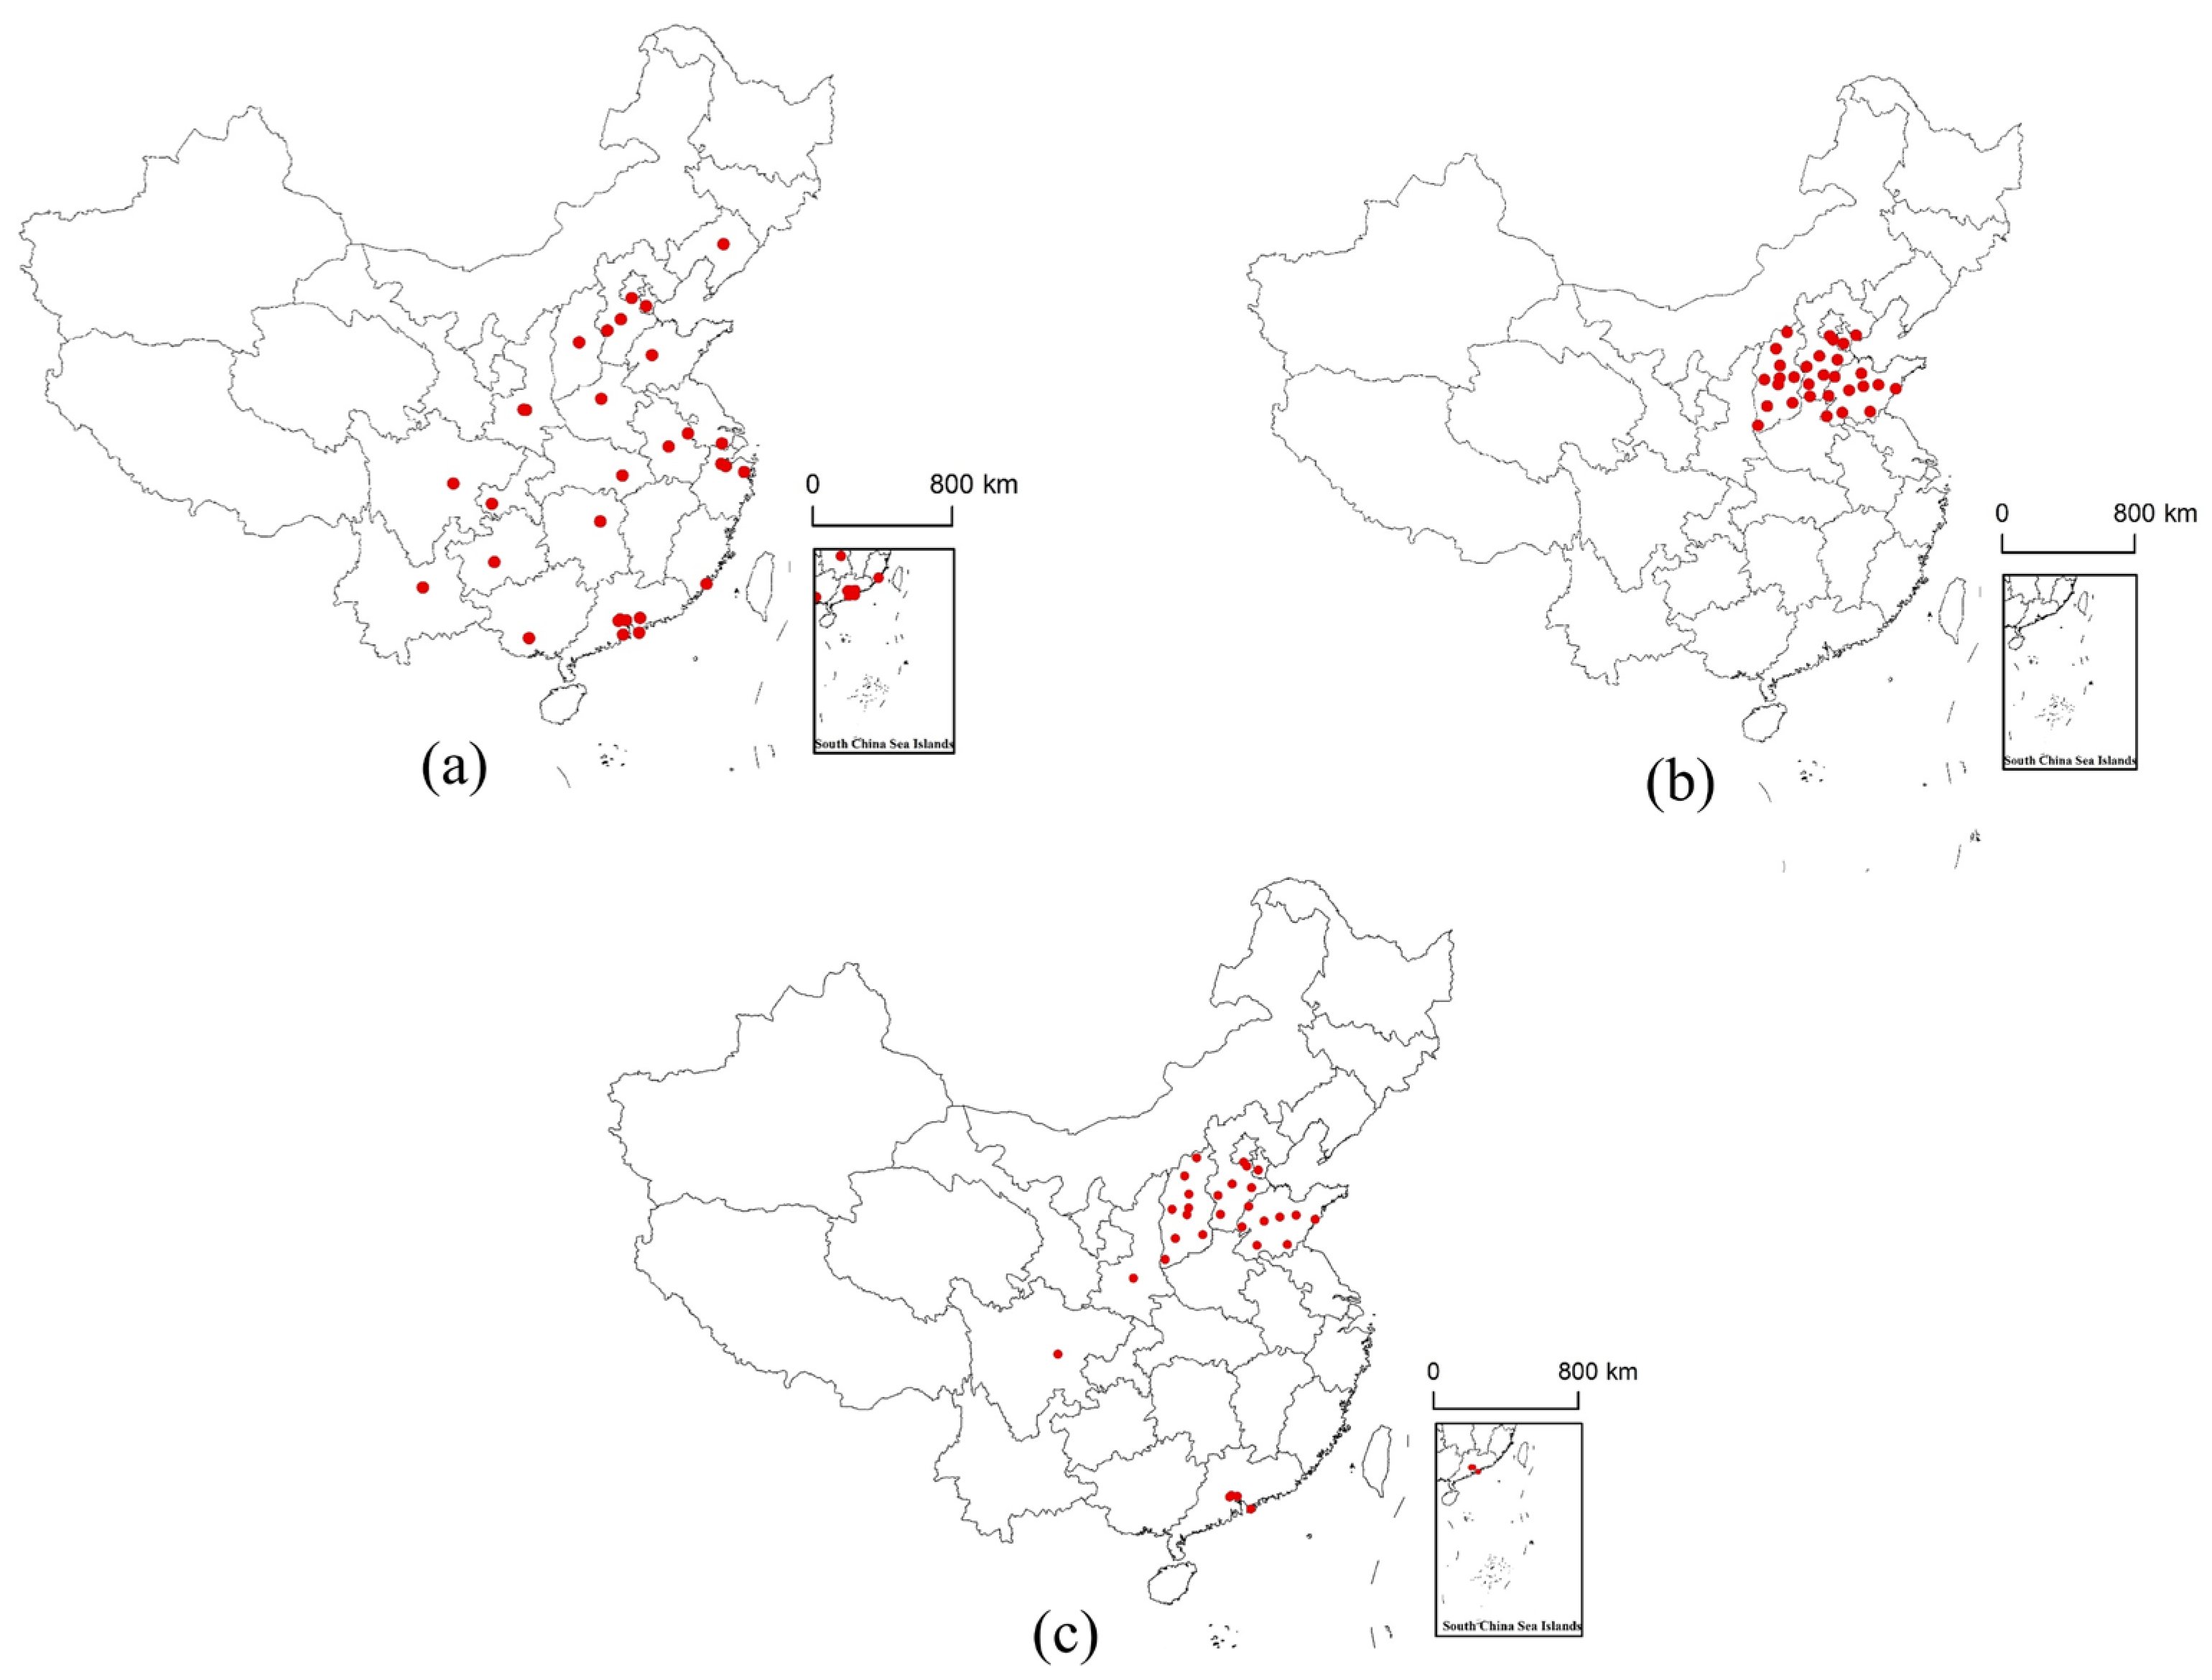
Based on the inter-city population mobility network and urban communities constructed in the previous text, an improved PageRank algorithm is used to measure the importance of urban population mobility.
Figure 7a–c, respectively, reflect the cities ranked 1–30 in population mobility importance when the distribution coefficient β of population mobility intensity is set to 0, 1, and 0.5.
Comparing the three ranking results, it can be found that there is a significant difference in the city importance ranking results obtained by focusing on community connectivity and overall connectivity. When measuring the importance of population mobility in a city based on its overall connectivity, the top-ranked cities are scattered throughout the southeastern side of the Hu Huanyong Line. When focusing on the regional connectivity of cities, the top-ranked cities are concentrated in communities with a high connectivity. Although some cities have a weak connectivity in the entire population mobility network, their affiliated communities have a strong connectivity in the entire network, and the impact of such cities in the population mobility network cannot be ignored.
The above analysis indicates that the population mobility importance index established in this article considers both the importance of cities in the entire network and the importance of cities in community networks, and more comprehensively reflects the characteristics of population mobility in cities.
4.2. Application of CICT Evaluation Model
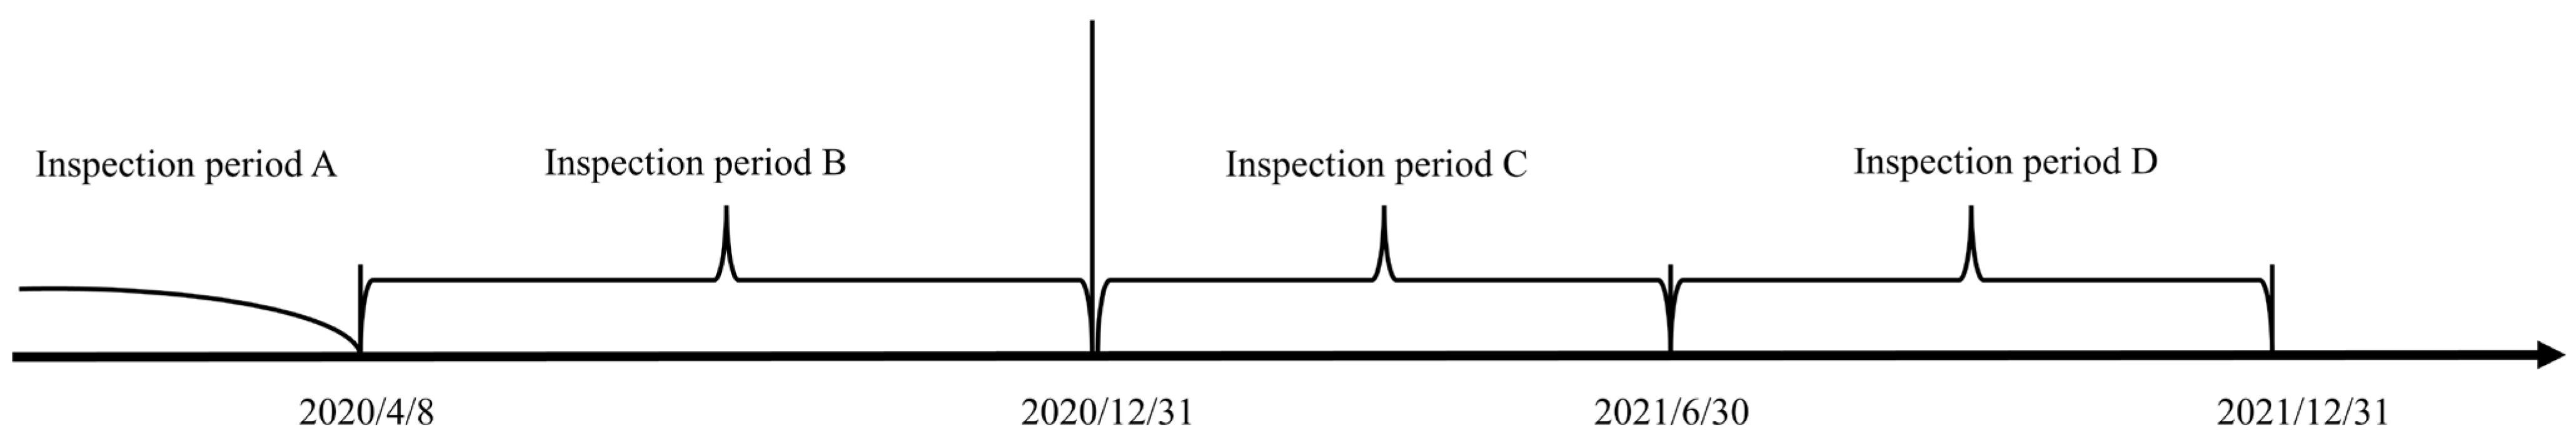
In order to compare the ranking results of city importance in different situations, this article examines four periods. They are, respectively, referred to as inspection period A, inspection period B, inspection period C, and inspection period D, as shown in
Figure 8. The corresponding time periods are before 8 April 2020, from 9 April 2020 to 31 December 2020, from 1 January 2021 to 30 June 2021, and from 1 July 2021 to 31 December 2021. The classification and epidemiological correspondence of different periods are as follows: Inspection period A involves a concentrated outbreak of the epidemic before the lifting of the lockdown in Wuhan. There are no clear milestones for the following three periods, so we separate them by June and December, and the corresponding epidemic situation is as follows. Inspection period B is the national standardized prevention and control period. Inspection period C is the promotion period for vaccination. Inspection period D corresponds to a stage of increasing sporadic cases nationwide. Each period corresponds to different stages of the epidemic curve, which helps to analyze the performance of the model under different prevention and control pressures [
31].
The construction and calculation of a system for the importance of population mobility as an indicator are described in
Section 4.1 of this article. The number of confirmed cases for this indicator is sourced from the Sina News website (
https://news.sina.cn/ (accessed on 29 July 2022)). Other statistical data is sourced from the China Statistical Yearbook 2021 [
32] and the China Statistical Yearbook 2022 [
33], covering a total of 297 prefecture-level cities. The indicators for inspection period A and inspection period B correspond to the data published in the 2021 Statistical Bulletin, while the indicators for inspection period C and inspection period D correspond to the data published in the 2022 Statistical Bulletin.
4.2.1. Construction of Indicator System and Determination of Weights
Firstly, the AHP is adopted to determine the subjective weights of each indicator. Based on expert ratings, the judgment matrix for each level of evaluation indicators is determined as follows:
Taking the first-level indicator as an example, the maximum eigenvalue of the judgment matrix can be calculated as 4.1076, and the consistency indicator can be obtained. Looking up the table, the fourth-order average random consistency indicator can be obtained. The consistency ratio is less than 0.1, which passes the consistency test. The weight vector of the first level indicator can be obtained as .
Similarly, by performing similar calculations on the judgment matrix , , , and , the weight vectors of the secondary indicators are obtained as follows: , , and .
Based on the above, the hierarchical weight table is obtained, as shown in
Table 6.
Then, employing the improved entropy weight method delineated in
Section 2 and leveraging the data from the four inspection periods, the weights for each indicator are computed, as presented in
Table 7. This refined entropy weight method integrates the subjective expertise of professionals to better reflect the comprehensive weighting of confirmed cases within the community and the broader network. It effectively addresses the issue of significant discrepancies in weight distribution inherent to traditional entropy weight methodologies.
4.2.2. Results of CICT Evaluation Model
The CICT evaluation model was used to assess the importance of each city during the four study periods determined in the previous section, and the comprehensive evaluation values of cities ranked 1–30 in importance during each inspection period were obtained, as shown in
Figure 9.
Figure 9a–d, respectively, show the comprehensive evaluation values of cities ranked 1–30 in importance during the inspection periods A, B, C, and D. The locations of these cities on the map are shown in
Figure 10, where
Figure 10a–d correspond to the four inspection periods of A, B, C, and D, respectively, and correspond one-to-one with
Figure 9a–d.
Analyzing the ranking results of city importance, the following conclusions can be drawn:
- (1)
The number of confirmed cases has the greatest impact on the comprehensive evaluation of the importance of cities. During the four inspection periods, the comprehensive evaluation value of cities with a large number of confirmed cases is significantly higher than that in other cities such as Wuhan during inspection period A, Shanghai during inspection period B, and Urumqi during inspection period B. The reason for this is that the AHP gives a greater weight to confirmed cases. Due to the regional spread of infectious diseases, the number of confirmed cases varies greatly among cities. Therefore, the weight of confirmed cases calculated using the entropy weight method is also relatively large, resulting in a large proportion of confirmed cases in the final result. This indicates that the city importance evaluation results obtained by relying on the CICT evaluation model proposed in this article not only depend on the attributes of the city itself, but are also closely related to the relative indicator values of the city in the overall network.
- (2)
The number of confirmed cases is an important evaluation indicator, but it is not the only decisive indicator. In addition to the number of confirmed cases, the weights of the number of hospital beds and practicing (assistant) physicians calculated using the AHP and entropy weight method are relatively high. This indicates that there are significant differences in the medical levels between cities, and medical level is an important indicator for evaluating the importance of cities.
- (3)
The CICT evaluation model not only considers the epidemic situation of infectious diseases in cities, but also incorporates the economic level, medical level, and population situation of cities into the comprehensive evaluation system and conducts multidimensional assessments of cities not limited to the current number of cases. For example, during inspection period A, the number of confirmed cases in Suzhou is much smaller than that in Huanggang City, and during inspection period B, the number of confirmed cases in Shanghai is smaller than that in Urumqi City. However, due to their central position in the population flow network and high economic importance, Suzhou and Shanghai are easily affected by the spread of infectious diseases in other cities, resulting in serious impacts. Therefore, their comprehensive evaluation values are ahead of those of Wenzhou and Urumqi, and they are key epidemic prevention cities during the corresponding inspection period. This can indicate that by using the CICT evaluation model proposed in this article, decision makers can not only take measures for key cities affected by the epidemic, but also consider the various aspects of a city’s influence when conducting urban importance assessments, making the evaluation dimensions more comprehensive.
- (4)
Through comprehensive observation of the cities ranked 1–30 in importance during the four inspection periods, it is found that some cities such as Beijing, Shanghai, Guangzhou, Chongqing, etc., are consistently at the forefront of the rankings. For example, during inspection period C, although the number of confirmed cases in Chongqing is very low, the analysis results show that decision makers need to focus on prevention and control in Chongqing. The reason for this is that cities like this have an important economic position and are distribution centers in the population flow network. When an infectious disease outbreak occurs, it is important to pay close attention to these cities, regardless of whether there are cases.
5. Conclusions
This article took precise prevention and control as the core idea and combined population mobility networks and the PageRank algorithm to construct a comprehensive evaluation index system for urban importance. Then, the improved entropy weight method and AHP were used to weight the evaluation indicators, and a city epidemic prevention importance evaluation model based on TOPSIS was established. The evaluation model was simulated using statistical data from Chinese cities. The simulation results showed the following: (1) The improved entropy weight method showed that the influence of each indicator on the evaluation target varied in different investigation periods, but the entropy weight values of confirmed cases, hospital beds, and practicing (assistant) physicians always maintained a high level, indicating that these three indicators are important factors affecting the evaluation of the importance of urban epidemic prevention. (2) The evaluation results obtained by approaching the ideal solution ranking method indicated that there were significant differences in the importance of epidemic prevention among different cities in China during outbreaks of infectious diseases. Cities with a large number of confirmed cases always ranked high in the comprehensive evaluation and require key management during outbreaks of infectious diseases. (3) Beijing, Shanghai, Guangzhou, and other cities have an important position in China due to their economic level or population agglomeration ability, and were key cities for prevention and control during all inspection periods.
Based on the above research, the innovative value of this article lies in the following: (1) We introduced the PageRank algorithm from computer science into public health evaluation, quantifying the transmission risk of population mobility hubs through community division. The PageRank value of Beijing in the population mobility network is 3–5 times higher than that of ordinary cities, which confirms the ability of this indicator to identify hub cities. (2) The improved entropy weight method effectively solves the problem of significant weight differences when the entropy value approaches one by integrating with the AHP. (3) The proposed CICT model combines multiple methods and takes into account various factors that may affect the spread of infectious diseases, including the number of confirmed cases, economic level, population mobility, and medical level. It can comprehensively evaluate the importance of cities in infectious disease prevention and control and identify key cities with potential outbreak risks.
This article has certain theoretical and practical significance for the development of infectious disease prevention and control work. Based on the above research results, policy recommendations are proposed to promote the transformation of infectious disease prevention and control work from comprehensive prevention and control to precise prevention and control. Firstly, when carrying out epidemic prevention and control work, the health management department should evaluate the importance of cities based on subjective experience and objective data and comprehensively consider various indicators. Among them, the number of confirmed cases and medical level should be important considerations for decision makers. Secondly, for cities with high economic levels and strong population aggregation capabilities, relevant management departments should treat them as normalized epidemic prevention areas to efficiently respond to sudden outbreaks of infectious diseases.
The CICT model proposed in this article is mainly based on population migration data, medical data, and economic data. The medical data used in the model, such as the number of beds and hospitals, is mainly used to describe and measure the level of medical care, and its correlation with the medical system is relatively weak. Therefore, the CICT model proposed in this article has applicability in countries with different healthcare systems. Economic and medical data are publicly available in most countries. But for countries with data collection barriers, there may be a lack of real-time population mobility data, which cannot meet the model’s demand for real-time data. In this case, traffic flow data can be used as a substitute to fit the trend of population mobility through models such as logistic regression. In addition, in countries with dispersed healthcare systems, there may be data fragmentation, and weight allocation can be adjusted to reflect regional autonomy characteristics.
In summary, the evaluation model proposed in this article achieved good results in application, but there are still some shortcomings that require further analysis. Some indicators have a correlation, and including them all in the scope of investigation will have an impact on the effectiveness of urban importance evaluation. Extracting the main influencing factors to improve evaluation efficiency is the next research content. There are shortcomings in the construction of this comprehensive evaluation index system for urban importance. Due to the complex measurement methods for some indicators and the lack of unified industry standards, they have not been included in the index system. Management departments and scholars need to jointly conduct research and establish a scientific and comprehensive index system.


